a chartbook of international labor comparisons, june 2007
TRANSCRIPT

A A CCHARTBOOK OFHARTBOOK OF
IINTERNATIONALNTERNATIONAL LLABOR ABOR CCOMPARISONS:OMPARISONS:
THE THE AAMERICAS MERICAS AASIASIA--PPACIFIC ACIFIC EEUROPEUROPE
U.S. DEPARTMENT OF LABOR JUNE 2007

Material contained in this
document is in the public domain and may be reproduced, fully or partially, without permission of the Federal Government.
Source credit is requested.
This document is updated each January and June and is available on the Internet at: http://www.dol.gov/asp/welcome.html.

A A CCHARTBOOK OFHARTBOOK OF
IINTERNATIONALNTERNATIONAL LLABOR ABOR CCOMPARISONS:OMPARISONS:
THE THE AAMERICAS MERICAS AASIASIA--PPACIFICACIFIC EEUROPEUROPE
U.S. DEPARTMENT OF LABOR JUNE 2007

FOREWORDAll countries are unique and their cultures, histories, economies, and the challenges they face can be very different. Yet despite these differences, the economies of the world are becoming increasingly interrelated as technology and world trade grow. As a result, local economies are increasingly affected by changes in worldwide markets.
For the United States to continue to succeed in the global economy and create more jobs at home, it is important to understand the economic relationships that are transforming the world. U.S. workers have long enjoyed one of the highest standards of living in the world—thanks to technology, the flexibility of our workforce, and the remarkable productivity of
our workers. To preserve these advantages, it is critical that U.S. workers have the skills necessary to compete in the worldwide economy of the 21st century.
By understanding how the United States compares with other advanced and emerging economies, our nation will be better prepared to take the steps necessary to ensure that our workforce and our economy continue to thrive and prosper. Therefore, this Chartbook of International Labor Comparisons
provides a comparative labor market perspective—including employment levels, jobless rates, hours worked, labor costs, and productivity trends.
As the charts reveal, the United States leads in some areas. In other cases, our trading partners have made great progress. This information provides a snapshot of where the United States stands today in relation to key economies of the rest of the world. It can assist policy and decision makers in charting
a course that will help prepare our nation’s workforce for the challenges of tomorrow. I hope you find this Chartbook both relevant and informative.
Elaine L. ChaoSecretary of Labor
ii | Foreword

PREFACE
Preface| iii
This chartbook focuses on the labor market situation in selected countries in the 1995-2005 period. Each chart in sections 1 through 4 includes countries in North America (the United States, Canada, and Mexico) and selected Asian-Pacific and European countries. Weighted aggregates for 15 European Union countries (EU-15) are shown on most charts. These represent European Union member countries prior to the expansion of the European Union to 25 countries on May 1, 2004 and to 27 countries on January 1, 2007. The EU-15 countries are Austria, Belgium, Denmark, Finland, France, Germany, Greece, Ireland, Italy, Luxembourg, the Netherlands, Portugal, Spain, Sweden, and the United Kingdom. Due to the lack of suitable data, some of the countries do not appear on all charts. It should be noted that the selected countries are not representative of all of Europe and the Asian-Pacific region; rather, they tend to be the more industrialized economies in these regions. In the final section, several indicators are presented for five large emerging economies: Brazil, China, India, Indonesia, and the Russian Federation. The appendix describes the definitions, sources, and methods used to compile the data in the chartbook. For some series, the appendix provides cautions about the exact comparability of the measures.
Section 1, on Gross Domestic Product (GDP) per capita, shows charts that portray overall measures of comparative living standards. Section 2 highlights the state of the labor market by comparing major labor force, employment, and unemployment indicators. Section 3 examines the competitive position of the United States in the global marketplace by comparing hourly compensation costs in manufacturing, trends in manufacturing labor productivity and unit labor costs, and manufacturing output as a percent of world manufacturing output. Section 4 includes charts that compare public expenditures on labor market programs, regulation measures on labor and product markets, taxes on labor, and
foreign trade in goods. Section 5 presents eight charts on various topics for the large emerging economies.
The charts are color coded as follows: North American countries areblue, Asian-Pacific countries are red, and European countries are yellow. A different color scheme is used, however, when there is morethan one chart-bar per country, and additional colors are used for theemerging economies charts in section 5.
The chartbook was a cooperative effort of three agencies in the Department of Labor: the Bureau of International Labor Affairs (ILAB),the Office of the Assistant Secretary for Policy (OASP), and the Bureauof Labor Statistics (BLS). Since 1960, BLS has adjusted selected labor market data of foreign countries to improve their comparability with U.S.data. The chartbook is representative of the main output of the BLSprogram of international labor comparisons. In order to increase countryand indicator coverage, BLS data are supplemented by data from the Organization for Economic Cooperation and Development (OECD) andother international organizations.
A team led by Marie-Claire Sodergren of the BLS Division of Foreign Labor Statistics (DFLS) in cooperation with Gregory Schoepfle, Kenneth Swinnerton, and Rebecca Dillender of the ILAB Division of Economic and Labor Research and Lisa Stuart of OASP prepared the chartbook.The following persons comprised the BLS team: Apinait Amranand, Rich Esposito, Susan Fleck, Mubarka Haq, Erin Lett, Wolodar Lysko, Gary Martin, Jennifer Raynor, and Chris Sparks. Constance Sorrentino, Chief of DFLS, and Ronald Bird and Stephanie Swirsky of OASPprovided overall guidance.
CONTENTS
iv | Contents
Section 1. Gross Domestic Product Per Capita 1
1.1 Gross Domestic Product (GDP) per capita, 2005 2
1.2 Average annual growth rates for real GDP per capita, 1995-2005
3
Section 2. Labor Market Indicators 5
2.1 Size of the labor force, 2005 6
2.2 Average annual growth rates for the labor force, 1995-2005 7
2.3 Labor force participation rates by sex, 2005 8
2.4 Labor force participation rates for youth, 2005 9
2.5 Labor force participation rates for older workers, 2005 10
2.6 Employment as a percent of the working-age population, 2005 11
2.7 Average annual growth rates for employment, 1995-2005 12
2.8 Average annual growth rates for full-time and part-time employment, 1995-2005 13
2.9 Annual hours worked per employed person, 1995 and 2005 14
2.10 Unemployment rates, 2005 15
2.11 Unemployment rates for youth, 2005 16
2.12 Ratio of youth to adult unemployment rates, 2005 17
2.13 Persons unemployed one year or longer, 2005 18
2.14 Ratio of unemployment rate of persons without high school degrees to that of persons with college or university degrees, 2004 19
2.15 Educational attainment of the adult population, 2004 20
Section 3. Competitiveness Indicators for Manufacturing 21
3.1 Hourly compensation costs, 2005 22
3.2 Average annual growth rates for hourly compensation costs, 1995-2005 23
3.3 Employer social insurance expenditures and other labor taxes as a percent of hourly compensation costs, 2005 24
3.4 Average annual growth rates for manufacturing productivity, 1995-2005 25
3.5 Average annual growth rates for manufacturing output and hours worked, 1995-2005 26
3.6 Average annual growth rates for manufacturing unit labor costs, 1995-2005 27
3.7 Manufacturing output as a percent of world manufacturing output, 2005 28
Section 4. Other Economic Indicators 29
4.1 Public expenditures on labor market programs as a percent of GDP, 2004-05 30
4.2 Measures of regulation on labor and product markets, 2003 31
4.3 Share of labor costs taken by tax and social security contributions, 2005 32
4.4 Dependency ratios, 2005 and projections to 2025 33
4.5 Trade in goods as a percent of GDP, 2005 34
Contents | v
Section 5. Indicators for Large Emerging Economies 35
5.1 World population distribution, 2005 36
5.2 Age composition of the population, 2005 37
5.3 Dependency ratios, 2005 and projections to 2025 38
5.4 GDP per capita, 2005 39
5.5 GDP per employed person, 1995 and 2004 40
5.6 Labor force participation rates by sex, 2005 41
5.7 Trade in goods as a percent of GDP, 2005 42
5.8 Manufacturing output as a percent of world manufacturing output, 2005 43
Appendix. Definitions, Sources, and Methods A1


GrossDomestic
ProductPer Capita
Gross Domestic Product Per Capita | 1
SECTION 1
Gross Domestic Product (GDP) per capita, when converted to U.S. dollars using Purchasing Power Parities (PPPs), is the most widely used income measure for international comparisons of living standards. It should be recognized that income measures do not capture a number of variables affecting economic well-being, such as leisure time, health, safety, and cultural resources.
PPPs
are the number of foreign currency units required to buy goods and services in a foreign country equivalent to what can be bought with one dollar in the United States. These are used to equalize the purchasing power of different currencies. PPPs
are used instead of exchange rates because market exchange rates do not necessarily reflect the relative purchasing power of different currencies.
Charts 1.1 and 1.2 compare the level of GDP per capita in 2005 and the trend from 1995 to 2005 in 21 of the 22 economies shown on various charts in this chartbook. Data for the EU-15 are also included. Data were not available for charting GDP per
capita for Taiwan.

32.2
42.1
34.0
10.2
32.0 30.9 31.0
21.9 22.5
29.9 29.7
33.8 34.4
30.2 29.8
40.9
25.5
34.1
43.2
20.1
26.1
32.7
0
10
20
30
40
50
U.S.
Canad
a
Mex
icoAus
tralia
Hong
Kong S
AR
Japa
nKor
ea, R
ep. o
fNew
Zea
land
Singap
ore
EU-15
Austria
Denmar
kFr
ance
Germ
any
Irelan
d
Italy
Nether
lands
Norway
Portug
al
Spain
Sweden
U.K.
NOTE: Hong Kong SAR stands for Hong Kong Special Administrative Region of China. Purchasing Power Parity (PPP) is the number of foreign currency units required to buy goods and services in a foreign country equivalent to what can be bought with one dollar in the United States.
SOURCE: Bureau of Labor Statistics and World Bank.
Gross Domestic Product (GDP) per capita, 2005 converted at PPP rates
2 | Gross Domestic Product Per Capita
Thousands of U.S. dollars
Norway, the United States, and Ireland were the countries with the highest GDP per capita among the 21 economies compared.
The other economies showed levels of GDP per capita between 82 percent (Denmark) and 24 percent (Mexico) of the U.S. level.
CHART 1.1

NOTE: Hong Kong SAR stands for Hong Kong Special Administrative Region of China.
SOURCE: Bureau of Labor Statistics, including special tabulations using data from the Organization for Economic Cooperation and Development, World Bank, and national sources.
2.2 2.3 2.22.5
2.8
1.1
3.7
1.9
2.9
1.8 1.9 1.7 1.61.3
6.3
0.9
1.72.2
1.6
2.7 2.5 2.5
0
2
4
6
8
U.S.
Canad
aMex
icoAus
tralia
Hong K
ong S
ARJa
pan
Korea,
Rep. o
fNew
Zeala
ndSing
apore
EU-15Aus
triaDen
markFr
ance
German
yIre
land
Italy
Netherl
ands
Norway
Portug
alSpa
inSwed
en U.K.
Average annual growth rates for real GDP per capita, 1995-2005
Gross Domestic Product Per Capita | 3
CHART 1.2
In most of the 21 economies, real GDP per capita grew during the decade at a rate of 1.6 to 2.8 percent per year; the U.S. growth rate was in the middle of the range.
Ireland and the Republic of Korea registered the greatest increases in real GDP per capita; Italy and Japan had the smallest increases.
Percent


Labor MarketIndicators
Labor Market Indicators | 5
SECTION 2
Charts 2.1 through 2.15 show comparisons of the labor force, employment, unemployment, and related indicators. The size of the labor force is shown in chart 2.1. Labor force growth (chart 2.2) sums up changes in both employment and unemployment over the period. Labor force participation rates (charts 2.3-2.5) express the extent to which different groups are either working or unemployed. Here comparisons are shown by sex and for four selected age groups relating to youth and older
workers.
Employment and unemployment are key indicators of the functioning of labor markets both within and among countries. Charts 2.6-2.9 compare the proportion of the working-age population employed, employment growth rates, trends in full-
time and part-time employment, and annual hours worked per employed person. Charts 2.10-2.15 explore unemployment rates, long-duration unemployment, and the connection between unemployment rates and levels of education.
All charts cover 19 or 20 countries. In addition, the EU-15 is shown on all but three of the charts. Comparative labor market indicators were not available for Taiwan or Hong Kong SAR, and some indicators were not available for Singapore.
30.1
4.7
20.8
5.52.48.3
24.2
2.0
40.827.1
2.84.0
181.9
2.22.2
23.7
65.9
10.5
42.5
17.1
149.3
0
40
80
120
160
200
U.S.Can
adaMex
icoAus
tralia
Japa
nKore
a, Rep
. of
New Zeala
ndSinga
poreEU-15Aus
triaDen
markFranc
eGerm
any
Irelan
d
Italy
Netherl
ands
Norway
Portug
alSpa
inSwed
en
U.K.
Millions
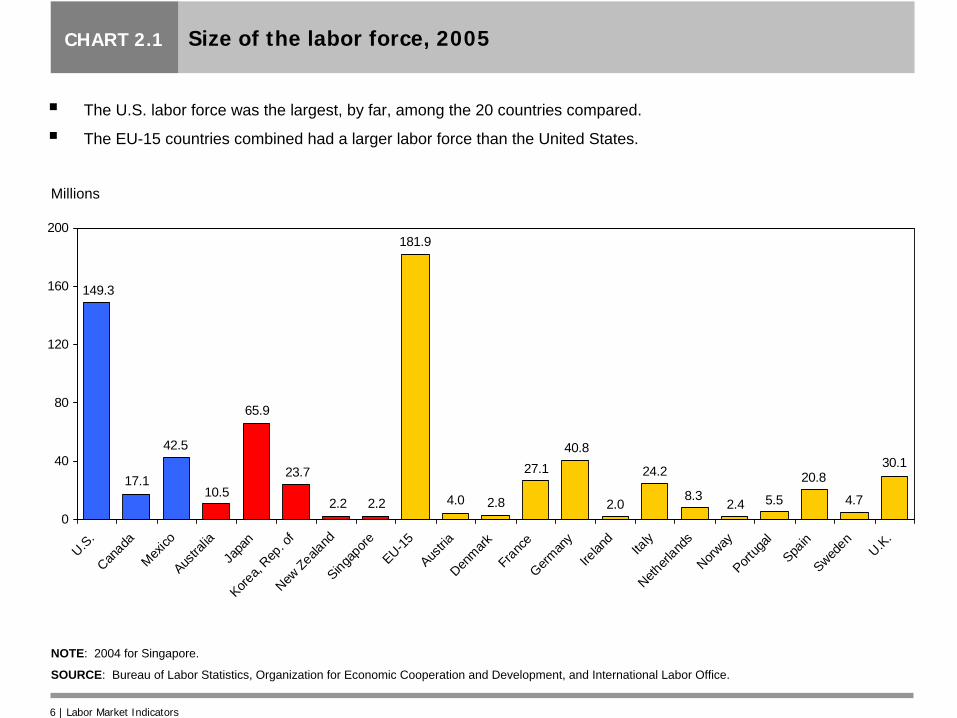
Size of the labor force, 2005
6 | Labor Market Indicators
CHART 2.1
The U.S. labor force was the largest, by far, among the 20 countries compared.
The EU-15 countries combined had a larger labor force than the United States.
NOTE: 2004 for Singapore.
SOURCE: Bureau of Labor Statistics, Organization for Economic Cooperation and Development, and International Labor Office.

0.70.5
2.5
1.6
1.01.2
0.7
3.3
0.4
0.9
0.30.4
0.9
2.7
1.8
1.3
0.0
1.6
2.0
1.7
1.2
0
1
2
3
4
U.S.Can
adaMex
icoAus
tralia
Japa
nKore
a, Rep
. of
New Zeala
ndSinga
poreEU-15Aus
triaDen
markFra
nce
German
yIre
land
Italy
Netherl
ands
Norway
Portug
alSpa
inSwed
en
U.K.
Percent
Average annual growth rates for the labor force, 1995-2005
Labor Market Indicators | 7
CHART 2.2
The other North American countries and the Asian-Pacific countries, except for Japan, recorded higher labor forcegrowth rates than the United States.
U.S. labor force growth outpaced that of the EU-15 average; in Europe, labor force growth was stronger in Ireland, Spain, and Portugal than in the United States.
NOTE: 1995-2004 for Singapore.
SOURCE: Bureau of Labor Statistics, Organization for Economic Cooperation and Development, and International Labor Office.

70.569.367.469.269.471.0
60.6
71.6
65.562.7
70.366.164.7
76.274.371.3
73.173.0
78.9
72.873.3
56.260.6
55.6
45.5
61.459.3
40.7
58.1
47.750.3
60.154.9
48.7 51.0
60.3
50.3 51.4
37.9
56.159.8
51.0
0
20
40
60
80
100
U.S.Can
adaMex
icoAus
tralia
Japa
nKore
a, Rep
. of
New Zeala
ndSinga
poreEU-15Aus
triaDen
markFranc
eGerm
any
Irelan
d
Italy
Netherl
ands
Norway
Portug
alSpa
inSwed
en
U.K.
Men Women
Labor force participation rates by sex, 2005
Across countries, women’s labor force participation rates varied more than men’s rates. In Canada, the Scandinavian countries, New Zealand, and Australia, women participated in the labor force at about the same high rate as U.S. women. Italian and Mexican women had the lowest participation rates.
Participation rates for men were at least 70 percent in 12 out of 21 countries; the lowest rates for men were found in Italy and France.
8 | Labor Market Indicators
Percent
CHART 2.3
NOTE: 2004 for Singapore.
SOURCE: Bureau of Labor Statistics, Organization for Economic Cooperation and Development, and International Labor Office.
43.753.4
35.5
60.6
16.3 9.1
54.4
28.742.3
58.5
12.230.2 25.4
12.8
57.045.8
17.828.9 36.7
56.5
0
25
50
75
100
U.S.
Canad
aMex
icoAus
tralia
Japa
nKore
a, Rep
. of
New Z
ealan
d
EU-15
Austria
Denmark
Fran
ceGer
many
Irelan
d
Italy
Netherl
ands
Norway
Portug
al
Spain
Sweden
U.K.
Participation rates for teenagersPercent
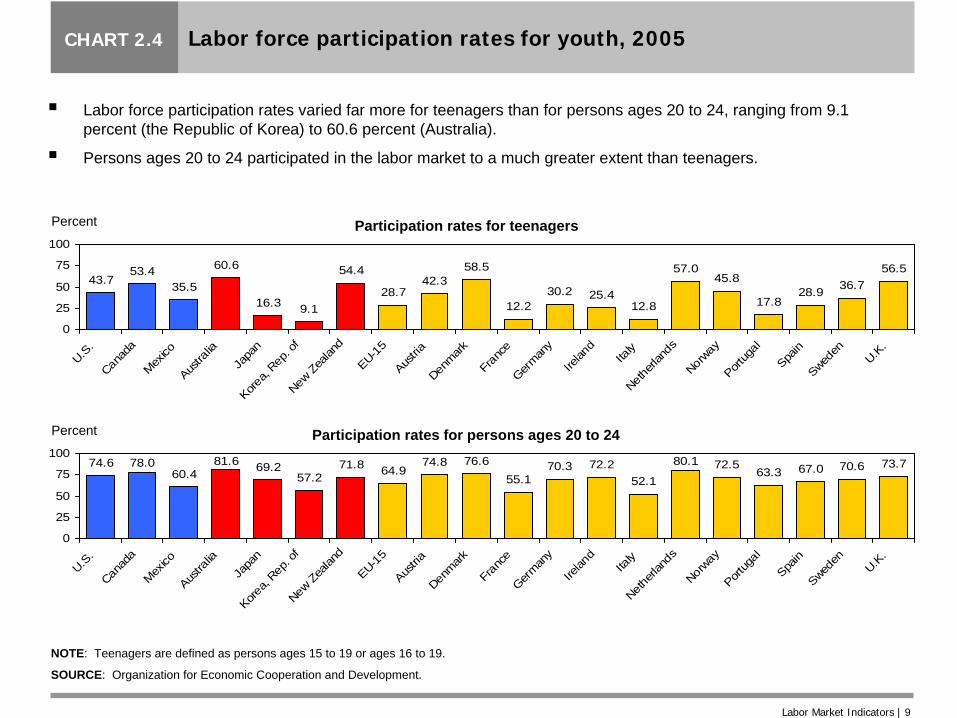
NOTE: Teenagers are defined as persons ages 15 to 19 or ages 16 to 19.
SOURCE: Organization for Economic Cooperation and Development.
Labor force participation rates for youth, 2005
Labor Market Indicators | 9
CHART 2.4
Labor force participation rates varied far more for teenagers than for persons ages 20 to 24, ranging from 9.1 percent (the Republic of Korea) to 60.6 percent (Australia).
Persons ages 20 to 24 participated in the labor market to a much greater extent than teenagers.
74.660.4 69.2
57.271.8 64.9
74.8 76.655.1
70.3 72.252.1
72.563.3 67.0 70.6 73.780.181.678.0
0
25
50
75
100
U.S.
Canad
aMex
icoAus
tralia
Japa
nKore
a, Rep
. of
New Z
ealan
d
EU-15
Austria
Denmark
Fran
ceGer
many
Irelan
d
Italy
Netherl
ands
Norway
Portug
al
Spain
Sweden
U.K.
Participation rates for persons ages 20 to 24Percent

62.9 57.9 53.6 55.566.6 60.2
71.0
47.633.0
62.943.6
52.1 53.232.6
47.068.8
53.8 45.9
72.858.4
0
25
50
75
100
U.S.
Canada
Mexico
Austra
lia
Japa
nKore
a, Rep.
ofNew Zea
land
EU-15Aus
triaDenm
arkFranc
eGerm
any
Irelan
d
Italy
Netherlan
dsNorw
ayPort
ugal
Spain
Sweden U.K
.
Participation rates for persons ages 55 to 64 Percent
SOURCE: Organization for Economic Cooperation and Development.
Labor force participation rates for older workers, 2005
10 | Labor Market Indicators
CHART 2.5
Persons ages 55 to 64 participated in the labor market far less in Italy and Austria than in the remaining countries.
Participation rates for persons ages 65 and over varied widely from 1.3 percent (France) to 30.0 percent (the Republic of Korea); the U.S. rate of 15.1 percent was four times higher than the EU-15 average.
15.1 8.129.2
7.619.8
30.011.7 3.8 3.0 5.4 1.3 3.4 8.3 3.1 4.3
14.3 18.02.0 10.1 6.4
0
25
50
75
100
U.S.
Canada
Mexico
Austra
lia
Japa
nKore
a, Rep.
ofNew Zea
land
EU-15Aus
triaDenm
arkFranc
eGerm
any
Irelan
d
Italy
Netherlan
dsNorw
ayPort
ugal
Spain
Sweden U.K
.
Participation rates for persons ages 65 and overPercent
60.059.951.0
57.361.560.1
44.9
58.851.251.0
61.955.251.7
61.864.658.557.3
62.156.6
63.462.7
0
20
40
60
80
100
U.S.
Canad
aMex
icoAus
tralia
Japa
nKore
a, Rep
. of
New Ze
aland
Singap
oreEU-15Aus
triaDen
markFr
ance
German
yIre
land
Italy
Netherl
ands
Norway
Portug
alSpa
inSwed
en U.K.
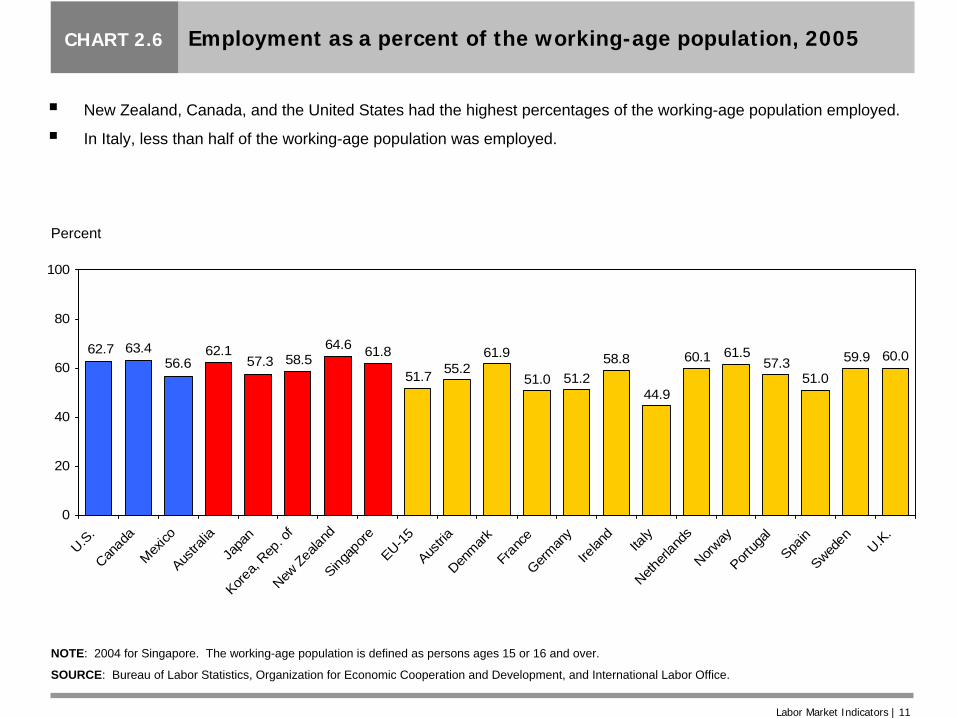
NOTE: 2004 for Singapore. The working-age population is defined as persons ages 15 or 16 and over.
SOURCE: Bureau of Labor Statistics, Organization for Economic Cooperation and Development, and International Labor Office.
Employment as a percent of the working-age population, 2005
Labor Market Indicators | 11
Percent
CHART 2.6
New Zealand, Canada, and the United States had the highest percentages of the working-age population employed.
In Italy, less than half of the working-age population was employed.

1.3
2.02.2
1.9
-0.2
1.1
2.02.4
1.2
0.20.5
1.1
0.1
4.2
1.11.4
1.1
1.5
4.2
0.71.1
-1
0
1
2
3
4
5
U.S.
Canad
aMex
icoAus
tralia
Japa
nKore
a, Rep
. of
New Ze
aland
Singap
oreEU-15Aus
triaDen
markFr
ance
German
yIre
land
Italy
Netherl
ands
Norway
Portug
alSpa
inSwed
en U.K.
Percent
Average annual growth rates for employment, 1995-2005
12 | Labor Market Indicators
CHART 2.7
Ireland and Spain had the highest growth rates in employment. Employment declined only in Japan.
U.S. employment growth outpaced that of 8 of the 12 European countries; the remaining countries recorded higher employment growth than the United States, except for Japan and the Republic of Korea.
NOTE: 1995-2004 for Singapore.
SOURCE: Bureau of Labor Statistics, Organization for Economic Cooperation and Development, and International Labor Office.

NOTE: 1995-2004 for Mexico. Full-time employment is defined as persons usually working over 30 hours per week in their main job. U.S. data refer to wage and salary workers only. Data for other countries refer to total employment, which includes wage and salary workers, self-employed persons, and unpaid family workers.
SOURCE: Organization for Economic Cooperation and Development.
0.9
9.5
-0.5
1.31.5
2.02.8
1.6
-1.0
0.6
1.90.8
-0.4
0.41.0
-0.8
3.8
0.7 0.9 1.1 1.3
3.7
0.6
1.7
0.5
2.8
1.52.3
8.7
2.43.1
4.1
1.10.5
4.5
7.1
4.63.8
0.7
2.7
-3
-1
1
3
5
7
9
11
U.S.Can
ada
Mexico
Austra
lia
Japa
nKore
a, Rep
. of
New Zeala
nd
EU-15
Austria
Denmark
France
German
y
Irelan
d
Italy
Netherl
ands
Norway
Portug
al
Spain
Sweden
U.K.
Full-time Part-time
Average annual growth rates for full-time and part-time employment, 1995-2005
Labor Market Indicators | 13
Percent
CHART 2.8
Full-time employment grew faster than part-time employment in six countries, including the United States. In the majority of countries, part-time employment was the main or sole source of employment growth.
Full-time employment growth was strongest in Ireland and Spain, both of which also had rapid growth in part-time employment.
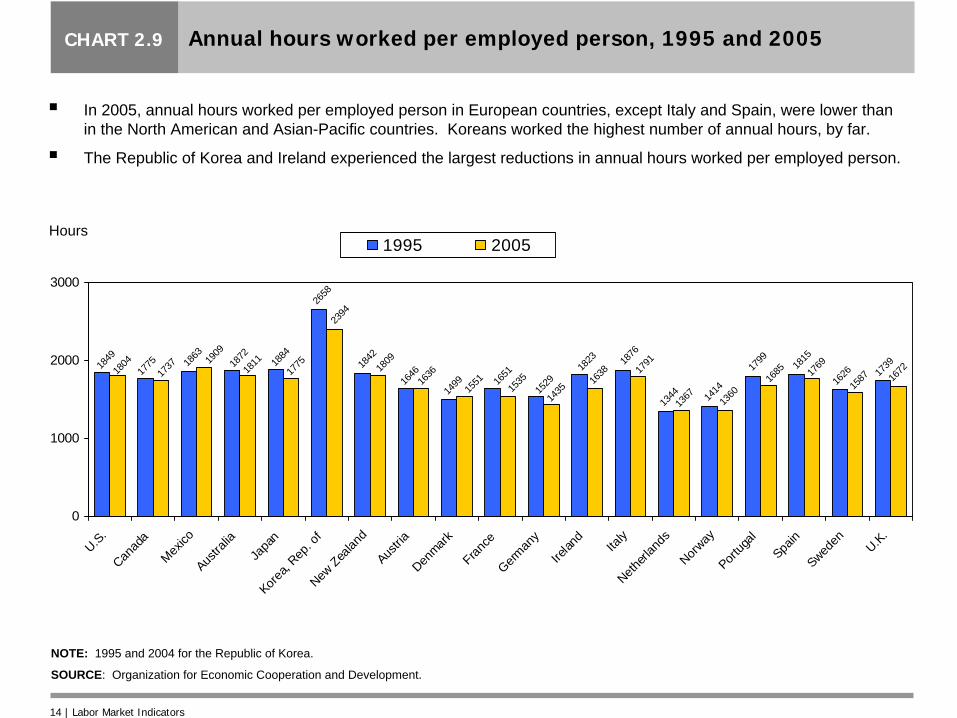
NOTE: 1995 and 2004 for the Republic of Korea.
SOURCE: Organization for Economic Cooperation and Development.
Annual hours worked per employed person, 1995 and 2005
1849
1775 18
63
1872
1884
2658
1842
1646
1499 16
51
1529
1823 18
76
1344 14
14
1799 1815
1626 17
39
1435
1638 17
91
1367 1360
1685 17
69
1587 16
72
1535
155116
36180919
09
1811
1775
17371804
2394
0
1000
2000
3000
U.S.Can
ada
Mexico
Austra
lia
Japa
nKore
a, Rep
. of
New Zea
land
Austria
Denmark
France
German
y
Irelan
d
Italy
Netherl
ands
Norway
Portug
al
Spain
Sweden U.K.
1995 2005
14 | Labor Market Indicators
Hours
CHART 2.9
In 2005, annual hours worked per employed person in European countries, except Italy and Spain, were lower than in the North American and Asian-Pacific countries. Koreans worked the highest number of annual hours, by far.
The Republic of Korea and Ireland experienced the largest reductions in annual hours worked per employed person.

9.2
7.7
4.8
7.6
4.65.2
7.8
4.3
11.2
4.8
9.9
5.2
7.9
4.8
3.73.7
4.55.1
3.6
6.05.1
0
2
4
6
8
10
12
U.S.Can
adaMex
icoAus
tralia
Japa
nKore
a, Rep
. of
New Zeala
ndSinga
poreEU-15Aus
tria
Denmark
France
German
yIre
land
Italy
Netherl
ands
Norway
Portug
alSpa
inSwed
en
U.K.
NOTE: 2004 for Singapore.
SOURCE: Bureau of Labor Statistics, Organization for Economic Cooperation and Development, and International Labor Office.
Percent
Unemployment rates, 2005
Labor Market Indicators | 15
CHART 2.10
Most of the European countries had higher unemployment rates than the United States.
All but one of the Asian-Pacific countries had lower unemployment rates than the United States.

Unemployment rates for youth, 2005
18.0
34.0
29.1
21.5
17.4
11.5
37.0
11.0
14.8
28.4
7.6
13.5
19.120.0
12.912.510.4
15.2
7.0
15.416.6
9.68.8 8.96.3
7.7 8.4 9.96.6
15.6
8.76.3
8.1
21.8
15.9
7.4
21.4
7.29.1
14.817.0 17.4
0
10
20
30
40
U.S.Can
adaMex
icoAus
tralia
Japa
nKore
a, Rep
. of
New Zeala
ndSinga
poreEU-15Aus
triaDen
markFranc
eGerm
any
Irelan
d
Italy
Netherl
ands
Norway
Portug
alSpa
inSwed
en
U.K.
Teenagers 20- to 24-year-oldsPercent
16 | Labor Market Indicators
CHART 2.11
Italian teenagers had the highest unemployment rate, followed by their counterparts in Sweden and Spain.
Unemployment rates for teenagers were higher than those for 20- to 24-year-olds in all countries except Denmark and Germany.
NOTE: 2004 for Singapore. Teenagers are defined as persons ages 15 to 19 or ages 16 to 19.
SOURCE: Bureau of Labor Statistics, Organization for Economic Cooperation and Development, and International Labor Office.

NOTE: 2004 for Singapore. Youth are defined as persons under age 25 and over age 14 or 15. Adults are defined as persons ages 25 and over.
SOURCE: Bureau of Labor Statistics, Organization for Economic Cooperation and Development, and International Labor Office.
Ratio of youth to adult unemployment rates, 2005
2.8
2.32.5
2.9
2.2
3.3
3.8
2.02.3 2.4
1.8
2.8
1.5
2.4
3.8
2.0
3.4
2.4 2.5
3.9 3.8
0
1
2
3
4
5
U.S.Can
adaMex
icoAus
tralia
Japa
nKore
a, Rep
. of
New Zeala
ndSinga
poreEU-15Aus
triaDen
markFranc
eGerm
any
Irelan
d
Italy
Netherl
ands
Norway
Portug
alSpa
inSwed
en
U.K.
Ratio
Labor Market Indicators | 17
CHART 2.12
Unemployment rates were higher for youth than for adults. The ratios of youth to adult unemployment rates were highest in Sweden, New Zealand, Italy, and the United Kingdom.
The smallest differences in the unemployment rates for youth versus those for adults were in Germany and Denmark.
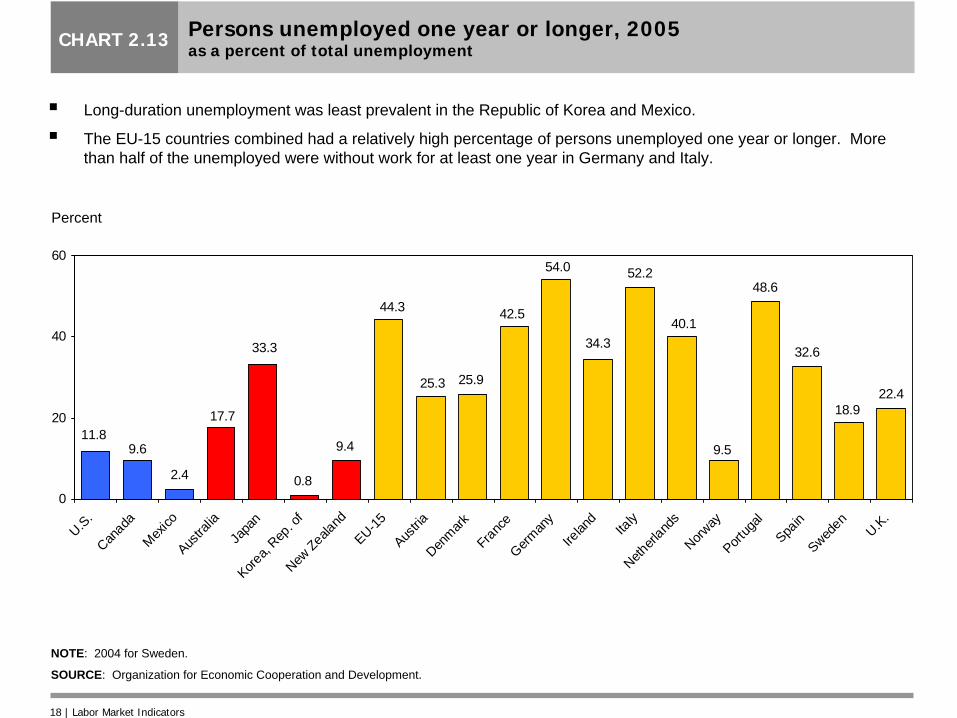
Long-duration unemployment was least prevalent in the Republic of Korea and Mexico.
The EU-15 countries combined had a relatively high percentage of persons unemployed one year or longer. More than half of the unemployed were without work for at least one year in Germany and Italy.
Persons unemployed one year or longer, 2005 as a percent of total unemployment
22.418.9
32.6
48.6
9.5
40.1
52.2
34.3
54.0
42.5
25.925.3
44.3
9.4
0.8
33.3
17.7
2.4
9.611.8
0
20
40
60
U.S.Can
adaMex
icoAus
tralia
Japa
nKore
a, Rep
. of
New Zeala
ndEU-15Aus
triaDen
markFranc
eGerm
any
Irelan
d
Italy
Netherl
ands
Norway
Portug
alSpa
inSwed
en
U.K.
Percent
18 | Labor Market Indicators
CHART 2.13
NOTE: 2004 for Sweden.
SOURCE: Organization for Economic Cooperation and Development.

Ratio of unemployment rate of persons without high school degrees to that of persons with college or university degrees, 2004
2.6
1.31.7
1.91.5
1.2
2.4
3.7
3.2
1.51.51.5
2.0
4.7
1.7
3.2
2.5
0.6
2.1
3.1
1.9
4.2
2.0 1.9
2.92.6
1.6 1.7
1.3
2.21.9
2.82.4
1.7
0.8
1.4
1.9
0.6
0
2
4
6
U.S.Can
ada
Mexico
Aus
tralia
Ja
pan
Korea,
Rep. o
fNew
Zealand
Aus
tria
Denmark
Franc
e Germ
any
Irelan
d
Italy
Netherl
ands
Norway
Port
ugal
Spain
Sweden
U.K.
Men WomenRatio
NOTE: 2003 for Japan. The unemployment rates used to calculate these ratios are for men and women ages 25 to 64.
SOURCE: Organization for Economic Cooperation and Development.
CHART 2.14
Unemployment rates were higher for persons without high school degrees, except for men and women in Mexico and for women in the Republic of Korea.
The unemployment rates of persons without high school degrees were at least three times that of persons with college or university degrees for men in Germany, Ireland, Austria, and the United Kingdom, and for both men and women in the United States.
Labor Market Indicators| 19

55
17 15
48 39
7
33
47
44 53 6251
41
59
35
38
42
57
12
19
48 56
39 45
1631 37
30 2518
3224 25 28
11
29 32
1326
35 29
75
11
29
5137
1635
1720222616
36
77
13 160
20
40
60
80
100
U.S.
Canad
a Mex
icoAus
tralia
Ja
pan
Korea,
Rep. o
fNew
Zeala
nd
Austria
Denmark
Fr
ance
Germ
any
Irelan
d
Italy
Netherl
ands
Norway
Portug
al
Spain
Sweden
U.K.
Below upper secondary Upper secondary and post-secondary non-tertiary Tertiary
NOTE: 2003 for Japan. The adult population is defined as persons ages 25 to 64. Below upper secondary education is equivalent to less than high school. Upper secondary and post-secondary non-tertiary education is equivalent to high school and also includes trade school. Tertiary education is equivalent to higher education provided by a college or university.
SOURCE: Organization for Economic Cooperation and Development.
Educational attainment of the adult population, 2004 by highest level of education attained
20 | Labor Market Indicators
CHART 2.15
More than one-third of the adult population has tertiary (university) education in Canada, the United States, Japan, and Sweden.
In Mexico, Portugal, Spain, and Italy, more than half of the adult population has less than upper secondary education.
Percent

Competitiveness
Indicators for
Manufacturing
Competitiveness Indicators for Manufacturing | 21
SECTION 3Relative levels and changes in manufacturing hourly compensation costs and relative changes in manufacturing labor productivity (output per hour) and unit labor costs can be
used to partially assess international competitiveness. These data are available on a comparative basis only for the manufacturing sector. Charts 3.1 and 3.2 compare the level and trends of hourly compensation costs for production workers in manufacturing. The data are adjusted to U.S. dollars at market exchange rates. Changes over time in compensation costs denominated in U.S. dollars reflect the underlying national wage and benefit trends measured in national currencies, as well as frequent and sometimes sharp changes in currency exchange rates. The hourly compensation figures in U.S. dollars provide comparative measures of employer labor costs; they do not provide inter-country comparisons of the purchasing power of worker incomes. Chart 3.3 depicts employer social insurance expenditures and other labor taxes as a percent of hourly compensation costs.
Charts 3.4 through 3.7 provide comparisons of manufacturing productivity growth rates, the composition of productivity growth in terms of changes in output and hours worked, trends in unit labor costs, and shares of world manufacturing output. Unit labor costs are defined as the cost of labor compensation per unit of output. Changes in unit labor costs reflect the net effect of changes in hourly worker compensation and in labor productivity. Unit labor costs rise when compensation per hour rises faster than labor productivity. Conversely, if labor productivity rises faster than hourly compensation, unit labor costs decline.
The compensation costs indicators provide the most extensive country coverage in this chartbook. Twenty-two economies and the EU-15 are shown on those charts. For productivity, the coverage is limited to 15 economies.

Canada, Australia, and eight European countries had higher hourly compensation costs than the United States.
Hourly compensation costs were well under $10 in Mexico, Hong Kong SAR, Taiwan, Portugal, and Singapore.
Hourly compensation costs, 2005 for production workers in manufacturing in U.S. dollars
25.6628.73
17.78
7.33
39.14
31.81
21.0522.76
33.00
24.63
35.47
29.4227.52
6.387.66
14.9713.56
21.76
5.65
24.91
2.63
23.8223.65
0
10
20
30
40
50
U.S.Can
adaMex
icoAus
tralia
Hong Kon
g SAR
Japa
nKore
a, Rep
. of
New Zeala
ndSinga
poreTaiwan
EU-15Aus
tria
Denmark
France
German
yIre
land
Italy
Netherl
ands
Norway
Portug
alSpa
inSwed
en
U.K.
NOTE: Hong Kong SAR stands for Hong Kong Special Administrative Region of China.
SOURCE: Bureau of Labor Statistics.
U.S. Dollars
22 | Competitiveness Indicators for Manufacturing
CHART 3.1

3.33.7
4.54.9
1.6
-0.8
6.4
3.8
0.10.6
3.1
1.5
3.4
2.5
0.9
5.2
3.0 2.8
4.7
3.7 3.42.9
6.4
-2
0
2
4
6
8
U.S.Can
adaMex
icoAus
tralia
Hong Kon
g SAR
Japa
nKore
a, Rep
. of
New Zeala
ndSinga
poreTaiwan
EU-15Aus
tria
Denmark
France
German
yIre
land
Italy
Netherl
ands
Norway
Portug
alSpa
inSwed
en
U.K.
Average annual growth rates for hourly compensation costs, 1995-2005 for production workers in manufacturing in U.S. dollars
Competitiveness Indicators for Manufacturing | 23
Percent
NOTE: Hong Kong SAR stands for Hong Kong Special Administrative Region of China.
SOURCE: Bureau of Labor Statistics.
CHART 3.2
Growth in hourly compensation costs in U.S. dollars was similar for the United States and the EU-15 as a whole.
Only Japan had a decrease in hourly compensation costs.

28.1
18.5
22.519.4
10.9
20.3
8.5
17.0
21.7
4.5
14.012.1
23.527.1
10.3
31.2
22.6
12.7
30.9
21.5 20.0 19.7
25.2
0
10
20
30
40
U.S.Can
adaMex
icoAus
tralia
Hong Kon
g SAR
Japa
nKore
a, Rep
. of
New Zeala
ndSinga
poreTaiwan
EU-15Aus
triaDen
markFranc
eGerm
any
Irelan
dIta
lyNeth
erland
sNorw
ayPort
ugal
Spain
SwedenU.K.
Percent
24 | Competitiveness Indicators for Manufacturing
Employer social insurance expenditures and other labor taxes as a percent of hourly compensation costs, 2005 for production workers in manufacturing
NOTE: Hong Kong SAR stands for Hong Kong Special Administrative Region of China.
SOURCE: Bureau of Labor Statistics.
CHART 3.3
Employer social insurance costs as a percent of hourly compensation costs were similar for the United States and the EU-15 as a whole, but U.S. costs were higher than in all of the non-European countries.
In Europe, social insurance costs as a percent of total hourly compensation costs ranged widely: France and Italy had higher costs than the United States, while Denmark and Ireland had much lower costs.

3.2
6.8
1.1
3.03.2
0.1
3.5
4.3
2.3
5.5
8.9
3.33.0
1.9
5.6
0
2
4
6
8
10
U.S.
Canad
a
Austra
lia
Japa
nKore
a, Rep
. of
Taiw
an
Denmark
Fran
ce
German
y
Italy
Netherl
ands
Norway
Spain
Sweden
U.K.
Percent
Competitiveness Indicators for Manufacturing | 25
Average annual growth rates for manufacturing productivity, 1995-2005CHART 3.4
The Republic of Korea had, by far, the largest increase in manufacturing labor productivity, followed by Sweden, the United States, and Taiwan.
Italy recorded the lowest gains in manufacturing labor productivity, followed by Spain and Canada.
NOTE: Productivity is defined as output per hour worked.
SOURCE: Bureau of Labor Statistics.

3.32.8
1.8
0.9
4.9
2.51.8
-0.3
1.7 1.7
2.9
5.8
0.3
-2.2
0.9
-1.2
-2.3
-1.5
-0.6
-1.5 -1.7 -1.6 -1.4 -1.3-0.9
-2.7
0.8
7.3
1.8
-0.4
-4
-2
0
2
4
6
8
U.S.
Canad
a
Austra
lia
Japa
nKore
a, Rep
. of
Taiw
an
Denmark
Fran
ce
German
y
Italy
Netherl
ands
Norway
Spain
Sweden U.K
.
Output Hours worked
SOURCE: Bureau of Labor Statistics.
Percent
26 | Competitiveness Indicators for Manufacturing
Average annual growth rates for manufacturing output and hours worked, 1995-2005CHART 3.5
Manufacturing output increases were highest in the Republic of Korea and Sweden; output slightly decreased in Italy.
The United States showed the third largest decline in hours worked; hours worked increased only in Spain and Canada.

Unit labor costs (ULC) are a component of total production costs and product prices. Declines in ULC indicate that a country is becoming more cost-competitive.
ULC declined in over half of the economies shown, including the United States.
-4.0-3.7
-5.2
-1.8 -1.8
3.3
-0.3
1.7
0.7
-2.5
3.0
0.5
1.82.1
-0.9
-6
-5
-4
-3
-2
-1
0
1
2
3
4
U.S.
Canad
a
Austra
lia
Japa
nKore
a, Rep
. of
Taiw
an
Denmark
Fran
ce
German
y
Italy
Netherl
ands
Norway
Spain
Sweden U.K
.
SOURCE: Bureau of Labor Statistics.
Percent
Competitiveness Indicators for Manufacturing | 27
Average annual growth rates for manufacturing unit labor costs, 1995-2005 in U.S. dollarsCHART 3.6

20.6
2.7 1.7 1.1
13.3
2.70.2 0.7 0.4
3.5
8.2
0.7
4.0
1.1 0.4 0.32.2
0.9
3.9
27.6
0
5
10
15
20
25
30
U.S.Can
adaMex
icoAus
tralia
Japa
nKore
a, Rep
. of
New Zeala
ndEU-15Aus
triaDen
markFranc
eGerm
any
Irelan
d
Italy
Netherl
ands
Norway
Portug
alSpa
inSwed
en
U.K.
Manufacturing output as a percent of world manufacturing output, 2005
28 | Competitiveness Indicators for Manufacturing
Percent
CHART 3.7
The United States is, by far, the world’s leading producer of manufactured goods. Of the countries shown, Japan and Germany are the next largest producers.
The EU-15 countries’ combined share of world manufacturing output surpassed that of the United States.
NOTE: 2004 for the United Kingdom.
SOURCE: United Nations.

SECTION 4
Other
Economic
Indicators
Other Economic Indicators | 29
Charts 4.1 through 4.5 show indicators of broad labor market and population issues, some of these in the policy field. Charts 4.1-4.3 compare the following policy issues: expenditures on labor market programs, the extent of labor and product market regulations, and the level of taxation on labor.
Chart 4.4 shows dependency ratios. The dependency ratio is an overall measure of the dependence of children and the elderly on people of working age. However, dependency ratios show the age composition of a population, not necessarily economic dependency. Some children and elderly people are part of the labor force and some working-age people are not.
Chart 4.5 compares data on trade in goods as a percent of GDP. This indicator shows an economy’s degree of openness.
The number of countries covered in this section varies from 18 to 20. EU-15 data were available only for two charts.

2.6
0.8
2.22.0
1.6
3.7
1.41.5
3.5
2.7
4.5
2.0
1.0
0.3
0.71.0
0.5
1.0
0
1
2
3
4
5
U.S.
Canad
aAus
tralia
Japa
nKore
a, Rep
. of
New Ze
aland
Austria
Denmark
Fran
ceGerm
any
Irelan
d
Italy
Netherl
ands
Norway
Portug
al
Spain
Sweden U.K
.
Percent
Public expenditures on labor market programs as a percent of GDP, 2004-05
30 | Other Economic Indicators
NOTE: 2004 for Austria, Denmark, France, Germany, Ireland, Italy, the Netherlands, Norway, Portugal, Spain, and Sweden. 2005 for the Republic of Korea. Fiscal year 2004 for the United States and the United Kingdom. Fiscal year 2005 for Canada, Australia, Japan, and New Zealand.
SOURCE: Organization for Economic Cooperation and Development.
CHART 4.1
Expenditures on labor market programs were less than 1 percent of GDP in the Republic of Korea, the United States, Japan, and the United Kingdom.
The highest relative expenditures were in Denmark, the Netherlands, and Germany.

1.11.3
2.4
1.10.7
1.8
2.3
1.5 1.31.8
2.6
2.0
2.52.2
2.92.6
3.13.5
3.2
1.0 0.91.2
1.61.61.51.4
1.9
1.11.21.4
1.7
1.11.4
1.11.51.3
0.9
2.2
0
1
2
3
4
5
6
U.S.
Canad
aMex
icoAus
tralia
Japa
nKore
a, Rep
. of
New Z
ealan
dAus
tria
Denmark
Fran
ceGer
many
Irelan
d
Italy
Netherl
ands
Norway
Portug
alSpa
inSwed
en
U.K.
Labor market Product market
Measures of regulation on labor and product markets, 2003
Other Economic Indicators | 31
CHART 4.2
Regulations on market activity were least restrictive in the United States and the United Kingdom.
Portugal and Mexico were characterized by more restrictive labor markets, followed by Spain and France; restrictive product markets were most pronounced in Mexico, Italy, and France.
Scale 0-6 from least to most restrictive
SOURCE: Organization for Economic Cooperation and Development.

45.4
23.5
41.142.2
20.4
33.7
48.1
38.936.337.238.9
52.450.1
47.9
17.3
27.728.3
14.7
31.928.9
0
10
20
30
40
50
60
U.S.
Canad
aMex
icoAus
tralia
Japa
n
Korea,
Rep. o
fNew
Zea
land
EU-15Aus
triaDen
mark
Fran
ceGer
many
Irelan
d
Italy
Nether
lands
Norway
Por
tugal
Spain
Sweden
U.K
.
NOTE: Data refer to single persons without children at the income of the average worker.
SOURCE: Organization for Economic Cooperation and Development.
Percent
32 | Other Economic Indicators
Share of labor costs taken by tax and social security contributions, 2005CHART 4.3
For the average single worker, the combined employer-employee tax burden was lower in the United States than in all but one of the European countries.
The combined employer-employee tax burden was higher in the United States than in all non-European countries except Canada.

Dependency ratios, 2005 and projections to 2025
In 2005, Mexico had the highest dependency ratio, while the Republic of Korea had the lowest.
By 2025, only Mexico’s dependency ratio is expected to decrease; Japan is expected to have the highest dependency ratio.
0.58 0.570.59
0.68
0.47
0.570.59
0.560.60
0.620.60
0.51
0.59 0.60 0.59
0.55 0.55
0.64
0.59
0.49
0.44
0.58
0.480.51
0.39
0.51 0.500.47
0.510.53
0.500.47
0.510.48
0.52
0.480.45
0.53 0.52
0.47
0
0.1
0.2
0.3
0.4
0.5
0.6
0.7
0.8
U.SCan
ada
Mexico
Austra
liaJa
pan
Korea,
Rep. o
fNew
Zealan
dEU-15Aus
triaDen
markFran
ceGer
many
Irelan
d
Italy
Netherl
ands
Norway
Portug
alSpa
inSwed
en U.K.
2005 2025
Other Economic Indicators | 33
Ratio
CHART 4.4
NOTE: The dependency ratio is the ratio of dependents (persons under age 15 or over age 64) to the working-age population (persons ages 15 to 64).
SOURCE: United Nations.

SOURCE: World Bank.
Trade in goods as a percent of GDP, 2005
21
61 5833 25
6944
8164
4563
90
43
128
56 5741
6840
368
0
50
100
150
200
250
300
350
400
U.S.Can
adaMex
icoAus
tralia
Japa
nKore
a, Rep
. of
New Zeala
ndSinga
poreAus
triaDen
markFranc
eGerm
any
Irelan
d
Italy
Netherl
ands
Norway
Portug
alSpa
inSwed
en
U.K.
Percent
34 | Other Economic Indicators
CHART 4.5
This indicator shows the relative importance of trade in goods to an economy; the United States and Japan had the lowest ratios.
The relatively high figures for Singapore and the Netherlands reflect their status as platforms for re-exports and trans-shipments.

Indicators for
Large Emerging
Economies
Indicators for Large Emerging Economies | 35
SECTION 5
Charts 5.1 through 5.8 provide a broad overview of basic economic indicators for large emerging economies.
Charts 5.1-5.3 show population data in three varying ways: world population distribution, age composition of the population, and dependency ratios. Gross Domestic Product (GDP) comparisons are shown in chart 5.4 (GDP per capita) and chart 5.5 (GDP per employed person). Chart 5.6 presents labor force participation rates by sex. Chart 5.7 compares trade in goods as a percent of GDP. Chart 5.8 shows manufacturing output as a percent of world manufacturing output.
All of these charts include the United States, which is used as a reference point, and five large emerging economies: Brazil, China, India, Indonesia, and the Russian Federation.

India17%
Rest of the World50%
Indonesia3%
Russian Federation2%
China20%
Brazil3%
U.S.5%
World population distribution, 2005
SOURCE: United Nations.
36 | Indicators for Large Emerging Economies
CHART 5.1
The five large emerging economies—Brazil, China, India, Indonesia, and the Russian Federation—made up 45 percent of the world’s population.
China and India together make up well over one-third of the world’s population.

Age composition of the population, 2005
66.9
66.070.7
62.066.1
71.1
12.36.1 7.7 5.0 5.5
13.8
20.827.8
21.633.0 28.4
15.1
0
10
20
30
40
50
60
70
80
90
100
U.S. Brazil China India Indonesia Russian Federation
Under age 15 Ages 15 to 64 Over age 64
SOURCE: United Nations.
Indicators for Large Emerging Economies | 37
Percent
CHART 5.2
The Russian Federation had the highest proportion of persons over age 64 and the lowest proportion under age 15.
India had the largest proportion of persons under age 15, accounting for about one-third of the country’s total population.

•
In 2005 India had the highest dependency ratio; however, between 2005 and 2025, India’s ratio is expected to experience the largest decline.
•
By 2025, it is expected that the United States will have the highest dependency ratio and Indonesia will have the lowest.
Dependency ratios, 2005 and projections to 2025
0.490.51
0.41
0.61
0.51
0.41
0.58
0.490.46
0.48
0.43
0.48
0.0
0.1
0.2
0.3
0.4
0.5
0.6
0.7
U.S. Brazil China India Indonesia Russian Federation
2005 2025
NOTE: The dependency ratio is the ratio of dependents (persons under age 15 or over age 64) to the working-age population (persons ages 15 to 64).
SOURCE: United Nations.
38 | Indicators for Large Emerging Economies
Ratio
CHART 5.3

NOTE: Purchasing Power Parity (PPP) is the number of foreign currency units required to buy goods and services in a foreign country equivalent to what can be bought with one dollar in the United States.
SOURCE: Bureau of Labor Statistics and World Bank.
GDP per capita, 2005 converted at PPP rates
10.9
3.83.5
6.68.7
42.1
0
10
20
30
40
50
U.S. Brazil China India Indonesia Russian Federation
Thousands of U.S. dollars
Indicators for Large Emerging Economies | 39
CHART 5.4
Among the five large emerging economies, the Russian Federation and Brazil had the highest GDP per capita, one-quarter to one-fifth of the U.S. level; India and Indonesia had the lowest, at less than one-tenth of the U.S. level.
China was in the middle of the group, with a GDP per capita at nearly 16 percent of the U.S. level.

Among the five large emerging economies, GDP per employed person was highest in Brazil and the Russian Federation.
China had the largest increase in GDP per employed person from 1995 to 2004, with an average annual growth rate of 5.5 percent.
NOTE: Purchasing Power Parity (PPP) is the number of foreign currency units required to buy goods and services in a foreign country equivalent to what can be bought with one dollar in the United States.
SOURCE: International Labor Office.
GDP per employed person, 1995 and 2004 in 1990 U.S. dollars converted at PPP rates
51.8
14.1
5.1 4.38.2
10.8
14.9
8.76.2
8.2
15.4
62.1
0
10
20
30
40
50
60
70
U.S. Brazil China India Indonesia Russian Federation
1995 2004Thousands of 1990 U.S. dollars
40 | Indicators for Large Emerging Economies
CHART 5.5
Labor force participation rates by sex, 2005
81.5 83.687.8
84.387.1
75.3
67.1
53.0
36.0
75.8
61.0
70.1
0
20
40
60
80
100
U.S. Brazil China India Indonesia Russian Federation
Men Women
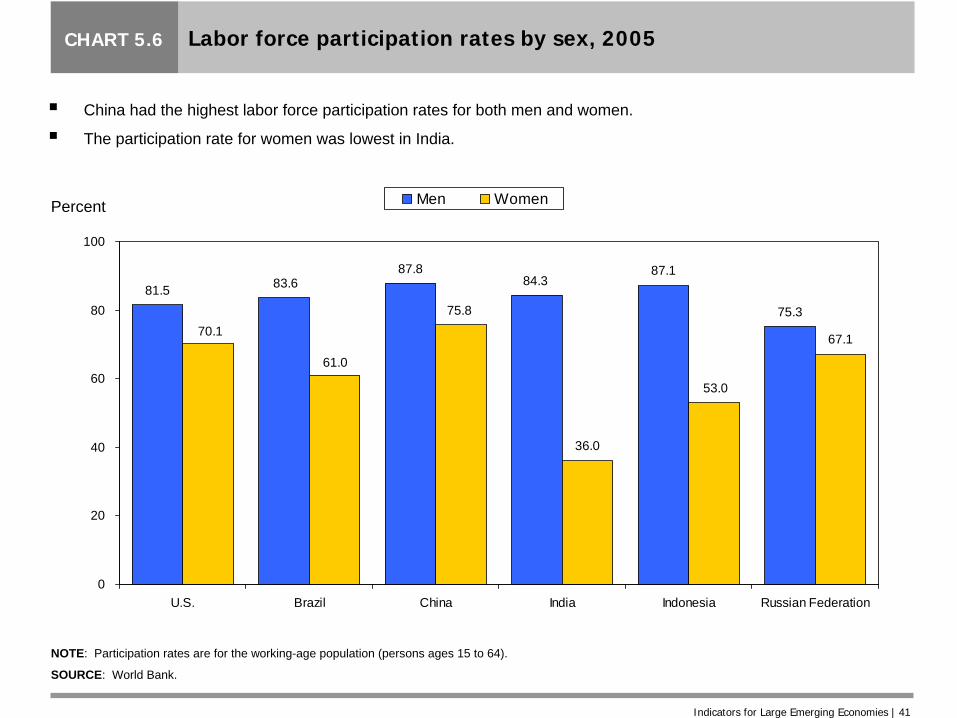
NOTE: Participation rates are for the working-age population (persons ages 15 to 64).
SOURCE: World Bank.
Percent
Indicators for Large Emerging Economies | 41
CHART 5.6
China had the highest labor force participation rates for both men and women.
The participation rate for women was lowest in India.

Trade in goods as a percent of GDP, 2005
21.224.7
63.8
28.2
54.0
48.5
0
10
20
30
40
50
60
70
U.S. Brazil China India Indonesia Russian Federation
SOURCE: World Bank.
Percent
42 | Indicators for Large Emerging Economies
CHART 5.7
This indicator shows the relative importance of trade in goods to an economy.
China had the highest percentage of trade in goods to GDP, followed by Indonesia and the Russian Federation; the United States had the lowest proportion.

U.S.21%
Brazil2%
China12%
Russian Federation2%
Indonesia1%
Rest of the World60%
India2%
Manufacturing output as a percent of world manufacturing output, 2005
Indicators for Large Emerging Economies | 43
CHART 5.8
The U.S. share of world manufacturing output was larger than the combined share of the large emerging economies.
Among the large emerging economies, China had the largest share of world manufacturing output, by far.
SOURCE: United Nations.

Definitions,Sources, and
Methods
Definitions, Sources, and Methods | A1
Appendix
Introduction This chartbook is based partially upon the output of the Bureau of Labor Statistics (BLS) program of international comparisons of laborforce, compensation, and productivity. In order to increase country and indicator coverage, BLS data are supplemented by data from theOrganization for Economic Cooperation and Development (OECD) and other organizations. BLS adjusts foreign statistics to a common conceptual framework,thereby aiding users in making meaningful international comparisons. Comparability issues arise due to, for example, differences indefinitions, time periods, and population coverage. Summary descriptions of the BLS comparative series are provided below. Moredetailed information can be found in the source documents listed, which are available on the BLS foreign labor statistics Website at http://www.bls.gov/fls/. BLS publications and releases also areavailable free of charge by contacting the Division of Foreign LaborStatistics, 2 Massachusetts Avenue, NE, Room 2150, Washington,D.C. 20212-0001, phone (202) 691-5654, FAX (202) 691-5679. To increase country coverage for some of the GDP per capita and labor market indicators charts (sections 1 and 2), BLS data are supplemented by data mainly from OECD, but also from the International Labor Organization’s International Labor Office (ILO), World Bank, and national sources. The data from these alternativesources are judged reasonably comparable with the BLS series unless otherwise noted. The charts on hourly compensation and productivityin manufacturing (charts 3.1-3.6) have not been supplemented by other

A2 | Definitions, Sources, and Methods
sources. All the data charted are from the BLS series for these indicators. To provide other indicators of interest, 21 of the charts (charts 2.4, 2.5, 2.8, 2.9, 2.13-2.15, 3.7, and all charts in sections 4 and 5) are based on statistics compiled by other organizations, mainly OECD, but also the United Nations, World Bank, and ILO. Discussion of the data from the non-BLS sources is included below. Although some adjustments may have been made by the source organizations to enhance comparability, these data generally are not considered fully comparable across countries. Where applicable, some caveats concerning comparability are noted. Country coverage varies by indicator. Twenty-two economies appear on the hourly compensation charts (charts 3.1-3.3); while 15 economies are included on the productivity and unit labor costs charts (charts 3.4-3.6). Coverage in the remaining charts, except those in section 5, varies from 18 to 21 countries. In addition, weighted aggregates for 15 European Union countries (EU-15) are shown on most charts. These represent European Union member countries prior to the expansion of the European Union to 25 countries on May 1, 2004 and to 27 countries on January 1, 2007. The 15 countries are Austria, Belgium, Denmark, Finland, France, Germany, Greece, Ireland, Italy, Luxembourg, the Netherlands, Portugal, Spain, Sweden, and the United Kingdom. It should be noted that some countries for which data are available are not included on the charts for analytical or presentation purposes. Fourteen countries appear on all charts in the first four sections: the United States, Canada, Australia, Japan, the Republic of Korea, Denmark, France, Germany, Italy, the Netherlands, Norway, Spain, Sweden, and the United Kingdom. In addition, data for Mexico, New Zealand, Austria, Ireland, and Portugal appear on almost all charts in sections 1-4; data for Hong Kong SAR, Singapore, and Taiwan were only available for some charts. Section 5 covers the United States, which is used as a reference point, and five large emerging economies: Brazil, China, India, Indonesia, and the Russian Federation.
In most cases, 2005 is the latest year that data are available for the charts. All data are either annual averages or mid-year estimates. There are some breaks in the historical continuity of labor force andemployment data for trends from 1995 onward. The nature of the breaks is documented in the source publications. The breaks generallydo not substantially affect the trends depicted. In the descriptions that follow, some charts are discussed as a group,while others warrant individual treatment.
Gross Domestic Product (charts 1.1, 1.2, 5.4, and 5.5)
A country's Gross Domestic Product (GDP) represents the sum of value added by all producers in that country. Value added is the valueof the gross output of producers less the value of intermediate goods and services used in production. It is generally used to measure thesize of an economy. However, it should not be interpreted asnecessarily measuring the wealth and well-being of the residents of that country. A better measure of the latter is Gross National Income. Gross National Income (GNI), which was previously called Gross National Product (GNP), measures the total domestic and foreign value added claimed by residents. It includes GDP plus net receipts ofprimary income from non-resident sources, where "primary income" is defined as compensation of employees and property income. Formany countries, the inflows and outflows of primary income tend tobalance out, leaving little difference between GDP and GNI. However,for some countries, the difference can be substantial. For example, GDP was 18 percent higher than GNI in Ireland in 2005.

Definitions, Sources, and Methods | A3
Purchasing Power Parities (PPPs) are currency conversion rates that allow output in different currency units to be expressed in a common unit of value. A PPP is the ratio between the number of units of a country's currency and the number of U.S. dollars required to purchase an equivalent basket of goods and services within each respective country. GDP per capita (charts 1.1, 1.2, and 5.4) GDP per capita converted at PPP rates (charts 1.1 and 5.4). The comparisons shown in charts 1.1 and 5.4 are based on measures of GDP converted at PPP rates and on population size. Measures for chart 1.1 are taken from the data underlying a periodic report published by BLS for the United States, Canada, Australia, Japan, the Republic of Korea, Austria, Belgium, Denmark, France, Germany, Italy, the Netherlands, Norway, Sweden, and the United Kingdom. For the remaining countries, the measures are based on data published by the World Bank. For chart 5.4, BLS data are used for the United States while the comparisons shown for the emerging economies are based on World Bank data. Source: BLS, "Comparative Real Gross Domestic Product Per Capita and Per Employed Person, Fifteen Countries, 1960–2005," June 16, 2006, <http://www.bls.gov/fls/>; and World Bank, World Development Indicators Database, <http://www.worldbank.org/>. Average annual growth rates for real GDP per capita (chart 1.2). Real GDP is GDP that has been adjusted for overall price changes over time, in order to remove the effects of inflation. Change in real GDP per capita over time is the result of changes in both a country's real GDP and in its population. For chart 1.2, the estimates of real GDP are based on data from BLS, OECD, and national sources. Measures are taken from the data underlying a periodic report published by BLS for the United States, Canada, Australia, Japan, the
Republic of Korea, Austria, Belgium, Denmark, France, Germany, Italy, the Netherlands, Norway, Sweden, and the United Kingdom. Data for Hong Kong are from the Hong Kong Census and Statistics Department;for Singapore, from Statistics Singapore; and for the remainingcountries, from OECD. Source: BLS, "Comparative Real Gross Domestic Product Per Capita and PerEmployed Person, Fifteen Countries, 1960–2005," June 16, 2006, <http://www.bls.gov/fls/>; World Bank, World Development Indicators Database, <http://www.worldbank.org/>; OECD, STAN Database, <http://www.oecd.org>; Hong Kong Census and Statistics Department,<http://www.info.gov.hk/censtatd/>; and Statistics Singapore, <http://www.singstat.gov.sg/>. GDP per employed person (chart 5.5) This indicator gives GDP measured in 1990 U.S. dollars converted at PPP rates divided by the number of employed persons. For an extensive discussion of the indicator, including details of itsconstruction and some limits to comparability, see the sourcedocument. The use of employed persons in the denominator of the indicator does not standardize sufficiently the measure of labor input. The number ofhours worked, on average, by each employed person can varymarkedly across countries and over time. This indicator may be viewed as giving the amount of GDP attributableon average to each employed person, working in tandem with all otherinputs or factors of production. Source: ILO, Key Indicators of the Labor Market CD-ROM, 4th Ed., Geneva, 2005, table 18a.

A4 | Definitions, Sources, and Methods
Labor market indicators(charts 2.1-2.15 and 5.6)
Charts in section 2 depict aspects of the labor force. Charts 2.1-2.3, 2.6, 2.7, and 2.10-2.12 contain BLS comparative data on labor force, employment, and unemployment and are supplemented by data from OECD and ILO. This comprises the first set of charts discussed in this section. Charts 2.4, 2.5, 2.8, 2.13, 2.14, and 5.6 also show data on labor force, employment, and unemployment, but data are from OECD, except for chart 5.6, which uses World Bank data. This second set of charts is discussed separately. Chart 2.9, annual hours worked per employed person, and chart 2.15, educational attainment of the adult population, are discussed individually at the end of this section. Labor force, employment, and unemployment (charts 2.1-2.3, 2.6, 2.7, 2.10-2.12) BLS comparative measures of the civilian labor force, employment, unemployment, and related indicators are used for the United States, Canada, Australia, Japan, France, Germany, Italy, the Netherlands, Sweden, and the United Kingdom. Other organizations provided the data for Mexico, the Republic of Korea, New Zealand, Singapore, the EU-15, Austria, Denmark, Ireland, Norway, Portugal, and Spain. In the BLS comparisons program, adjustments are made to each country's published data, if necessary, to provide measures approximately consistent with U.S. definitions. The data are adjusted to the U.S. concepts used in the Current Population Survey (CPS), the official source of U.S. labor force data. To adjust the data, BLS employs data from several sources, including data obtained by special request from the central statistical offices of the foreign countries. Further information on the nature of the adjustments for each country can be found in the BLS source document cited at the end of this section.
The labor force is the sum of the employed plus the unemployed; the unemployment rate is the ratio of the unemployed to the labor force. In the United States, the unemployed are those not working but availablefor work in the reference week, and actively seeking work in the past 4 weeks. Those persons waiting to be recalled from layoff need not beseeking work to be classified as unemployed. The employed are those persons who during the reference week did work for at least 1 hour aspaid employees, worked in their own business, profession, or on theirown farm, or worked 15 hours or more as unpaid workers in anenterprise operated by a family member. Those temporarily absentfrom work but who had jobs or businesses to return to are also counted as employed. The labor force participation rate is the ratio of the labor force to the population of working age (ages 16 and over in the United States and ages 15 or 16 and over in the other countries); theemployment-to-population ratio is the ratio of the employed to the population of working age. The BLS data are supplemented in charts 2.1-2.3, 2.6, 2.7, and 2.10-2.12 with data mainly from OECD; data for Singapore are from ILO. The OECD and ILO data are generally from labor force surveys that are based on the ILO guidelines for measurement of the labor force,employment, and unemployment. These guidelines are available on the Internet at http://www.ilo.org/public/english/bureau/stat/download/res/ecacpop.pdf. The ILO guidelines have become standards for many countries;consequently, definitions used in labor force surveys are now broadlysimilar in outline and purpose if not in all of their details. The ILO guidelines facilitate cross-country comparisons because they draw countries toward a common conceptual framework. The chartedOECD and ILO data are reasonably comparable to the correspondingBLS data, although some adjustments for comparability that are madeby BLS are not made by OECD or ILO.
Definitions, Sources, and Methods | A5
OECD produces a series of "standardized unemployment rates" (SURs) that are adjusted to ILO concepts. In recent years, the OECD series yielded unemployment rates virtually identical to the BLS comparative series of unemployment rates for the countries common to both programs, except for Canada and Germany. ILO produces a series of "ILO-comparable" measures of unemployment rates that are adapted to ILO concepts. This series is closely comparable with the results from the BLS and OECD comparisons programs. The OECD unemployment series are used to broaden the coverage of the unemployment data on chart 2.10. The unemployment rates for the following countries are obtained from the OECD SURs: the Republic of Korea, New Zealand, the EU-15, Austria, Denmark, Ireland, Norway, Portugal, and Spain. The ILO-comparable series is the source of the unemployment rate for Singapore. The unemployment rate for Mexico is not from the OECD SURs or ILO-comparable series; it is the figure from Mexico’s labor force survey as published by the OECD and it is not comparable to the other rates shown. The OECD data used to broaden the country coverage of charts 2.1-2.3, 2.6, 2.7, 2.11, and 2.12 are not adjusted by OECD for comparability to the extent that the SURs are adjusted; OECD does not publish standardized labor force and employment figures or standardized unemployment figures for subgroups. Data for Singapore on these charts are from the ILO-comparable series and include the armed forces. For a full discussion of comparability issues regarding the BLS, OECD, and ILO series, see Constance Sorrentino, "International unemployment rates: how comparable are they?" Monthly Labor Review, June 2000, pp. 3-20. This article is available on the Internet at http://www.bls.gov/opub/mlr/2000/06/art1full.pdf.
Source: BLS, "Comparative Civilian Labor Force Statistics, Ten Countries,1960-2006," March 19, 2007, <http://www.bls.gov/fls/>; OECD, Labor Force Statistics 1985-2005, 2006 Ed., Paris, August 2006, parts I and II; OECD, Employment and Labour Market Statistics Database, <http://www.oecd.org/>; and ILO, LABORSTA ILO-Comparable Estimates Database, <http://laborsta.ilo.org>. Labor force, employment, and unemployment (charts 2.4, 2.5, 2.8, 2.13, 2.14, and 5.6) The charts discussed below are derived from OECD and World Bank data sources. Data from other organizations are used because the BLS labor force comparisons program does not provide indicators forparticipation rates by age (charts 2.4 and 2.5) or for large emerging economies (chart 5.6), full-time and part-time employment (chart 2.8),duration of unemployment (chart 2.13), or unemployment by educational attainment (chart 2.14). Labor force participation rates (charts 2.4, 2.5, and 5.6). The participation rate for a given age group is defined as the percentage of the total (or civilian) labor force for the age group as a share of the total (or civilian) population for the age group. Two age groups are chartedfor youth in chart 2.4: teens (persons under age 20 and over age 14 or 15) and young adults (persons ages 20 to 24). Two age groups are charted for older workers in chart 2.5: persons ages 55 to 64 and persons ages 65 and over. Data for charts 2.4 and 2.5 are from OECD and are generally derived from labor force surveys. OECD has madeno attempt to standardize these data to international definitions.According to OECD, international comparisons of these data must be made with caution. In countries where young people are conscripted into the armed forces, their measured participation rates will differconsiderably according to whether the figures include or exclude thearmed forces. Differences in the lower age limit also affect thecomparability of the data.

A6 | Definitions, Sources, and Methods
Chart 5.6 presents labor force participation rates by sex for large emerging economies. In this chart, the labor force participation rate is the percentage of the labor force as a share of the population ages 15 to 64. These participation rates are conceptually different from those shown in chart 2.3, for which there is no upper age limit. It should be noted that in many developing countries, children under age 15 work full or part time and in some high-income countries, many workers postpone retirement past age 65. As a result, labor force participation rates calculated using age limits of 15 to 64 may systematically over- or under-estimate actual rates. Furthermore, the data, which are from the World Bank, have not been adjusted for comparability across countries. Source: OECD, Employment and Labour Market Statistics Database, <http://www.oecd.org/> and World Bank, World Development Indicators, Washington, D.C., 2006, table 2.2. Rates of growth in full-time and part-time employment (chart 2.8). OECD has adjusted full-time and part-time employment to a common conceptual basis, insofar as possible. Full-time employment is defined as persons usually working over 30 hours per week in their main job. Part-time employment is defined as persons usually working 30 or fewer hours per week in their main job. Data are limited to persons declaring usual hours worked. Except for the United States, the data relate to total employment. For the United States, the data cover wage and salary employment only. This difference should not materially affect the comparisons because paid workers account for more than 90 percent of total U.S. employment. The data are obtained from labor force surveys and refer to persons ages 15 or 16 and over, except for Norway and Sweden, where the data refer to persons ages 16 to 74 and 16 to 64, respectively.
Data for Japan are not comparable to those of the other countries for two reasons: (1) the Japanese data are based on "actual hoursworked" rather than "usual hours worked," and (2) part-time employment in Japan is defined as working fewer than 35 hours perweek. Thus, the Japanese data should not be used for comparisons of the level of full-time and part-time work. They are included in chart 2.8to track the broad trends in full-time and part-time work. For the Republic of Korea, data also are based on “actual hours worked” rather than “usual hours worked.” Source: OECD, Employment and Labour Market Statistics Database, <http://www.oecd.org/>. Persons unemployed one year or longer as a percent of totalunemployment (chart 2.13). The OECD data on duration of unemployment represent the length of time that persons unemployedhave been looking for work. The OECD data have not beenstandardized, but they are all from labor force surveys. The data referto persons ages 15 or 16 and over, except for Norway and Sweden,where the data refer to persons ages 16 to 74 and 16 to 64,respectively. Source: OECD, Employment Outlook, 2006 Ed., Paris, June 2006, table G. Ratio of unemployment rate of persons without high school degrees tothat of persons with college or university degrees (chart 2.14).Because educational systems vary widely across countries, OECDadopted a broad classification system based upon the InternationalStandard Classification for Education (ISCED) developed by the UnitedNations Educational, Scientific, and Cultural Organization (UNESCO). OECD summarizes the UNESCO categories into seven educational attainment groupings—ISCED 0 to ISCED 6—that refer to completed education. The OECD grouping "below upper secondary," whichincludes ISCED 0 through 2, corresponds to "without high school

Definitions, Sources, and Methods | A7
degrees." The grouping "tertiary-type A and advanced research programs," a subset of ISCED 5, corresponds to "with college or university degrees." The data on unemployment have not been standardized but they are all from labor force surveys. The data refer to men and women ages 25 to 64. Source: OECD, Education at a Glance: OECD Indicators, 2006 Ed., Paris, September 2006, table A8.2a; and OECD, Employment Outlook, 2006 Ed., Paris, June 2006, table D. Annual hours worked per employed person (chart 2.9) The concept used is the total number of hours actually worked over the year divided by the average number of persons in employment. Annual hours worked per employed person are affected by legislation and agreements on normal and overtime hours. They also are influenced by factors such as the proportion of part-time workers and self-employed, who work fewer and longer hours, respectively. The ILO standard definition for hours actually worked includes hours actually worked during normal periods of work; time worked in addition to the normal periods and generally paid at higher rates; time spent at place of work in preparation, repair, and record keeping; time spent at place of work on stand-by basis or under a guaranteed work contract; and time corresponding to short rest periods, including tea or coffee breaks. Hours actually worked should exclude hours paid for but not worked, such as: annual leave, public holidays, paid sick leave, meal breaks, and time spent on travel between home and work. Comparative data on annual hours worked based precisely on this ILO definition are not available. The comparisons shown in chart 2.9 are the published OECD data series on annual hours actually worked per employed person, which include some adjustments towards the above definition. The data
generally cover all persons in employment, including both full-time and part-time workers. OECD states that the data are intended primarily forcomparisons of trends over time. Comparisons of average annualhours worked levels for a given year are not precise because of differences in data sources and methods of estimation. Data sourcesinclude labor force surveys, establishment surveys, and administrativedata. Hours data reported from establishment surveys oradministrative sources exclude unpaid overtime. Hours data reportedfrom labor force surveys are subject to respondent error. Methods of estimation include direct estimates using one survey source, and component estimates using more than one survey source or a combination of survey-based data and administrative or legislative information. Some data are consistent with national accounts concepts. The source of hours and employment data varies by country. Annual estimates are based on actual or usual weekly hours worked from labor force and establishment surveys, or from normal hours worked fromsurvey or administrative data. Only two countries charted, New Zealand and the United Kingdom, directly measure hours actuallyworked with a continuous labor force survey, which accounts for every week of the year and avoids the need to adjust for holidays and other days lost. OECD adjusts national data for Ireland, Italy, Mexico, the Netherlands, and Portugal, and for France and Italy in 2005 to account for effective weeks worked during the year; these adjustments address hours not worked due to annual leave and public holidays, as well asthe underreporting of hours lost due to illness and maternity leave. The estimates for the Netherlands do not account for time lost due to illness/accident, bad weather, industrial disputes, or family responsibilities, nor do they cover overtime work. Thus, the published estimates do not accurately measure actual hours worked. Data for the United States are OECD estimates. They are based on unpublished BLS statistics of annual hours worked per job estimatedfrom the Current Employment Statistics Survey and the CPS. OECD

A8 | Definitions, Sources, and Methods
adjusts these unpublished BLS statistics for multiple jobholding using data from the CPS to produce estimates of annual hours worked per employed person. Data for all countries are on a per employed person basis. Source: OECD, Employment and Labour Market Statistics Database, <http://www.oecd.org>. Educational attainment of the adult population (chart 2.15) As discussed for chart 2.14, OECD uses UNESCO categories for seven educational attainment groupings. In chart 2.15, these are grouped into three broad categories. The grouping “below upper secondary” includes early childhood education (ISCED 0), primary level of education (ISCED 1), and lower secondary level of education (ISCED 2). The grouping “upper secondary and post-secondary non-tertiary” includes upper secondary level of education (ISCED 3) and post-secondary non-tertiary level of education (ISCED 4). The grouping “tertiary” includes the first stage of tertiary education (ISCED 5) and advanced research qualification (ISCED 6). The data refer to persons ages 25 to 64. Source: OECD, Education at a Glance: OECD Indicators, 2006 Ed., Paris, September 2006, tables A1.1a and A1.3a.
Competitiveness indicatorsfor manufacturing (charts 3.1-3.7 and 5.8)
Section 3 focuses on several key labor-related indicators of competitiveness in world markets for goods: the level and trends in manufacturing hourly compensation costs, trends in productivity and unit labor costs, and manufacturing output as a percent of worldmanufacturing. The manufacturing sector provides the best data forsuch comparisons, and the BLS indicators presented in charts 3.1-3.6have been adjusted to a common conceptual framework to facilitatecomparisons. Nevertheless, it should be noted that these indicatorsallow only for a partial assessment of international competitiveness of countries. The aggregate (all manufacturing) nature of the indicatorsmay mask important variations in competitiveness of manufacturingsub-sectors. In addition, competitiveness relationships inmanufacturing may not be the same as the relationships in services, a growing sector for trade flows. Although competitiveness is heavilydependent on labor costs, there are many other factors that alsoinfluence competitiveness, including the quality of the product, thetimeliness of its delivery, after-sales service, and the flexibility needed to respond to changes in customers' requirements. Note that the hourly compensation costs indicators in charts 3.1-3.3 show levels and trends, whereas the productivity and unit labor costs indicators in charts 3.4-3.6 are limited to trend comparisons. Hourly compensation costs for production workers in manufacturing (charts 3.1-3.3) These charts present data on comparative hourly compensation costsfor manufacturing production workers in order to assess internationaldifferences in employer labor costs. Comparisons based on the morereadily available average earnings statistics published by many countries can be very misleading—national definitions of average
Definitions, Sources, and Methods | A9
earnings differ considerably, average earnings do not include all items of labor compensation, and the omitted items of compensation frequently represent a large proportion of total compensation. The compensation measures are computed in national currency units and are converted into U.S. dollars at prevailing commercial market currency exchange rates. The foreign currency exchange rates used in the calculations are the average daily exchange rates for the reference period. They are appropriate measures for comparing levels of employer labor costs. They do not indicate relative living standards of workers or the purchasing power of their income. Hourly compensation costs include (1) hourly direct pay and (2) employer social insurance expenditures and other labor taxes. Hourly direct pay includes all payments made directly to the worker, before payroll deductions of any kind, consisting of (a) pay for time worked and (b) other direct pay. Pay for time worked includes basic time and piece rates plus overtime premiums, shift differentials, other premiums and bonuses paid regularly each pay period, and cost-of-living adjustments. Other direct pay includes pay for time not worked (vacation, holidays, and other leave, except sick leave), seasonal or irregular bonuses and other special payments, selected social allowances, and the cost of payments in kind. Social insurance expenditures and other labor taxes include (c) employer expenditures for legally required insurance programs and contractual and private benefit plans and (d) other labor taxes. Social insurance expenditures include employer expenditures for retirement and disability pensions, health insurance, income guarantee insurance and sick leave, life and accident insurance, occupational injury and illness compensation, unemployment insurance, and family allowances. Other labor taxes includes taxes on payrolls or employment (or reductions to reflect subsidies), even if they do not finance programs that directly benefit workers, because such taxes are regarded as labor costs.
The BLS definition of hourly compensation costs is not the same as theILO definition of total labor costs. Hourly compensation costs do notinclude all items of labor costs. The costs of recruitment, employeetraining, and plant facilities and services—such as cafeterias and medical clinics—are not included because data are not available for most countries. The labor costs not included account for no more than 4 percent of total labor costs in any country for which the data areavailable. Production workers generally include those employees who are engaged in fabricating, assembly, and related activities; materialhandling, warehousing, and shipping; maintenance and repair; janitorial and guard services; auxiliary production (for example, power plants);and other services closely related to the above activities. Workingsupervisors are generally included; apprentices and other trainees aregenerally excluded. Total compensation is computed by adjusting each country's averageearnings series for items of direct pay not included in earnings and foremployer expenditures for legally required insurance, contractual andprivate benefit plans, and other labor taxes. For the United States and other countries that measure earnings on an hours-paid basis, the figures are also adjusted in order to approximate compensation perhour worked. Earnings statistics are obtained from surveys ofemployment, hours, and earnings or from surveys or censuses ofmanufactures. Adjustment factors are obtained from periodic labor cost surveys andinterpolated or projected to non-survey years on the basis of other information for most countries. The information used includes tabulations of employer social security contribution rates provided bythe International Social Security Association, information on contractualand legislated fringe benefit changes from ILO and national laborbulletins, and statistical series on indirect labor costs. For other
A10 | Definitions, Sources, and Methods
countries, adjustment factors are obtained from surveys or censuses of manufactures or from reports on fringe-benefit systems and social security. For the United States, the adjustment factors are special calculations for international comparisons based on data from several surveys. The statistics are also adjusted, where necessary, to account for major differences in worker coverage; differences in industrial classification systems; and changes over time in survey coverage, sample benchmarks, and frequency of surveys. Nevertheless, some differences in industrial coverage remain, and in many countries other than the United States, the data exclude very small establishments (less than 5 employees in Japan and less than 10 employees in most other countries). For the United States, the methods used, as well as the results, differ somewhat from those of other BLS series on U.S. compensation costs. Hourly compensation costs are converted to U.S. dollars using the average daily exchange rate for the reference period. The exchange rates used are prevailing commercial market exchange rates as published by either the U.S. Federal Reserve Board or the International Monetary Fund. The hourly compensation figures in U.S. dollars shown in the tables provide comparative measures of employer labor costs; they do not provide inter-country comparisons of the purchasing power of worker incomes. Prices of goods and services vary greatly among countries, and the commercial market exchange rates used to compare employer labor costs do not reliably indicate relative differences in prices. Purchasing Power Parities (defined previously in the Gross Domestic Product section) must be used for meaningful international comparisons of the relative purchasing power of worker incomes.
Total compensation converted to U.S. dollars at Purchasing Power Parities would provide one measure for comparing relative real levelsof labor income. It should be noted, however, that total compensationincludes employer payments to funds for the benefit of workers in addition to payments made directly to workers. Payments into these funds provide either deferred income (for example, payments toretirement funds), a type of insurance (for example, payments tounemployment or health benefit funds), or current social benefits (for example, family allowances), and the relationship between employerpayments and current or future worker benefits is indirect. On the otherhand, excluding these payments would understate the total value of income derived from work because they substitute for worker savingsor self-insurance to cover retirement, medical costs, etc. Total compensation, because it takes account of employer paymentsinto funds for the benefit of workers, is a broader income concept than either total direct earnings or direct spendable earnings. An evenbroader concept would take account of all social benefits available toworkers, including those financed out of general revenues as well asthose financed through employment or payroll taxes. Source: BLS, “International Comparisons of Hourly Compensation Costs ofProduction Workers in Manufacturing, 2005,” November 30, 2006, Department of Labor News Release USDL 06-2020, <http://www.bls.gov/fls/>. Manufacturing productivity and unit labor costs (charts 3.4-3.6) The productivity estimates refer to labor productivity, defined as realoutput per hour worked. It is based on the manufacturing outputproduced in each country and the total labor input in the form of hoursworked. Output is defined as the real (deflated) GDP produced in themanufacturing sector of the economy. GDP has been definedpreviously (see Gross Domestic Product section). The output data are published as part of each country's national accounts.

Definitions, Sources, and Methods | A11
Hours worked in manufacturing include the hours of all persons engaged in the manufacturing process, including the self-employed. For some countries, the data on the number of hours worked in manufacturing are also published with the national accounts. For other countries, BLS constructs its own estimates of aggregate hours worked, multiplying employment figures published with the national accounts by estimates of average annual hours worked. Manufacturing unit labor costs are defined as the cost of labor compensation per unit of output. Because labor costs are frequently a major factor in total production costs, changes in unit labor costs affect the prices of manufactured products. Labor compensation includes employer expenditures for legally required insurance programs and contractual and private benefit plans, in addition to all payments made in cash or in kind directly to employees. Data on labor compensation are usually taken from the countries' national accounts. When data for the self-employed are not available, total compensation is estimated by assuming the same hourly compensation for self-employed and employees. Changes in a country's unit labor costs, expressed in U.S. dollars, are estimated by combining changes in the unit labor cost expressed in each nation's currency with changes in the exchange rate of the country's currency against the U.S. dollar. Source: BLS, "International Comparisons of Manufacturing Productivity and Unit Labor Cost Trends 2005, Revised," February 22, 2007, Department of Labor News Release USDL 07-0283, <http://www.bls.gov/fls/>.
Manufacturing output as a percent of world manufacturing output (charts 3.7 and 5.8) Manufacturing output is defined as the value added in the manufacturing sector of each country. Each country's manufacturing value added in 2005, expressed in U.S. dollars, is divided by world manufacturing value added. The value added series are converted to U.S. dollars by applying the corresponding 2005 exchange rates, as reported by the International Monetary Fund (IMF). Reported rates are annual averages of the exchange rates communicated to the IMF by the monetary authority of each member country. While exchange rates are the most appropriate conversion method, one must keep in mind that they are volatile by nature and can change suddenly and significantly, leading to sharp realignments of the comparative levels shown in the charts. For example, if a country's currency is relatively "undervalued," the share of world manufacturing output shown on the chart for that country will be relatively low. If the currency were to strengthen, the country's share (in U.S. dollars) would rise, even if its manufacturing output (in local currency units) remained unchanged. Source: United Nations, National Accounts Main Aggregates Database, <http://unstats.un.org/>.

A12 | Definitions, Sources, and Methods
Public expenditures on labor market programs as a percent of GDP
(chart 4.1) Public expenditures on labor market programs include the following programs, although not all countries have all programs: public employment services and administration; training; employment recruitment and maintenance incentives; integration of the disabled; direct job creation; business start-up incentives; out-of work and income maintenance and support, including unemployment compensation; and early retirement incentives. The data presented refer to 2004 for Austria, Denmark, France, Germany, Ireland, Italy, the Netherlands, Norway, Portugal, Spain, and Sweden. Data refer to 2005 for the Republic of Korea. For the United States and the United Kingdom, the data refer to fiscal year 2004, which begins on October 1st and April 1st, respectively. For the remaining countries, the data refer to fiscal year 2005, which begins on April 1st for Canada and Japan and on July 1st for Australia and New Zealand. GDP has been defined previously (see Gross Domestic Product section). Source: OECD, Social Expenditures Database, <http://www.oecd.org/>.
Measures of regulation on labor and product markets
(chart 4.2) The measure of labor market regulation gauges the extent of regulations governing the hiring and firing of workers—often termed employment protection legislation. It is a summary measure that ranges from 0 (no restrictions) to 6 (very restrictive). The following factors are considered: the extent of procedural requirements that employers must follow in individual or collective dismissals, notice and
severance pay requirements, and the degree of regulation ontemporary forms of employment. The measure of product market regulation is based on a simple average of indicators for seven industries, where each industry is ratedfrom 0 (no restrictions) to 6 (very restrictive). The industries are gas,electricity, postal and courier activities, telecommunications, air transport, railways, and road freight. Depending on the industry, thefollowing factors are considered: barriers to entry, public ownership,market structure, vertical integration, and price controls. Both indicators are constructed by OECD from a variety of national sources as well as from multi-country surveys. The construction of these summary measures involves difficult choices of quantificationand weighting. For further information on these choices, see thesource documents. Source: OECD, Employment and Labour Market Statistics Database and Conway, P., V. Janod and G. Nicoletti, "Product Market Regulation in OECDCountries, 1998 to 2003," OECD Economics Department Working Paper No 419, 2005, <http://www.oecd.org/>.
Share of labor costs taken by tax and social security contributions
(chart 4.3) This series measures the difference between the salary cost of anaverage worker to their employer and the amount of disposable income(net wage) that they receive. Labor costs are gross wages plus employer social security contributions and payroll taxes. The taxesincluded are income taxes paid by the employee, employee social security contributions, employer social security contributions, and,where in effect, payroll taxes. The types of taxes included in the

Definitions, Sources, and Methods | A13
measure are fully comparable across countries, as they are based on common definitions agreed upon by all OECD countries. Because income taxes and access to work-related cash benefits vary by family status and in complex ways in nearly all countries, simple cross-country comparisons require a restriction to workers with a common family status. The figures presented in chart 4.3 pertain to single persons without children at the income of the average worker. The information on the average worker income level is supplied by the ministries of finance in all OECD countries and is based on national statistical surveys. The amount of taxes paid by the worker is calculated by applying the tax laws of the country concerned. Thus, the tax rates are the result of a modeling exercise rather than direct observation of taxes actually paid. Source: OECD, Taxing Wages Database, <http://www.oecd.org/>.
Population (charts 4.4 and 5.1-5.3)
Population estimates are based on the most recent demographic data available for each country and reflect the de facto population as of July 1st of the year indicated. Standard demographic techniques are used to estimate population for the base year (2005). For most countries, national population censuses are the main source of data; however, frequency and quality vary by country. Most countries conduct a complete enumeration no more than once a decade. Pre- and post-census estimates are interpolations or extrapolations based on demographic models. Surveys conducted by international organizations, such as the Demographic and Health Surveys Program,
are often the source of the most recent demographic information for developing countries. Data for charts 4.4 and 5.1-5.3 are from the United Nations. International comparability of population indicators is limited bydifferences in the concepts, definitions, data collection procedures, andestimation methods used by national statistical agencies and otherorganizations that collect population data. Furthermore, ages are not always reported accurately, particularly in developing countries. The dependency ratio (charts 4.4 and 5.3) is the ratio of dependents (persons under age 15 or over age 64) to the working-age population (persons ages 15 to 64). The dependency ratio is an overall measureof the dependence that children and the elderly have on people ofworking age. Whereas dependency ratios show the age composition of a population, they do not necessarily show economic dependency. Some children and elderly persons are part of the labor force and someworking-age persons are not. Data for 2025 are projected by applying assumptions regarding future trends in fertility, mortality, and migration. Because future trends cannot be known with certainty, a number of projection variants areproduced by the United Nations. Data in charts 4.4 and 5.3 are based on the medium variant. For further information on the assumptions forthe medium variant, see the source document. The world population distribution (chart 5.1) shows each country’s share of the total world population. Total population of an economyincludes all residents regardless of legal status or citizenship—except for refugees not permanently settled in the country of asylum, who are generally considered part of the population of their country of origin.The total population presents one overall measure of the potentialimpact of the country on the world and within its region.

The age composition of the population (chart 5.2) refers to the percentage of the total population that comprises the specific age group. Three age groups are presented in chart 5.2: persons under age 15, persons ages 15 to 64 (often referred to as the working-age population), and persons over age 64. Source: United Nations, World Population Prospects: The 2006 Revision Population Database, <http://esa.un.org>.
Trade in goods as a percent of GDP (charts 4.5 and 5.7)
Trade in goods as a percent of GDP is the sum of merchandise exports and imports divided by GDP, all of which are valued in current U.S. dollars. The value taken by the indicator does not give the share of GDP generated by imports and exports; rather, it indicates that the value of imports and exports is equivalent to the resulting percentage of GDP. GDP has been defined previously (see Gross Domestic Product section). Source: World Bank, World Development Indicators Database, <http://www.worldbank.org>.
A14 | Definitions, Sources, and Methods