a chromatographic the aldose uronic acid constitulents ... physiol. (1972) 49, ... dryness, and the...
TRANSCRIPT

Plant Physiol. (1972) 49, 926-936
A Gas Chromatographic Method for the Determination of Aldoseand Uronic Acid Constitulents of Plant CellWall Polysaccharides1
Received for publication October 26, 1971
THOMAS M. JONES AND PETER ALBERSHEIMDepartmentt of Chemistry, University of Colorado, Boulder, Colorado 80302
ABSTRACT
A major problem in determining the composition of plantcell wall polysaccharides has been the lack of a suitable methodfor accurately determining the amounts of galacturonic andglucuronic acids in such polymers. A gas chromatographicmethod for aldose analysis has been extended to includeuronic acids. Cell wall polysaccharides are depolymerized byacid hydrolysis followed by treatment with a mixture of fungalpolysaccharide-degrading enzymes. The aldoses and uronicacids released by this treatment are then reduced with NaBH.4to alditols and aldonic acids, respectively. The aldonic acidsare separated from the alditols with Dowex-I (acetate form)ion exchange resin, which binds the aldonic acids. The alditols,which do not bind, are washed from the resin and then acetyl-ated with acetic anhydride to form the alditol acetate deriva-tives. The aldonic acids are eluted from the resin with HCI.After the resin has been removed, the HCI solution of thealdonic acids is evaporated to drvness, converting the aldonicacids to aldonolactones. The aldonolactones are reduced withNaBH4 to the corresponding alditols, dried and acetylated. Theresulting alditol acetate mixtures produced from the aldosesand those from the uronic acids are analyzed separately bygas chromatography. This technique has been used to deter.mine the changes in composition of Red Kidney bean (Phase-olus vulgaris) hypocotyl cell walls during growth, and tocompare the cell wall polysaccharide compositions of severalparts of bean plants. Galacturonic acid is found to be a majorcomponent of all the cell wall polysaccharides examined.
Since polysaccharides are the major constituents of theplant cell wall, (3, 33, 41, 45), verification of hypotheses con-cerning the physiological and biochemical roles of the cellwall in plant metabolism requires methods for the precisedetermination of the composition and structure of cell wallpolysaccharides. Until recently, methods for determining poly-saccharide composition have, in general, relied upon the sep-aration of the monosaccharide components of hydrolytic di-gests by means of paper chromatography and electrophoresis(51, 64) and identification of these components by a varietyof color reactions (20). Such methods are both laborious andsubject to errors of considerable magnitude.
I This work was supported by Atomic Energy Commission con-tract No. AT(11-1)-1426.
Two methods for the enzymatic determination of uronicacids have also been described. The first of these methods,employing an NADH-linked enzyme system from Bacilluspolymyxa for the reduction of D-galacturonic acid, has beenused for the quantitative determination of monomeric galac-turonic acid in the presence of large amounts of galacturonicacid oligomers (40). An NAD-linked uronate dehydrogenasefrom Pseudomonas syringae has also been used for the de-termination of D-galacturonic acid (8, 9). In this case bothD-galacturonic and D-glucuronic acids are oxidized, and whatis determined is the sum of the concentrations of the two acids.Hence, it is impossible. by this method, to distinguish thesetwo compounds, both of which are common constituents ofplant polysaccharides.With the development of gas-liquid chromatography of
carbohydrates (11, 23. 24, 61, 67), this powerful methodbecame available for the quantitative analysis of monosac-charide mixtures (54). These techniques have been refined bya number of investigators to the point that the gas chromato-graphic analysis of the neutral sugar components of plant cellwall polysaccharides is accurate, efficient, and convenient (4,13-16, 19, 26, 27, 29. 39, 47, 57, 59). Of the various tech-niques available, those involving the determination of neutralsugars following conversion to the corresponding alditol ace-tates (4, 13, 16, 59) have proven the most satisfactory fordetermining cell wall polysaccharide composition.The gas chromatographic determination of the uronic acids,
the other major component of plant cell wall polysaccharides,has received less attention. Tamura and Imanari (28, 62) haveinvestigated a variety of glucuronide derivatives, and have con-cluded that the trimethylsilyl ethers are satisfactory for gaschromatographic analysis of such compounds. Other investi-gators have examined the gas chromatographic behavior of thetrimethylsilyl ether derivatives of iduronic, glucuronic (34,35), and galacturonic (56) acids. Separation of the anomericforms of uronic acids as trimethylsilyl derivative has also beenexplored (17. 30. 31, 50, 63, 70, 71). In addition, Raymondand Nagel (52) have demonstrated the feasibility of separat-ing the trimethylsilyl derivatives of galacturonic acid oligomersby means of gas chromatography. A major disadvantage in theuse of trimethylsilyl derivatives for cell wall polysaccharideanalysis lies in the difficulty of achieving satisfactory separa-tions of the derivatives of each of the aldoses and uronic acidsfound in plant cell walls. No gas chromatographic column ma-terial which permits such a separation is available at present.
Another approach to hexuronic acid analysis has been pre-sented by Perry and Hulyalkar (48) in which salts of the uronicacids are converted to aldono-1,4-lactones from which tri-methylsilyl derivatives are prepared for gas chromatographicanalysis. Similar methods have also been described by other
926 www.plantphysiol.orgon May 16, 2018 - Published by Downloaded from
Copyright © 1972 American Society of Plant Biologists. All rights reserved.

Plant Physiol. Vol. 49, 1972 ALDOSES AND URONIC ACIDS OF CELL WALLS
investigators (37, 49, 58). While procedures of this type obvi-ate some of the difficulties encountered in chromatographyof the trimethylsilylated uronic acid monomers, difficultiesarising from incomplete derivative formation (12, 13, 48), andfrom incomplete gas chromatographic separation of the tri-methylsilyl aldono-lactones (58) have been reported.
Attempts to convert uronic acids to the corresponding aldi-tols followed by gas chromatography of the hexaacetate de-rivatives have been described by Blake and Richards (12, 13).However, because of difficulties in obtaining quantitative de-rivative formation, these authors concluded that such an ap-proach is not feasible.The present report describes the extension of an earlier
method for the analysis of neutral sugar mixtures (4) to en-compass gas chromatographic determination of hexuronicacids. This method is based on the quantitative conversionof the uronic acids to alditol hexaacetates by means of a se-ries of reactions similar to those described by Sjostr6m et al.i58). The application of this method to the determination ofdevelopmental changes in plant cell wall polysaccharide com-position is demonstrated.
MATERIALS AND METHODS
Plant Material and Isolation of Cell Wails. Cell wall ma-terial from various parts of the common bean (Phaseolusvulgaris L. cv. Red Kidney, Small White, and Pinto) is usedin this study. Plants are grown and the cell wall material isisolated as described by English et al. (22). Prior to analysisall cell wall preparations are placed in a vacuum oven at 50 C
POLYSACCHARIDE
acid hydrolysisenzymolysis
ALDOSES AND URONIC ACIDS
IreductionALDITOLS ALDONIC ACIDS
FROM ALDOSES FROM URONIC ACIDS
ion exchange separation
|lutionfrom resin
ALDITOLS
acetylation
ALDITOL ACETATES
FROM ALDOSES
ALDONIC ACIDS
lactonization
ALDONOLACTONES
reductiorn
ALDITOLS
acetylation
ALDITOL ACETATES
FROM URONIC ACIDS
FIG. 1. Preparation of derivatives for gas chromatography. Cellwall polysaccharides are depolymerized by acid hydrolysis fol-lowed by treatment with a mixture of polysaccharide-degradingenzymes. The aldoses and hexuronic acids which are liberated arethen reduced to alditols and aldonic acids, respectively. These twoclasses of compounds are then separated by means of Dowex-1anion exchange resin. The aldonic acids bind to the resin, and thealditols remain in the supematant solution above the resin. Aftercentrifugation, the supernatant solution is removed, evaporated todryness, and the alditols are converted to alditol acetates. The al-donic acids are then eluted from the resin with acid and dried toform the aldonolactones. The lactones are then reduced to alditolsand acetylated to form the alditol acetates. A detailed descriptionof each step is included under "Materials and Methods."
CH20H
HO O
POLYSACCHARIDE OH
0I
D-GALACTC
CH20H-OH
HO-
HO-
-OHC H20H
DULCITOLaceticanhydride
CH20AC
OACACO -
ACO -_OAC
CH20ACDULCITOL
HEXAACETATE
sodium/borohydride
COOH
HO 0
>)H.OH + HOH,OH
H OH
)SE D-GALACTURONIC ACID
sodium
CH2OH , borohydride.-OH
HO -
HO -OH
COOH
L--GALACTONIC ACID
hydrochloric\acid CH20H
OH
LH -OHC-O
L-GALACTONO-1,4-LACTONE
/odiumCH20H /borohydride-OH
-HO -~HO-
COHCH2OH
DULCITOL
acaticanhydrideX
2
-OACACO-
ACO--OACCm20AC
DULCITOLHEXAACETATE
FIG. 2. Reactions involved in the production of alditol acetatederivatives from D-galactose and D-galacturonic acid. After poly-saccharide depolymerization, D-galactose, and D-galacturonic acidare reduced with sodium borohydride to dulcitol and L-galactonicacid, respectively. Dulcitol and galactonic acid are then separatedusing Dowex-1 anion exchange resin. The galactonic acid binds tothe resin, and the dulcitol remains in the supernatant solution abovethe resin. The supernatant solution is removed, evaporated todryness, and the dulcitol is acetylated with acetic anhydride toyield dulcitol hexaacetate. The galactonic acid is eluted from theresin by treatment with HCl. The acid solution is evaporated todryness. This converts L-galactonic acid to L-galactono-1,4-lactone.The aldonolactone is then reduced with sodium borohydride toyield dulcitol, which is converted to dulcitol hexaacetate by treat-ment with acetic anhydride. The reactions are similar for otheraldoses and hexuronic acids. See "Materials and Methods" for de-tails of the reaction conditions.
for 72 hr to remove moisture. In some instances, cell wallpreparations were found to be contaminated with starch eventhough plants were kept 30 hr in the dark prior to harvestingto deplete their starch reserves. The starch was removed fromsuch walls by treatment with a purified a-amylase preparationfrom Bacillus subtilis (Sigma Chemical Co.) Cell wall sam-
ples of approximately 10 mg were suspended in 1 ml of 100mm potassium phosphate buffer, pH 7.0. Forty microliters ofa 0.1% (w/v) solution of a-amylase were added, and the mix-ture incubated 24 hr at 25 C. At the end of this period, thecell wall material was pelleted in a clinical centrifuge and thesupernatant fluid was removed. The walls were washed twicewith 2 ml of water and then analyzed as described below.
Preparation of Alditol Acetate Derivatives. The procedureemployed for the preparation of alditol acetate derivativessuitable for gas chromatography from aldoses and uronic acidsis outlined in flow chart form in Figure 1. The reactions in-volved are illustrated in Figure 2, using D-galactose andD-galacturonic acid as examples.
927
www.plantphysiol.orgon May 16, 2018 - Published by Downloaded from Copyright © 1972 American Society of Plant Biologists. All rights reserved.
JONES AND ALBERSHEIM
Hydrolysis of Cell Wall Polysaccharides and Reduction ofLiberated Monosaccharides. A portion (5-10 mg) of desiccatedcell wall material is weighed into a Pyrex test tube. Two milli-liters of 0.2 N trifluoroacetic acid (Eastman Organic Chemi-cals, reagent grade) containing 1 mg of myoinositol (Calbio-chem, three times recrystallized from ethanol and water) areadded to each sample. The myoinositol, which serves as an
internal standard for the analysis of aldose components ofthe polysaccharide, is desiccated by 48-hr storage in a vacuumoven at 50 C prior to dissolution in the trifluoroacetic acidsolution. The test tube containing the cell wall material, themyoinositol, and the trifluoroacetic acid solution is thensealed, and hydrolysis is carried out for 1 hr at 121 C in asteam autoclave. After hydrolysis, the tube is opened, and thetrifluoroacetic acid is removed by evaporation of the solutionto dryness at 40 C in a stream of filtered air. The sample isthen stored for 12 hr in a vacuum desiccator in the presence
of KOH pellets to remove any traces of trifluoroacetic acidremaining in the residue.The partially hydrolyzed cell wall material is treated with
a mixture of extracellular polysaccharide-degrading enzymes
secreted by the phytopathogenic fungus (Sclerotilrn rolfsii Sac.)to complete the depolymerization of the polysaccharides. Aculture of this organism, which is maintained on potato dex-trose agar, was obtained from Dr. D. F. Bateman of CornellUniversity. The preparation of the S. rolfsii enzyme mixturehas been described by Van Etten and Bateman (68). Two milli-liters of 10 mM sodium acetate, pH 4.5, containing 0.1%(w/v) lyophilized S. rolfsii enzyme extract, which has beendialyzed overnight, are added to each sample. This corre-
sponds to approximately 100 [kg of protein per sample as de-termined by the method of Lowry et al. (36) using crystallinebovine serum albumin as standard. This amount of enzyme
contains insignificant amounts of carbohydrate. The cell wallresidue is resuspended, and enzymolysis is permitted to pro-
ceed for 6 hr at 30 C. At the end of the enzymolysis period, thealdehyde groups of the liberated neutral sugars and hexuronicacids are reduced. This is accomplished by adding 0.5 ml of1.0 N NH4OH containing 3.0 mg of sodium borohydride(Fisher Scientific Co., 98%) and 1.0mgof L-mannonic acid toeach enzymolysis sample (1, 72).The sodium borohydride reduction of the liberated hemi-
acetal groups is permitted to continue for1 hr at room temper-ature. At this time, the remaining sodium borohydride is de-composed by the dropwise addition of glacial acetic acid untilthe effervescence has ceased. For complete reduction, excess
sodium borohydride should remain at the end of an hour'sreduction. Its presence should be evident by vigorous ef-fervescence upon addition of acetic acid. One ml of absolutemethanol is then added and the solution mixed. The mixedsolutions are centrifuged in a clinical centrifuge for 5 min.
The supematant fluid is transferred with a capillary pipetteto a clean test tube, while the residue is washed twice with0.5 ml of 70% ethanol (v/v). The residue is discarded, and the70% ethanol washings are added to the supernatant fluid.This solution is then evaporated to dryness at 40 C under a
stream of filtered air. Five 1.0-ml portions of 10% (w/v)glacial acetic acid in methanol are added to each sample duringevaporation. Treatment with acidic methanol permits the re-
moval of boric acid, which is formed in the decomposition ofsodium borohydride, as its volatile trimethyl ester (55). Thisreduction procedure converts the neutral sugars to the corre-
sponding alditols, and the uronic acids are converted to al-donic acids (Fig. 2).The L-mannonic acid which is added to each sample at the
time of the addition of the sodium borohydride serves as an
internal standard for the determination of theuronic acid
components of the polysaccharide. L-Mannonic acid is pre-pared by base hydrolysis of L-mannono-1 ,4-lactone (PfanstiehlLaboratories, Inc.). A 1.816-mg per ml solution of mannono-lactone in 1.0 N NH4OH is evaporated to dryness at 45 to50 C in a rotary evaporator. The residue is taken up in anequal volume of 1.0 N NH4OH containing 6.0 mg per ml ofsodium borohydride. One half milliliter of the resulting solu-tion then contains 1.0 mg of L-mannonic acid and 3.0 mg ofsodium borohydride.
Separation of Alditols and Aldonic Acids. The dried residueremaining after the final methanol-acetic acid evaporation istaken up in 3 ml of distilled water, and this solution istransferred to test tubes containing approximately 0.3 g ofDowex-1 anion exchange resin, acetate form, 200 to 400 mesh.The resin-sample suspension is magnetically stirred for 1 hrat room temperature after which the resin is sedimented bycentrifugation in a clinical centrifuge. The supernatant fluidis transferred with a capillary pipete to another test tube con-taining approximately 0.2 g of the Dowex-1 resin. This sus-pension is stirred for 1 hr at room temperature, after which theresin is sedimented by centrifugation, and the supernatantfluid is transferred to a clean test tube. Each of the tworesin pellets is then washed twice with 5-ml portions of dis-tilled water. The washings are combined with the supernatantfluid from the final resin binding, and this solution is evap-orated to dryness at 40 C in a stream of filtered air. This frac-tion contains the alditols formed from the neutral sugars of thepolysaccharide. The alditols are further dried by storage for12 hr in a vacuum desiccator over phosphorous pentoxide priorto acetylation.
Lactonization and Reduction of the Aldonic Acids. Thealdonic acids which have been formed on reduction of theuronic acids remain bound to the Dowex-1 resin during thewater wash with which the alditols are removed. The aldonicacids are eluted from the washed resin by suspending eachwashed resin pellet in 2 ml of 1.0 N HCI and stirring for ap-proximately 30 min at room temperature. The resin is thenremoved by filtration through glass fiber paper (WhatmanGFA). The filtrates containing the eluted material from thetwo resin pellets of each sample are combined and evaporatedto dryness at 40 C in a stream of filtered air. This evaporationof the 1.0 N HCl solution serves to convert the aldonic acidsto aldonolactones. The dried residue is then stored 12 hr in avacuum desiccator in the presence of KOH pellets to removeresidual HCl.The aldonolactones are reduced to the corresponding aldi-
tols in the following fashion: the dried samples are dissolvedin several drops of10 mm sodium borate, pH 7.5, and10 mgof sodium borohydride in 0.5 ml of the borate buffer is addedto each sample. The reduction reaction is permitted to pro-ceed for1 hr at room temperature, after which the remainingsodium borohydride is decomposed by the dropwise additionof glacial acetic acid until effervescence has ceased. Theacidified solutions are then evaporated to dryness at 40 C in astream of filtered air. Five 1-ml portions of 10% (w/v) aceticacid in methanol are added to each sample and evaporatedto ensure removal of boric acid. The residue remaining afterthis drying step contains the alditols formed from the uronicacids of the polysaccharide. Prior to acetylation, the samplesare stored 12 hr in a vacuum desiccator to remove any re-maining moisture.
Acetylation. The alditols formed from the neutral sugarfraction of the sample and from the uronic acid portion areconverted separately to the corresponding peracetyl deriva-tives. Approximately 0.5 ml of acetic anhydride (Fisher Sci-entific Co., reagent grade) is added to each sample. The testtubes aresealed. and the reaction mixtures are incubated for3
928 Plant Physiol. Vol. 49, 1972
www.plantphysiol.orgon May 16, 2018 - Published by Downloaded from Copyright © 1972 American Society of Plant Biologists. All rights reserved.
ALDOSES AND URONIC ACIDS OF CELL WALLS
hr at 121 C in an autoclave. The sodium acetate remainingafter the removal of the boric acid serves as a basic catalyst forthe acetylation reaction (4). After the acetylation is complete,the samples are transferred to 1-ml serum vials, and the vialsare stoppered with rubber caps which have been thoroughlywashed with acetic anhydride. The acetic anhydride solutionsof the alditol acetate mixtures are stored at -20 C until theyare injected into the gas chromatograph.Gas Chromatography. Separation of the alditol acetates
formed from the components of cell wall polysaccharides canbe achieved with 1 1jl injections of the derivatives in aceticanhydride solution. The column material and conditions em-ployed are similar to those described by Albersheim et al. (4).The column material is a liquid phase consisting of 0.2%(poly)ethylene glycol adipate, 0.2% (poly)ethylene glycol suc-cinate, and 0.4% XF-1 150 silicone oil coated on Gas-ChromP (100-200 mesh) by means of a "Hi-Eff" fluidizer (32). Boththe fluidizer and the components of the column material areavailable from Applied Science Laboratories. Approximately1.2 g of this material is packed by vibration into each of two4 foot by 1/8 inch outside diameter copper columns. One columnis used for analysis; the other is employed as a balancing col-umn to compensate for "bleeding" of the liquid phase. Col-umns are conditioned approximately 2 hr at 180 C prior touse. Gas chromatography has been carried out using two F &M Scientific Corp. Model 810 instruments and a Hewlett-Packard Corp. Model 7620 instrument. Electrometer set-tings are range 10 and attenuation 1. Dual hydrogen flamedetectors are operated using either oxygen or compressed air.
For the analysis of the alditol acetates formed from theneutral sugars, the following temperature program is em-ployed: 7 min postinjection hold at 120 C, followed by alinear 1 C per min temperature rise to 180 C. The temperatureis then maintained at 180 C for approximately 6 min or untilthe elution of the final sample component, myoinositol hexa-acetate, is completed. For the analysis of the alditol acetatesformed from the uronic acids, a linear temperature rise of1 C per min from 150 to 180 C is employed with an approx-imately 6 min hold at the upper temperature limit. For bothtypes of analysis, a helium carrier gas flow of 90 ml per minis maintained. The injection port temperature is 190 C, andthe dual hydrogen flame ionization detector temperature is240 C. Traces of oxygen are removed from the carrier gas bypassage over copper wire heated to 400 C. This proceduresignificantly increases the useful life of the column material,permitting up to 150 samples to be analyzed using a single pairof columns. Millivolt electrometer output is recorded on a5-mv strip chart recorder. In addition, electrometer outputis recorded on magnetic tape for subsequent electronic integra-tion of peak areas.
Integration of Peak Areas and Data Reduction. The milli-volt output from each gas chromatograph electrometer is con-verted to an analog signal and recorded on magnetic tape bymeans of an Infotronics Corp. Model CRS-43R1D recorder.The tape on which the data has been recorded is then playedback through an Infotronics Corp. Model CRS-1 lHS/42 in-tegrator equipped with an interval timer. Area values for 6-second segments of the chromatogram are transferred topunched cards by means of an IBM Corp. Model 029 keypunch which is driven by the integrator. The data cards arethen processed batchwise on a Control Data Corp. 6400 com-puter using a simple Fortran IV program (SUGAR) whichwas prepared for this purpose by University of ColoradoComputing Center Staff. SUGAR performs the following op-erations: a baseline is computed for each 6-sec chromatogramsegment and the area below this baseline is subtracted fromeach segment area. Peak beginnings and endings are defined
by changes in the first derivative between adjacent segmentsof the curve and the area segments across a peak are summedto yield total peak area. Component peaks are identified bytheir retention times relative to the retention time of an in-ternal standard peak: myoinositol hexaacetate for neutral sugaranalysis, mannitol hexaacetate for uronic acids.The area of each component peak is then divided by the
area of the internal standard peak to yield an area expressionwhich is independent of injection size. Subsequent computercalculations reflect experimentally determined recovery fac-tors for each of the components and the weight of the cell wallsample used in each experiment. Output data are presentedin tabular form for each sample and include percentage com-position of the sample.
Recovery factors for each of the neutral sugars and uronicacids commonly found in cell wall polysaccharides are de-termined by computing sugar to internal standard area ratiosfor chromatograms of a large number of samples containing1 mg of each of the sugars and the appropriate internal stand-ard. Standard compounds were obtained as follows: L-rham-nose, L-fucose, L-arabinose, D-xylose, D-mannose, and D-galac-tose from Sigma Chemical Co. D-Galacturonic acid mono-hydrate was obtained from Pfanstiel Laboratories, Inc. D-Glu-cose was purchased from J. T. Baker and Co.; D-glucuronicacid, from Pierce Chemical Co. D-Apiose and 4-O-methyl-D-glucuronic acid were the generous gifts of Dr. David Hartof Michigan State University and Dr. G. 0. Aspinall of TrentUniversity, respectively. All standard compounds were stored72 hr in a vacuum oven at 50 C to remove residual moisturebefore weighing.
Reducing sugar determinations were carried out using theNelson-Somogyi procedure (42, 60). Citrus polygalacturonicacid was the generous gift of Sunkist Growers, Ontario, Cal-ifornia.
RESULTS
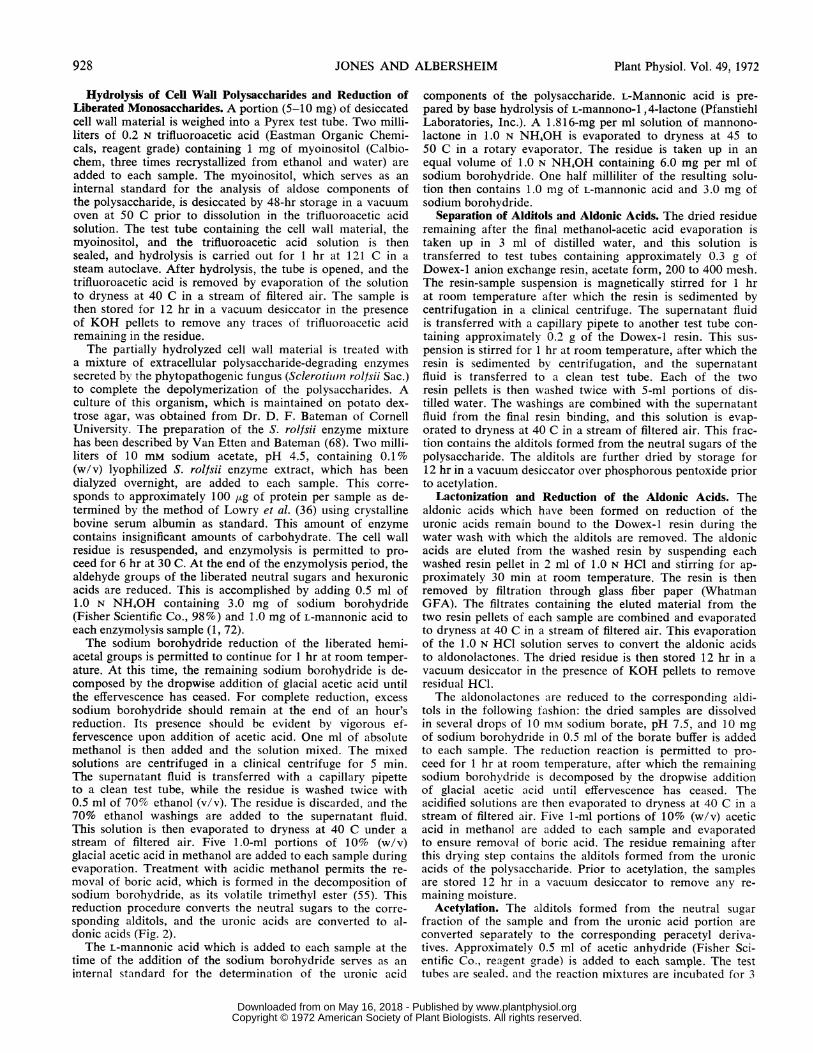
The dual flame ionization detector response for a 1-,ul in-jection of an acetic anhydride solution containing the alditolacetate derivatives prepared from 1 jug each of L-mannonicacid, D-galacturonic acid, and D-glucuronic acid is illustrated inFigure 3. The derivatives are, respectively, mannitol hexa-acetate, dulcitol hexaacetate, and sorbitol hexaacetate whichhave been prepared and separated from the derivatives of theneutral sugars by the procedures described under "Materialsand Methods." The chromatogram shown is typical of theseparation of the derivatives which is routinely achieved us-ing the chromatographic conditions described. The derivativeformed from 4-O-methyl-D-glucuronic acid, 4-0-methyl-sorbitolpentaacetate, which is not present in the sample shown inFigure 3, is eluted from the column between the hexaacetatesof mannitol and dulcitol.The detector response for a 1-,d injection of an acetic an-
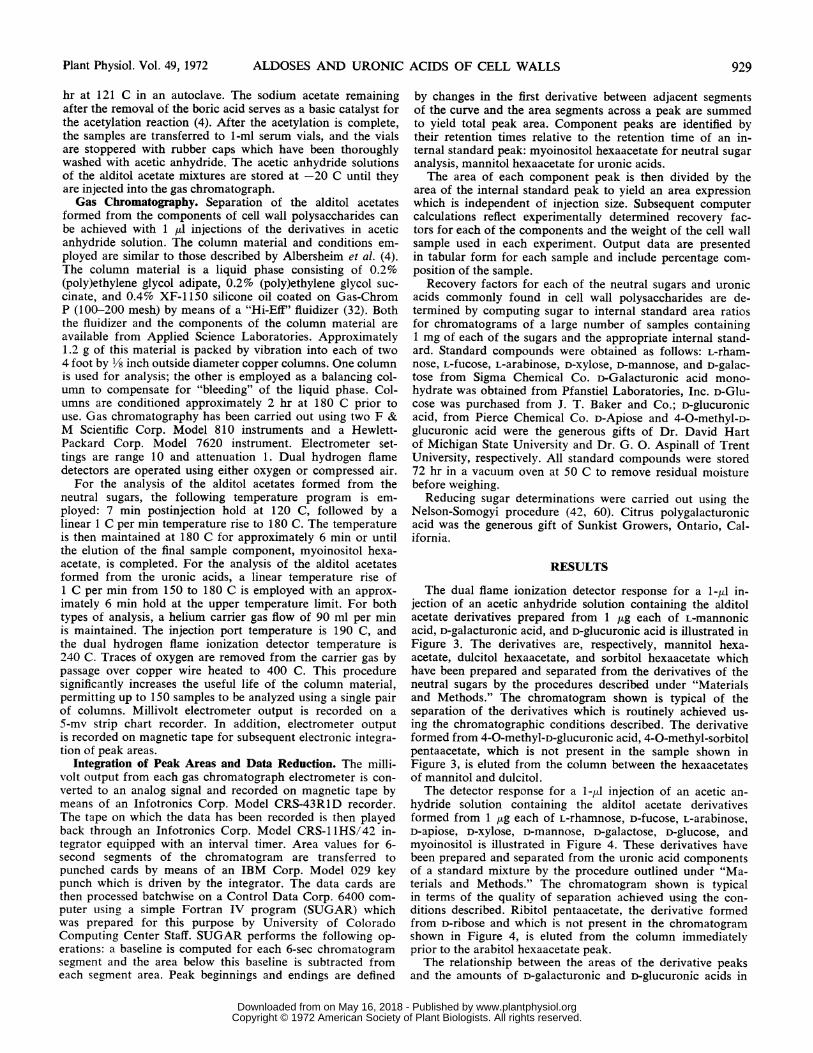
hydride solution containing the alditol acetate derivativesformed from 1 jug each of L-rhamnose, D-fucose, L-arabinose,D-apiose, D-xylose, D-mannose, D-galactose, D-glucose, andmyoinositol is illustrated in Figure 4. These derivatives havebeen prepared and separated from the uronic acid componentsof a standard mixture by the procedure outlined under "Ma-terials and Methods." The chromatogram shown is typicalin terms of the quality of separation achieved using the con-ditions described. Ribitol pentaacetate, the derivative formedfrom D-ribose and which is not present in the chromatogramshown in Figure 4, is eluted from the column immediatelyprior to the arabitol hexaacetate peak.The relationship between the areas of the derivative peaks
and the amounts of D-galacturonic and n-glucuromnc acids in
Plant Physiol. Vol. 49, 1972 929
www.plantphysiol.orgon May 16, 2018 - Published by Downloaded from Copyright © 1972 American Society of Plant Biologists. All rights reserved.
JONES AND ALBERSHEIM
GALACTURONICACID
MANNONIC GLUCURCONICACID ACID
150-, 1600 170- 10o
FIG. 3. Detector response for a 1-,u injection of an acetic an-hydride solution containing the alditol acetates formed from 1 ,ugeach of L-mannonic acid, D-galacturonic acid, and D-glucuronicacid. These derivatives have been prepared and separated from thealdose derivatives by the procedure described under "Materialsand Methods." Gas chromatography has been carried out as de-scribed for the analysis of uronic acids. Full scale response on thestrip chart recorder represents 5 mv.
120o° 1205 130o 1400 15too
J160 170' 180°
for the two compounds. It has been shown, by following thedisappearance of free reducing groups from the sample solu-tion, that the reduction of both D-galacturonic acid andD-glucuronic acid to the corresponding aldonic acids is com-plete in less than 1 hr when the reaction conditions are thosedescribed under "Materials and Methods." It has also beenobserved that no detectable reduction of the uronic acids tothe alditols occurs during the first sodium borohydride treat-ment. The efficiency of the binding procedure was testedusing D-galacturonic and D-glucuronic acids because of theease with which reducing group equivalents remaining in solu-tion could be determined. It is possible to demonstrate thatmore than 95% of each of the two uronic acids is removedfrom sample solutions containing up to 50 ,tmoles of totaluronic acid in the two Dowex-1 binding steps under the con-ditions described under "Materials and Methods." Likewise,it has been observed that the removal of the acids from theresin with 1 N HCI is complete.
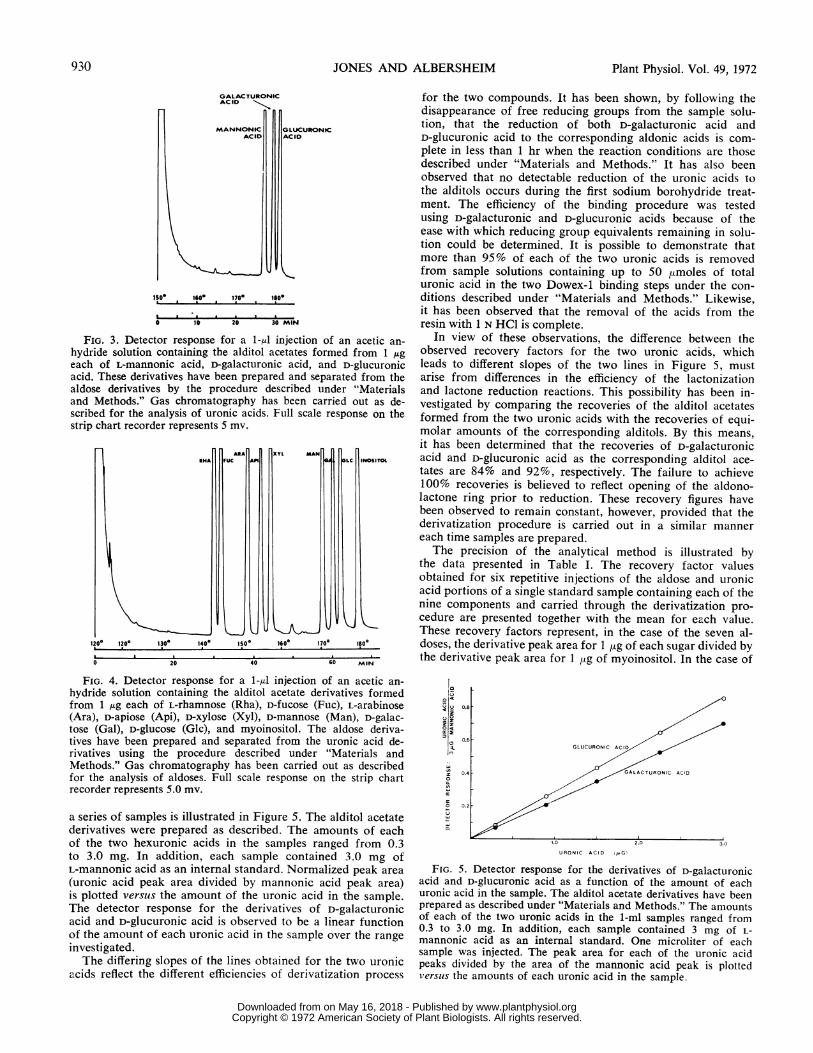
In view of these observations, the difference between theobserved recovery factors for the two uronic acids, whichleads to different slopes of the two lines in Figure 5, mustarise from differences in the efficiency of the lactonizationand lactone reduction reactions. This possibility has been in-vestigated by comparing the recoveries of the alditol acetatesformed from the two uronic acids with the recoveries of equi-molar amounts of the corresponding alditols. By this means,it has been determined that the recoveries of D-galacturonicacid and D-glucuronic acid as the corresponding alditol ace-tates are 84% and 92%, respectively. The failure to achieve100% recoveries is believed to reflect opening of the aldono-lactone ring prior to reduction. These recovery figures havebeen observed to remain constant, however, provided that thederivatization procedure is carried out in a similar mannereach time samples are prepared.The precision of the analytical method is illustrated by
the data presented in Table I. The recovery factor valuesobtained for six repetitive injections of the aldose and uronicacid portions of a single standard sample containing each of thenine components and carried through the derivatization pro-cedure are presented together with the mean for each value.These recovery factors represent, in the case of the seven al-doses, the derivative peak area for 1 ,ug of each sugar divided bythe derivative peak area for 1 ltg of myoinositol. In the case of
FIG. 4. Detector response for a 1-id injection of an acetic an-hydride solution containing the alditol acetate derivatives formedfrom 1 ,ug each of L-rhamnose (Rha), D-fucose (Fuc), L-arabinose(Ara), D-apiose (Api), D-xylose (Xyl), D-mannose (Man), D-galac-tose (Gal), D-glucose (Glc), and myoinositol. The aldose deriva-tives have been prepared and separated from the uronic acid de-rivatives using the procedure described under "Materials andMethods." Gas chromatography has been carried out as describedfor the analysis of aldoses. Full scale response on the strip chartrecorder represents 5.0 mv.
a series of samples is illustrated in Figure 5. The alditol acetatederivatives were prepared as described. The amounts of eachof the two hexuronic acids in the samples ranged from 0.3to 3.0 mg. In addition, each sample contained 3.0 mg ofL-mannonic acid as an internal standard. Normalized peak area(uronic acid peak area divided by mannonic acid peak area)is plotted versus the amount of the uronic acid in the sample.The detector response for the derivatives of D-galacturonicacid and D-glucuronic acid is observed to be a linear functionof the amount of each uronic acid in the sample over the rangeinvestigated.The differing slopes of the lines obtained for the two uronic
acids reflect the different efficiencies of derivatization process
0 0.6
z 0.4 GALACTURONIC ACID
C 0
0.2 /
1.0 2.0 3.0
URONIC ACID kHG)
FIG. 5. Detector response for the derivatives of D-galacturonicacid and D-glucuronic acid as a function of the amount of eachuronic acid in the sample. The alditol acetate derivatives have beenprepared as described under "Materials and Methods." The amountsof each of the two uronic acids in the 1-ml samples ranged from0.3 to 3.0 mg. In addition, each sample contained 3 mg of L-mannonic acid as an internal standard. One microliter of eachsample was injected. The peak area for each of the uronic acidpeaks divided by the area of the mannonic acid peak is plottedversus the amounts of each uronic acid in the sample.
FIL
Al]
i
1
930 Plant Physiol. Vol. 49, 1972
IAPFUC cLC
www.plantphysiol.orgon May 16, 2018 - Published by Downloaded from Copyright © 1972 American Society of Plant Biologists. All rights reserved.
ALDOSES AND URONIC ACIDS OF CELL WALLS
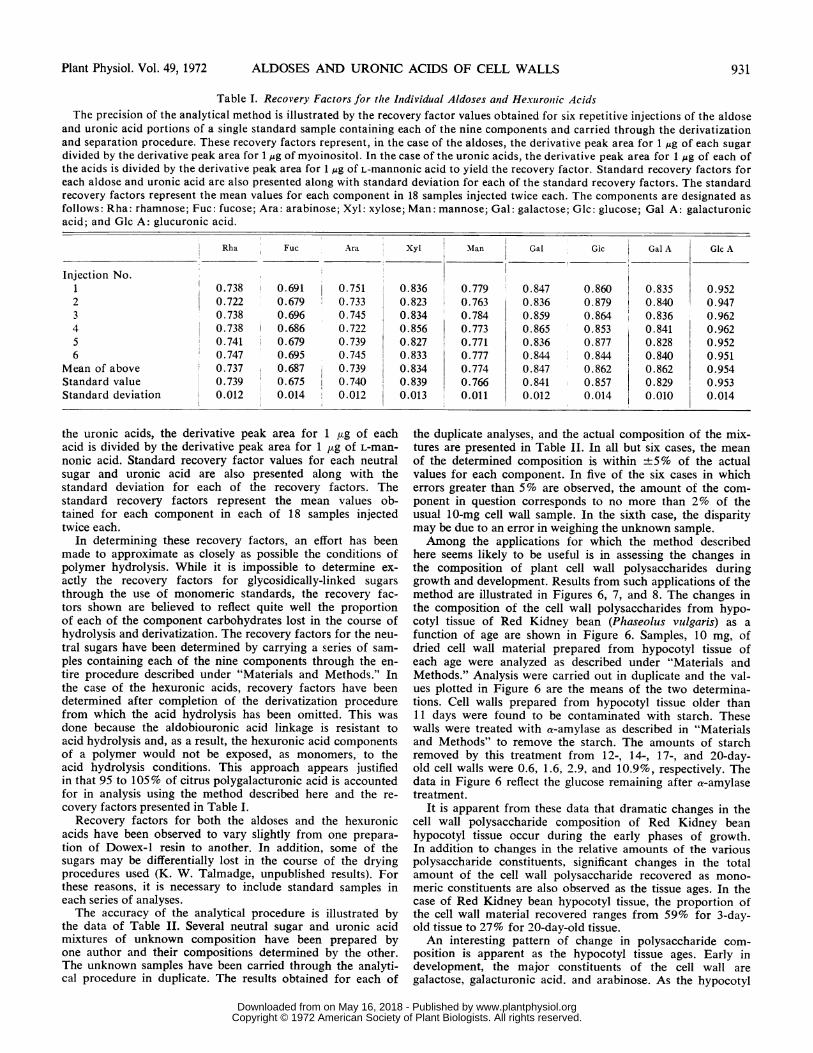
Table I. Recovery Factors for the Individual Aldoses anid Hexutroniic AcidsThe precision of the analytical method is illustrated by the recovery factor values obtained for six repetitive injections of the aldose
and uronic acid portions of a single standard sample containing each of the nine components and carried through the derivatizationand separation procedure. These recovery factors represent, in the case of the aldoses, the derivative peak area for 1 ,Ag of each sugardivided by the derivative peak area for 1 ,ug of myoinositol. In the case of the uronic acids, the derivative peak area for 1 ,ug of each ofthe acids is divided by the derivative peak area for 1 ,ug of L-mannonic acid to yield the recovery factor. Standard recovery factors foreach aldose and uronic acid are also presented along with standard deviation for each of the standard recovery factors. The standardrecovery factors represent the mean values for each component in 18 samples injected twice each. The components are designated asfollows: Rha: rhamnose; Fuc: fucose; Ara: arabinose; Xyl: xylose; Man: mannose; Gal: galactose; Glc: glucose; Gal A: galacturonicacid; and Glc A: glucuronic acid.
Rha Fuc Ara Xyl Man Gal Gic Gal A Glc A
Injection No.1 0.738 0.691 0.751 0.836 0.779 0.847 0.860 0.835 0.9522 0.722 0.679 0.733 0.823 0.763 0.836 0.879 0.840 0.9473 0.738 0.696 0.745 0.834 0.784 0.859 0.864 0.836 0.9624 0.738 0.686 0.722 0.856 0.773 0.865 0.853 0.841 0.9625 0.741 0.679 0.739 0.827 0.771 0.836 0.877 0.828 0.9526 0.747 0.695 0.745 0.833 0.777 0.844 0.844 0.840 0.951
Mean of above 0.737 0.687 0.739 0.834 0.774 0.847 0.862 0.862 0.954Standard value 0.739 0.675 0.740 0.839 0.766 0.841 0.857 0.829 0.953Standard deviation 0.012 0.014 0.012 0.013 0.011 0.012 0.014 0.010 0.014
the uronic acids, the derivative peak area for 1 ,ug of eachacid is divided by the derivative peak area for 1 ,ug of L-man-nonic acid. Standard recovery factor values for each neutralsugar and uronic acid are also presented along with thestandard deviation for each of the recovery factors. Thestandard recovery factors represent the mean values ob-tained for each component in each of 18 samples injectedtwice each.
In determining these recovery factors, an effort has beenmade to approximate as closely as possible the conditions ofpolymer hydrolysis. While it is impossible to determine ex-actly the recovery factors for glycosidically-linked sugarsthrough the use of monomeric standards, the recovery fac-tors shown are believed to reflect quite well the proportionof each of the component carbohydrates lost in the course ofhydrolysis and derivatization. The recovery factors for the neu-tral sugars have been determined by carrying a series of sam-ples containing each of the nine components through the en-tire procedure described under "Materials and Methods." Inthe case of the hexuronic acids, recovery factors have beendetermined after completion of the derivatization procedurefrom which the acid hydrolysis has been omitted. This wasdone because the aldobiouronic acid linkage is resistant toacid hydrolysis and, as a result, the hexuronic acid componentsof a polymer would not be exposed, as monomers, to theacid hydrolysis conditions. This approach appears justifiedin that 95 to 105% of citrus polygalacturonic acid is accountedfor in analysis using the method described here and the re-covery factors presented in Table I.
Recovery factors for both the aldoses and the hexuronicacids have been observed to vary slightly from one prepara-tion of Dowex-I resin to another. In addition, some of thesugars may be differentially lost in the course of the dryingprocedures used (K. W. Talmadge, unpublished results). Forthese reasons, it is necessary to include standard samples ineach series of analyses.
The accuracy of the analytical procedure is illustrated bythe data of Table II. Several neutral sugar and uronic acidmixtures of unknown composition have been prepared byone author and their compositions determined by the other.The unknown samples have been carried through the analyti-cal procedure in duplicate. The results obtained for each of
the duplicate analyses, and the actual composition of the mix-tures are presented in Table II. In all but six cases, the meanof the determined composition is within +5% of the actualvalues for each component. In five of the six cases in whicherrors greater than 5% are observed, the amount of the com-ponent in question corresponds to no more than 2% of theusual 10-mg cell wall sample. In the sixth case, the disparitymay be due to an error in weighing the unknown sample.Among the applications for which the method described
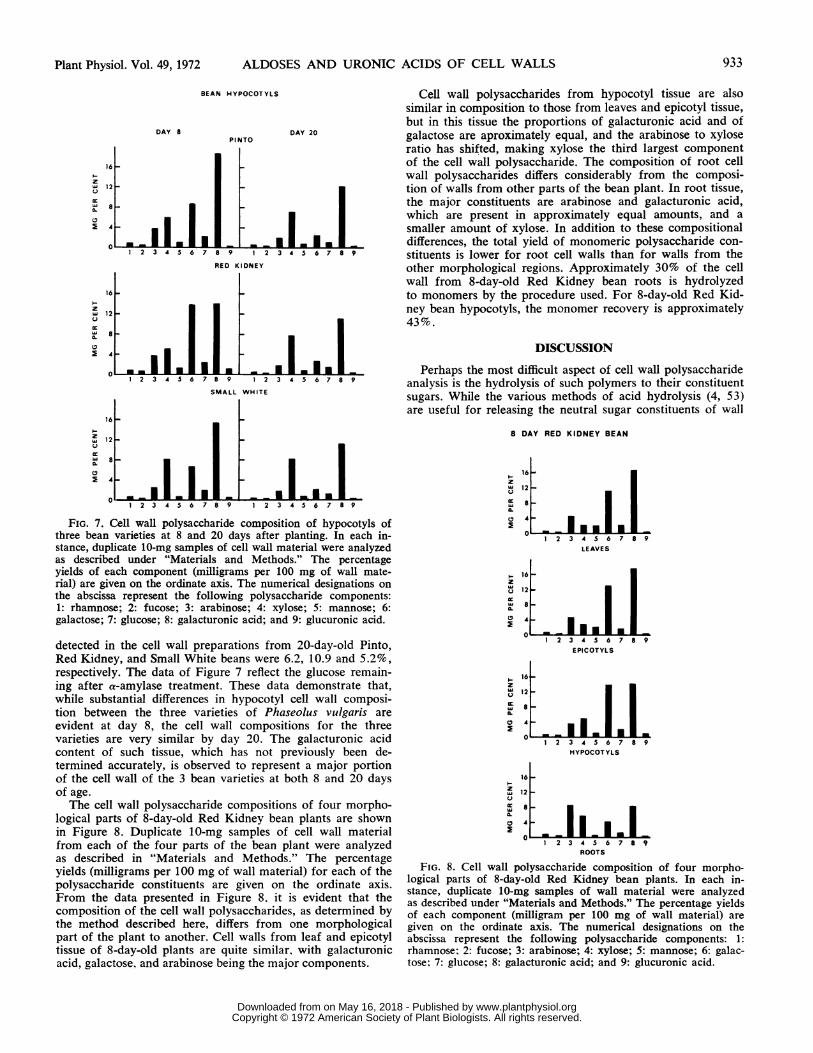
here seems likely to be useful is in assessing the changes inthe composition of plant cell wall polysaccharides duringgrowth and development. Results from such applications of themethod are illustrated in Figures 6, 7, and 8. The changes inthe composition of the cell wall polysaccharides from hypo-cotyl tissue of Red Kidney bean (Phaseolus vulgaris) as afunction of age are shown in Figure 6. Samples, 10 mg, ofdried cell wall material prepared from hypocotyl tissue ofeach age were analyzed as described under "Materials andMethods." Analysis were carried out in duplicate and the val-ues plotted in Figure 6 are the means of the two determina-tions. Cell walls prepared from hypocotyl tissue older than11 days were found to be contaminated with starch. Thesewalls were treated with a-amylase as described in "Materialsand Methods" to remove the starch. The amounts of starchremoved by this treatment from 12-, 14-, 17-, and 20-day-old cell walls were 0.6, 1.6, 2.9, and 10.9%, respectively. Thedata in Figure 6 reflect the glucose remaining after a-amylasetreatment.
It is apparent from these data that dramatic changes in thecell wall polysaccharide composition of Red Kidney beanhypocotyl tissue occur during the early phases of growth.In addition to changes in the relative amounts of the variouspolysaccharide constituents, significant changes in the totalamount of the cell wall polysaccharide recovered as mono-meric constituents are also observed as the tissue ages. In thecase of Red Kidney bean hypocotyl tissue, the proportion ofthe cell wall material recovered ranges from 59% for 3-day-old tissue to 27% for 20-day-old tissue.An interesting pattern of change in polysaccharide com-
position is apparent as the hypocotyl tissue ages. Early indevelopment, the major constituents of the cell wall aregalactose, galacturonic acid. and arabinose. As the hypocotyl
Plant Physiol. Vol. 49, 1972 931
www.plantphysiol.orgon May 16, 2018 - Published by Downloaded from Copyright © 1972 American Society of Plant Biologists. All rights reserved.
JONES AND ALBERSHEIM
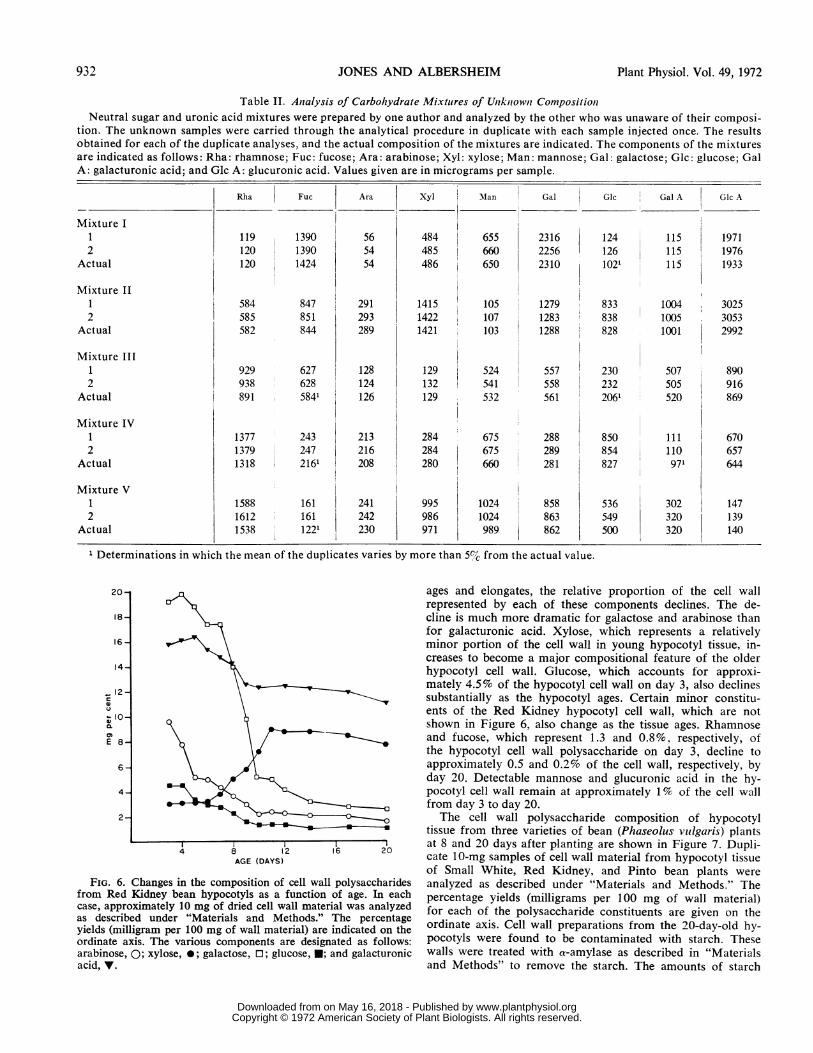
Table II. Anialysis of Carbohydrate Mixtures of Unzkniownt CompositioniNeutral sugar and uronic acid mixtures were prepared by one author and analyzed by the other who was unaware of their composi-
tion. The unknown samples were carried through the analytical procedure in duplicate with each sample injected once. The resultsobtained for each of the duplicate analyses, and the actual composition of the mixtures are indicated. The components of the mixturesare indicated as follows: Rha: rhamnose; Fuc: fucose; Ara: arabinose; Xyl: xylose; Man: mannose; Gal: galactose; Glc: glucose; GalA: galacturonic acid; and Glc A: glucuronic acid. Values given are in micrograms per sample.
Rha
119120120
Fuc
139013901424
584 847585 851582 844
929938891
137713791318
158816121538
6276285841
243247216'
1611611221
Ara
565454
291293289
128124126
213216208
241242230
Xyl
484485486
141514221421
129132129
284284280
995986971
Man
655660650
105107103
524541532
675675660
10241024989
Gal Glc Gal A Glc A
2316 124 115 19712256 126 115 19762310 1021 115 1933
1279 833 1004 30251283 838 1005 30531288 828 1001 2992
557558561
288289281
858863862
230232206'
850854827
536549500
I Determinations in which the mean of the duplicates varies by more than 5%c from the actual value.
507505520
111110971
302320320
20
18
16-
14-
2
10
E 8
6
4-
2
4 8 12AGE (DAYS)
FIG. 6. Changes in the composition of cell wallfrom Red Kidney bean hypocotyls as a functioncase, approximately 10 mg of dried cell wall materas described under "Materials and Methods."yields (milligram per 100 mg of wall material) areordinate axis. The various components are designarabinose, 0; xylose, *; galactose, 0; glucose, *;acid, V.
ages and elongates, the relative proportion of the cell wallrepresented by each of these components declines. The de-cline is much more dramatic for galactose and arabinose thanfor galacturonic acid. Xylose, which represents a relativelyminor portion of the cell wall in young hypocotyl tissue, in-creases to become a major compositional feature of the olderhypocotyl cell wall. Glucose, which accounts for approxi-mately 4.5% of the hypocotyl cell wall on day 3, also declinessubstantially as the hypocotyl ages. Certain minor constitu-ents of the Red Kidney hypocotyl cell wall, which are notshown in Figure 6, also change as the tissue ages. Rhamnoseand fucose, which represent 1.3 and 0.8%. respectively, ofthe hypocotyl cell wall polysaccharide on day 3, decline toapproximately 0.5 and 0.2% of the cell wall, respectively, byday 20. Detectable mannose and glucuronic acid in the hy-pocotyl cell wall remain at approximately 1% of the cell wallfrom day 3 to day 20.The cell wall polysaccharide composition of hypocotyl
tissue from three varieties of bean (Phaseolus vulgaris) plantsand 20 days after planting are shown in Figure 7. Dupli-16 20 cate 10-mg samples of cell wall material from hypocotyl tissue
of Small White, Red Kidney, and Pinto bean plants werepolysaccharides analyzed as described under "Materials and Methods." Theof age. In each percentage yields (milligrams per 100 mg of wall material)ial was analyzed for each of the polysaccharide constituents are given on theThe percentage ordinate axis. Cell wall preparations from the 20-day-old hy-iated as follows pocotyls were found to be contaminated with starch. Theseand galacturonic walls were treated with a-amylase as described in "Materials
and Methods" to remove the starch. The amounts of starch
Mixture I12
Actual
Mixture II12
Actual
Mixture III12
Actual
Mixture IV12
Actual
Mixture V12
Actual
890916869
670657644
147139140
932 Plant Physiol. Vol. 49, 1972
www.plantphysiol.orgon May 16, 2018 - Published by Downloaded from Copyright © 1972 American Society of Plant Biologists. All rights reserved.
ALDOSES AND URONIC ACIDS OF CELL WALLS
BEAN HYPOCOTYLS
DAY 8
-M1.III
PINTO
IDAY 20
.1 laI1 2 3 4 5 6 7 8 9 1 2 3 4 5 6 7 8 9
RED KIDNEY
16-
12
48 ..E.IiK2E-EI.1 2 3 4 S6 7 8 9 1 2 3 4 W 6 7 8 9
SMA LL WH ITE
12 [L
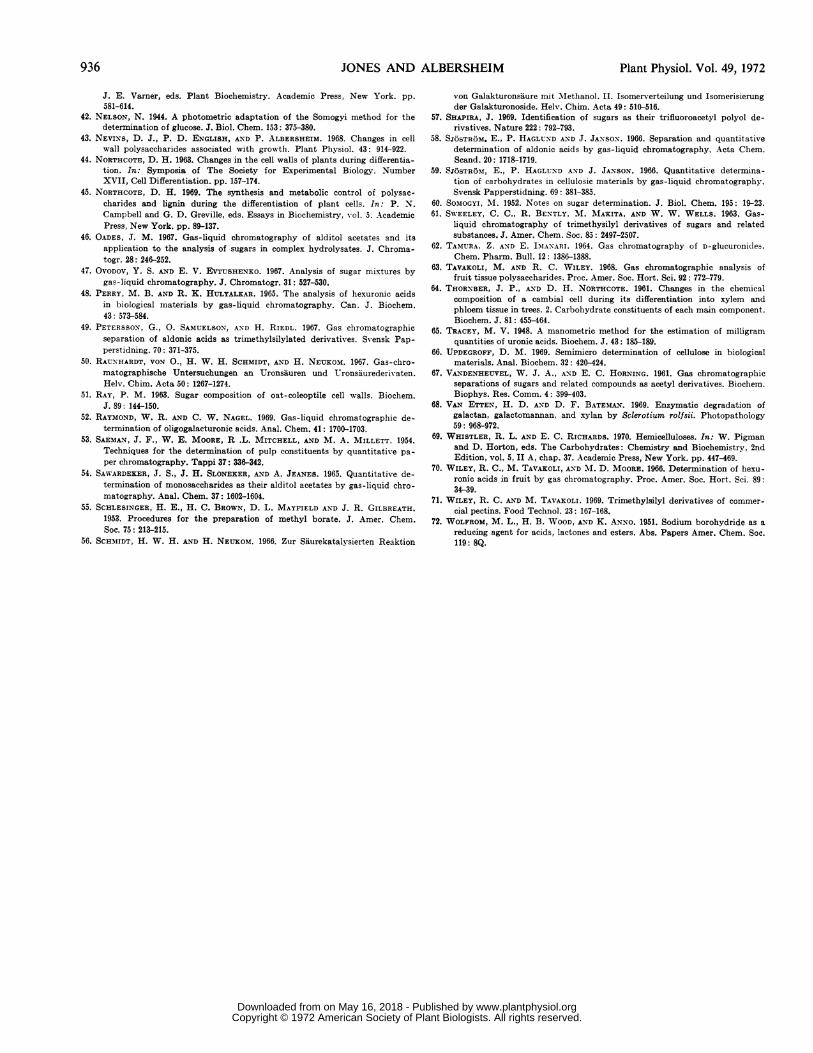
Cell wall polysaccharides from hypocotyl tissue are alsosimilar in composition to those from leaves and epicotyl tissue,but in this tissue the proportions of galacturonic acid and ofgalactose are aproximately equal, and the arabinose to xyloseratio has shifted, making xylose the third largest componentof the cell wall polysaccharide. The composition of root cellwall polysaccharides differs considerably from the composi-tion of walls from other parts of the bean plant. In root tissue,the major constituents are arabinose and galacturonic acid,which are present in approximately equal amounts, and asmaller amount of xylose. In addition to these compositionaldifferences, the total yield of monomeric polysaccharide con-stituents is lower for root cell walls than for walls from theother morphological regions. Approximately 30% of the cellwall from 8-day-old Red Kidney bean roots is hydrolyzedto monomers by the procedure used. For 8-day-old Red Kid-ney bean hypocotyls, the monomer recovery is approximately43%.
DISCUSSION
Perhaps the most difficult aspect of cell wall polysaccharideanalysis is the hydrolysis of such polymers to their constituentsugars. While the various methods of acid hydrolysis (4, 53)are useful for releasing the neutral sugar constituents of wall
8 DAY RED KIDNEY BEAN
16zw 12
i 8
4
1 2 3 4 5 6 7 8 9 1 2 3 4 5 6 7 8 9
FIG. 7. Cell wall polysaccharide composition of hypocotyls ofthree bean varieties at 8 and 20 days after planting. In each in-stance, duplicate 10-mg samples of cell wall material were analyzedas described under "Materials and Methods." The percentageyields of each component (milligrams per 100 mg of wall mate-rial) are given on the ordinate axis. The numerical designations onthe abscissa represent the following polysaccharide components:1: rhamnose; 2: fucose; 3: arabinose; 4: xylose; 5: mannose; 6:galactose; 7: glucose; 8: galacturonic acid; and 9: glucuronic acid.
detected in the cell wall preparations from 20-day-old Pinto,Red Kidney, and Small White beans were 6.2, 10.9 and 5.2%,respectively. The data of Figure 7 reflect the glucose remain-ing after a-amylase treatment. These data demonstrate that,while substantial differences in hypocotyl cell wall composi-tion between the three varieties of Phaseolus vulgaris areevident at day 8, the cell wall compositions for the threevarieties are very similar by day 20. The galacturonic acidcontent of such tissue, which has not previously been de-termined accurately, is observed to represent a major portionof the cell wall of the 3 bean varieties at both 8 and 20 daysof age.The cell wall polysaccharide compositions of four morpho-
logical parts of 8-day-old Red Kidney bean plants are shownin Figure 8. Duplicate 10-mg samples of cell wall materialfrom each of the four parts of the bean plant were analyzedas described in "Materials and Methods." The percentageyields (milligrams per 100 mg of wall material) for each of thepolysaccharide constituents are given on the ordinate axis.From the data presented in Figure 8. it is evident that thecomposition of the cell wall polysaccharides, as determined bythe method described here, differs from one morphologicalpart of the plant to another. Cell walls from leaf and epicotyltissue of 8-day-old plants are quite similar, with galacturonicacid, galactose, and arabinose being the major components.
zLLI
UJ
I,-
z
..
cc.
lU
12
1 2 3 4 S 6 7 8 9LEAVES
16 -
12-
4 - I I 0.
1 2 3 4 S 6 7 8 9
EPICOTYLS
16 -
2 -
HIYPOCOTYLS
16-
2-
48 LLL1 2 3 4 5 6 7 8 9
ROOTS
FIG. 8. Cell wall polysaccharide composition of four morpho-logical parts of 8-day-old Red Kidney bean plants. In each in-stance, duplicate 10-mg samples of wall material were analyzedas described under "Materials and Methods." The percentage yieldsof each component (milligram per 100 mg of wall material) aregiven on the ordinate axis. The numerical designations on theabscissa represent the following polysaccharide components: 1:rhamnose: 2: fucose; 3: arabinose; 4: xylose; 5: mannose; 6: galac-tose; 7: glucose; 8: galacturonic acid; and 9: glucuronic acid.
16
z..12Zi a
CL
I)7t 4
Z
U
zU
IL
IN.'.'
933Plant Physiol. Vol. 49, 1972
l,
II
www.plantphysiol.orgon May 16, 2018 - Published by Downloaded from Copyright © 1972 American Society of Plant Biologists. All rights reserved.

934 JONES AND ALBERSHEIM
polysaccharides, these methods are less than adequate for usein uronic acid analysis. The difficulties in hydrolysis of uro-nide-containing polysaccharides for analytical purposes stemfrom the chemical properties of this class of compounds.Among these is the unusual resistance of aldobiouronic acidsto acid hydrolysis. This phenomenon, which has yet to becompletely explained, is believed to result from steric factorswhich render difficult the formation of the partially planarcarbonium ion intermediate in the hydrolysis reaction (10).For this reason, relatively strong acids, high temperaturesand/or extended treatments are necessary for the hydrolysisof uronide-containing polysaccharides (53). Such extreme con-ditions, however, lead to various side reactions involving thehexuronic acids once they are liberated from the polymer.Decarboxylation (65) and lactonization (12) are known tooccur under such conditions, and can lead to difficulties inestimating the uronic acid composition of hydrolytic digests.Degradation of neutral sugar polysaccharide components isalso a problem under such conditions (4). When hydrolysisconditions sufficiently mild to minimize such side reactionsare employed, incomplete hydrolysis of aldobiouronic acidsand such crystallne polysaccharides as cellulose often results.
For these reasons, it was decided to investigate enzymaticmethods of degrading cell wall polysaccharides. The extra-cellular enzyme mixture secreted by Sclerotiumn rolfsii Sac.has been found to provide a partial solution to the problemsof cell wall polysaccharide hydrolysis. This fungus, whichattacks a wide variety of hosts, produces a broad spectrumof polysaccharide-degrading enzymes (68) including a veryactive polygalacturonase which liberates monomeric galac-turonic acid (7). Furthermore, all of the S. rolfsii polysac-charide-degrading enzymes which have been described havesimilar pH optima. No pectic lyase activity is detectable inS. rolfsii extracts. This represents an obvious advantage in us-ing this enzyme source for analytical purposes in that onlymonomeric D-galacturonic acid is liberated in the hydrolysisof galacturonide bonds and not the A4,5 unsaturated prod-uct of the lyase reaction. In addition the fungus is easilymaintained in culture, and preparation of the enzyme mixtureis quite simple.The combination of mild acid hydrolysis followed by en-
zymatic degradation of the wall polysaccharides has beenfound to be most useful for the analysis of the hemicellulosicand pectic components of the cell wall. It appears that theweak acid hydrolysis degrades many of the glycosidic link-ages in the wall polymers and serves to make the pectic poly-saccharides more accessible to enzymatic action since enzy-matic release of galacturonic acid is facilitated by suchpretreatment.
Depolymerization of cell wall polysaccharides by thismethod is not without disadvantages, however. Chief amongthese is incomplete hydrolysis. Yields of some polysaccharidecomponents, e.g., L-rhamnose, are increased by stronger acidhydrolysis, while such treatment reduces the recovery of oth-ers such as L-arabinose. Such relationships between yieldsnecessitate a compromise on hydrolysis conditions to achievereasonable yields of all components. Were all of the enzymesnecessary to degrade plant cell walls to their monomeric con-stituents available in the S. rolfsii extract, such compromisesolutions would not be necessary.
Furthermore, the cellulosic portions of cell wall polysac-charides are not hydrolyzed in this procedure since treatmentwith 0.2 N trifluoracetic acid does not hydrolyze such poly-mers and the S. rolfsii enzyme mixture does not contain theenzymatic components necessary to degrade crystalline cellu-lose to D-glucose. While this is convenient if one is focusinghis analysis on the pectic and hemicellulosic portions of the
wall, the analysis of the cellulosic portions of cell wall poly-saccharides requires alterations of the hydrolysis proceduredescribed here (66).
Notwithstanding the difficulties involved in achieving com-plete hydrolysis of plant cell wall polysaccharides underconditions which permit recovery of the monomeric carbohy-drate constituents, the data on cell wall polysaccharide compo-sition presented in Figures 6, 7, and 8 demonstrate the use-fulness of the method described here in investigations ofplant cell wall polysaccharide composition.The data presented in Figure 6 for the composition of Red
Kidney bean hypocotyl cell walls from 3- to 20-day-old plantsare, in most respects, very similar to the neutral sugar com-positions reported by Nevins et al. (48) for the cell walls fromthe same tissues. The most dramatic changes in the levels ofeach of the cell wall constituents occur between 5 and 10 daysafter planting, the period during which hypocotyl elongationoccurs (48). During this period, the amounts of the polysac-charide components which are characteristic of the primarycell wall (44), galacturonic acid, galactose, arabinose, andrhamnose, decline sharply. The proportion of xylose, generallyconsidered to be a secondary wall component, increases dur-ing this period.The data presented in Figures 7 and 8 are also in agreement
with the neutral sugar compositions of cell walls from 8-and 20-day-old hypocotyl tissue from the three bean varietiesand from the various morphological parts of the 8-day-oldRed Kidney bean plant which have previously been reported(43). The data presented in this report for the galacturonicacid content of the cell walls of these tissues extends the re-sults of the previous study to a new class of compounds andalso permits the characterization of another major portion ofthe cell wall of these tissues.A major difference between the compositions of Red Kid-
ney bean hypocotyl cell walls reported here and those re-ported by Nevins et al. (43) is the failure to detect the largeamounts of glucose observed in the earlier study to be pres-ent in the cell wall polysaccharides of 4- to 9-day-old beanhypocotyls. The results of the present study indicate a glucosecontent of approximately 4% for Red Kidney hypocotyl cellwalls 4 days after planting. Nevins et al. (4) reported a glu-cose content for these walls of approximately 26%. In aneffort to resolve this difference, the cell wall preparation fromday 4 Red Kidney bean hypocotyls used in the present studywas analyzed using the technique employed by Nevins et al.(43). This analysis indicated a glucose content of approxi-mately 5% for these walls.
In view of this result, one can conclude that the largeamounts of glucose detected in the study by Nevins et al.(43) are not present in the cell wall preparations employedin the present study. It should be noted that the experimentalplants in the study by Nevins et al. (43) were kept in thedark for only 10 hr to deplete their starch reserves prior toharvesting and wall preparation. In the present study, allplants were kept 30 hr in the dark prior to harvesting andpreparation of the cell wall material. Even when this treat-ment was used, starch was detected in some wall preparations.In addition, the a-amylase treatment used by Nevins et al.(43) (10 units of enzyme for 10 min at 25 C) appears insuf-ficient to conclude that no starch is present in the cell wallpreparations. In the course of the present study, it has beenobserved that 18 to 24 hr treatment with 56 units of Bacillussubtilis a-amylase is necessary to remove completely thestarch from hypocotyl cell wall preparations. No starch isobserved to have been released after 2 hr treatment. In ad-dition, had Nevins et al. (43) used the I2-KI test to checktheir cell wall polysaccharide preparations for starch con-
934 Plant Physiol. Vol. 49, 1972
www.plantphysiol.orgon May 16, 2018 - Published by Downloaded from Copyright © 1972 American Society of Plant Biologists. All rights reserved.

ALDOSES AND URONIC ACIDS OF CELL WALLS
tamination, these results would also have been misleading ifthe cell walls had not been heated in water before testing forstarch. It has been observed that cell wall preparations whichare contaminated with starch do not give a positive 12-KItest unless they have been heated at 60 C in water for 10min (K. W. Talmadge, unpublished results). When these factsare considered, it appears likely that the large amounts ofglucose reported in the earlier study as part of the cell wall of4- to 9-day-old Red Kidney bean hypocotyls were the resultof contamination of the cell wall preparations with starch.The method of uronic acid analysis described in this re-
port represents an important improvement over color reac-tions, titrimetry, and enzymatic assays in that each of theuronic acid components which can be liberated from higherplant polysaccharides can be resolved and determined quanti-tatively. The ability to determine accurately such minor acidiccomponents as glucuronic acid and 4-0-methyl-glucuronic acidbecomes increasingly important as one turns from the analysisof total cell wall polysaccharide to the analysis of the indi-vidual polymers which comprise the wall. In various xylans,for example, D-glucuronic acid is a major constituent (69).Gas chromatographic analysis of the neutral sugar com-
ponents of plant cell wall polysaccharides as the alditol ace-tate derivatives has become a routine technique in a num-ber of laboratories (6, 13, 14, 16, 21, 25, 27, 68). The methoddescribed here, which extends this technique to encompassuronic acid analysis, retains the features which make gaschromatography of the alditol acetate derivatives attractivefor neutral sugar analysis. The preparation of the derivativesremains straightforward, and only a single derivative is formedfrom each polysaccharide component. In addition, gas chro-matographic column material is available which permits reso-lution of the peracetyl derivatives of all of the common poly-saccharide constituents.
In view of these advantages, and of the modest additionaleffort required to include the uronic acids in the analysis ofwall polysaccharides, it is hoped that the technique describedhere will be useful in establishing the roles of the uronide-containing polymers in the structure and function of the plantcell wall. The analysis of cell wall polysaccharide compositionmay, for example, prove a fruitful method for investigatingsuch questions of plant morphogenesis as the mechanisms ofabscission (2, 38) and of auxin action (18). Such phenomenaas the role of the cell wall and of cell wall-degrading enzymesin plant pathogenesis (5) also seem amenable to clarificationusing the method described here.
LITERATURE CITED
1. ABDEL-AHEER, M., J. K. HAMILTON- AN-D F. SMIITH. 1954. The reduction ofsugars with sodium borohydride. J. Amer. Chem. Soc. 73: 4691-4692.
2. ABELES, F. B. 1969. Abscission: role of cellulase. Plant Physiol. 44: 447-452.3. ALBERSHEIM, P. 1965. The substructure and function of the cell wall. In: J.
Bonner and J. E. Varner, eds. Plant Biochemistry. New York, AcademicPress. pp. 151-186.
4. A.LBERSHEIM, P., D. J. NEVINS, P. D. ENGLISH, AN-D A. KARR. 1967. Amethod for the analysis of sugars in plant cell-wall polysaccharides bygas-liquid chromatography. Carbohyd. Res. 5: 340-345.
5. ALBERSHEIM, P., T. M. JONES, AND P. D. ENGLISH. 1969. Biochemistry ofthe cell wall in relation to infective processes. Annu. Rev. Phytopathol.7: 171-194.
6. AU-RIOL, P., AN-D A. Touza. 1970. Sur les polyosides des parois cellulairesd'organes v6g6taux sains et parasites. Physiol. Veg. 8: 263-275.
7. BATEMAN, D. F. AND S. V. BEER. 1965. Simultaneous production and synergis-tic action of oxalic acid and polygalacturonase during pathogenesis bySclerotium rolfsii. Phytopathology 55: 204-211.
8. BATENu, D. F., T. KOSIJGE, A.ND W. W. KILGORE. 1970. Purification andproperties of uronate dehydrogenase from Pseudomonas syringae. Arch.Biochem. Biophys. 136: 97-105.
9. BATEMAN, D. F. 1970. Depletion of galacturonic acid content in bean hy-pocotyl cell walls during pathogenesis by Rhizoctonia solani and Sclerotiumnrolfsii. Phytopathology 60: 18461847.
10. BEMILLER, J. N. 1967. Acid-catalyzed hydrolysis of glycosides. Advan.Carbohyd. Chem. 22: 25-108.
11. BIsHoP, C. T. 1964. Gas-liquid chromatography of carbohydrate deriva-tives. Advan. Carbohyd. Chem. 19: 95-147.
12. BLAKE, J. D. AND G. N. RICHARDS. 1968. Problems of lactonisation in theanalysis of uronic acids. Carbohyd. Res. 8: 275-281.
13. BLAKE, J. D. AN-D G. N. RiCHARDS. 1970. A critical reexamination of prob-lems inherent in compositional analysis of hemicelluloses by gas-liquidchromatography. Carbohyd. Res. 14: 375-387.
14. BORCHARDT. L. G. AND C. V. PIPER. 1970. A gas chromatographic method forcarbohyc1rates as alditol-acetates. Tappi 53: 257-260.
15. BROWER, H. E., J. E. JEFFERY, AND M. W. FOLSOM. 1966. Gas chromato-graphic sugar analysis in hydrolyzates of wood constituents. Anal. Chem.38: 362-364.
16. BUCHALA, A. J., C. G. FRASER, AND K. C. B. WILKIE. 1971. Quantitativestudies on the polysaccharides in the nonendospermic tissues of the oatplant in relation to growth. Phytochemistry 10: 1285-1291.
17. CHENIINAT, A. AND M. BRI.NI. 1966. Separation par chromatographic enphase gazeuse de quelques monosaccharides. Bull. Soc. Chim. France 80-83.
18. CLELAND, R. 1971. Cell wall extension. Annu. Rev. Plant Physiol. 22: 197-223.19. CROWELL, E. P. AND B. B. BURNETT. 1967. Determination of the carbohy-
drate composition of wood pulps by gas chromatography of the alditolacetates. Anal. Chem. 39: 121-124.
20. DISCHE, A. 1962. Color reactions of carbohydrates. In: R. C. Whistler andM. L. Wolfrom, eds. Methods in Carbohydrate Chemistry, Vol. 1. Aca-demic Press, New York. pp. 477-515.
21. ENGLISH. P. D. AN-D P. ALBERSHEINi. 1969. Host-patlhogen interactions. I. Acorrelation between a-galactosidase production and virulence. Plant Phys-iol. 44: 217-224.
22. ENGLISH. P. D., J. B. JURALE, AN-D P. ALBERSHEIMf. 1971. Host-pathogeniinteractions. II. Parameters affecting polysaccharide-degrading enzyme se-cretion by Colletotrichum lindemuthianum grown in culture. Plant Phys-iol. 47: 1-6.
23. GUNNER, S. W., J. K. N. JONES, AND M. B. PERRY. 1961. The gas-liquidpartition chromatography of carbohydrate derivatives. I. The separationof glycitol and glycose acetates. Can. J. Chem. 39: 1892-1899.
24. GU-NNER, S. W., J. K. N. JONES, AND M. B. PERRY. 1961. Analysis of sugarmixtures by gas-liquid partition chromatography. Chem. Ind. (London).255-256.
25. HOFF, J. E. AND M. D. CASTRO. 1969. Chemical composition of potato cellwall. J. Agr. Food Chem. 17: 1328-1331.
26. HOLLIGAN, P. M. 1971. Routine analysis by gas-liquid chromatography ofsoluble carbohydrates in extracts of plant tissues. I. A review of tech-niques used for the separation, identification and estimation of carbohy-drates by gas-liquid chromatography. New Phytol. 70: 239-269.
27. HOLLIAGN-, P. NI. AND E. A. DREW. 1971. Routine analysis by gas-liquidchromatography of soluble carbohydrates in extracts of plant tissues. II.Quantitative analysis of standard carbohydrates, and the separation andestimation of soluble sugars and polyols from a variety of plant tissues.New Phytol. 70: 271-297.
28. IMANARI, T. AND Z. TAMURA. 1967. Gas chromatography of glucuronides.Chem. Pharm. Bull. 15: 1677-1681.
29. IMANZARI, T., Y. ARAKAWA, AND Z. TAMURA. 1969. Gas chromatographic anal-ysis of aldoses. Chem. Pharm. Bull. 17: 1967-1969.
30. JAAONNIAKI, P. I., K. L. KN-ox, E. C. HORNING, AND NM. G. HORNING. 1967.The characterization by gas-liquid chromatography of ethyl-/3-D-glucosi-duronic acid as a metabolite of ethanol in rat and man. Eur. J. Phar-macol. 1: 63-70.
31. KN-AAK}. J. B., J. M. ELDRIDGE, AND L. J. SULLIVAN. 1967. Systematic ap-proach to preparation and identification of glucuronic acid conjugates.J. Agr. Food Chem. 15: 605-609.
32. KRUPPA, R. F., R. S. HENLY, AND D. L. SMEAD. 1967. Improved gas-clhroma-tography packings with fluidized drying. Anal. Chem. 39: 851-853.
33. LAMPORT, D. T. A. 1970. Cell wall metabolism. Annu. Rev. Plant Physiol. 21:235-270.
34. LEHTONENE, A. A., J. K. KARKAIN-EN, AND E. 0. HAAHTI. 1966. Detection ofiduronic acid in mucopolysaccharide mixtures. Anal. Biochem. 16: 526-530.
35. LEHTON-EN-, A., J. KARKEAINEN, AND E. HAAHTI. 1966. Gas-chromatographiccharacterization of the electrophoretically separated fractions of acidmucopolysaccharides. J. Chromatog. 24: 179-182.
36. LOWRY, 0. H., N. J. ROSEBROUGH, A. L. FARR, AND R. J. RA-NDALL. 1951.Protein measurement with the Folin phenol reagent. J. Biol. Chem. 193:265-275.
37. .IATSrI, M., Mr. OKADA, T. INIANARI, AND Z. TAMuRA. 1968. Gas chroma-tography of trifluoroacetyl derivatives of alditols and trimethylsilyl deriva-tives of aldonolactones. Chem. Pharm. Bull. 16: 1383-1387.
38. 'MORRE, D. J. 1968. Cell wall dissolution and enzyme secretion during leafabscisson. Plant Physiol. 43: 1545-1559.
39. 'MORRISON-, I. MI. AND M. B. PERRY. 1966. The analysis of neutral glycosesin biological materials by gas-liquid partition chromatography. Can. J.Biochem. 44: 1115-1126.
40. N.AGEL, C. W. AND S. HASEGAWA. 1967. The enzymic determination of galac-turonic acid. Anal. Biochem. 21: 411-415.
41.NEAsl , A. C. 1965. Coumarins, phenylpropanes, and lignin. In: J. Bonner and
Plant Physiol. Vol. 49, 1972 935
www.plantphysiol.orgon May 16, 2018 - Published by Downloaded from Copyright © 1972 American Society of Plant Biologists. All rights reserved.
936 JONES AND
J. E. Varner, eds. Plant Biochemistry. Academic Press, New York. pp.581-614.
42. NELSON, N. 1944. A photometric adaptation of the Somogyi method for thedetermination of glucose. J. Biol. Chem. 153: 375-380.
43. NEVINS, D. J., P. D. ENGLISH, AND P. ALBERSHEIM. 1968. Changes in cellwall polysaccharides associated with growth. Plant Physiol. 43: 914-922.
44. NORTHCOTE, D. H. 1963. Changes in the cell walls of plants during differentia-tion. In: Symposia of The Society for Experimental Biology. NumberXVII, Cell Differentiation. pp. 157-174.
45. NORTHCOTE, D. H. 1969. The synthesis and metabolic control of polysac-charides and lignin during the differentiation of plant cells. In: P. N.Campbell and G. D. Greville, eds. Essays in Biochemistry, vol. 5. AcademicPress, New York. pp. 89-137.
46. OADES, J. M. 1967. Gas-liquid chromatography of alditol acetates and itsapplication to the analysis of sugars in complex hydrolysates. J. Chroma-togr. 28: 246-252.
47. OVODOV, Y. S. AND E. V. EVTuSHENKO. 1967. Analysis of sugar mixtures bygas-liquid chromatography. J. Chromatogr. 31: 527-530.
48. PERRY, M. B. AND R. K. HULYALKAR. 1965. The analysis of hexuronic acidsin biological materials by gas-liquid chromatography. Can. J. Biochem.43: 573-584.
49. PETERSSON, G., 0. SAMUELSON, AND H. RIEDL. 1967. Gas chromatographicseparation of aldonic acids as trimethylsilylated derivatives. Svensk Pap-perstidning. 70: 371-375.
50. RAUNHARDT, VON O., H. W. H. SCHMIDT, AND H. NEUKOM. 1967. Gas-chro-matographische Untersuchungen an Uronsauren und Uronsiurederivaten.Helv. Chim. Acta 50: 1267-1274.
51. RAY, P. M. 1963. Sugar composition of oat-coleoptile cell walls. Biochem.J. 89: 144-150.
52. RAYMOND, W. R. AND C. W. NAGEL. 1969. Gas-liquid chromatographic de-termination of oligogalacturonic acids. Anal. Chem. 41: 1700-1703.
53. SAEMAN, J. F., W. E. MOORE, R .L. MITCHELL, AND M. A. MILLETT. 1954.Techniques for the determination of pulp constituents by quantitative pa-per chromatography. Tappi 37: 336-342.
54. SAWARDEKER, J. S., J. H. SLONEKER, AND A. JEANES. 1965. Quantitative de-termination of monosaccharides as their alditol acetates by gas-liquid chro-matography. Anal. Chem. 37: 1602-1604.
55. SCHLESINGER, H. E., H. C. BROWN, D. L. MAYFIELD AND J. R. GILBREATH.1953. Procedures for the preparation of methyl borate. J. Amer. Chem.Soc. 75: 213-215.
56. SCHMIDT, H. W. H. AND H. NEUKOM. 1966. Zur Saurekatalysierten Reaktion
AkLBERSHEIM Plant Physiol. Vol. 49, 1972
von Galakturonsaure mit 'Methanol. II. Isomerverteilung und Isomerisierungder Galakturonoside. Helv. Chim. Acta 49: 510-516.
57. Ss&PIRA, J. 1969. Identification of sugars as their trifluoroacetyl polyol de-rivatives. Nature 222: 792-793.
58. SJOSTROM. E., P. HAGLL-ND AND J. JANSON. 1966. Separation and quantitativedetermination of aldonic acids by gas-liquid chromatography. Acta Chem.Scand. 20: 1718-1719.
59. SJ6STR6Oa, E., P. HAGLUND AND J. JANSON. 1966. Quantitative determina-tion of carbohydrates in cellulosic materials by gas-liquid chromatography.Svensk Papperstidning. 69: 381-385.
60. SOMOGYI, M. 1952. Notes on sugar determination. J. Biol. Chem. 195: 19-23.61. SWEELEY, C. C., R. BENTLY, M. NIAKITA, AND W. W. WELLS. 1963. Gas-
liquid chromatography of trimethysilyl derivatives of sugars and relatedsubstances. J. Amer. Chem. Soc. 85: 2497-2507.
62. TAMURA, Z. AND E. I'MAN\ARI. 1964. Gas chromatography of D-glucuronides.Chem. Pharm. Bull. 12: 1386-1388.
63. TAVAEOLI, M. AND R. C. WILEY. 1968. Gas chromatographic analysis offruit tissue polysaccharides. Proc. Amer. Soc. Hort. Sci. 92: 772-779.
64. THORNBER, J. P., AND D. H. NORTHCOTE. 1961. Changes in the chemicalcomposition of a cambial cell during its differentiation into xylem andphloem tissue in trees. 2. Carbohydrate constituents of each main component.Biochem. J. 81: 455-464.
65. TRACEY, M. V. 1948. A manometric method for the estimation of milligramquantities of uronic acids. Biochem. J. 43: 185-189.
66. UPDEGROFF, D. M. 1969. Semimicro determination of cellulose in biologicalmaterials. Anal. Biochem. 32: 420-424.
67. VANDENHEUVEL, W. J. A., AND E. C. HORNING. 1961. Gas chromatographicseparations of sugars and related compounds as acetyl derivatives. Biochem.Biophys. Res. Comm. 4: 399-403.
68. VAN ETTEN, H. D. AND D. F. BATEMAN. 1969. Enzymatic degradation ofgalactan, galactomannan, and xylan by Sclerotium rolfsii. Photopathology59: 968-972.
69. WHISTLER, R. L. AND E. C. RICHARDS. 1970. Hemicelluloses. In: W. Pigmanand D. Horton, eds. The Carbohydrates: Chemistry and Biochemistry, 2ndEdition, vol. 5, II A, chap. 37. Academic Press, New York. pp. 447-469.
70. WILEY, R. C., M. TAVAKOLI, AND M. D. MOORE. 1966. Determination of hexu-ronic acids in fruit by gas chromatography. Proc. Amer. Soc. Hort. Sci. 89:34-39.
71. WILEY, R. C. AND M. TAVAKOLI. 1969. Trimethylsilyl derivatives of commer-cial pectins. Food Technol. 23: 167-168.
72. WOLFROM, M. L., H. B. WOOD, AND K. ANNO. 1951. Sodium borohydride as areducing agent for acids, lactones and esters. Abs. Papers Amer. Chem. Soc.119: 8Q.
www.plantphysiol.orgon May 16, 2018 - Published by Downloaded from Copyright © 1972 American Society of Plant Biologists. All rights reserved.