a citizen's primer on hawai'i k-12 public education - university of
TRANSCRIPT

JJJJuuuusssstttt tttthhhheeee FFFFaaaaccccttttssss…………....A Citizen’s Primer on Hawai‘i K��� Public Education
January ����
HAWAI‘I EDUCATIONAL POLICY CENTERI n f o r m i n g t h e E d u c a t i o n C o m m u n i t y

HAWAI‘I EDUCATIONAL POLICY CENTER
The Hawai‘i Educational Policy Center (HEPC) is an independent policy researchorganization that provides timely, concise, relevant and objective policy briefs, reports,articles, studies, forums, and workshops that reflect the needs and requests of Hawai‘ipolicymakers. HEPC strives to become a trusted partner with policymakers in efforts tounderstand, nurture, improve, and adopt the best and most appropriate policies for ourlife-long learners in Hawai‘i.
The Hawai‘i Educational Policy Center…
� Works with policymakers to identify what information they need.
� Reviews, collects and distributes information on existing research on issues relevant toHawai‘i.
� Provides concise, objective, independent analysis of research.
� Provides timely, targeted, interpreted data, briefings and testimony for policymakers.
� Maintains a website with links to cutting-edge research and policy.
� Commissions a range of policy briefs, articles, studies and reports that generate newknowledge and insights that inform policy decisions.
� Conducts, facilitates, and participates in educational forums and workshops.
� Initiates research on emerging and enduring issues that affect the quality of schoolsand the quality of learning.
C o n t a c t U s
THE HAWAI‘I EDUCATIONAL POLICY CENTER1776 University Avenue, UES 103 • Honolulu, HI 96822-2463
Phone: (808) 956-9563 • Fax: (808) 956-5665Email: [email protected] • Website: www.hawaii.edu/hepc

The Hawai‘i Educational Policy Center is pleased to offer its Citizen’s Primer on Hawai’i K-12 PublicEducation. The Primer is designed to assist the general public, candidates for public office, policymakers, and anyone interested in K-12 education in their discussions, debates, and considerations ofproposals to improve public education in Hawai‘i. This is not an extensive collection of data, but aglimpse at some important information. We encourage people to reprint it, photocopy it, and pass it on tofamily and friends.
Data presented in this Primer are derived from national research sources that routinely compareeducational information among states (among the data sources are the College Board, ACT, the U.S.Census 2000 Characteristic Profiles of Education Administrative Areas, National Center for EducationStatistics, the National Board of Professional Teaching Standards, Education Week, the National Centeron Governing America's Schools, and the Education Commission on the States). Data were also providedby the Hawai‘i Department of Education, Office of Hawaiian Affairs, and the Kamehameha Schools.

TABLE OF CONTENTS
Page
1. The Hawai‘i Public Education Quiz 1
2. Top Ten Questions for School Reform 2
3. A Snapshot of the Current System 3(Enrollments, Disadvantaged Students, Native Hawaiians)
4. Where Does the Money Go? 6(Per Pupil Spending, Percent Spent on Instruction)
5. Who Works in Hawai‘i’s Department of Education? 7(Number of Employees, Breakdown of Staff, Teacher Salaries)
6. How Big Are Our Districts? 10
7. How Big Are Our Complexes? 12
8. How Big Are Our Schools? 13
9. Selected Hawai‘i Student Scores on National Tests 15
10. Title I Need of Improvement Schools 17
11. Hawai‘i Public Charter Schools 19
12. References 20

- 1 -
TTTTHHHHEEEE HHHHAAAAWWWWAAAA IIII ‘‘‘‘ IIII PPPPUUUUBBBBLLLL IIII CCCC EEEEDDDDUUUUCCCC AAAATTTT IIII OOOONNNN QQQQUUUU IIII ZZZZ
HHHHoooowwww mmmmuuuucccchhhh ddddoooo yyyyoooouuuu kkkknnnnoooowwww aaaabbbboooouuuutttt HHHHaaaawwwwaaaaiiii‘‘‘‘iiii’’’’ssss PPPPuuuubbbblllliiiicccc EEEEdddduuuuccccaaaattttiiiioooonnnn SSSSyyyysssstttteeeemmmm????
1. In January 2002, the number of regular public schools in Hawai‘i wasa. 184 b. 258 c. 312 d. 350
2. In January 2002, the number of people employed by the Hawai‘i State Department ofEducation wasa. 50,234 b. 10,927 c. 21,614 d. 37,899
3. The number of people actually working outside of schools, in the State or District officeswasa. 5,387 b. 3,559 c. 2,621 d. 1,231
4. Nationally, the highest percentage of the budget any State Department of Educationspends on instruction isa. 67.8% b. 87% c. 75.4% d. 54.9%
5. The percentage of the Hawai‘i Department of Education budget spent on instruction isa. 62.8% b. 52.8% c. 42.8% d. 32.8%
6. A school complex is a high school and all the “feeder” middle, intermediate, andelementary schools in that area whose students will eventually go to that high school.How many complexes does Hawai‘i have?a. Ten b. Over 20 c. Over 30 d. Over 40
7. Which figures compare the national average high-school size with Hawai‘i’s averagehigh-school size?a. National: 466
Hawai‘i: 576b. National: 595
Hawai‘i: 836c. National: 752
Hawai‘i: 1,468d. National: 1,456
Hawai‘i: 2,333
8. In the national ACT test, which figures compare Hawai‘i’s composite score with thenational average?a. National: 22.0
Hawai‘i: 18.6b. National: 20.8
Hawai‘i: 22.0c. National: 25.2
Hawai‘i: 12.4d. National: 20.8
Hawai‘i: 19.0
9. Of the 184,360 public school students, how many received lunch subsidies in 2000?a. 12,837 b. 20,138 c. 46,522 d. 74,558
10. It has been calculated that in 2002 Washington D.C. spent the most per pupil — $10,252.How much did Hawai‘i spend per pupil?
a. $9,347 b. 4,372 c. $6,391 d. $7,098
All answers can be found in the data that follow.

- 2 -
Top Ten Questions for School Reforms
We begin with the Top Ten Key Questions to ask about any proposed school reform. These questions areintended to focus on the most important aspects of our education system—the students, the classroom,and the school.
1. Will the proposal improve the school or classroom physical environment?
2. Will the proposal increase or decrease the ability of the school to know what is going on with eachstudent? Will students be lost in the crowd?
3. Will the proposal improve student attitudes toward learning? Increase opportunities/time/requirements to read and write challenging materials? Provide opportunities to completehomework, or use technology? Provide quality textbooks and take-home materials?
4. Will the proposal increase or decrease critical thinking components of the curriculum or lead togreater achievement of performance standards in each subject? Will it enhance the school’s ability torespond to diverse styles, paces or cultural preferences for learning, and individual talents amongstudents?
5. Will the proposal change teacher attitudes toward teaching or time for teachers to prepare lessons.Will it provide opportunities for teachers to acquire in-service training, assign (and correct)challenging homework, or build on what was taught the previous semester or year?
6. Will the proposal increase or decrease paperwork for the teachers, school administrators, or staff?
7. Will the proposal increase or decrease the school administrator’s time or ability to support teachers?
8. Will the proposal change community and parental attitudes toward education and the school, or thequality of the communication between the school, parents, and the community?
9. Will the proposal increase or decrease the ability of the parents, school and teachers to compare andinterpret meaningful data and achievements?
10. Will the proposal increase or decrease the desire to attend, teach at, or work at a public school?

- 3 -
A SNAPSHOP OF THE CURRENT SYSTEM
This section of the primer provides basic data on the size of the system, the kinds of studentsattending our schools, the allocation of State funds, the distribution of personnel, and the size ofdistricts, complexes and schools.
THE BIG PICTURE
Key Questions: Just how big is our system? What is the percentage of poor, special education andlimited English speaking students that affect our overall achievement ratings? What are the trends?
Hawai‘i Public Schools Enrollment 184,360
Number of Regular Public Schools 258
Number of Public Charter Schools 25
Q. Does Hawai‘i have a large number and percentage of disadvantaged students that affect ourachievement scores?
A. Yes. About 50% of all Hawai‘i public students are disadvantaged.
Not Disadvantaged 90,670 (49%)
Poverty Only 58,422 (31.8%)
Special Education Only 9,429 (5.1%)
Limited English Only 6,264 (2.3%)
Multiple Disadvantages 20,907 (11.4%)
Q. Are the numbers of disadvantaged students increasing?
A. Yes. Ten-year trends show a significant increase in all categories.
1990 2000
Students Receiving Lunch Subsidies 46,522 74,558
Special Education Students 9,778 20,138
Limited English Proficiency 8,861 12,837
Source: Hawai‘i State Department of Education 2002.

- 4 -
Q. How many Native Hawaiians are in Hawai‘i’s public schools?
A. Native Hawaiians represent 26.1% of K-12 public school students.
Native Hawaiian Students Enrolled in Hawai‘i Public Schools By Grade Level
Total Students inPublic Schools
Total NativeHawaiian Students
Total Non-HawaiianStudentsGRADES
Number Percent Number Percent Number Percent
TOTAL 184,187 100.0 48,078 26.1 136,109 73.9
Special Education 79 100.0 13 16.5 66 83.5
Pre-K 917 100.0 259 28.2 658 71.8
K 14,127 100.0 3,761 26.6 10,366 73.4
1 14,928 100.0 3,885 26.0 11,043 74.0
2 14,806 100.0 3,869 26.1 10,937 73.9
3 14,896 100.0 3,913 26.3 10,983 73.7
4 15,235 100.0 4,142 27.2 11,093 72.8
5 15,485 100.0 4,193 27.1 11,292 72.9
6 14,545 100.0 3,912 26.9 10,633 73.1
7 13,747 100.0 3,666 26.7 10,081 73.3
8 13,399 100.0 3,457 25.8 9,942 74.2
9 15,939 100.0 4,169 26.2 11,770 73.8
10 13,101 100.0 3,266 24.9 9,835 75.1
11 12,539 100.0 3,081 24.6 9,458 75.4
12 10,444 100.0 2,492 23.9 7,952 76.1
Source: Kamehameha Schools, Policy & Systems Evaluation Office utilizing Department of Education data for school year 2000–2001.
Students Enrolled in Hawai‘i Public Schools by Department of Education DistrictsSchool Year 2000-2001
State Native Hawaiian Other Ethnic GroupsDOE School Districts
Number Percent Number Percent Number Percent
STATE 184,187 100.0 48,078 100.0 136,109 100.0
Central 33,720 18.31 4,302 8.95 29,418 21.61
Hawai‘i 27,113 14.72 10,503 21.85 16,610 12.20
Honolulu 34,462 18.71 5,505 11.45 28,957 21.27
Kaua‘i 10,631 5.77 3,324 6.91 7,307 5.37
Leeward 37,412 20.31 10,683 22.22 26,729 19.64
Maui 21,794 11.83 6,532 13.59 15,262 11.21
Windward 19,055 10.35 7,229 15.04 11,826 8.69
Source: Kamehameha Schools, Policy & Systems Evaluation Office utilizing Department of Education data for school year 2000–2001.

- 5 -
Q. What is the educational attainment for Native Hawaiians compared to other groups?
A. Fifteen percent of Native Hawaiians have a four-year college degree, compared to Caucasianswho lead all groups with 42% completing at least four years of college.
Educational Attainment for Individuals 18 and OverYear 2000
StateTotal
NativeHawaiian
Caucasian Chinese Filipino Japanese OtherEducationalAttainment Number
(Percent)Number
(Percent)Number
(Percent)Number
(Percent)Number
(Percent)Number
(Percent)Number
(Percent)
TOTAL 862,912 154,482 206,748 52,720 130,918 212,350 105,693
No School /Kindergarten
1,407(0.2)
58(0.0)
53(0.0)
642(0.5)
191(0.1)
463(0.4)
Grades 1-833,151(3.8)
2,901(1.9)
2,432(1.2)
1,297(2.5)
12,831(9.8)
10,289(4.8)
3,401(3.2)
Grades 9-1134,054(3.9)
9,855(6.4)
4,791(2.3)
2,650(5.0)
6,911(5.3)
5,434(2.6)
4,413(4.2)
Grade 12 / GED297,299(34.5)
79,798(51.7)
50,537(24.4)
14,339(27.2)
48,118(36.8)
65,032(30.6)
39,475(37.3)
College 1-3 Years216,717(25.1)
36,169(23.4)
58,609(28.3)
10,495(19.9)
29,267(22.9)
52,873(24.9)
28,604(27.1)
College 4+ Years257,840(29.9)
23,546(15.2)
87,817(42.5)
22,357(42.4)
25,173(19.2)
74,303(35.0)
24,643(23.3)
Unknown/Ref.22,444(2.6)
2,155(1.4)
2,510(1.2)
1,582(3.0)
7,277(5.6)
4,227(2.0)
4,694(4.4)
Source: Office of Health Status Monitoring, Hawai‘i State Department of Health

- 6 -
Where Does the Money Go?
Key Questions: Are we spending enough on each student? How do we compare with the U.S. mainland?How much of the Hawai‘i DOE dollar goes to support instruction?
Q. How does Hawai‘i compare in per pupil spending?
A. We are kind of in the middle, not too bad, but not really great.
PER PUPIL SPENDINGPer Student
AmountRank
Hawai‘i $ 6,391 #33
US Average $ 7,079
Highest: Washington D.C. $ 10,252 #1
Lowest: Utah $4,372 #51
Q. What percent of the Hawai‘i DOE dollars is spent on actual instruction?
A. Hawai‘i spends more than the national average at about 62.8% of the budget. We rank #13.
PERCENT SPENT ON INSTRUCTION (1999)
Percent Rank
Hawai‘i 62.8% #13
US Average 61.7%
Highest: New York 67.8% #1
Lowest: Washington D.C. 45.3% #51
Source: Education Week; Quality Counts 2002.
Note: These figures change depending on the definition of “instruction,” and how it is calculated. Our rankingnationally does not address the issue of how much should be spent on instruction.

- 7 -
Who Works in Hawai‘i’s Department of Education?
Key Questions: How many people are we actually employing to run the school system? How many ofthese are teachers? Principals? How many are working at a school, as opposed to working in a district orstate office?
Q. Is it true for every teacher in the DOE there are two non-teaching support staff?
A. Not true. The so-called professional staff is mostly engaged in teaching. The support staff –clerical and others – is mostly working in schools to support the teachers.
HAWAI‘I DEPARTMENT OF EDUCATION EMPLOYEES
Total DOE Employees: 21,220
Professional Staff:Regular Teachers 11,024Special Education Teachers 1,833Principals 247Vice Principals 255Superintendents 22
Non-Teaching Support Staff 7,839TOTAL 21,220
Source: Superintendent’s Update, Hawai‘i Department of Education, March 7, 2002.
Q. Could we reassign many of the Hawai‘i DOE employees back to the schools?
A. Not really. Most are not teachers. And of the 21,614 employees, only 1,231 are not alreadyworking in a public school. District and state office people are only a tiny percent of DOEemployees.
HAWAI‘I DEPARTMENT OF EDUCATION EMPLOYEES(Continued)
Total Non-Teaching Support Staff: 7,839
School Level 6,891District Offices 441State Offices 507
Source: Superintendent’s Update, Hawai‘i Department of Education, March 7, 2002.

- 8 -
Q. Are the people in the district offices able to provide support to classroom teachers?
A. In the past, there were many subject specialists (math, science, social studies, etc.) working in thedistrict offices to assist teachers. Now, these specialists are reallocated to classrooms/schools, andmost of the remaining staff are busy working on “compliance,” “accountability,” and other tasksaimed at ensuring our schools meet various standards.
SCHOOL LEVEL VS. DISTRICT LEVEL EMPLOYEES
School Level 20,383
District/State 1,231
Source: Superintendent’s Update, Hawai‘i Department of Education, March 7, 2002.
Q. What percent of the Hawai‘i DOE personnel are teachers, as opposed to other staff?
A. Teachers makeup 60.7% of the Hawai‘i DOE employees. We rank #2, just behind Rhode Island.
TEACHERS AS A PERCENT OF ALL DOE STAFF
Percent Rank
Hawai‘i 60.7% #2
US Average 51.7%
Highest: Rhode Island 61.6% #1
Lowest: Kentucky 45.0% #51
WWWWhhhhaaaatttt ddddooooeeeessss tttthhhhiiiissss mmmmeeeeaaaannnn????????????
It means the number and percent of DOEemployees directly involved in school-level educationare higher than most other states.

- 9 -
Teacher Salaries in Hawai‘i
Q. What percent of the Hawai‘i DOE budget is actually spent on teacher salaries?
A. Hawai‘i spends 44.7% of its budget on teacher salaries. Hawai‘i ranks #6 in the nation.
PERCENT OF THE BUDGET SPENTON TEACHER SALARIES
Percent Rank
Hawai‘i 44.7% #6
US Average 33.4%
Highest: Alabama 48.4% #1
Lowest: Wisconsin 30.1% #51
Q. How does Hawai'i rank in terms of teacher salaries?
A. Hawai‘i ranks 23rd in the nation. According to research conducted by the American Federationof Teachers, the national average in 2000-01 was $43,250, with an average beginning salary of$28,986. Hawai'i’s teachers averaged $40,536, with an average beginning salary of $29,204.
Q. How does Hawai'i rank when adjusted for the cost of living?
A. When adjusted for the higher cost of living, on that basis Hawai‘i ranks 51st in the nation. Theaverage teacher salary drops to $30,899.
Q. How does Hawai'i compare with the salaries paid in western states?
A. Without adjusting for the cost of living, Hawai'i still ranks last in the far west. California pays thehighest average teacher salary among the western states at $52,480, followed by Alaska at$48,123, Oregon at $44,988, Nevada at $44,234, Washington at $42,143, and Hawai'i at $40,536.
AverageSalary
RankAdjusted Cost of Living
Average SalaryRank
National Average $43,250 $38,304
Hawai'i $40,536 23 $30,899 51
California $53,507 2 $43,061 16
Alaska $48,123 9 $39,124 32
Oregon $44,988 15 $43,424 14
Nevada $44,234 15 $47,384 9
Washington $42,143 19 $39,276 31
Source: American Federation of Teachers (AFT), Department of Researchhttp://www.aft.org/research/survey01/tables.html
WWWWhhhhaaaatttt ddddooooeeeessss tttthhhhiiiissss mmmmeeeeaaaannnn????????????
It means that Hawai‘i is spending acomparatively high percentage of itseducation budget on teachers andinstruction.

- 10 -
How Big Are Our “Districts”?
Key Questions: How does the Hawai‘i DOE divide up the administrative work? How decentralized is theorganization? Are all administrative districts created equal? If voters were to elect “District Boards ofEducation” the size of these current districts, how big would those electoral districts be? Would there be asense of ownership?
Q. How do Hawai‘i’s seven administrative districts compare in size with those in other states?
A. Mainland districts are all sizes, but on average most school districts are much smaller than Hawai‘i inthe number of students served. However, the following data show that several states have fairly largedistricts, and some districts are about the size of ours. The average “district” size in the US, out of14,571 school districts, is 3,174 students.
THE TOP FIVE AVERAGE STATE DISTRICT SIZES
Average Number ofStudents per District Number of Districts
Washington D.C. 70,762 1Florida 35,482 67Maryland 35,274 24Nevada 19,154 17Utah 11,946 40North Carolina 10,517 120
Source: National Center for Education Statistics, Overview of Public Elementary and Secondary Schools and Districts: School Year 1999 – 2000, August 2001, U.S. Department of Education.

- 11 -
Q.
DistrictNumber of
Schools
RegularEducationStudents
SpecialEducationStudents
TotalStudents
ResidentPopulation
PotentialVoters
Over 18
Householdswith children
under 18Statewide 255 161,990 20,808 182,798 1,211,537 915,770 153,008
Central 41 30,039 3,527 33,566 207,298 151,829 29,738
Leeward 41 33,719 3,367 38,250 211,395 150,504 29,240
Hawai‘i 43 21,644 3,325 24,969 148,677 109,825 19,846
Honolulu 54 29,879 2,921 32,800 321,587 264,014 31,791
Kauai 16 9,121 1,142 10,263 58,463 43,020 8,040
Maui 30 18,765 2,732 21,488 128,094 95,383 16,873
Windward 30 15,965 2,303 18,268 135,871 101,049 17,479
Source: Hawai‘i Census 2000 General Demographic Characteristic Profiles: State of Hawai‘i Education Administrative Areas, High School Complexes.http://64.0.86.234/~g/c15sd.pdf
Q. How big are our organizational units?
A. Our administrative districts are all different sizes. Some, such as Windward, Kauai and Maui, have lessthan 25,000 students, while Central, Leeward and Honolulu have over 30,000 students.
The overall resident populations of districts are quite different. These might be the potential voters in anew decentralized system. Would the 264,014 “voters” feel connected and a sense of ownership for anew Honolulu School Board?
The households with children under 18 tell us the potential parent participants in schools or districts.
WWWWhhhhaaaatttt ddddooooeeeessss tttthhhhiiiissss mmmmeeeeaaaannnn????????????It means that any plan to divide up oursystem into independent districts will havea different feel and impact depending onwhere you live.

- 12 -
How Big are our Complexes?
Hawai‘i Admin.Complex
(High & FeederSchools)
2000Population
2000Population
Over 18 years
Number ofHouseholds
with Childrenunder 18 years
Statewide 1,211,537 915,770 153,008H O N O L U L U D I S T R I C T
Farrington 46,537 34,494 5,257
Kaimuki 77,153 66,091 6,978
Kaiser 30,670 24,129 3,810
Kalani 36,574 29,828 3,861
McKinley 69,346 58,463 6,155
Roosevelt 60,707 51,009 5,730
C E N T R A L D I S T R I C T
Aiea 41,276 32,435 4,810
Leilehua 41,608 29,232 6,308
Mililani 45,123 32,452 7,112
Moanalua 37,313 28,238 5,017
Radford 29,543 19,923 4,951
Waialua 12,435 9,406 1,538
L E E W A R D D I S T R I C T
Campbell 43,637 30,027 6,667
Nanakuli 11,427 7,346 1,594
Pearl City 48,861 38,456 5,627
Waianae 30,832 20,282 4,479
Waipahu 51,458 37,400 6,770
Kapolei 25,180 16,993 4,103
W I N D W A R D D I S T R I C T
Castle 52,148 39,032 6,759
Kahuku 17,877 12,342 2,263
Kailua 28,396 21,264 3,522
Kalaheo 37,450 28,411 4,935
Hawai‘i Admin.Complex
(High & FeederSchools)
2000Population
2000Population
Over 18 years
Number ofHouseholds
with Childrenunder 18 years
Statewide 1,211,537 915,770 153,008H A W A I I I S L A N D D I S T R I C T
Keaau 16,639 11,817 2,369
Hilo 27,629 21,031 3,428
Waiakea 19,766 14,757 2,643
Honokaa 14,255 10,313 1,989
Kau 5,751 4,234 751
Kohala 6,038 4,564 708
Laupahoehoe 1,780 1,335 215
Pahoa 14,767 10,326 2,153
Kealakehe 31,340 23,479 4,196
Konawaena 31,340 7,969 1,394
M A U I D I S T R I C T
Baldwin 22,782 16,631 3,102
Hana 1,855 1,302 248
King Kekaulike 33,406 26,641 4,838
Lahainaluna 17,967 13,986 2,035
Lanai 3,193 2,303 448
Maui 41,634 31,647 5,175
Molokai 7,257 4,873 1,027
K A U A I D I S T R I C T
Kapaa 24,873 18,016 3,584
Kauai 22,747 17,170 2,945
Waimea 10,683 7,739 1,485
Niihau 160 95 26
Source: Hawai‘i Census 2000 General Demographic Characteristic Profiles:State of Hawai‘i. Education Administrative Areas, High School Complexes.http://64.0.86.234/~g/c15sd.pdf

- 13 -
How Big are Our Schools?
Key Questions: Are Hawai‘i schools too big? What about class sizes? Are Hawai‘i students at adisadvantage because of the large schools and classes?
Q. How big are Hawai‘i schools compared to those on the Mainland?
A. Our schools are much larger than the Mainland average.
AVERAGE NUMBER OF STUDENTSIN PRIMARY, MIDDLE, & HIGH SCHOOLS
Hawai‘i NationalPrimary School 576 466Middle School 836 595High School 1,468 752
Source: National Center for Education Statistics.
Q. How large are our biggest schools?
A. A sample of our largest high schools shows they are much bigger than the National average.
HAWAI‘I’S LARGEST SCHOOLS
Farrington High 2,455Waipahu High 2,411Campbell High 2,102Mililani High 2,044Pearl City High 2,032Waianae High 1,988Moanalua High 1,889Castle High 1,869McKinley High 1,855Hilo High 1,777Maui High 1,734Roosevelt High 1,541
Source: Assessment Resource Center Hawai‘i School Status and Improvement Report.
We have a larger percent of all schools with large student enrollments compared to the Nationalaverage.
COMPARISON OF SCHOOL ENROLLMENTSHawai‘i National
PERCENT OF SCHOOLS WITH . . .
Less than 300 students 9.9% 30.1%
300 – 749 students 31.8% 15.8%
1,500+ students 7.1% 3.5%
Source: National Center for Education Statistics, Overview of Public Elementary and Secondary Schools and Districts: SchoolYear 1999 – 2000, August 2001, U.S. Department of Education.
- 14 -
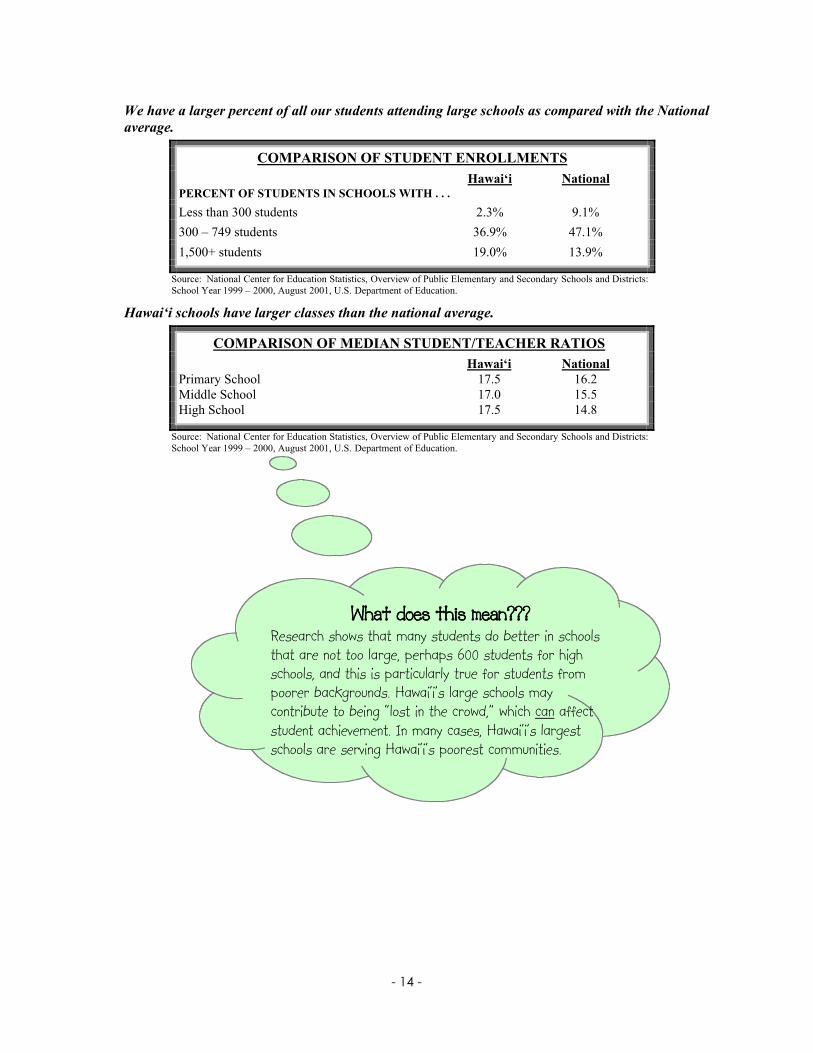
We have a larger percent of all our students attending large schools as compared with the Nationalaverage.
COMPARISON OF STUDENT ENROLLMENTSHawai‘i National
PERCENT OF STUDENTS IN SCHOOLS WITH . . .
Less than 300 students 2.3% 9.1%
300 – 749 students 36.9% 47.1%
1,500+ students 19.0% 13.9%
Source: National Center for Education Statistics, Overview of Public Elementary and Secondary Schools and Districts: School Year 1999 – 2000, August 2001, U.S. Department of Education.
Hawai‘i schools have larger classes than the national average.
COMPARISON OF MEDIAN STUDENT/TEACHER RATIOSHawai‘i National
Primary School 17.5 16.2Middle School 17.0 15.5High School 17.5 14.8
Source: National Center for Education Statistics, Overview of Public Elementary and Secondary Schools and Districts: School Year 1999 – 2000, August 2001, U.S. Department of Education.
WWWWhhhhaaaatttt ddddooooeeeessss tttthhhhiiiissss mmmmeeeeaaaannnn????????????Research shows that many students do better in schoolsthat are not too large, perhaps 600 students for highschools, and this is particularly true for students frompoorer backgrounds. Hawai‘i’s large schools maycontribute to being “lost in the crowd,” which can affectstudent achievement. In many cases, Hawai‘i’s largestschools are serving Hawai‘i’s poorest communities.

- 15 -
ResultsSelected Hawai‘i Student Scores on National Tests
Key Questions: How well do Hawai‘i students do on national tests?
Q. How do our students do on the ACT Test?(The ACT Assessment® is designed to assess high school students' general educational development and theirability to complete college-level work. The tests cover four skill areas: English, mathematics, reading, andscience reasoning. Generally, the ACT is considered more directly related to the subjects studied in school andknowledge acquired than the SAT, which is a more general test designed to measure math and verbal abilities.)
A. Hawai‘i’s students do pretty well. In fact, above the national average!
Source: 2002 ACT Composite Averages by State, ACT, Inc.
2002 ACT AVERAGE COMPOSITE SCORES BY STATE
STATE PERCENT OFGRADS TESTED
AVERAGECOMPOSITE SCORE
Hawai‘i 18% 22.0
National Average 39% 20.8
B E S T S T A T E
Maine 6% 22.5
Oregon 12% 22.5
W O R S T S T A T E
Mississippi 84% 18.6
C O M P A R A B L E % O F G R A D S T E S T E D
Indiana 19% 21.5
Washington 16% 22.3
O T H E R C O M P A R A B L E S T A T E S
Delaware 4% 21.3
Nebraska 72% 21.7
Rhode Island 6% 21.9
Wyoming 64% 21.4

- 16 -
Q. What about other tests?
A. On the National Assessment of Educational Progress (NAEP) test, which is used by the FederalGovernment to compare states on student achievement, our 4th and 8th grade students score belowthe national average.
NAEP 2000 4th & 8th GRADE MATH & SCIENCE SCORES
MATH SCIENCESTATE
Grade 4 Grade 8 Grade 4 Grade 8
National Average 226 274 148 149
Best Scores 235 288 162 165
Worst Scores 211 254 131 132
Hawai‘i Scores 216 263 136 132
Source: National Center for Education Statistics
Q. What is the difference between the ACT and the NAEP Tests?
A. The ACT is thought to be more directly linked to subjects students actually study. For example,many middle-school students in Hawai‘i take only one year of science, and their scores reflect this.Students in other states take two or three years of science, and have higher scores.
SCHOLASTIC ASSESSMENT TEST SCORE AVERAGES2000 and 2001
[Recalibrated averages, not directly comparable to earlier data reported in Data Book 1995,Formerly known as the Scholastic Aptitude Test]
HAWAI‘I SENIORS NATIONAL AVERAGECOMPONENT
2000 2001 2000 2001 Mathematical 519 515 514 514Verbal 488 486 505 506
Source: Honolulu Star Bulletin, August 28, 2001.

- 17 -
Title I Need of Improvement SchoolsSY 2001-2002
(85 schools of which 65 are *corrective action)
A Title I school is one in which 45% of a school's enrollment receives free or reduced-price lunches(based on federal poverty levels), the school is eligible to receive Title I funds to improve learningopportunities for its students. Title I schools are expected to demonstrate annual progress in meetingacademic standards and other school quality measures. Title I schools that do not make Adequate YearlyProgress for two or more consecutive years enter Title I status of needing "school improvement" (Year 1or Year 2), or in "corrective action." Students at these schools are eligible for additional supplementaleducational services and may be eligible to transfer to other higher performing schools.
HONOLULU OFFICE(8 school improvement schools of which 5 are corrective action)
Farrington Complex Dole Middle* Kalihi Elementary Kalihi-kai Elementary*Kaimuki Complex Jarrett Middle Jefferson Elementary* Palolo Elementary*McKinley Complex Central Middle*Roosevelt Complex Anuenue
CENTRAL OAHU OFFICE(6 school improvement schools of which 5 are corrective action)
Aiea Complex Aiea ElementaryLeilehua Complex Helemano Elementary* Kaala Elementary* Wahiawa Elementary* Wahiawa Middle*Waialua Complex Haleiwa Elementary*
LEEWARD OAHU OFFICE(21 school improvement schools of which 16 are corrective action)
Campbell Complex Ewa Elementary Ewa Beach Elementary Ilima Intermediate Kaimiloa Elementary* PohakeaElementary *Kapolei Complex Makakilo Elementary*Waianae Complex Kamaile Elementary* Leihoku Elementary* Maili Elementary*Makaha Elementary* Waianae Elementary* Waianae High Waianae Intermediate*Nanakuli Complex Nanaikapono Elementary*Nanakuli Elementary* Nanakuli High & Intermediate*Pearl City Complex Pearl City ElementaryWaipahu Complex August Ahrens Elementary* Honowai Elementary*Waipahu Elementary* WaipahuIntermediate*
WINDWARD OAHU OFFICE(12 school improvement schools of which 8 are corrective action)
Castle Complex Heeia Elementary Kahaluu Elementary* Benjamin Parker Elementary* Puohala ElementaryWaiahole Elementary*Kahuku Complex Hauula Elementary* Kaaawa Elementary* Laie Elementary*Kailua Complex Keolu Elementary Pope Elementary* Waimanalo Elementary &Intermediate*Kalaheo Complex Kailua Elementary

- 18 -
HAWAI‘I OFFICE(24 school improvement schools of which 21 are corrective action)
Hilo Complex Haaheo Elementary* Hilo Intermediate* Hilo Union Elementary* Kalanianaole Elementary &Intermediate* Chiefess Kapiolani Elementary* Kaumana Elementary* Keaukaha Elementary*Laupahoehoe Complex Laupahoehoe High & Elementary*Kau Complex Kau High & Pahala Elementary* Naalehu Elementary & Intermediate*Keaau Complex Keaau Middle* Mt. View Elementary*Pahoa Complex Keonepoko Elementary Pahoa Elementary* Pahoa High & Intermediate*Kealakehe Complex Kahakai Elementary* Kealakehe Elementary* Kealakehe Intermediate*Honokaa Complex Honokaa Elementary* Waimea Elementary Waimea MiddleKonawaena Complex Hookena Elementary & Intermediate* Honaunau Elementary & Intermediate* KonawaenaElementary*
MAUI OFFICE(11 school improvement schools of which 8 are corrective action)
Kekaulike Complex Makawao Elementary* Paia Elementary*Maui Complex Kahului Elementary Kihei Elementary Lihikai ElementaryHana Complex Hana High & Elementary*Molokai Complex Kaunakakai Elementary* Kilohana Elementary* Kualapuu Elementary* Maunaloa Elementary*Molokai High & Intermediate*
KAUAI OFFICE(3 school improvement schools of which 2 are corrective action)
Kauai Complex King Kaumualii Elementary* Koloa Elementary*Waimea Complex Waimea Canyon Elementary & Intermediate

- 19 -
Hawai‘i Public Charter Schools
School Island/District Grade Level
• Hakipu`u Learning Center: A Hawai`i PCS O`ahu - Windward. 7-12
• Halau Ku Mana: A New Century PCS O‘ahu - Honolulu. 6-12
• Halau Lokahi: A New Century PCS O`ahu - Honolulu. K-12
• Ka Waihona `o Ka Na`auao: New Century PCS O`ahu - Leeward. K-6
• Ke Kula `o Samuel M. Kamakau: A Laboratory PCS O`ahu - Windward. K-12
• Lanikai Elementary: Public Charter School O`ahu - Windward. K-6
• Myron B. Thompson Academy: A New Century PCS O`ahu - Honolulu. 9-12
• The Education Laboratory: A Hawai`i New Century PCS O`ahu - Honolulu. K-12
• Voyager: A Public Charter School O`ahu - Honolulu. K-5
• Wai`alae Elementary: Public Charter School O`ahu - Honolulu. K-5
• Connections: New Century PCS Hawai`i - Hilo. K-8
• Hawai`i Academy of Arts & Science: Public Charter High School Hawai`i - Pahoa. 7-12
• Innovations: Public Charter School Hawai`i - Kona. 3-5
• Ka `Umeke Ka`eo: Public Charter School Hawai‘i - Hilo. K-6
• Kanu `o Ka `Aina: New Century PCS Hawai`i - Kamuela. K-12
• Ke Ana La`ahana: Public Charter School Hawai`i - Hilo. 7-12
• Ke Kula `o Nawahiokalani`opu`u Iki Laboratory: PCS Hawai`i - Kea`au. K-6
• Kua `o Ka La: Public Charter School Hawai‘i - Kapoho . 6-8
• Volcano School of Arts & Sciences: A Community PCS Hawai`i - Volcano. K-7
• Waters of Life - "Wai Ola": New Century PCS Hawai`i - Hilo. K-12
• West Hawai`i Explorations Academy: PCS Hawai`i - Kona. 9-12
• Ipu Ha`a Academy of Natural Sciences: A Hawai`i PCS Kaua`i - Kapa`a. K-12
• Ke Kula Ni`ihau `o Kekaha Learning Center: A Laboratory PCS Kaua`i - Kekaha. K-12
• Ni`ihau School of Kekaha: A New Century PCS Kaua`i - Waimea. K-12
• Kihei New Century PC High School Maui. 9-12

- 20 -
Q. Where can I find the original sources of information?
A. Here are some of the Internet Links to data presented in this Primer:
• Hawai‘i Department of Education http://doe.k12.hi.us/• Hawai‘i DOE Assessment Resource Center: Lots of Reports http://arch.k12.hi.us/• Superintendent’s Annual Report http://arch.k12.hi.us/pdf/report/2001/SuptRept2001.pdf• State-by-State College Board Scores
http://www.collegeboard.com/prod_downloads/about/news_info/cbsenior/yr2002/pdf/table3.pdf• State-by State ACT Scores http://www.act.org/news/data.html• Education Week: Quality Counts 2002: http://www.edweek.org/sreports/qc02/2003• National Center for Education Statistics: http://nces.ed.gov/pubs2001/overview• National Center for Education Statistics: http://nces.ed.gov/pubs2001/overview• Office of Hawaiian Affairs: http://www.oha.org/databook/index.html• Resource Center Hawai‘i: School Status & Improvement Report:
http://arch.k12.hi.us/school/ssir/default.html• ACT: http://www.act.org• National Center for Education Statistics: Hawai‘i
http://nces.ed.gov/nationsreportcard/states/profile.asp?state=HI