a climatology of the structure, evolution, and propagation...
TRANSCRIPT

A Climatology of the Structure, Evolution, and Propagation of Midlatitude Cyclonesin the Southeast United States
ROSANA NIETO FERREIRA, LINWOOD HALL, AND THOMAS M. RICKENBACH
Department of Geography, East Carolina University, Greenville, North Carolina
(Manuscript received 18 September 2012, in final form 25 February 2013)
ABSTRACT
The seasonal and interannual variability of the structure, evolution, and propagation of midlatitude cy-
clones in the southeast United States are studied using a composite analysis. In the upper levels, the com-
posites show that the axis of the wintertime upper-level trough remains north–south oriented and propagates
eastward along 408N, while the summertime upper-level trough has a much slower propagation at a farther
north latitude and an axis that is tilted in the northeast–southwest direction. Upper-level circulation changes
are consistent with a shift from wintertime ‘‘cyclonic behavior’’ to summertime ‘‘anticyclonic behavior’’
midlatitude cyclones. Significant changes in the low-level structure and precipitation patterns of midlatitude
cyclones ensue from these upper-level changes. While the winter composite is characterized by eastward-
propagatingmidlatitude cyclones that extend deep into the subtropics, the summer composite is characterized
by semistationary midlatitude troughs that only briefly skirt the subtropics. Wintertime precipitation occurs
only in and ahead of the surface low pressure center, whereas summertime precipitation occurs in all days of
the composite. As a result, over 70% (30%) of wintertime (summertime) precipitation in the Carolinas occurs
on days when midlatitude cyclones are present. The wintertime composites also show that midlatitude cy-
clones produce more precipitation on the windward side of the Appalachians than over the Carolinas, sug-
gesting a rain shadow effect of the mountains.
The ENSO-related variability of the structure, evolution, and propagation of midlatitude cyclones shows
the presence of a more intense and southward-displaced upper-level jet, stronger midlatitude cyclones, and
more intense precipitation over a larger area during El Ni~no than La Ni~na or normal years.
1. Introduction
As population increases (U.S. Census Bureau 2013)
and climate changes (Solomon et al. 2007), water man-
agement and sustainability policymaking in the south-
east (SE) United States will be increasingly dependent
upon an improved understanding of the spatial and
temporal distribution of regional precipitating systems
(Robinson 2006). Each year the southeastern United
States receives precipitation from a variety of weather
systems such as midlatitude cyclones (Curtis 2006) and
tropical cyclones (e.g., Larson et al. 2005; Shepherd et al.
2007), sea breeze circulation (Koch and Ray 1997), me-
soscale convective systems that form in the mountains
(Parker and Ahijevych 2007), and the diurnal cycle of
convection during summertime (Winkler et al. 1988).
Midlatitude cyclones are especially important because
they bring significant amounts of precipitation to the
southeast United States year-round.
This study uses a composite analysis to examine sea-
sonal and interannual changes in the synoptic-scale
structure, evolution, propagation, and precipitation of
midlatitude cyclones in the southeast United States.
Previous synoptic climatologies of midlatitude cyclones
in the southeast United States have focused on the sea-
sonal and interannual variability of storm numbers (Curtis
2006), preferred regions of origin and tracks (e.g., Reitan
1974; Colucci 1976; Zishka and Smith 1980; Whittaker
and Horn 1984; Hirsch et al. 2001; Senkbeil et al. 2012),
wintertime total precipitation and snowfall amounts (e.g.,
Frankoski and DeGaetano 2011; Senkbeil et al. 2012),
extreme precipitation events (Wuensch and Curtis 2010;
Konrad 1997), and storm impacts on theEast Coast of the
United States (e.g., Dolan et al. 1988;Mather et al. 1964).
Synoptic climatologies of special types of midlatitude
cyclones such as inverted troughs in the central United
States (Weisman et al. 2002) and Canadian Alberta
Corresponding author address: Rosana Nieto Ferreira, Depart-
ment of Geography, East Carolina University, A-227 Brewster
Building, Greenville, NC 27858-4353.
E-mail: [email protected]
8406 JOURNAL OF CL IMATE VOLUME 26
DOI: 10.1175/JCLI-D-12-00657.1
� 2013 American Meteorological Society

clippers (Thomas and Martin 2007) are also available.
However, no general synoptic climatology of the sea-
sonal variability of midlatitude cyclone structure and
evolution in the southeast United States has been pub-
lished. This study aims to fill this gap by presenting
composites of the daily sea level pressure (SLP), upper-
and lower-level winds, geopotential, and precipitation
signatures of midlatitude cyclones in the southeast
United States and thus contributes to an improved
understanding of the dynamics of their seasonal-to-
interannual variability. This study forms the basis for
a forthcoming radar-based study of the seasonal vari-
ability of the precipitation system organization in mid-
latitude cyclones that affect the southeast United States.
This two-pronged approach can lead to improvements
in our understanding of the role of midlatitude cy-
clones in the precipitation variability of the southeast
United States and possibly also to improvements in
precipitation prediction on climate time scales.
While it rains year-round in the southeastern United
States, distinct seasonal regimes of precipitation occur
over the Gulf andAtlantic coasts, as well as on the eastern
and western sides of the AppalachianMountains (Fig. 1).
During boreal winter the highest precipitation amounts
occur west of the Appalachian Mountains in a wide
southwest–northeast-oriented band that extends from
the Gulf of Mexico to near the Great Lakes. A relative
minimum in precipitation stretches from Florida north-
eastward across the Atlantic states during the winter.
During the boreal summer, the sea breeze circulation
causes the precipitation maxima along the Gulf Coast
and over the Florida peninsula as well as a weaker pre-
cipitation maximum that stretches northeastward along
the southeast United States coast (Carbone and Tuttle
2008). Summer convection initiated in the Appalachian
Mountains propagates eastward and can organize into
mesoscale convective systems, enhancing precipita-
tion in the coastal plains (Parker and Ahijevych 2007).
FIG. 1. Seasonal climatology of TRMMprecipitation (shaded; mmday21). The location of the Appalachian Mountains is indicated by the
elevation contours (solid lines; m).
1 NOVEMBER 2013 N I E TO FERRE IRA ET AL . 8407

Precipitation is relatively scarce on the lee side of the
Appalachian Mountains during boreal fall, winter, and
spring. The highest precipitation amounts on the lee side
of the Appalachians occur during boreal summer. In
addition to these regional seasonal differences, precip-
itation in the southeastern United States also varies
from year to year and extremes such as droughts and
floods often occur. Remote influences such as the El
Ni~no–Southern Oscillation (ENSO; e.g., Ropelewski
and Halpert 1986; Eichler and Higgins 2006) and the
North Atlantic Oscillation (NAO; e.g., Durkee et al.
2008) have also been shown to contribute to seasonal
precipitation variability in the southeast United States.
Favored cyclogenesis locations and tracks of mid-
latitude cyclones over North America vary not only
seasonally (e.g., Whittaker and Horn 1984; Eichler and
Higgins 2006) but also on interannual time scales in as-
sociation with ENSO (Curtis 2006; Eichler and Higgins
2006; Bengtsson et al. 2006). In general, there are four
main cyclogenesis regions in North America (Whittaker
and Horn 1984). Two of them are present year-round:
one to the lee of the Rockies in Canada and another
one over the Gulf Stream just off the East Coast of the
United States. A third important region of cyclogenesis
occurs to the lee of the United States Rockies during
boreal winter, spring, and fall. A fourth weaker region
of cyclogenesis occurs in theGulf ofMexico off the coast
of Texas during the winter. On average, the position of
the tracks of midlatitude cyclones in North America os-
cillates between a southernmost wintertime average po-
sition at 408–508Nanda northernmost position at 508–608Nin the summer (Eichler and Higgins 2006). A synoptic
climatology of the structure and propagation of mid-
latitude cyclones by cyclone type is presented in a com-
panion study (submitted to the International Journal of
Climatology).
On interannual time scales, the tracks of wintertime
midlatitude cyclones are displaced southward of their
average positions during El Ni~no years and northward
of their average positions during La Ni~na years (e.g.,
Eichler and Higgins 2006; Bengtsson et al. 2006). This is
due in part to an increase in cyclogenesis density in the
Gulf of Mexico during El Ni~no years (Curtis 2006). In
fact, Curtis (2006) noted that the total number of mid-
latitude cyclones observed in the southern United States,
Gulf of Mexico, Caribbean, and the southern portion of
theGulf Stream (between about 158–378Nand 978–688W)
during El Ni~no years (33 yr21) is about double that of La
Ni~na (14 yr21) or normal (18 yr21) years. These ENSO-
related changes in storm tracks have a significant impact
on the precipitation distribution over the southeastern
United States. Eichler and Higgins (2006) show that
during strong El Ni~no events when storm tracks are
displaced southward of their average positions, the
largest precipitation amounts associated withmidlatitude
cyclones extend from theGulfCoast northeastward along
the East Coast of the United States. In contrast, during
strong La Ni~na years, midlatitude cyclone precipitation
decreases in the easternUnited States as a whole with the
most dramatic precipitation deficits occurring along the
coast. In essence, this means that during strong La Ni~na
events the heaviest precipitation associated with mid-
latitude cyclones shifts westward of the Appalachians
(Eichler and Higgins 2006).
Previous studies have shown dramatic changes in the
behavior of midlatitude cyclones under varying back-
ground shear. Observed seasonal-to-interannual changes
in upper-level jet width, strength, and latitude over North
America have been shown to produce enough change
in background shear to cause a shift in the behavior of
midlatitude cyclones. Even modest changes in environ-
mental shear can produce dramatically different mid-
latitude cyclone morphologies that affect not only the
upper-level features of a midlatitude cyclone but also
the strength, propagation, and length of surface warm
and cold fronts (e.g., Hoskins and West 1979; Davies
et al. 1991; Thorncroft et al. 1993). Midlatitude cyclones
that are embedded in an environment with cyclonic
shear, also known as ‘‘cyclonic behavior,’’ tend to form
upper-level ‘‘broadening troughs,’’ weaker surface cold
fronts, and strong warm fronts. On the other hand,
midlatitude cyclones embedded in anticyclonic shear
environments tend to evolve upper-level ‘‘thinning
troughs’’ that become tilted in the northeast–southwest
(NE–SW) direction as they advance into lower latitudes,
sometimes producing nearly stationary cutoff cyclones.
These so-called anticyclonic behavior midlatitude cy-
clones tend to produce strong elongated slower-moving
surface cold fronts and little or no warm front signature.
This paradigm has proven useful to explain differences in
cyclone behavior associated with the opposite phases of
ENSO (Shapiro et al. 2001;Martius et al. 2007) and of the
NAOand Pacific–NorthAmerican pattern (Martius et al.
2007). Observational evidence for a shift from cyclonic
to anticyclonic behavior has also been found at the time
of the abrupt onset of the monsoon rainfall in the South
Atlantic convergence zone (Nieto Ferreira et al. 2011).
Shifts in midlatitude cyclone behavior over seasonal time
scales in the southeast United States will be addressed in
this study.
There are two basic approaches to midlatitude cy-
clone composite analysis. The first and perhaps most
frequently used can be thought of as a Lagrangian ap-
proach in that the composite is built using a cyclone-
centered frame of reference that ‘‘follows’’ the cyclones
(e.g., Weisman et al. 2002; Field and Wood 2007; Chang
8408 JOURNAL OF CL IMATE VOLUME 26

and Song 2006; Dacre et al. 2012). This approach pro-
duces an integrated picture of storm intensity and struc-
ture for an entire region. Field andWood (2007) used this
Lagrangian approach to produce composites of world-
wide oceanic midlatitude cyclones. They found that for
a given cyclone wind speed strength and atmospheric
moisture content, midlatitude cyclones have similar
structures in different geographical locations. Moreover
they found that the rain rate and fraction of high-level
clouds in the warm sector (southern and eastern flanks)
of midlatitude cyclones increase with increasing cyclone
strength. They attribute this relationship to the fact that
a stronger cyclone has a stronger warm conveyor belt
with stronger updrafts that tend to produce higher rain
rates and larger high cloud fractions. Chang and Song
(2006) used the Lagrangian approach to produce sea-
sonal composites of midlatitude cyclones in the North
Atlantic and Pacific storm-track regions. They found
that North Atlantic midlatitude cyclones are deepest
and have the strongest and most extensive precipitation
in the winter, with minima during summer. North Pacific
cyclones, however, while also deepest in the winter,
produce the largest precipitation amounts in the fall, a
fact that is in line with the well-known midwinter sup-
pression of precipitation in that region (Nakamura 1992).
The second approach is Eulerian in the sense that it
involves compositing cyclones that pass through a fixed
location. This approach is well suited to study the evo-
lution of midlatitude cyclones (e.g., Lau and Crane
1995; Thomas and Martin 2007; Garreaud 2000; Nieto
Ferreira et al. 2011), especially downstream from preferred
regions of cyclogenesis. Senkbeil et al. (2012) classified
strong midlatitude cyclones that affect the SE United
States into five types according to their formation region
and calculated composite cumulative precipitation for
each type to show that storms that form over the Gulf
of Mexico tend to bring the largest precipitation amounts
to the Carolinas. Thomas and Martin (2007) used an
Eulerian composite approach to study the structure,
propagation, and dynamical evolution of Alberta clip-
pers that form to the lee of the Canadian Rockies. Nieto
Ferreira et al. (2011) used the Eulerian approach to
producemidlatitude cyclone composites in SouthAmerica
and show how abrupt changes in the structure of mid-
latitude cyclones can cause the observed abrupt onset of
the monsoon season in the South Atlantic convergence
zone. In general, composite studies find that the strongest
precipitation amounts in a midlatitude cyclone occur in a
comma-shaped region that extends eastward and equa-
torward from the center of the cyclone.
In this study, we choose to produce Eulerian mid-
latitude cyclone composites based on the passage of the
low pressure center through easternNorthCarolina (NC).
Given its location halfway up the East Coast of the
United States and downstream from the main North
American cyclogenesis regions on the lee side of the
Rockies (e.g., Whittaker and Horn 1984), centering our
composites on North Carolina allows us to produce
a synoptic climatology that focuses on the seasonal-to-
interannual variability of the frequency, structure, prop-
agation, and evolution of midlatitude cyclones in the
southeastern United States. In particular, a synoptic cli-
matology of the variability of cyclone structure in seasonal-
to-interannual time scales is currently not available for
the southeastern United States. The synoptic climatology
presented here will shed light not only on preferred pre-
cipitation patterns in the region but also on mechanisms
for seasonal-to-interannual precipitation variability. Sec-
tion 2 discusses the datasets and methodology used to
construct the midlatitude cyclone composites. Section 3
presents an analysis of the seasonal variability of the
propagation, evolution, and structure of midlatitude cy-
clones that affect the southeastern United States. Section
4 investigates the interannual variability in the propaga-
tion, evolution, and structure of these storms. Conclu-
sions are presented in section 5.
2. Datasets and methodology
The datasets used in this project are the high-resolution
National Aeronautics and SpaceAdministration (NASA)’s
Tropical Rainfall Measuring Mission (TRMM) precipi-
tation and the National Centers for Environmental
Prediction (NCEP) reanalysis from 1998 to 2010. The
TRMM-3B42 daily precipitation dataset provides ho-
mogeneous spatial and temporal precipitation coverage
from 508N to 508S at 0.258 resolution (Huffman et al.
2007). TheTRMMsatellite samples precipitation directly
using spaceborne radar and the ice scattering signature
from deep convection, both of which work equally well
over land and ocean. The TRMM-3B42 product com-
bines direct TRMMmeasurements with geosynchronous
satellite cloud-top data and adjusts the precipitation
amounts using rain gauges. As such, TRMM-3B42 has
become the standard for producing regional and global
precipitation maps (Huffman et al. 2007). The NCEP
reanalysis (Kalnay et al. 1996) is a global daily 2.58 hori-zontal resolution blend of observations and model. In
this study, the NCEP reanalysis sea level pressure, winds
and geopotential anomalies, and the TRMM daily pre-
cipitation are used to construct composites of the life
cycle of midlatitude cyclones that affected the southeast
United States between 1998 and 2010.
For the purposes of this study, a midlatitude cyclone
passage is defined as the time when the NCEP reanalysis
SLP at a basis region in eastern North Carolina at 358N,
1 NOVEMBER 2013 N I E TO FERRE IRA ET AL . 8409

758W experiences a 2-mb fall over a 24-h period, taking
care to remove consecutive days of greater than 2-mb
pressure drop. The choice of threshold is based on a
subjective analysis of the NCEP reanalysis daily time
series of SLP at the basis region and concurrent surface
weather maps [available from the National Oceanic and
Atmospheric Administration (NOAA) at http://www.
hpc.ncep.noaa.gov/dailywxmap/], with the goal of cap-
turing local pressure drops associated not only with di-
rect cyclone passage over the base region but also
midlatitude cyclones centered somewhere else in
eastern North America. Note that this criterion does
not allow us to determine what portion of a midlatitude
cyclone (e.g., the cyclone center, warm, cold, stationary,
or occluded front) passes through the region of interest.
This means that the composites shown here include for
example Hatteras lows that form offshore and low
pressure centers such as the rare Alberta clipper that
crosses the coast farther north in Canada (Thomas and
Martin 2007). Sensitivity tests of the robustness of the
composites for different SLP drop thresholds were car-
ried out. The cyclone composites were calculated for
thresholds of 2-, 4-, and 6-mb SLP drops. The higher the
threshold for the pressure drop, the lower the number of
storms in the composite. While the number of storms
captured by each threshold was different, the evolution
of the patterns of precipitation, winds, and SLP in the
three composites was quite similar. The main difference
was that the 6-mb threshold had slightly stronger pre-
cipitation and winds and slightly deeper average SLP
values. Similar SLP-based definitions of midlatitude
cyclone passages have been used in previous studies
(Garreaud 2000; Nieto Ferreira et al. 2011).
Seasonal and interannual changes in the structure,
propagation, and evolution of midlatitude cyclones that
affect the southeastern United States are studied using
6-day Eulerian seasonal composites of the TRMM pre-
cipitation and NCEP reanalysis SLP and winds and
geopotential fields. The SLP field shows the location of
the surface cyclone center, while the upper-level winds
and geopotential are used to indicate the presence of
upper-level support for the growth and propagation of
the surface cyclone. The seasonal composites are cal-
culated for the day of the midlatitude cyclone passage
overNC(day 0) aswell as for thenth dayprior to its passage
(day 2n) and the nth day after its passage (day 1n).
3. Seasonal variability
The aforementioned criterion detected a total of 861
midlatitude cyclones that affected North Carolina from
1998 to 2010. Tropical cyclones were removed from the
list manually based on an archive of historical hurricane
tracks (NOAA 2011). The seasonal variability of the
structure, evolution, and propagation of midlatitude cy-
clones in the southeastern United States is analyzed in
this section. This analysis focuses on differences in cy-
clone circulation fields (given by sea level pressure,
850-mb winds, 200-mb geopotential anomalies, and
200-mb wind intensity) and their associated precipitation
distribution and amounts. In agreement with previous
studies, the seasonal distribution of the number of mid-
latitude cyclones that passed through NC between 1998
and 2010 has a distinct annual cycle with a maximum
in boreal winter [279 cyclones in December–February
(DJF)] and a minimum in boreal summer [162 cyclones
in June–August (JJA)]. The number of midlatitude
cyclones observed in the boreal fall (September–
November) and spring (March–May) were 242 and
200, respectively.
a. Winter composite
The winter composite is characterized by the presence
of an eastward-propagating midlatitude cyclone that
extends deep into the subtropics (Fig. 2). A total of
279 winter cases are included in this composite. A low
pressure center first appears along the eastern side of the
Rockies on day 22 (Fig. 2) and propagates eastward as
it deepens to maximum intensity, as indicated by the
presence of a closed low pressure center with very strong
rainfall over the Gulf Stream on day 0. Ahead of the low
pressure center on day 22, southwesterly winds bring
moist air from the Gulf of Mexico to fuel a large area of
precipitation that appears over the lower Mississippi
Valley. This southwesterly wind pattern extends over
the entire southeast United States by day 21 and con-
tinues to move eastward with the low pressure center,
finally crossing into the Atlantic Ocean on day 0. In this
composite, land-based precipitation occurs only in the
presence of the synoptic-scale forcing by themidlatitude
cyclone during days 22 and 21. At all other composite
times, the presence of strong high pressure centers
ahead and behind the cyclone inhibit precipitation over
the central and eastern United States. This composite
also shows that midlatitude cyclones produce much
more precipitation over the lower Mississippi Valley
than over the Carolinas, something that is readily re-
flected on the climatological winter precipitation (Fig. 1)
for the region and may in part be associated with a rain
shadow effect of the Appalachian Mountains. Although
there is precipitation offshore on every day of the
composite, the strongest rainfall occurs on day 0 when
the midlatitude cyclone passes over the warm waters of
the Gulf Stream.
Precipitation only occurs over the Carolinas during
days21 and 0 of themidlatitude cyclone passage. Figure 2
8410 JOURNAL OF CL IMATE VOLUME 26

shows the percentage of the total wintertime precip-
itation that is contributed by themidlatitude cyclones on
days 21 and 0 of the composite. More than 80% of the
total wintertime precipitation in the eastern plains of the
Carolinas is associated with the passage of midlatitude
cyclones (Fig. 3). The Piedmont and mountainous re-
gions of North Carolina also receive a large portion (over
70%) of their wintertime precipitation from midlatitude
cyclones (Fig. 3).
In the upper levels, the core of the jet stream has
winds in excess of 45m s21 at 200mb and is centered
over North Carolina on every day of the composite
(Fig. 4). At 200mb, a north–south-elongated center of
negative geopotential anomalies first appears at the jet
entrance region on the lee side of the Rockies on day21.
This center of negative geopotential anomalies indicates
the location of the upper-level trough associated with the
midlatitude cyclone. The center of negative geopotential
FIG. 2. Wintertime composites of TRMM rainfall (shaded; mmday21), NCEP reanalysis SLP (contours; mb), and 850-mb winds
(vectors; m s21) for the period 1998–2010 (279 cases). The composites are shown for the day of (day 0), the nth day prior to (day2n), and
the nth day after (day 1n) the passage of a midlatitude cyclone over NC: day (a) 23, (b) 22, (c) 21, (d) 0, (e) 11, and (f) 12.
1 NOVEMBER 2013 N I E TO FERRE IRA ET AL . 8411

anomaly remains north–south oriented as it strengthens
and propagates eastward along the jet stream reaching
the exit region of the jet stream over the Atlantic on day
12. In agreement with the expected structure of a mid-
latitude cyclone, the surface low pressure center and
precipitation (Fig. 2) remain ahead of the upper-level
trough between days 22 and 13 (Fig. 4).
b. Summer composite
The summer composite is characterized by the pres-
ence of a low-level semistationary midlatitude trough
that extends into the subtropics affecting the prevailing
wind flow and precipitation patterns for a couple of days
(Fig. 5). A total of 162 cases are included in the summer
composite or a little over half the number of midlatitude
cyclones in the winter midlatitude composite.
The effect of the midlatitude cyclone passage on
precipitation is not nearly as dramatic in the summertime
as it is in the wintertime. In the summertime, there is
widespread precipitation over the southeastern United
States on every day of the composite (Fig. 5). This daily
widespread precipitation is in part modulated by the
diurnal cycle of heating over the continent that plays
a stronger role in the summer (Winkler et al. 1988). This
is very different from the winter composite in which
land-based precipitation only occurs during the passage
of the midlatitude cyclone (Fig. 2). Consequently, only
about 30%–40% of the total summertime precipitation
in North Carolina (Fig. 3) occurs on days when a mid-
latitude cyclone is present, compared to over 70%–80%
in the winter. In the summer, however, whenwidespread
precipitation is present on most days, not all precip-
itation that occurs on a cyclone day can be attributed to
synoptic-scale forcing. This means that the actual con-
tribution of midlatitude cyclones to summertime precip-
itation is somewhat smaller than what is shown in Fig. 3.
FIG. 3. Percent of total monthly rain that occurred during days 21 and 0 of a midlatitude
cyclone passage in North Carolina for (top) winter (DJF) and (bottom) summer (JJA).
8412 JOURNAL OF CL IMATE VOLUME 26

Another distinct feature of the summertime composite
is the presence of precipitation along the Gulf Coast
from Louisiana to Florida and the entire Florida pen-
insula on every day of the composite (Fig. 5). Precip-
itation over the Gulf Stream is actually much weaker
during the summer than winter composite. This is again
reflected in the summertime climatological precipitation
shown inFig. 1.As summertimemidlatitude cyclones cross
into the Atlantic Ocean on days 0 and11, they enhance
precipitation over the Gulf Stream but not nearly as
much as their wintertime counterparts, likely due to the
weaker thermal contrast between air and sea in the
summer. One similarity between summer and winter
composites is that summertime midlatitude cyclones
also produce more precipitation before crossing the
Appalachian Mountains than on their lee side over the
coastal plains of the Carolinas and Virginia, again sug-
gesting a rain shadow effect of the mountains.
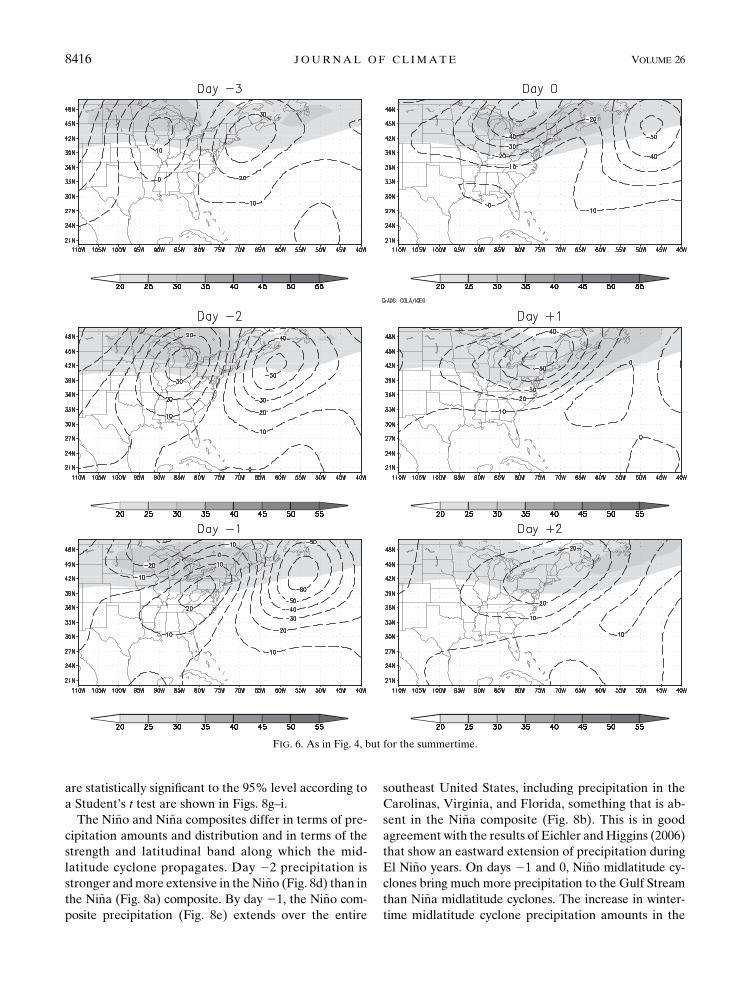
FIG. 4. As in Fig. 2, but for the NCEP reanalysis wind intensity (m s21) and geopotential anomalies (m2 s22) at 200mb.
1 NOVEMBER 2013 N I E TO FERRE IRA ET AL . 8413

The low-level trough associated with this cyclone be-
gins intruding southward into the eastern United States
on day22, becoming elongated in the NE–SW direction
along the East Coast on day 0 and later retreating
northward with little eastward propagation (Fig. 5). A
very significant feature of the summer composite that is
absent in any of the other seasonal composites is the
presence of two tropospheric ‘‘rivers’’ (Zhu and Newell
1998) that carrymoist tropical air northeastward into the
subtropics and midlatitudes. These tropospheric rivers
are located along the Gulf Stream and along the Sierra
Madre and Rocky Mountains and are present in every
day of the summer composite. The passage of the mid-
latitude cyclone modulates the strength and direction of
flow of the tropospheric rivers. Although southwesterly
winds prevail over the Gulf Stream throughout the com-
posite, the strongest southwesterly winds in this region
occur on days 21 and 0, when the midlatitude trough
reaches deepest into the tropics along theEast Coast of the
United States. This is also the timewhen the SLP gradients
FIG. 5. As in Fig. 2, but for the summertime (162 cases).
8414 JOURNAL OF CL IMATE VOLUME 26

along the coast are strongest. The second tropospheric river
is associated with the North American monsoon system.
Southerly winds carry moist tropical air from the western
Gulf ofMexico along the eastern side of the SierraMadres
and Rocky Mountains into the central United States.
The upper-level jet stream is located farther north
(458N), and it is weaker (25m s21) in the summer (Fig. 6)
than in the winter (Fig. 3), a set up that has been shown
to favor anticyclonic behavior in midlatitude cyclone life
cycles (Esler and Haynes 1999). During the summer, the
southwestern tail end of a negative geopotential anom-
aly center first appears on day 21 (Fig. 6c) just west of
the Great Lakes and propagates southeastward very
slowly over the next few days. In the summertime com-
posite, the axis of the upper-level trough is initially elon-
gated in the northeast–southwest direction (day21) and
appears to rotate anticyclonically as it moves slowly
southeastward from days 0 to 12. The summertime
upper-level trough propagates eastward so slowly that
its axis is still over the continent on day12 (Fig. 6e). The
summertime upper-level trough therefore has a differ-
ent shape, much slower speed, and is centered farther
north than its wintertime counterpart. An analysis of the
monthly upper-level composites of midlatitude cyclones
that cross North Carolina (not shown) indicates that as
winter gives way to spring, upper-level troughs slow down,
retreat northward, and become increasingly more tilted
in the northeast–southwest direction, finally leading to a
nearly stationary east–west-oriented midlatitude trough
in the summer. The reverse occurs in the fall. This change
in midlatitude cyclone behavior from wintertime north–
south-oriented fast eastward-propagating upper-level
troughs to summertime northeast–southeast-tilted nearly
stationary upper-level troughs indicates a shift from cy-
clonic behavior storms in the winter to anticyclonic be-
havior storms in the summer. During the summertime
when the southeastern United States is located on the
anticyclonic shear side of the northward-displaced upper-
level jet, midlatitude cyclones tend to display a more
anticyclonic or thinning trough behavior with northeast–
southwest-tilted upper-level troughs that are slowmoving
or nearly stationary. During the wintertime when the jet
stream becomes centered over North Carolina, the cy-
clonic or ‘‘broadening trough’’ behavior prevails in the
southeast United States. In good agreement with our
finding of cyclonic behavior for the composite wintertime
cyclones, Martius et al. (2007) found that twice as many
cyclonic as anticyclonic behavior cyclones are observed
during the wintertime in the North American sector.
c. Fall and spring composites
Figure 7 shows the day 22 through day 0 composites
of SLP, 850-mb winds, and TRMM precipitation for the
spring and fall seasons. The spring and fall composites
have transitional characteristics that can be placed
somewhere between the summer andwinter composites.
Springmidlatitude cyclones (Figs. 7a–c) aremore similar
to winter cyclones (Figs. 2b–d) in that they are character-
ized by the presence of a well-defined northeastward-
traveling surface low pressure center that is accompanied
by precipitation on its east-southeast flank. Like in win-
ter, springtime land-based precipitation is limited to the
days when the cyclone is present. The spring composite
low pressure center propagates farther south than its
winter counterpart. Oceanic precipitation in the spring
is much weaker than during the other seasons, even
over the Gulf Stream. Fall storms (Figs. 7d–f) on the
other hand behave more like summer storms (Figs. 5b–d)
in the sense that they are characterized by the presence
of a trough that is propagating eastward farther north
along the United States–Canada border. During fall,
this trough is better able to organize precipitation in
the SE United States than its summer counterpart
(Figs. 5b–d). The fall composites are the only com-
posites that have significant precipitation in the Gulf
of Mexico.
4. Interannual variability
The interannual variability of wintertime midlatitude
cyclone structure from 1998 to 2010 is studied by recal-
culating the seasonal composites segregated according
to the phase of the El Ni~no–Southern Oscillation. The
oceanic Ni~no index (ONI; from http://www.cpc.ncep.noaa.
gov/products/analysis_monitoring/ensostuff/ensoyears.
shtml) was used to classify each season as an El Ni~no,
neutral, or La Ni~na period as shown in Table 1. A
similar frequency of wintertime midlatitude cyclones is
observed to occur in El Ni~no (20yr21), La Ni~na (21yr21),
and normal years (22 yr21). This result stands in contrast
to the Curtis (2006) finding that wintertime midlatitude
cyclone counts in the southeastern region of the United
States were twice as large in Ni~no years than those in
either Ni~na or normal years. This discrepancy is likely
due to differences in the domain of interest, which in
Curtis (2006) includes storms over the ocean, as well as
differences in storm counting techniques and time pe-
riods used in the two studies.
The composites show significant differences in the
structure and propagation of wintertime midlatitude
cyclones during Ni~na and Ni~no years. Figure 8 shows
composites of the low-level structure of midlatitude
cyclones that occurred during Ni~na (Figs. 8a–c; 107
events) and Ni~no (Figs. 8d–f; 98 events) years. The dif-
ferences between the Ni~no and Ni~na midlatitude cyclone
composites are also shown (Figs. 8g–i). Only results that
1 NOVEMBER 2013 N I E TO FERRE IRA ET AL . 8415
are statistically significant to the 95% level according to
a Student’s t test are shown in Figs. 8g–i.
The Ni~no and Ni~na composites differ in terms of pre-
cipitation amounts and distribution and in terms of the
strength and latitudinal band along which the mid-
latitude cyclone propagates. Day 22 precipitation is
stronger andmore extensive in the Ni~no (Fig. 8d) than in
the Ni~na (Fig. 8a) composite. By day 21, the Ni~no com-
posite precipitation (Fig. 8e) extends over the entire
southeast United States, including precipitation in the
Carolinas, Virginia, and Florida, something that is ab-
sent in the Ni~na composite (Fig. 8b). This is in good
agreement with the results of Eichler andHiggins (2006)
that show an eastward extension of precipitation during
El Ni~no years. On days 21 and 0, Ni~no midlatitude cy-
clones bring much more precipitation to the Gulf Stream
than Ni~na midlatitude cyclones. The increase in winter-
time midlatitude cyclone precipitation amounts in the
FIG. 6. As in Fig. 4, but for the summertime.
8416 JOURNAL OF CL IMATE VOLUME 26

southeast United States during El Ni~no accounts for the
well-known observation that El Ni~no events tend to
cause an increase in October–March precipitation
amounts in the southeast United States (e.g., Ropelewski
and Halpert 1986). The Ni~no composite midlatitude
cyclones also have a deeper surface low pressure center
that propagates eastward along a latitude farther south
than the midlatitude cyclones that occur during Ni~na
years (in agreement with Bengtsson et al. 2006). This
deeper El Ni~no low pressure center is accompanied by
stronger cyclonic winds on days 21 and 0 (Figs. 8h,i).
The upper-level geopotential anomalies (not shown)
also point to the presence of stronger midlatitude cy-
clones that propagate eastward along a latitude that is
farther south in Ni~no than in Ni~na or normal years. The
reason for the increased strength and farther south lo-
cation of the track of midlatitude cyclones during Ni~no
winters is the presence of a stronger upper-levelmidlatitude
FIG. 7. As in Fig. 2, but for fall and spring from day 22 to day 0.
1 NOVEMBER 2013 N I E TO FERRE IRA ET AL . 8417

jet that is centered farther south during those winters
(not shown). A comparison between the two strongest
Ni~no and Ni~na events of the study period (not shown)
yields similar results.
5. Conclusions
Previous synoptic climatologies of midlatitude cy-
clones in the southeast United States have focused on
the seasonal and interannual variability of storm num-
bers, preferred regions of origin and tracks, wintertime
total precipitation and snowfall amounts, and extreme
precipitation. This study fills a gap in the literature by
providing a general synoptic climatology of the seasonal-
to-interannual variability of the structure and evolution
of midlatitude cyclones in the southeast United States.
Daily TRMM precipitation and NCEP reanalysis prod-
ucts were used to calculate 6-day-long composites of
midlatitude cyclones that affected North Carolina be-
tween 1998 and 2010. The midlatitude cyclone compos-
ites in this study are based on a 22-mb 24-h pressure
tendency in eastern North Carolina. This basis region is
chosen because its location is halfway up the East Coast
of the United States and downstream of the main North
American cyclogenesis regions on the lee side of the
Rockies (e.g., Whittaker and Horn 1984) makes it well
positioned to capture cyclones that affect the eastern
United States. This study finds that nearly twice as many
midlatitude cyclones affected North Carolina during
winter (279 events) as during summer (162 events). The
number of midlatitude cyclones observed in the spring
and fall were 242 and 200, respectively.
The composites show significant seasonal changes in
the propagation and structure of midlatitude cyclones in
the southeastern United States. In the low levels, the
winter composite shows an eastward-propagating
FIG. 8. As in Fig. 2, but for (left) La Ni~na (107 midlatitude cyclone events), (center) El Ni~no (98 midlatitude cyclone events), and (right)
the difference between El Ni~no and La Ni~na: (top)–(bottom) from day 22 to day 0.
TABLE 1. List of El Ni~no, normal, and La Ni~na years used in making the DJF ENSO midlatitude cyclone
composites. Years in which the absolute value of the ONI . 1.5 are indicated in boldface.
El Ni~no Normal La Ni~na
Years 1997/98, 2002/03, 2004/05,
2006/07, and 2009/10
2001/02, 2003/04, and 2008/09 1998/99, 1999/00, 2000/01,
2005/06, and 2007/08
8418 JOURNAL OF CL IMATE VOLUME 26

midlatitude cyclone that extends deep into the sub-
tropics. Land-based wintertime precipitation occurs only
on days 22 and 21 in and ahead of the low-level mid-
latitude cyclone low pressure center. More than 80% of
the total wintertime precipitation in the eastern plains of
the Carolinas is associated with the passage of mid-
latitude cyclones. The Piedmont and mountainous re-
gions of North Carolina also receive a large portion
(over 70%) of their wintertime precipitation from mid-
latitude cyclones. The composites also show that mid-
latitude cyclones produce more precipitation on the
windward side of the Appalachians over the lower Mis-
sissippi Valley than over the Carolinas, something that
may be associated with a rain shadow effect of the Ap-
palachianMountains. This is consistent with the presence
of a climatological wintertime rain maximum to the west
of the Appalachians. The spring composites (not shown)
are similar to the winter composites when it comes to
land-based precipitation distributions. The summer
composite is characterized by the presence of a semista-
tionary midlatitude trough that extends into the sub-
tropics, affecting the prevailing wind flow and rainfall
patterns for only 1–2 days. The low-level trough associ-
atedwith this cyclone passage begins intruding southward
into the eastern United States on day 22, becoming
elongated in the NE–SW direction along the East Coast
on day 0 and later retreating northward without much
eastward propagation. The effect of the midlatitude cy-
clone passage upon precipitation is not nearly as dramatic
in the summertime as it is in the wintertime. Only about
30%–40%of the total summertime precipitation inNorth
Carolina occurs on days when a midlatitude cyclone is
present, compared to over 70%–80% in the winter. This
difference occurs in part because the summer is charac-
terized by the presence of widespread precipitation over
the southeastern United States on every day of the
composite. As in the winter, summer midlatitude cy-
clones bring much more precipitation to the west of the
Appalachians than to the Carolinas.
In the upper levels, the axis of the wintertime upper-
level trough associated with the midlatitude cyclone
remains north–south oriented and propagates eastward
along 408N. During the summer, however, the upper-
level trough has slower propagation and an axis that
is tilted in the northeast–southwest direction. Closer
analysis of the annual cycle of the characteristics of the
upper-level troughs indicates that as spring progresses
upper-level troughs slow down, retreat northward, and
become increasingly more tilted in the northeast–
southwest direction, with the reverse occurring in the
fall. As discussed above, these seasonal changes in upper-
level circulation are associated with significant changes
in the low-level structure and precipitation patterns of
midlatitude cyclones that affect the SEUnited States. In
sum, our composites suggest that the baroclinic life cycle
behavior shift paradigm (Thorncroft et al. 1993) may be
useful to explain the winter-to-summer shift in mid-
latitude cyclone behavior observed in the southeastern
United States.
The ENSO-related variability of the structure and
propagation of midlatitude cyclones is also studied.
During the boreal winter the composites show the pres-
ence of a more intense and southward-displaced upper-
level jet, stronger midlatitude cyclones, and more intense
precipitation over a larger area during Ni~no than Ni~na
years. Specifically, there is a stark contrast in precipita-
tion in the cyclone warm sector over the coastal plains
on the eastern side of the Appalachian Mountains from
Georgia to North Carolina with heavy rain in the Ni~no
and light rain in the Ni~na cyclone composites.
This study of the synoptic climatology of midlatitude
cyclones in the southeastern United States provides the
foundation for an ongoing companion study of the de-
tailed climatology of radar-observed mesoscale precip-
itation organization within midlatitude cyclones in the
southeastern United States. According to the U.S. Cen-
sus Bureau, the southern United States has some of the
fastest growing state populations in the United States
and this trend is expected to continue (U.S. Census
Bureau 2013; http://www.census.gov/prod/cen2010/briefs/
c2010br-01.pdf). This line of work is especially important
because model simulations of future climate predict that
by the end of this century anthropogenic climate change
will cause midlatitude cyclone tracks to be displaced
poleward of their current position (e.g., Bengtsson et al.
2006; Yin 2005), affecting not only the number of mid-
latitude cyclones that will reach the southeast United
States but also likely affecting their strength and structure,
as well as causing a potential decrease in precipitation
amounts in a region of the United States that is highly
populated and accustomed to plentiful water availability.
Acknowledgments. This project is funded by the Cli-
mate and Large-Scale Dynamics and the Physical and
Dynamic Meteorology programs of the National Science
Foundation’s Division of Atmospheric and Geospatial
Sciences Award AGS-1118141. Mr. Hall received addi-
tional funding from a NC Space Grant Graduate Re-
search Fellowship Award. We are grateful to the three
anonymous reviewers whose comments greatly benefited
this manuscript.
REFERENCES
Bengtsson, L., K. I. Hodges, and E. Roeckner, 2006: Storm tracks
and climate change. J. Climate, 19, 3518–3543.
1 NOVEMBER 2013 N I E TO FERRE IRA ET AL . 8419

Carbone, R. E., and J. D. Tuttle, 2008: Rainfall occurrence in the
U.S. warm season: The diurnal cycle. J. Climate, 21, 4132–
4146.
Chang, E. K. M., and S. Song, 2006: The seasonal cycles in
the distribution of precipitation around cyclones in the
western North Pacific and Atlantic. J. Atmos. Sci., 63, 815–
839.
Colucci, S. J., 1976: Winter cyclone frequencies over the eastern
United States and adjacent western Atlantic, 1964–1973. Bull.
Amer. Meteor. Soc., 57, 548–553.
Curtis, S., 2006: Developing a climatology of the south’s ‘other’
storm season. Southeast. Geogr., 46, 231–244.
Dacre, H. F., M. K. Hawcroft, M. A. Stringer, and K. I. Hodges,
2012: An extratropical cyclone atlas.Bull. Amer. Meteor. Soc.,
93, 1497–1502.
Davies, H. C., C. Sch€ar, and H. Wernli, 1991: The palette of fronts
and cyclones within a baroclinic wave development. J. Atmos.
Sci., 48, 1666–1689.
Dolan, R., H. Lins, and B. Hayden, 1988: Mid-Atlantic coastal
storms. J. Coastal Res., 3, 417–433.
Durkee, J. D., J. D. Frye, C. M. Fuhrmanny, M. C. Lacke,
H. G. Jeong, and T. L. Mote, 2008: Effects of the North At-
lantic Oscillation on precipitation-type frequency and distri-
bution in the easternUnited States.Theor. Appl. Climatol., 94,
51–65.
Eichler, T., and W. Higgins, 2006: Climatology and ENSO-related
variability of North American extratropical cyclone activity.
J. Climate, 19, 2076–2093.
Esler, J. G., and P. H. Haynes, 1999: Baroclinic wave breaking and
the internal variability of the tropospheric circulation. J. At-
mos. Sci., 56, 4014–4031.
Field, P. R., and R. Wood, 2007: Precipitation and cloud structure
in midlatitude cyclones. J. Climate, 20, 233–254.
Frankoski, N. J., and A. T. DeGaetano, 2011: An East Coast
winter storm precipitation climatology. Int. J. Climatol., 31,
802–814.
Garreaud, R. D., 2000: Cold air incursions over subtropical South
America: Mean structure and dynamics.Mon. Wea. Rev., 128,
2544–2559.
Hirsch, M. E., A. T. DeGaetano, and S. J. Colucci, 2001: An
East Coast winter storm climatology. J. Climate, 14, 882–
899.
Hoskins, B. J., and N. V. West, 1979: Baroclinic waves and
frontogenesis. Part II: Uniform potential vorticity jet
flows—Cold and warm fronts. J. Atmos. Sci., 36, 1663–
1680.
Huffman, G. J., and Coauthors, 2007: The TRMM Multisatellite
Precipitation Analysis: Quasi-global, multiyear, combined-
sensor precipitation estimates at fine scales. J. Hydrometeor.,
8, 38–55.
Kalnay, E., and Coauthors, 1996: The NCEP/NCAR 40-Year
Reanalysis Project. Bull. Amer. Meteor. Soc., 77, 437–
472.
Koch, S., and C. Ray, 1997: Mesoanalysis of summertime conver-
gence zones in central and eastern North Carolina. Wea.
Forecasting, 12, 56–77.Konrad, C. E., II, 1997: Synoptic-scale features associated with
warm-season heavy rainfall over the interior southeastern
United States. Wea. Forecasting, 12, 557–571.
Larson, J., Y. Zhou, and R. W. Higgins, 2005: Characteristics of
landfalling tropical cyclones in the United States and Mexico:
Climatology and interannual variability. J. Climate, 18, 1246–
1262.
Lau, N. C., andM.W. Crane, 1995: A satellite view of the synoptic-
scale organization of cloud properties in midlatitude and
tropical circulation systems. Mon. Wea. Rev., 123, 1984–2006.
Martius, O., C. Schvierz, and H. C. Davies, 2007: Breaking
waves at the tropopause in the wintertime Northern
Hemisphere: Climatological analyses of the orientation
and the theoretical LC1/2 classification. J. Atmos. Sci., 64,
2576–2592.
Mather, J. R., H. Adams III, and G. A. Yoshioka, 1964: Coastal
storms of the eastern United States. J. Appl. Meteor., 3, 693–
706.
Nakamura, H., 1992: Midwinter suppression of baroclinic wave
activity in the Pacific. J. Atmos. Sci., 49, 1629–1642.
Nieto Ferreira, R., T. M. Rickenbach, and E. A. Wright, 2011: The
role of cold fronts in the onset of the monsoon season in the
South Atlantic convergence zone.Quart. J. Roy. Meteor. Soc.,
137, 908–922, doi:10.1002/qj.810.NOAA, cited 2011: Historical hurricane tracks database. [Avail-
able online at http://www.csc.noaa.gov/hurricanes/#.]
Parker, M. D., and D. A. Ahijevych, 2007: Convective episodes
in the east-central United States. Mon. Wea. Rev., 135,
3707–3727.
Reitan, C. H., 1974: Frequencies of cyclones and cyclogenesis
for North America, 1951–1970. Mon. Wea. Rev., 102, 861–
868.
Robinson, P., 2006: Implications of long-term precipitation amount
changes for water sustainability in North Carolina. Phys. Geogr.,
27, 286–296.
Ropelewski, C. F., and M. S. Halpert, 1986: North American
precipitation and temperature patterns associated with the
El Ni~no/Southern Oscillation (ENSO). Mon. Wea. Rev., 114,
2352–2362.
Senkbeil, J. C., D. M. Brommer, and I. J. Comstock, 2012:
Hydrometeorological application of an extratropical
cyclone classification scheme in the southern United
States. Theor. Appl. Climatol., 109, 27–38, doi:10.1007/
s00704-011-0562-1.
Shapiro,M. A., H.Wernli, N. A. Bond, andR. Langland, 2001: The
influence of the 1997–99 El Ni~no Southern Oscillation on ex-
tratropical baroclinic life cycles over the eastern North Pacific.
Quart. J. Roy. Meteor. Soc., 127, 331–342.Shepherd, J.M., A.Grundstein, and T.Mote, 2007:Quantifying the
contribution of tropical cyclones to extreme rainfall along the
coastal southeastern United States. Geophys. Res. Lett., 34,
L23810, doi:10.1029/2007GL031694.
Solomon, S., D. Qin,M.Manning, Z. Chen,M.Marquis, K. Averyt,
M. Tignor, and H. L. Miller Jr., Eds., 2007: Climate Change
2007: The Physical Science Basis.CambridgeUniversity Press,
996 pp.
Thomas, B. C., and J. E. Martin, 2007: A synoptic climatology and
composite analysis of the Alberta clipper. Wea. Forecasting,
22, 315–333.
Thorncroft, C. D., B. J. Hoskins, and M. E. McIntyre, 1993: Two
paradigms of baroclinic-wave life-cycle behavior. Quart. J.
Roy. Meteor. Soc., 119, 17–55.
U.S. Census Bureau, cited 2013: Population distribution and
change, 2010 census briefs. [Available online at http://www.
census.gov/prod/cen2010/briefs/c2010br-01.pdf.]
Weisman, R. A., K. G. McGregor, D. R. Novak, J. L. Selzler, M. L.
Spinar, and B. C. Thomas, 2002: Precipitation regimes during
cold-season central U.S. inverted trough cases. Part I: Synoptic
climatology and composite study. Wea. Forecasting, 17, 1173–
1193.
8420 JOURNAL OF CL IMATE VOLUME 26

Whittaker, L. M., and L. H. Horn, 1984: Northern Hemisphere
extratropical cyclone activity for four mid-season months.
J. Climatol., 4, 297–310.
Winkler, J. A., B. R. Skeeter, and P. D. Yamamoto, 1988: Seasonal
variations in the diurnal characteristics of heavy hourly pre-
cipitation across theUnited States.Mon.Wea. Rev., 116, 1641–
1658.
Wuensch, S. X., and S. Curtis, 2010: Can satellites be used to detect
extreme precipitation events? An example from the Caro-
linas. Southeast. Geogr., 50, 244–257.
Yin, J. H., 2005: A consistent poleward shift of the storm tracks in
simulations of 21st century climate. Geophys. Res. Lett., 32,
L18701, doi:10.1029/2005GL023684.
Zhu, Y., and R. E. Newell, 1998: A proposed algorithm for mois-
ture fluxes from atmospheric rivers.Mon.Wea. Rev., 126, 725–
735.
Zishka, K. M., and P. J. Smith, 1980: The climatology of cyclones
and anticyclones over North America and surrounding ocean
environs for January and July, 1950–77. Mon. Wea. Rev., 108,
387–401.
1 NOVEMBER 2013 N I E TO FERRE IRA ET AL . 8421

Copyright of Journal of Climate is the property of American Meteorological Society and itscontent may not be copied or emailed to multiple sites or posted to a listserv without thecopyright holder's express written permission. However, users may print, download, or emailarticles for individual use.