a cointegration analysis of air travel … 6(1)_… · a cointegration analysis of air travel...
TRANSCRIPT

104
Erraitab E. et al. A Cointegration Analysis of Air Travel Demand: The Case of International Air Travel Demand between Morocco and European Union
UDC: 656.7(64) DOI: http://dx.doi.org/10.7708/ijtte.2016.6(1).09
A COINTEGRATION ANALYSIS OF AIR TRAVEL DEMAND: THE CASE OF INTERNATIONAL AIR TRAVEL DEMAND BETWEEN MOROCCO AND EUROPEAN UNION
Elmostafa Erraitab1, Ahmed Hefnaoui2, Mohammed Moutmihi3 1,2,3 Hassan II University, Faculty of Economic, Legal and Social Sciences. Laboratory of Economic and
Logistics Performance. Mohammedia, Morocco
Received 1 September 2015; accepted 14 January 2016
Abstract: Europe is the most important source of tourism for Morocco. The purpose of this paper is to investigate the short and long-run determinants of air travel demand from European Union to Morocco. In order to analyze the air travel demand, we used the relevant macroeconomic variables, such as the origin countries’ income, i.e. Europe and the real exchange rate between the origin and host country. Annual data from the two countries, covering the period 1970-2012, are used. The ADF unit root test was used to examine the degree of variables integration. The Johansen maximum likelihood procedure was used to determine the number of co-integrating vectors in the VAR model. An error correction model was estimated to explain the air travel demand determinants between Morocco and the EU both in short and long-run. The estimated error correction model provides strong evidence that European GDP, real exchange rate fluctuations and regulatory environment are the main factors affecting air travel demand in Morocco.
Keywords: co-integration, error correction model (ECM), air travel demand, Morocco.
1 Corresponding author: [email protected]
1. Introduction
Tourism is a key sector for the Moroccan economy, tourism GDP (Gross Domestic Product) is 57 billion dirhams (the local Moroccan currency), it contributes by 7% to the national GDP (Haut Commissariat au Plan, 2012). In fact, in 2012, domestic consumption of inbound tourism, which consists of the consumption of non-resident (foreign) tourists and that of Moroccans living abroad (MLA), reached 69 billion dirhams. An analysis of Moroccan tourism receipts, demonstrates that imports and exports of tourism sector reached 69.33 bil l ion dirhams in 2012 (The tourism imports are represented by the spending of
Moroccans abroad, while the sector exports accounts for spending of non residents and MLA in Moroccan territory.): 10,75 billion dhs of imports and 58,58 billion dhs of export. As a result, the sector showed a positive balance of 47.43 billion dhs (Office des Changes, 2012). Generally, the Moroccan tourism balance is known as being most of the time largely positive. Simultaneously, the trade balance achieved in the same year, 2012, a deficit of 80 billion dhs. Therefore, given the considerable chronic deficit of the Moroccan balance of payments, the tourism sector is largely in surplus and it is considered as being strategic for the Moroccan economy. According to WTTC (2014), the direct contribution of travel and

105
International Journal for Traffic and Transport Engineering, 2016, 6(1): 104 - 120
tourism constitutes 8.6% of Morocco’s GDP in 2013. Such share is expected to increase by 5.6% over the period 2014-2024, bringing the share of travel and tourism to 9.7% of GDP by 2014. In 2013, the travel and tourism sector supported 814 000 jobs, representing 7.6% of total workforce.
According to Moroccan airports authority (Office National Des Aéroports, 2015), the number of passengers t ravel l ing through Morocco’s airports reached 17.4 mil. passengers in 2014, giving an annual growth rate of 5% compared to 2013. Besides, Ministère de l’Equipement, du Transport et de la Logistique (2010) announced that the Moroccan air travel will achieve an annual growth rate of at least 6.2% over the period 2014-2035. Thus, as the air travel demand is expected to achieve a sustained long-run growth, hence, it would be necessary to study the relevant factors that explain the Moroccan air travel demand.
The air traffic analysis has been the focus of a large number of studies that have tried to identify the determinants of the air travel demand2 (Chi, 2014; Abed et al., 2001; Kulendran and Wilson, 2000; Jorge-Calderón, 1997). By analyzing the literature on air transportation, (Ginieis et al., 2012) found that the number of papers on air transportation in social science has increased; in 2001, there were approximately 70 publications. Such number grew to over 100 in 2006 and exceeded 110 in 2008. This number of publications would seem to suggest that there is a growing interest in the literature on air transportation by the researchers and academicians.
2 A distinction should be made between literature on determinants of tourism demand and air travel demand. One might noted that tourism demand excludes, for example, the travel for business purpose.
Cherkaoui and Ben Ali (2007) noted that the Moroccan economic and migrations international are closely linked to Europe. In fact, the European market, with 8 mil. passengers origine/destination accounted a part of 83% of the international air traffic in Morocco (Office National Des Aéroports, 2015). However, of the 37 countries forming the ECAA (European Common Aviation Market), only 12 countries have scheduled air services with Morocco. Furthermore, of the 1.26 mil. supply seats in May 2014 on Morocco-Europe market, tourists and MLA origin countries concentrate 92% of seats supply (OAG, 2014). Besides, in 2013, tourists and MLA from Europe, accounted for 80% of all tourists arriving to Morocco by air (Ministère du tourisme, 2014). Moreover, Dwyer et al. (2014), based on data from Australia, have shown that f lows of tourism and migration are closely linked. Indeed, migration may induce tourism with purpose to visit friends and relatives. Thus, given the importance of air travel between Morocco and the European Union, the study is about to focus only on air travel demand between European Union and Morocco. Hence, what would be the main factors that influence the choice of the passengers for the Moroccan destination?
A review of literature on modeling tourism and air travel demand in Morocco reveals, to our knowledge, a lack of appropriate modeling of air travel demand undertaken by Moroccan institutions of air traff ic management and tourism industry. Thus, the main aim of this paper is to set up a model to explain the inbound international air travel demand to Morocco.
In reviewing the findings of past empirical studies that have been published in the field of tourism flows and air travel demand
106
Erraitab E. et al. A Cointegration Analysis of Air Travel Demand: The Case of International Air Travel Demand between Morocco and European Union
model ing , one d ist ing uishes severa l modeling approaches. The quantitative methods are widely used, we can divide them into two classes, the class of causal models and the class of time series models. For qualitative methods, Delphi method and scenarios method are widely used to generate qualitative forecasting tourism demand. Witt and Witt (1995) present a review of literature on tourism demand forecasting. Of the 40 described and reviewed papers, no one of them has proposed the co-integration and error correction model (ECM). The method we will use in this work is developed into the framework of co-integration and error correction models approach. This method has been used extensively in several recent works that aim at identifying the determinant factors of air travel demand, both in the short and long-run, we mention, among others, (Chi, 2014; Baker et al., 2015; Van De Vijver et al., 2014).
The structure of this paper is as follows: The second section considers the analysis methodology of co-integration and ECM. The third section treats the factors that impact the international air travel demand and data sources. The fourth section is devoted to the identification of the model, the unit root and co-integration tests on the series used in this study. The estimation results are reported in the penultimate section. The final section offers concluding comments.
2. Methodology: Co-Integration Analysis and ECM
Consulting the literature review allowed us to identify several approaches to modeling air travel demand. In fact, prior to 1990s, traditional regression approaches were used extensively in the literature for modeling
tourism demand and as a tool for identifying potentially explanatory factors of air travel demand. In the mid 90s’, the situation has changed, several studies have started to use more sophisticated modern techniques, such as vector autoregressive modeling (VAR), co-integration and error correction approach (Baker et al., 2015; Chi, 2014; Kulendran and Wilson, 2000; Halicioglu, 2004). Nevertheless, the quality of empirical results based on the traditional models is questionable for two reasons. On one hand, they do not take into account recent developments in econometric methodologies that focus on the specification of the dynamic structure of time series (the co-integration approach). On the other hand, there is a lack of appropriate tests to see if traditional regression models are well specified (the traditional regression models impose the assumption of stationarity of the series).
The traditional model based on regression assumes, implicitly, that economic series are stationary (at least around a deterministic trend), but it has proven that economic series are usually non-stationary and are rather assimilated as a particular realization of non stationary stochastic processes. Such processes, by construction, do not converge to the long-run trend (Nelson and Plosser, 1982). Therefore, neglecting the non-stationarity of economic series, may lead to the phenomenon of spurious regression (Granger and Newbold, 1974), in this sense, Philips (1986) points out:
“It is very common to see reported in applied econometric literature time series regression equations with an apparently high degree of fit, as measured by the coefficient of multiple correlation R 2 or the corrected coefficient R 2, but with an extremely low value for the Durbin-Watson statistic. We find it very curious that

107
International Journal for Traffic and Transport Engineering, 2016, 6(1): 104 - 120
whereas virtually every textbook on econometric methodology contains explicit warnings of the dangers of autocorrelated errors, this phenomenon crops up so frequently in well-respected applied work”. (Granger and Newbold, 1974).
Thus, the modeling literature review on the air travel and tourism demand, based on traditional regression modeling, is likely to fall within the spurious regression phenomenon. From all of this, we can realistical ly conclude that the quality of the empirical results generated on the basis of traditional modeling regression are questionable. In that sense, Witt and Witt (1995) highlighted as a major concern in their study what follows:
“In particular, the considerable advances in econometric methodology during the recent years have largely been ignored”. (Witt and Witt, 1995).
Unlike standard regression modeling, co-integration and error correction model ensures to take into account the non-stationarity of the series. Kulendran and Witt (2001) have shown empirically that the forecasts produced by using the recent methodologica l developments in the fields of co-integration and ECM and the diagnostic checking are more accurate than those produced by least squares models. Indeed, the estimates generated from the least squares regression is more appropriate for stationary series. However, as we shall see later, the series of air travel demand and other explanatory variables, such as income and the exchange rate are not stationary. Granger and Newbold (1974) examined the spurious regression phenomenon that can occur in regression of non stationary series. As a result of ignorance the existence of non-stationarity phenomenon, the usual
parameter significance tests, especially t-Student and F-Fisher tests are no longer valid. However, it is only recently that the air travel demand modeling, based on time series, have begun to address the problem of spurious regression linked to non-stationary series, the work undertaken along those lines, for example, are: Chi (2014); Baker et al. (2015); Van De Vijver et al. (2014).
Engle and Granger (1987) define the co-integration as follows: If each element of a time series vector xt is stationary after a differencing operation; but there is a stationary linear combination of the series. In this case, the time series are said to be cointegrated. In general, Dickey and Fuller (1979) unit root tests are usually used to identify the integration order of each series.
Nowadays, it is well known that most economic time series are non-stationary (Nelson and Plosser, 1982). To address this problem, two ways are proposed: (Box and Jenkins, 1976) methodology which consists of differentiating the series to induce stationarity and the co-integration and error correction model approach which maintains the original series in level. The series stationarity is always implicit in the analysis.
The concept of co-integration was introduced in 1974 by Granger and Newbold (1974) when dealing with the issue of spurious regression in econometrics. This concept was then formalized by Engle and Granger (1987) and then by Johansen (1988). Already in 1987, Engle and Granger have formalized the concept of co-integration. “If each element of a vector of time series xt first achieves stationarity after differencing, but a linear combination α’xt is already stationary, the time series xt are said to be co-integrated with co-integrating vector α”. (Engle

108
Erraitab E. et al. A Cointegration Analysis of Air Travel Demand: The Case of International Air Travel Demand between Morocco and European Union
and Granger, 1987). In other words, if is a vector composed of n elements (variables)
, i f each element of vector is non-stationary in level, but becomes stationary after a differentiation and there is a stationary linear combination of these variables, there is a vector with n elements , such that the linear combination is stationary. The vector is called the co-integrating vector. If is a vector composed of n variables, one can have (n-1) co-integrating vectors. In order to determine the number of co-integrating vectors, the Johansen (1988) algorithm will be applied.
3. Data Source
The data used in this study are annual and refer to the period 1970-2012. The number of enplaned-deplaned air passengers to international destinations is used as a measure of demand for international air travel. This series measures the dependant variable. The data on enplaned-deplaned air passengers are published by the Office National Des Aéroports, which is under the auspices of the Moroccan Ministry of equipment, transport and logistics. The data on enplaned passengers are disaggregated by country and by geographic area. As we have already pointed out, in this study, we will concentrate on passengers between Europe and Morocco. As a matter of fact, the bilateral passenger f low between Morocco and Europe represents 80.3% of total international enplaned-deplaned passenger in Morocco in 2012. The first seven of the top 10 international markets in 2012 are European countries, France (5.10 mil.), Spain (1.20 mil.), Belgium (1.14 mil.), Italy (1 mil.), UK (0.77 mil.), Germany (0.58 mil.) and Holland (0.47 mil.). The market
share of the top 7 European countries is 71.23% in 2012. Real Gross domestic product (GDP in constant local currency) is used as a proxy variable to measure the created wealth in a country or region. The data on real GDP in the euro area region are collected from the database (World Development Indicators) of the World Bank (The World Bank IBRD-IDA, 2014). As well, in this study, we will use the real exchange rate as a proxy variable to measure the cost of travel and tourism between Morocco and the euro area region. Martin and Witt (1987) have indicated that the price is considered as a major determinant of tourism demand. In fact, tourism has two price components: The travel costs to the target destination and the cost of living in the desired destination. At previous studies, where econometric forecasting models have been developed for international tourism demand, the consumer price index (CPI) in the destination country is used as a proxy for the tourism cost in this country. However, the CPI measures the cost of living based on a basket of the local population consumer goods, whereas, tourists are not generally interested in the goods and services that make up the CPI in the host country. Considering the limitations of the CPI as a proxy of the cost living of tourists in the destination country, in this work the real exchange rate was used instead of the CPI. The data to calculate the real exchange rate between Morocco and the euro area region are also obtained from the WDI database (The World Bank IBRD-IDA, 2014). In the end, the dummy variable that represents the effect of the signature of the open sky agreement between Morocco and the EU in 2006 has been added; it is set to 1 after the date of signature of the Agreement and the value 0 elsewhere.

109
International Journal for Traffic and Transport Engineering, 2016, 6(1): 104 - 120
4. The Model
The models that we will present in this paper are based on earlier works concerning air travel demand. For example, Chi (2014) found that GDP, the bilateral exchange rate and the 9/11 attacks are the main variables explaining the bilateral air travel between the US and its main partners. He used the co-integration approach for assessing short and long-run impacts between the demand for air travel, GDP, the exchange rate and a dummy variable that represents the effect of the 9/11 attacks. He showed empirically that the air travel demand is very sensitive to short and long-run economic growth, but this demand is less sensitive to exchange rate f luctuations in short-run.
A n analysis of various models, whose objective is to study and evaluate the impact of social and economic factors on the air travel demand (Chi, 2014; Abed et al., 2001; AL-Rukaibi and Al-Mutairi, 2013; Button, 2009), and with the regard to the Moroccan reality3, showed that the air travel demand in Morocco seems to depend on variables ref lecting the wealth level of passengers (Schafer and David, 2000) and travel cost, for 3 The first reality is that the most air passengers in Morocco are foreign tourists, a 95% share of total passengers (ONMT, 2012), from which a substantial proportion represents the MLA. This is due to the fact that MLA are residents abroad, and when they come to spend their holidays in Morocco, they are considered as tourists. But one can distinguish foreign tourists arrivals from MLA ones. However, the Moroccan government data aggregated the two components. As a matter of fact, researchers must take into account this reality and have to disaggregate the data in future works. The second reality, that we must take into account when constructing the air travel demand function, is the open sky agreement signed between Morocco and EU.
which we are trying to capture its effect using exchange rate variable. Thus, to catch the effect of air service liberalization agreement signed between Morocco and EU, we will introduce a dummy variable in the model.
Previous studies have expressed a keen i nterest i n t he soc ia l a nd econom ic determinants of air travel demand, which contribute to the understanding of the air travel demand function. However, every country, every road, even each road segment has its own factors. For example, the segment of air travel for leisure purpose is very sensitive to price factor. By contrast, the air travel for business purpose is less sensitive to price but more sensitive to time and travel frequency. In 2006, Morocco has signed an open sky agreement with the European Union. This agreement has reconfigured the air transport market in Morocco. As a consequence, the number of enplaned/deplaned air passengers between Europe and Morocco had significantly increased, from 6.8 mil. in 2005 to 11.06 mil. in 2012, leading to an average annual growth rate of 9.3%. According to Alderighi et al. (2012), unlike other sectors, the airline industry factors of change are not limited to socio-economic and technological factors, but depend mainly on legal, institutional and cultural changes. To this end, a dummy variable is introduced in the model to take count of the legal changes following the signing of the Open Sky Agreement between Morocco and the EU. Thus, this work aims to show the uniqueness of the air travel function in Morocco.
The air transport demand function for Moroccan case can be written as follows:

110
Erraitab E. et al. A Cointegration Analysis of Air Travel Demand: The Case of International Air Travel Demand between Morocco and European Union
(1)
Where Traffict is the number of enplaned air passengers from Europe to Morocco; GDPeut is the European GDP per capita; the Exchange _ Rate eu / mar t is the bilateral exchange rate of the European currency (Euro) against the Moroccan currency (Dirham); and Dummyt is a dummy variable that captures the effect of the Open Sky Agreement signed between Morocco and the European Union in 2006. It is set to 0
before 2007 and 1 elsewhere. To calculate the real exchange rate, the nominal exchange rate between Morocco and Europe ( ) was multiplied by the ratio of European and Moroccan consumer price indexes (CPI).
.
The introduction of the logarithm function to Eq. (1) gives:
(2)
Where LAR eu / mar ,t represents the number of enplaned air passengers from Europe to Morocco; LY eu ,t is the European real income per capita; LER eu / mar ,t is the real exchange rate between European currency against Morocco one, calculated with above formula and Dummyt is a dummy of 2006 open sky agreement. The estimation period covers the period 1970-2012. All variables are expressed in logarithms to capture the multiplicative effects of time series and facilitate the interpretation of coefficients. The wording of each variable in log is preceded by the letter L.
Eq. (2) is in log-linear form. To estimate this function, first we have to check the stationary of the variables that compose the equation, and then test the existence of a co-integration relationship. According to Engle and Granger (1987), “if each element of a vector
first achieves stationarity after differencing, but
a linear combination is already stationary, the time series are said to be co-integrated with co-integrating vector ” (Engle and Granger, 1987). To test the order of integration of each variable, we will use the Dickey and Fuller (1979) tests on series in level and on their first differences . The first test will assess the non-stationarity of the series, while the second will provide the degree of integration of each series.
4.1. The Unit Root Test
The co-integration test must be preceded by a unit root test for each series. Engle and Granger (1987) highlighted that a linear combination of two or more non-stationary variables can be stationary. If such stationary linear combination exists, it is said that variables are co-integrated. Thus, the unit root test on each series is a precondition of co-integration test. To test the presence of

111
International Journal for Traffic and Transport Engineering, 2016, 6(1): 104 - 120
a unit root in each variable we will use the test of Dickey and Fuller (1979). This test is based on the following auxiliary regression:
(3)
The ADF tests of unit root are based on auxiliary regression of Eq. (3), where ty is the variable in level at the moment t . 1−∆ ty is the first difference of lagged variable, δβα ,, and γ are parameters to be estimated, and
tu are assumed to be white noise. Null and alternative hypotheses for an ADF unit root test are: 0:0 =βH , 0:1 <βH . The tests are performed in a sequential procedure. First, we test the general model that contains a deterministic element α and a linear trend
tδ . The Eq. (3) is estimated with OLS in order to obtain the value of the coefficient β and the associated t-statistic. It should be
noted that the t-statistic of the coefficient β follows the DF non standard distribution. A sufficient number k of lagged ty∆ is used to eliminate the serial correlation of the error term. The strategy of the ADF test described by Ertur (1991) was used. We begin the ADF test by testing the non-stationarity against the alternative hypothesis of stationarity. In case we cannot reject the null hypothesis, the series is said to be non stationary in level. Then, the same test is performed on the series in first differences. If the null hypothesis is rejected, the series in first difference is stationary and therefore the series in level is I(1).
Table 1 Results of Unit Root Test ADF on the Series in Level and in First Differences
Variable Test ADF Retards Critical Values 5% Conclusion
LAR 3,74 1 -1,4 I(1)
ΔLAR -5,07 1 -1,94 I(0)
LY 6,84 1 -1,94 I(1)
ΔLY -2,92 1 -1,94 I(0)
LER 1,46 1 -1,94 I(1)
ΔLER -4,31 1 -1,94 I(0)
Source: Author’s calculations on basis of the ONDA database
As can be seen from the Table 1, the application of ADF test to 3 series in the analysis reveals that they are all integrated to order 1. Thus, the precondition of co-integration is verified, all variables are integrated in the same order; the next step is to test the co-integration between these variables.
4.2. Co-Integration and Johansen Test
According to Engle and Granger (1987), the vector of time series tX is said cointegrated if all variables constituting the vector tX are
integrated with the same order d and if there is a stationary linear combination of these variables with a lower order b, such as db <. Because all series representing relevant variables are integrated of order 1, they are all I(1) and their first differences are I(0). So long as we have more than two variables, there may be more than one co-integrating relationship. In other words, there may be more than one co-integrating vector. The number of lags to consider in the VAR model (noted here k ), is the one that minimizes the information criteria.
112
Erraitab E. et al. A Cointegration Analysis of Air Travel Demand: The Case of International Air Travel Demand between Morocco and European Union
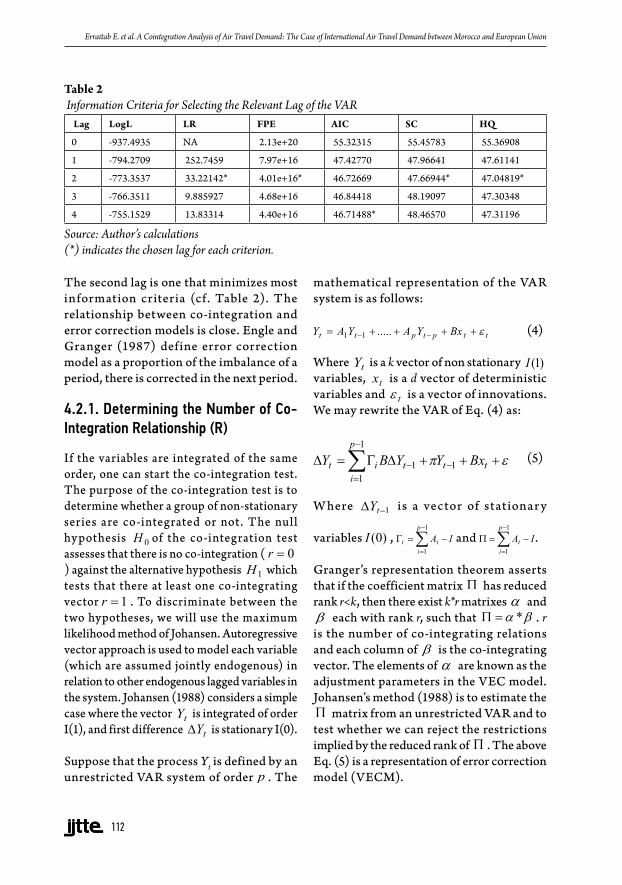
Table 2 Information Criteria for Selecting the Relevant Lag of the VAR
Lag LogL LR FPE AIC SC HQ
0 -937.4935 NA 2.13e+20 55.32315 55.45783 55.36908
1 -794.2709 252.7459 7.97e+16 47.42770 47.96641 47.61141
2 -773.3537 33.22142* 4.01e+16* 46.72669 47.66944* 47.04819*
3 -766.3511 9.885927 4.68e+16 46.84418 48.19097 47.30348
4 -755.1529 13.83314 4.40e+16 46.71488* 48.46570 47.31196
Source: Author’s calculations (*) indicates the chosen lag for each criterion.
The second lag is one that minimizes most information criteria (cf. Table 2). The relationship between co-integration and error correction models is close. Engle and Granger (1987) define error correction model as a proportion of the imbalance of a period, there is corrected in the next period.
4.2.1. Determining the Number of Co-Integration Relationship (R)
If the variables are integrated of the same order, one can start the co-integration test. The purpose of the co-integration test is to determine whether a group of non-stationary series are co-integrated or not. The null hypothesis 0H of the co-integration test assesses that there is no co-integration ( 0=r) against the alternative hypothesis 1H which tests that there at least one co-integrating vector 1=r . To discriminate between the two hypotheses, we will use the maximum likelihood method of Johansen. Autoregressive vector approach is used to model each variable (which are assumed jointly endogenous) in relation to other endogenous lagged variables in the system. Johansen (1988) considers a simple case where the vector tY is integrated of order I(1), and first difference tY∆ is stationary I(0).
Suppose that the process Yt is defined by an unrestricted VAR system of order p . The
mathematical representation of the VAR system is as follows:
(4)
Where tY is a k vector of non stationary )1(I variables, tx is a d vector of deterministic variables and tε is a vector of innovations. We may rewrite the VAR of Eq. (4) as:
(5)
W here 1−∆ tY is a vector of stationar y
variables )0(I , and .
Granger’s representation theorem asserts that if the coefficient matrix Π has reduced rank r<k, then there exist k*r matrixes α and β each with rank r, such that βα *=Π . r
is the number of co-integrating relations and each column of β is the co-integrating vector. The elements of α are known as the adjustment parameters in the VEC model. Johansen’s method (1988) is to estimate the Π matrix from an unrestricted VAR and to test whether we can reject the restrictions implied by the reduced rank of Π . The above Eq. (5) is a representation of error correction model (VECM).

113
International Journal for Traffic and Transport Engineering, 2016, 6(1): 104 - 120
4.2.2. Empirical Results
Let ’s return to the prev ious Eq. (5), In our case, the said vector Y comprises the variables ( LAR ) the enplaned air passenger from Europe, ( ) the European GDP per capita, ( ) the real exchange rate (€/dhs) and the dummy variable.
Fig. 1.Enplaned Air Passenger from Europe Union to MoroccoSource: World Bank data base
Upon the implementation of the Johansen procedure, Fig. 1. indicates the need to include a linear deterministic trend in the co-integration regression. The order of r is determined by the use of statistical test likelihood ratio (LR) as proposed by
Johansen (1988). Te results of co-integration test are reported in Table 3.
(6)
Table 3 Results of Co-Integration Test
Hypothesized No. of CE(s) Eigenvalue Trace Statistic 0.05 Critical Value Prob.**
None * 0.521462 41.22928 29.79707 0.0016
At most 1 * 0.304297 15.43358 15.49471 0.0511
At most 2 0.075153 2.734445 3.841466 0.0982
Source: Author’s calculations Variables Aeu, GDPC_eu, EReu,ma , dummy. Maximum lag in VAR=2
114
Erraitab E. et al. A Cointegration Analysis of Air Travel Demand: The Case of International Air Travel Demand between Morocco and European Union
The Table 3 reports results for testing the number of co-integrating relations r. To determine r, there are two test statistics, the eigenvalue test statistic and Trace Statistic. In our case, the Trace statistic is used as basis for determine r. The test starts with testing the hypothesis that there is no co-integrating relations under the null hypothesis (r = 0), the p-value of the statistic is equal to 0.00164. Thus, one cannot accept the null hypothesis (r = 0), rather we accept the alternative hypothesis that (r >= 0). We proceed now to test the second hypothesis (r = 1). This time, the p-value of the second hypothesis (r = 1) is 0.0511, we accept then the null hypothesis that there is one co-integrating relation (r = 1). This means that the variables are cointegrated. In other words, the three variables maintain between themselves a linear equilibrium relationship in the long term (they have a long run associationship). For example, if the air travel demand, as measured by the arrival of passengers from the region of Euro area, and real income per capita in this area are not cointegrated, arrivals of passengers should drift above or below the long-term real income. Because the variables are cointegrated, we can estimate a restricted VAR model or a VEC model. Granger (1986) states that “A test for co-integration can thus be thought of as a pre-test to avoid “spurious regression” situations”.
5. Error Correction Model Estimation
The test of Trace statistic of Johansen (1988) reported in Table 3 revealed that there is one (r = 1) co-integrating relation. Thus,
4 It should be noted that the (nonstandard) critical values are taken from Osterwald-Lenum (1992), which differ slightly from those reported in Johansen and Juselius (1990).
to estimate Eq. (2), we can use the two step Engel and Granger procedure (Engle and Granger, 1987). The first step of the procedure consists in estimating Eq. (2). It is known that the Engle and Granger procedure requires that all variables should have the same order of integration, we remember that all variables are integrated of the same order, they are all I(1) (cf. Table 1). After estimating the Eq. (2), we test the presence of unit root test in the residual te . If the residual is not stationary, we can say that there is no co-integration. Thus, we can simply use OLS to estimate the Eq. (2) without fear of spurious regression.
If te is stationary, the error correction representation of the cointegrated relation proposed by Engle and Granger (1987) can now be estimated:
(7)
where te is the estimated residual from the Eq. (2). The coefficients of Eq. (7) 1α, 2α and 3α are respectively the short run elasticity of the endogenous variables. In addition, α is said to be the velocity for any shock leading to a deviation from long-run equilibrium.
Application of the two step Engel and Granger procedure (Engle and Granger, 1987):
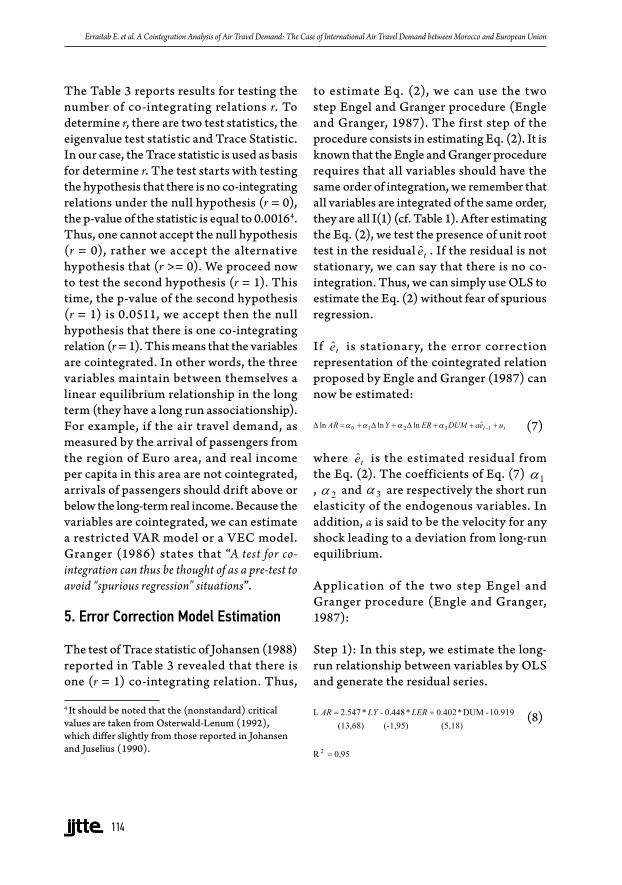
Step 1): In this step, we estimate the long-run relationship between variables by OLS and generate the residual series.
(8)

115
International Journal for Traffic and Transport Engineering, 2016, 6(1): 104 - 120
Table 4Results of Co-Integrating Regressions
Dependent variable (LAR)
Variable Coefficients t-statistic Prob
Constant -10.91926 -6.151152 0.0000
LY 2.547333 13.68385 0.0000
LER -0.448527 -1.955905 0.0577
DUM 0.402959 5.185002 0.0000
R-squared 0.957261
Adjusted R-squared 0.953974
Durbin-Watson stat 0.709128
Source: Author’s calculations
As indicated in the Table 4, the value of the Durbin-Watson statistic is 0.70, indicating that there is a strong positive autocorrelation of residuals, according to Engle and Granger (1987) and Engle and Yoo (1987), this statistic is an evidence of existence of a co-integration relation between the variables.
Based on Eq. (8), we generate the residualste , such as:
(9)
As noted previously, the residual series te must be stationary. We use the Dickey and Fuller (1979) to test the presence of unit root in te .
Fig. 2. ADF Unit Root Test on Residual Series Generated from Long Run Equation
As shown in the Fig. 2 above, the critical values for this test calculated by MacKinnon (1996) indicates that the p-value of ADF statistic is smaller than 5%, meaning that we cannot accept the null hypothesis that the residual series te has a unit root. That said, the residual series te is stationary, thus we can start the second step of Engel and Granger procedure.
Step 2): Estimation of short run dynamic relation.
This consists of estimating by OLS method the dynamic relation or short run relation. The error correction representation of the cointegrated relationship proposed by Engle and Granger (1987) can be written as:

116
Erraitab E. et al. A Cointegration Analysis of Air Travel Demand: The Case of International Air Travel Demand between Morocco and European Union
(10)
The coefficient α must be negative and significant. This coefficient measures the speed of adjustment of endogenous variables towards the equilibrium.
The relat ionship bet ween stat ionar y variables, as described in the error correction representation of the cointegrated relation, allows for inference regarding the long and short run relationship between the variables.
A s i nd icated i n Table 4, Eu ropea n income per capita (LY), real exchange rate between EU and Morocco present coefficient significantly different from zero at 5% level. Moreover, the coefficients signs are in alignment with the economic theory.
The result of est imation of the error correction model is presented in Table 5. We note that the signs of the coefficients are in agreement with the theory.
Table 5Error Correction Model
Dependent variable D(LAR)Variable Coefficients t-statistic ProbConstant 0.031006 1.208220 0.2346D(LY) 1.888737 2.015511 0.0512D(LER) -0.804432 -2.213674 0.0331DUM 0.032241 0.716961 0.4779RESEQ1(-1) -0.354447 -3.350497 0.0019R-squared 0.353243Adjusted R-squared 0.283324Durbin-Watson stat 1.751759
Source: Author’s calculations
Unlike the regression of the long-run relation (Eq. (8)), the Durbin-Watson statistic becomes close to 2. Its value is 1.75, indicating that there is no serial correlation between variables when estimating the VEC model.
5.1. The Result of Long-Run Analysis
The results of long-run relationship between the Moroccan inbound air travel demand from European Union and the explanatory variables show that all coefficients are significant at 5% significance level (Table 4), except the real exchange variable, which is significant at 10% significance level. The
coefficient of GDP per capita of European Union has a positive impact on the number of air passenger from EU to Morocco. This would suggest that the economic growth in EU is an important factor in the increasing demand for inbound air travel from EU to Morocco in the long-run. In addition, GDP per capita coefficient value is close to those reported in other studies, such as Chi (2014) who found that the GDP per capita elasticity value, for air travel demand from Germany to the US is 1.78.
The real bilateral exchange rate is negatively associated with the number of air passengers to Morocco from EU, since its coefficient

117
International Journal for Traffic and Transport Engineering, 2016, 6(1): 104 - 120
has the expected sign. This indicates that an appreciation of the Moroccan currency (MAD) against European currency (EURO) leads to increased costs of travel and tourism in Morocco, reducing demand for inbound air travel from EU to Morocco. Given that Morocco aims to attract mass tourism, which generally targets a range of middle income tourists, who are very sensitive to price changes, Moroccan tourism policy shall consider the factor of the exchange rate of the local currency. Nevertheless, at the long-run relationship, the impact of variable real exchange rate remains relatively low.
The factor relating to regulatory policy, represented by the change in the regulatory environment between Morocco and the EU, following the signing of the open skies agreement in 2006 between EU and Morocco, has a positive and significant long-run impact on demand for air travel from EU to Morocco. Among the major findings of this paper, we can cite that it empirically evaluates the impact of the open sky agreement signed in 2006 on the air travel demand. Furthermore, the regulatory environment plays a crucial role in the long-run. In fact, its development affects the operating environment for air carriers and tracks the extent of competition between domestic and foreign air carriers. The liberalization of air services, such as the agreement between Morocco and the EU, is a tool for regulating the air transport market in a given country or region. Our results are consistent with those found by other studies (Oum et al., 2010).
5.2. The Result of Short-Run Analysis
The estimated error correction model, derived from Eq. (7) allows us to estimate the
short-run impact of the relevant variables. The results show that European GDP per capita is significant and positively associated w ith a ir t ravel f rom EU to Morocco. Nevertheless, in short-run, its impact is mitigated; in long-run relationship, the coefficient of GDP per capita was 2.54, in short-run, this coefficient does not go much beyond 1.88. This result indicates that GDP per capita is a main factor of air travel demand from EU to Morocco. This is consistent with the finding of Schafer and David (2000), which assesses that people’s mobility increases with their level of wealth at all times.
The most remarkable result is the short-run impact of bilateral real exchange rate. Regarding its effect, its impact has almost doubled in the short-run. It was |0,44| in the long-run, but it increased to |0,80| in the short-run. Also in terms of significance level, this variable become significant at 5% significance level in the short-run while it was significant à 10% significance level in long-run relationship. In the same lines, Halicioglu (2004) used an ARDL model to examine aggregate tourism demand function for Turkey, he found that total tourist arrivals into Turkey are related to world income, transportation cost and relative prices (i.e. the bilateral exchange).
For the change of regulatory framework, represented by the dummy var iable, the coefficient is no longer statistically significant. This suggests that the change of regulatory framework has not short-run impact on air travel demand from EU to Morocco. This result seems quite normal: the regulatory factor affects the air carriers competition environment, and such changes are felt in the long-run.

118
Erraitab E. et al. A Cointegration Analysis of Air Travel Demand: The Case of International Air Travel Demand between Morocco and European Union
6. Conclusion
The main contribution of estimating the error correction model is to advance the understanding of air travel demand function. In fact, the error correction model allows to study and assess the dynamic determinants of air travel demand from EU to Morocco. Besides, co-integration approach allows estimating and assessing the long-run equilibrium relationships as proposed by economic theory. In this paper, the co-integration approach is used to assess the short and long-run dynamics between the air passengers from EU to Morocco, the European GDP per capita, the bilateral exchange rate and the change of regulatory framework.
The empirical results show that the impact of explanatory variables on air travel demand differs by time horizon, as the short-run impact of a given variable differs from its long-run impact. For example, air travel demand is very sensitive to economic growth in short and long-run. However, the number of enplaned passengers from EU to Morocco is sensitive to bilateral exchange rate in short-run and less sensitive in long-run. For the change of regulatory framework, it has an impact on air travel demand in long-run but not in short-run.
The methods and empirical results presented in this paper can be used to guide the air transport sector planning policies in short and long-run for air transport regulatory authorities in Morocco. Empirical results showed that the level of passenger wealth is a key for air mobility. For this purpose, to predict the number of air passengers enplaned from a given country, it can be based on forecast of its economic growth.
For example, during the construction of new airports or the expansion of existing ones, economic growth forecasts of passenger source markets should be considered. For the real bilateral exchange impact, we found that depreciation in Moroccan currency against European currency increases the air travel demand, both in short and long-run. The Moroccan tourism policy aims attracting mass tourism. Thus, the depreciation of the local currency makes less expensive the Moroccan destination. This implies to increase air travel from EU to Morocco.
References
Abed, S.Y.; Ba-Fail, A.O.; Jasimuddin, S.M. 2001. An econometric analysis of international air travel demand in Saudi Arabia, Journal of Air Transport Management, 7(3): 143-148.
Alderighi, M.; Cento, A.; Nijkamp, P.; Rietveld, P. 2012. Competition in the European aviation market: the entry of low-cost airlines, Journal of Transport Geography, 24(2012): 223-233.
AL-Rukaibi, F.; Al-Mutairi, N. 2013. Forecasting Air Travel Demand of Kuwait: A Comparison Study by Using Regression vs.Artificial Intelligence, Journal of Engineering Research, 1(1): 113-143.
Baker, D.; Merkert, R.; Kamruzzaman, M. 2015. Regional aviation and economic growth: cointegration and causality analysis in Australia, Journal of Transport Geography, 43(2015): 140-150.
Box, E.; Jenkins, G. 1976. Time Series Analysis: Forecasting and Control. Holden-Day. 575 p.
Button, K. 2009. The impact of US–EU “Open Skies” agreement on airline market structures and airline networks, Journal of Air Transport Management, 15(2): 59-71.

119
International Journal for Traffic and Transport Engineering, 2016, 6(1): 104 - 120
Cherkaoui, M.; Ben Ali, D. 2007. The Political Economy of Growth in Morocco, The Quarterly Review of Economics and Finance, 46(5): 741-761.
Chi, J. 2014. A cointegration analysis of bilateral air travel flows: The case of international travel to and from the United States, Journal of Air Transport Management, 39(2014): 41-47.
Dickey, D.A.; Fuller, W.A. 1979. Distribution of the Estimators for Autoregressive Time Series with a Unit Root, Journal of the American Statistical Association, 74(366): 427-431.
Dwyer, L.; Seetaram, N.; Forsyth, P.; King, B. 2014. Is the migration-tourism relationship only about VFR?, Annals of Tourism Research, 46(2014): 130-143.
Engle, F.R.; Granger, C.W. 1987. Co-integration and error correction: Representation, Estimation, and Testing, Econometrica, 55(2): 251-276.
Engle, R.F.; Yoo, B.S. 1987. Forecasting and testing in co-integrated systems, Journal of Econometrics, 35(1987): 143-159.
Ertur, K. 1991. Une stratégie de test de la racine unitaire. Document de travail IME n° 9104. Université de Bourgogne.
Ginieis, M.; Sánchez-Rebull, M.-V.; Campa-Planas, F. 2012. The academic journal l iterature on air transport: Analysis using systematic literature review methodology, Journal of Air Transport Management, 19(2012): 31-35.
Granger, C.W. 1986. Developments in the study of cointegrated economic variables, Oxford Bulletin of Economic and Statistics, 48(3): 213-228.
Granger, C.; Newbold, P. 1974. Spurious Regressions in Econometrics, Journal of Econometrics, 2(1974): 111-120.
Halicioglu, F. 2004. An ARDL Model of Aggregate Tourism Demand for Turkey, Global Business and Economics Review-Anthology, 614-624.
Haut Commissariat au Plan. 2012. Note d’information relative aux résultats des comptes du tourisme . Available from Internet: <http://w w w.hcp.ma/attachment/457540/>.
Johansen, S. 1988. Statistical analysis of cointegration vectors, Journal of Economic Dynamics and Control, 12(2-3): 231-254.
Jorge-Calderón, J.D. 1997. A demand model for scheduled airline services on international European routes, Journal of Air Transport Management, 3(1): 23-35.
Kulendran, N.; Wilson, K. 2000. Is there a relationship between international trade and international travel?, Applied Economics, 32(8): 1001-1009.
Kulendran, N.; Witt, S.F. 2001. Cointegration versus least squares regression, Annals of Tourism Research, 28(2): 291-311.
MacKinnon, M.G. 1996. Consulté le 02 04, 2016. Available from Internet: <http://citeseerx.ist.psu.edu/viewdoc/download?doi=10.1.1.456.4786&rep=rep1&type=pdf>.
Martin, C.A.; Witt, S.F. 1987. Tourism demand forecasting models: Choice of appropriate variable to represent tourists’ cost of living, Tourism Management, 8(3): 233-246.
Ministère de l’Equipement, du Transport et de la Logistique. 2010. Schéma directeur des aéroports au Maroc. Rabat.
Ministère du tourisme. 2014, 08. Consulté le 08 26, 2014. Available from Internet: <http://www.tourisme.gov.ma/fr/search/node/ONMT>.

120
Erraitab E. et al. A Cointegration Analysis of Air Travel Demand: The Case of International Air Travel Demand between Morocco and European Union
Nelson, C.R.; Plosser, C.I. 1982. Trends and random walks in macroeconmic time series, Journal of Monetary Economics, 10(1982): 139-162.
OAG. 2014. Offre de siège dans le monde.
Office des Changes. 2012. Balance des paiements.
Office National Des Aéroports. 2015. Communiqué de presse. Casablanca.
Oum, T.H.; Fu, X.; Zhang, A. 2010. Air Transport Liberalisation and Its Impacts on Airline Competition and Air Passenger Traffic, Transportation Journal, 49(4): 24-41.
Philips, P.B. 1986. Understanding Spurious Regressions in Econometrics, Journal of Econometrics, 33(3): 40-311.
Schafer, A.; David, G.V. 2000. The future mobility of the world population, Transportation Research Part A, 34(2000): 171-205.
The World Bank IBRD-IDA. 2014. Consulté le 08 21, 2014. Available from Internet: <http://data.worldbank.org/data-catalog/world-development-indicators>.
Van De Vijver, E.; Derudder, B.; Witlox, F. 2014. Exploring causality in trade and air passenger travel relationships: the case of Asia-Pacific, 1980-2010, Journal of Transport Geography, 34(2014): 142-150.
Witt, S.F.; Witt, C.A. 1995. Forecasting tourism demand: A review of empirical research, International Journal of Forecasting, 11(3): 447-475.
WTTC. 2014. Travel and Tourism: Economic impact 2014, Morocco. London.