a comparative analysis of heating values of saw dust, …
TRANSCRIPT

A COMPARATIVE ANALYSIS OF HEATING VALUES OF SAW DUST, RICE HUSK
AND COCONUT SHELL IN THE THERMAL GENERATION OF
ELECTRICITY IN HADEMA LOCAL GOVERNMENT, NIGERIA
A Dissertation
Presented to the college Of
Higher Degree and Research
Kampala International University
Kampala, Uganda
In Partial Fulfillment of the Requirements for the Degree of Masters in
Science (physics)
BY
MUHAMMAD DANLADI
MSCP/38610/123/DF
NOVEMBER, 2014

DECLARATION A
“This research dissertation is my original work and has not been
presented for a degree or any other academic award in any university or
institution of learning.”
Name and signature of Candidate
MSCP/38610/123/DF
A (it
Date

APPROVAL
“I confirm that the work reported in this dissertation was carded
out by the candidate under my supervision”.
Name and Signature of Supervisor
Dr. Winston T. Ireeta
Date
Name and signature of supervisor
Dr. Ti]jani Saleh Bichi
Date

DEDICATION
I sincerely dedicate this work to my beloved parents, Late Aihaji Umaru
Mai-inji and Late Hajiya Hafsah Umar(yata) for the care, concern and
courage they rendered to me and also to my venerate brothers and
sisters.
III

ACKNOWLEDGEMENTS
It is not possible to mention all those who have made this dissertation tobe a reality. However I will like to elucidate few individuals .It is mypleasure and gratification to express my absolute appreciation to myhumble supervisor Dr W. T Ireeta who spares his time at all cost to putme aright, he rendered tireless support, advice, encouragement andguidance from the word go to the end of the write up. Sir, your vastexperience helped me a lot in achieving this noble work.
In the same vein , I would like to express my gratitude to my lecturersProf; E . 3. K. B BANDA and Dr. W. T. Ireeta who taught me throughoutmy period of studies at K.LU.
I would also like to express my profound gratitude to Dr Tijjani Saleh Bichiof Kano University of Science and Technology Wudil who served as myimmediate supervisor. Without his effort and wide experience in the fieldthis work wouldn’t have been realized. I greatly acknowledged Mal Rabi’uZakari’s effort, a technician with Kano University of Science andTechnology Wudil who helped me in carrying out the experiment. Specialthanks goes to M. M. Mustafa and K. R. Kent for the encouragement andadvice they gave me.
I am truly grateful to my course mates Living S. and Muhammad M. withwhom we had a great time and a very good association during our coursework. Special thanks to the leadership and management of BinyaminuUsman College of Agriculture Hadejia, for the support rendered to meduring my course of studies.
I am greatly in indebted to my brothers and sisters as well as friends forthe support and encouragement.
Finally, to my beloved wife Khadijah Haruna Adam who has been caringday and night for our children. I thank you so much for the courage andunderstanding.
iv

TABLE OF CONTENTS
DECLARATION A
APPROVAL
DEDICATION Hi
ACKNOWLEDGEMENTS iv
TABLE OF CONTENTS v
LIST OF FIGURES ix
ABSTRACT x
CHAPTERONE 1
INTRODUCTION 1
1.0 Background of the study 1
1.1 Statement of the Problem 9
1.2 General Objective’ 10
1.2.1 Specific Objective’ 10
1.3 Significance of the Study 10
1.4 Scope of the Study 11
CHAPTER TWO 12
LITERATURE REVIEW 12
2.0 The Electricity 12
V

2.1 Basic Concepts Of Electricity .13
2.2 Sources of Electricity 14
2.2.1 Fossil fuels 15
2.2.2 Oil and natural gas 15
2.2.3 Coal 15
2.2.4 Geothermal 16
2.2.5 Hydro-electric 16
2.2.6 Solar 16
2.2.7 Wind 16
2.2.8 Biomass 17
2.2,9Tidal 17
2.3 Methods of Generating Electricity from Biomass 17
2.3.1 Combustion 18
2.3.2 Pyrolysis 18
2.3.3 Anaerobic Digestion 19
2.3.4 Gasification 19
2.3.6 Modular Systems 20
2.3.7 Landfill Gas 20
2.4 Renewable Electricity Generation by Energy Source 21
2.5 Generation of electricity from biomass in Africa 22
2.6 Available sources of biomass energy generation in Nigeria 25
vi

CHAPTER THREE .29
METHODOLOGY 29
CHAPTER FOUR 34
RESULTS AND DISCUSSION 34
CHAPTER FIVE’ 46
CONCLUSION AND RECOMMENDATION 46
5.1 Conclusion 46
5.2 Recommendation 47
REFERENCES 48
VII

LIST OF FIGURES
Fig. 1. Basic stages in a complete integrated biomass to electricity
system S
FIGURE. 2.4.1: Illustrated renewable electricity projection by energy
source in a bar diagram by percentage (Department of energy,
Energy information Administration, Energy Outlook) 21
FIGURE: 3.1 Experimental set up in block form for the thermal
generation of electricity 29
FIGURE: 3.2. Experimental set up for the thermal generation of
electricity 30
Figure: 3.3 Milled and briquetted Rice husk Sample 31
Figure:3.4 Milled and briquetted saw dust Sample 32
Figure: 3.4 Milled and briquetted coconut shell Sample 32
FIGURE.4.4: Graph of E.M.F Against Mass of Saw Dust 37
FIGURE.4.5: Graph of E.M.F Against Mass of Rice Husks 37
GRAPH OF E.M.F VERSUS MASS OF COCONUT SHELL 38
FIGURE,4.6: Graph of E.M.F against Mass of Coconut Shell 38
FIGURE.4.1O: Bar Graph Comparing E.M.F With bOg of Different
Biomass 41
VIII

LIST OF TABLE
TABLE. 4.1: Table of values of Saw Dust 35
TABLE.4.2: Table of value for Rice Husks 35
TABLE 4.3: Table of values for Coconut Shell 36
ix

ABSTRACT
Biomass is the major energy source in Nigeria contributing about 78% of
Nigeria primary energy supply. In this work a comparative analysis of the
heating values of saw dust, rice husks, and coconut shell in the thermal
generation of electricity was carried out. In the study different masses of
biomass were used and the corresponding electromotive force in millivolts
obtained. A graph of e.m.f was plotted against mass of each biomass and
a gradient was obtained. Bar graphs were plotted representing the
values of e.m.f and masses of the biomass. Also a bar graph comparing
e.m.f of different masses of biomass was used. The research shows that
Saw dust is having a gradient of O.O33Mv/g then followed by Coconut
shell with gradient O,O3lMv/g and Rice husk with gradient O.O26mV/g.
This shows that Saw dust is the one with the highest gradient. It is
therefore, concluded that Saw dust is the most efficient of the three types
of biomass in the thermal generation of electricity.
x

CHAPTER ONE
INTRODUCTION
1.0 Background of the study
The world is changing drastically in scientific and technological
perspectives coupled with increase in population, hence there is a need to
have a diverse means of tapping electricity for the usage of the populace.
Energy demand is increasing by about 2% a year, and absorbs most of
the requirement for the energy development, (Vecan, 2011). New
technology makes better use of already available energy through
improved efficiency. This dissertation will compare the heating values of
different types of biomass in the thermal generation of electricity.
The world’s energy markets rely heavily on fossil fuels such as coal,
petroleum, crude oil and natural gas as sources of energy, fuels and
chemicals. Since millions of years were required to form fossil fuels in the
earth, their reserves are finite and subject to depletion as they are
consumed. The only other naturally occurring, energy resources-
containing carbon resource, that is large enough to be used, as a
substitute for fossil fuels is biomass. Currently, 80% of the world energy
demand is met by combustion of fossil fuels which are depletable. The
global energy demand is expected to grow by about 50% by 2025 (Edirin
et al 2012) the major part of this increase coming from rapidly developing
countries. Given the growing world population, increasing energy demand
per capital and global warming ,the need for a long term alternative
energy supply is clear (Vancoillie and Verholst, 2010; Sandia National
Laboratories, 2010).
1

Renewable energy is considered to be the most important world energy
resources for the future. The decrease in the fossil fuels, has lead to
greater attention to the renewable energy sources such as sunlight, wind,
rain, tides, and geothermal heat. Renewable energy is an alternative to
fossil fuels and nuclear power, and was commonly called alternative
energy in the 1970s and 1980. In 2008, about 19% of global final energy
consumption came from renewable, with 13% coming from traditional
biomass. Which is mainly used for heating, and 3.2°k from
hydroelectricity. Now renewable(small hydro, modern biomass, wind,
solar, geothermal, and biofuels) accounted for another 2.7% and are
growing very rapidly. The share of renewable in electricity generation is
around 18%, with 15% of global electricity coming from hydroelectricity
and 3% from new renewable (Vecan, 2011).
The term “biomass’T is generic that encompasses diverse fuels
derived from Umber, agriculture and food processing wastes or from fuel
crops that are specifically grown or reserved for electricity generation.
Biomass fuel can also include sewage sludge and animal manure. Some
biomass fuels are derived from trees. Given the capacity of trees to
regenerate, these fuels are considered renewable. Burning crop residues,
sewage or manure - all wastes that are continually generated by society
to generate electricity may offer environmental benefits in the form of
preserving precious landfill space or may be grown and harvested in ways
that cause less environmental harm.
Plants absorb solar energy , using it to drive the process of
photosynthesis, which enables them live. The energy in biomass from
plant matter originally comes from solar energy through the process
2

known as photosynthesis. The energy which is stored in plants and
animals(that eat plants or other animals), or in the waste that they
produce, is also biomass.
This energy can be recovered by burning biomass as a fuel. During
combustion, biomass releases heat and carbon dioxide that was absorbed
while the plant was growing. Essentially, the use of biomass is the
reversal of photosynthesis. Is biomass energy a variety of chemical
energy?. In nature all biomass ultimately decomposes to its molecules
with release of heat. The release of energy from the combustion of
biomass imitates natural processes. Therefore, the energy obtained from
biomass is a form of renewable energy and, in principle, utilizing this
energy does not add carbon dioxide to the environment in contrast to
fossil fuels of all the renewable sources of energy, biomass is unique in
that it effectively stored solar energy. Furthermore, it is the only
renewable sources of carbon and is able to be converted into convenient
solid, liquid and gaseous fuels (A. Demirbas, 2001).
Biomass can be used directly (example burning wood for heating
and cooking) or indirectly by converting it into a liquid or gaseous
fuel(example alcohol from sugar crop or biogas from animal waste).The
net energy available from biomass when it is combusted ranges from
about 8mj/kg for green wood, to 20mj/kg for dry plant matter, to 55mj/kg
for methane as compared with about 27mj/kg for coal (A. Demirbas,
2001).
Biomass, mainly in the form of wood, is the oldest form of energy
used by humans Traditionally, biomass has been utilized through direct
3

combustion, and this process is still widely used in many parts of the
word. Biomass has historically been a dispersed, labor intensive and land
intensive source of energy.
The earth’s natural biomass replacement represents an energy
supply of around 300EJ (3x10²¹) a year, of which just under 2% is
currently (1998) used in fuel. It is not possible however, to use all of the
animal production of biomass in a sustainable manner. One analysis
provided by the united nation conference on environment and
development (UNCED) estimates that biomass could potentially supply
about half of the present world primary energy consumption by the year
2050 (A. Dermirbas, 2001).
Biomass has great potential as a renewable energy source, both for
the richer countries and for the developing world. Biomass as a fuel is still
in the experimental stage and provides only about 0.25°k of the total
electricity generating capacity in the UK. However, this is likely to increase
for a number of reasons. One reason is that Europeans and UK legislation
aim to encourage less polluting methods of waste disposal, and one viable
option is to burn the waste to generate power. Another reason is that
biomass power system will become more affordable as technology
improves.
Biomass is used for facility heating electric power generation, and
combined heat and power. Biomass can be converted to other forms of
energy like methane gas or transportation fuels like ethanol and biodiesel.
Rotten garbage, and agricultural and human waste, all release methane
gas called “landfill gas” or “biogas”. Crops, such as corn and sugarcane,
4

can be fermented to produce the transportation fuel, ethanol. Biodiesel,
another transportation fuel can be produced from leftover food product
like vegetable oils and animal fats. Biomass conversion to liquid (BTLS)
and cellulosic ethanol are still under research.
At present, most biomass power plants burn lumber, agricultural or
construction/demolition wood wastes. Direct Combustion power plants
burn the biomass fuel directly in boilers that supply steam to the steam-
electric generators as are used to burn fossil fuels. With biomass
gasification, biomass is converted into gas methane that can then fuel
steam generators, combustion turbines, combined cycle technologies or
fuel cells. The primary benefit of biomass gasification, compared to direct
combustion, is that extracted gasses can be used in a variety of power
plant configurations.
The fact that biomass technologies use combustion processes to
produce electricity, they can generate electricity at any time, unlike wind
and most solar technology. By using easily renewable plant material for
energy generation, biomass technologies help protect the environment by
reducing dangerous greenhouse gas emissions, preserving important
wildlife habitat and limiting the environmental damage associated with the
extraction and combustion of traditional fossil fuels and nuclear power.
These biomass technologies are used in the production of clean
transportation fuels, electricity, chemicals and much more. By replacing
more polluting forms of energy generation, biomass resources have
helped United state reduce its dependence on Persian Gulf oil while
5

creating jobs and fueling economic growth. Across United state, biomass
power plants currently represent 11,000 MW - the second largest amount
of renewable energy in the nation (Osaghea, 2009).
Compared to these, bio resources are renewable with a cycling
time less than 100 years. It is the most developed renewable energy
source providing 35% and 3% of the primary energy needs of developing
and industrialized countries respectively . With 70% of India’s population
still in rural areas, there is tremendous demand on resources such as fuel
wood, agricultural residues, etc. to meet the daily fuel requirements.
About 13.01% of the energy in India is derived from bio resources
Dependence on bio resource to meet the daily requirement of fuel, fodder,
etc. in rural areas is more than 85% while in urban area the demand is
about 35% (Ramachandra, 1997 ).
Biomass is all non-fossil organic materials that have intrinsic
chemical energy content. They include aquatic and terrestrial vegetation
and all waste biomass such as municipal solid wastes, municipal bio-
solids and animal wastes, forestry and agricultural residues and certain
types of industrial wastes. Unlike fossil fuels, biomass is renewable in the
sense that only a short period of time is needed to replace what is used as
an energy resource. Biomass is a renewable energy source because the
energy it contains comes from the sun. Through the process of
photosynthesis, chlorophyll in plants captures the sunTs energy by
converting carbon dioxide from the air and water from the ground into
carbohydrates, complex compounds composed of carbon, hydrogen and
6

oxygen. When these carbohydrates are burned, they turn back into
carbon dioxide and water and release the sun’s energy they contain.
Bioenergy is regarded as “green” energy for several reasons. Recent study
on energy utilization in Karnataka considering all types of energy sources
and sector wise consumption reveals that traditional fuels such as
firewood (7.440 million tones of oil equivalent--43.62%), agro residues
(1.510 million tones of oil equivalent8.85%), biogas and cow dung (0.250
million tones of oil equivalent (1.47%) account for 53.20% of total energy
consumption in South West India (Boyle, 1996).
The collection of biomass fuels can have significant environmental
impacts. Harvesting timber and growing agricultural products for fuel
requires large volumes to be collected, transported, processed and stored.
Biomass fuels may be obtained from supplies of clean, uncontaminated
wood that otherwise would be landfilled or from sustainable harvests. In
both of these fuel collection examples, the net environmental plusses of
biomass are significant when compared to fossil fuel collection
alternatives. On the other hand, the collection, processing and combustion
of biomass fuels may cause environmental problems if, for example, the
fuel source contains toxic contaminants. Agricultural waste handling
pollutes local water resources, or burning biomass deprives local
ecosystems of nutrients that forest or agricultural waste may otherwise
provide (Boyle, 1996).
Generally, the figure below shows the generation of electricity in a
summarizes form from biomass.
7

Electricity generation is considered the most lucrative opportunity for
commercial exploitation of biomass, by virtue of the high value of
electricity . Biomass to electricity schemes already provide over 9 GWe of
world-wide generating capacity (AN et al, 2002). These systems burn
various biomass and wastes (mainly wood) in boilers to raise steam that is
used to drive a steam turbine. This technology is established but far from
ideal for biomass fuels. Generating capacities are constrained by the local
availability of feedstock and at low plant sizes steam turbine plant are
inefficient generators with high capital costs (A.V et al, 2002).
Increased efficiencies and decreased capital costs may be possible if the
solid biomass feedstock is first converted to an intermediate liquid or
gaseous fuel that may then be used in gas turbines or engines (A.V et al,
2002). The integration of sustained feed production, feed conversion and
high efficiency electricity generation as shown below may be the key to
generating electricity from biomass at a lower cost than is currently
possible.Feed Feed Electricity
Producti on Con version (3encratio n
7.
Fig. 1. Basic stages in a complete integrated biomass toelectricity system.
8

This feed production stage is the primary sources of the biofuel and the
feed conversion is the second complex stage where the conversion of
these biomass takes place there by leading to the generation of electricity.
Hence, this is a summarize integrated biomass to electricity generation.
Different methods can be use to generate electricity but due to some
factors such as complexity of the materials or method to be use,
expensiveness of the materials and the availability of the materials makes
the gap to be wide between the existing research and the available
research carried out in the area.
1.1 Statement of the Problem
Hadejia is a highly fertile area with abundant biofuels ranging from
forestry by products, animal husbandry and agricultural produce such as
rice ,sugar cane ,wood, sorghum, wheat ,maize ,barley ,straw, potato,
yam, animal manure, grass species, hemp etc. This locality depends solely
on fossil fuel as the only source of electricity, rather than exploiting the
most effective biomass source in generating electricity.
Analysis of the heating values of some biomass materials in thermal
generation of electricity is a fundamental input towards finding among the
available biomass the one that is more efficient in generating electricity.
To the best of my knowledge no work has been done to find out the most
effective among the available biofuels in Hadejia±
9

1.2 General Objective:
The general objective of this study is to compare the heating
value and efficiency of three types of biofuels in generating electricity.
1.2.1 Specific Objective:
More Specifically the study is intended to:
(I) Determine the efficiency/heating value of rice husk, saw dust
and coconut shells.
(ii) Determine the highest heat valued biofluel.
1.3 Significance of the Study
Generating electricity from biomass sources will be of tremendous
importance to the locality and the state at large as it will stimulate
research in materials available for the energy generation. Private
organizations or firms can make use of the findings to generate electricity
on a large scale by using most efficient biofuel. As biomass is often a
byproduct, or residue or waste product of other processes such as farming
animal husbandry and forestry, which in theory there is no competition
between fuel and production, although this may not always be the case,
that is it is cheaper and readily available . The study will however compare
the three biofuels as sources of heat energy to generate electricity.
This comparative study will serve as an opener for finding and
recommending the most effective biofuels in the generation of electricity
in the locality and the state at large as biomass has the advantage of
10

dispatchability (controllable and available).Flence it can be use for
commercial scale facility rather than utility scale.
1.4 Scope of the Study
The study was conducted at Hadejia local government, Jigawa
state. The town is located in the eastern part of Jigawa state in Northern
Nigeria .It has a population of one hundred and four thousands two
hundred and eighty six peoples (104,286) as of 2006 census (National
population commission draft book, 2006). It lies between 10° E longitude
to 12°. 25s N and 12°.30s N latitude.
The area is ecologically important as it has rivers and is upstream from
Hadejia- Nguru wetlands. It has a good rich land for the production of
Agricultural produce, forestry by product and animal husbandry, hence it
will serve as very rich source of biomass. The materials for the study
include Saw dust, Rice husk and Coconut shell.
The study which is intended for the comparison of the types of biofuels for
the generation of electricity was conducted between April 2013 to
August, 2013.
11

CHAPTER TWO
LITERATURE REVIEW
2.0 The Electricity
According to Thales of Miletus a pre-socratic greek philosopher, it appears
that Westerners know as long ago as 600B.C that amber becomes
charged by rubbing. There was little real progress until the English
scientist William Gilbert in 1600 described the electrification of many
substances and coined the term electricity from Greek word for amber. As
a result, Gilbert is called the father of modern electricity .In 1660 Otto Von
Guericke invented a crude machine for producing static electricity. It was
a ball of sulfur, rotated by a Crank with one hand and rubbed with the
other. Successors, such as Francis Hauksbee, made improvement that
provided experiments with a ready source of static electricity. Today’s
highly developed descendant of these early machines is the Van de Graaf
generator, which is sometimes used as a particle accelerator. Robert Boyle
realized that attraction and repulsion were mutual and that electric force
was transmitted through a vacuum. Stephen Gray distinguished between
conductors and non conductors. C.F. Du Fay recognized two kinds of
electricity, which Benjamin Franklin and Ebenezer Kinnersely of
Philadephia later named positive and negative.
Progress quickened after the Leyden jar was invented in 1745 by Pieter
Van Musschenbroek (National high magnetic field laboratory, 1800E).
12

2.1 Bask Concepts Of Electricity
Electricity is the set of physical phenomena associated with the presence
and flow of electric charge. Electricity gives a wide variety of well-known
effects, such as lightning static electricity, electromagnetic induction and
electrical current. In addition, electricity permits the creation and
reception of electromagnetic radiation such as radio waves.
In electricity, charges produce electromagnetic fields which act on other
charges. Electricity occurs due to several types of physics:
• Electric charge: a property of some subatomic particles, which
determines their electromagnetic interactions. Electrically charged
matter is influenced by, and produces, electromagnetic fields.
o Electric current: a movement or flow of electrically charged
particles, typically measured in amperes.
o Electric field an especially simple type of electromagnetic field
produced by an electric charge even when it is not moving (i.e.,
there is no electric current). The electric field produces a force on
other charges in its vicinity. Moving charges additionally produce a
magnetic field (Solymar,1984)
Electric potential: the capacity of an electric field to do work on an electric
charge, typically measured in volts.( Sears, et al 1982).
electromagnets: electrical currents generate magnetic fields, and changing
magnetic fields generate electricity. An electric circuit is an interconnection
of electric components such that electric charge is made to flow along a
13

closed path (a circuit), usually to perform some useful task ( Berkson and
William 1974).
The components in an electric circuit can take many forms, which can
include elements such as resistor, capacitor, switches, transformers and
electronics.
In electrical engineering, electricity is used for:
o Electric power where electric current is used to energize
equipment;
o Electronics which deals with electrical circuits that involve active
electrical components such as vacuum tubes, transistors, diodes,
and integrated circuits, and associated passive interconnection
technologies.
These are some of the basic concept of electricity.
2.2 Sources of Electricity
Sources of electricity are everywhere in the world. Worldwide, there is a
range of energy resources available to generate electricity. These energy
resources fall into two main categories, often called renewable and non
renewable energy resources. Each of these resources can be used as a
source to generate electricity, which is a very useful way of transferring
energy from one place to another such as to the home or to industry.
14

Non-renewable sources of energy can be divided into two types: fossil
fuels and nuclear fuel.( Ibidapo and Ajibola, 2011) have identified many
sources of generating electricity.
2.2.1 Fossil fuels
Sources of electricity include fossil fuels which are found within the rocks
of the EarthTs crest. They are called fossil fuels because they are thought
to have been formed many millions of years ago by geological processes
acting on dead animals and plants, just like fossils. Coal, oil and natural
gas are fossil fuels. Because they took millions of years to form, once they
are used up they cannot be replaced.
2.2.2 Oil and natural gas
Oil and gas are chemicals made from molecules containing just carbon
and hydrogen. All living things are made of complex molecules of long
strings of carbon atoms. Connected to these carbon atoms are others
such as hydrogen and oxygen. A simple molecule, called methane (CH4)),
is the main component of natural gas.
Crude oil (oil obtained from the ground) is a sticky, gooey black stuff. It
contains many different molecules, but all are made of carbon and
hydrogen atoms.
2.2.3 Coal
Coal, mainly consists of carbon atoms that come from plant material
from ancient swamp forests. It is a black solid that is reasonably soft, and
can scratch it with a fingernail. It is strong enough to be carved into
15

shapes. There are different types of coal. Some contain impurities such as
sulphur that pollute the atmosphere further when they burn, contributing
to acid rain.
2.2.4 GeothermalGeothermal power uses the heat that comes from deep rocks under the
surface of the Earth. The temperature of the Earth increases towards its
centre. The hot water or steam that comes from deep within our planet
can be used to generate electricity.
2.2.5 Hydro-electricHydro-electricity is generated from running water. Dams are built across a
lake or river in a valley to trap water. The water flows through tunnels
and turns the turbines which generate electricity.
2.2.6 Solar
The Sun releases an amazing amount of energy due to the nuclear fusion
of hydrogen taking place within its core. Solar panels, called photovoltaic
cells are used to convert the Sun’s energy into electric energy. The Sun
can also be used to heat water passing through special solar collectors.
2.2.7 Wind
Wind is made when the Sun heats the Earth and the area above land gets
hotter than the area above water. The hot air above land rises upwards
leaving an area of low pressure. Cooler air moves into this area of low
16

pressure resulting into wind which can be used to turn wind turbines and
generate electricity.
2.2.8 Biomass
Biomass uses the energy from plants and waste materials to make
electricity. For example, wood or animal droppings can be burnt to make
steam that turns turbines to make electricity. Biomass combustion,
however, emits CO2 and other pollutants
2.2.9 Tidal
Tidal energy comes from the movement of water in the sea by the tides.
These tides happen twice a day. The flow of water that is created by the
tides is used to turn generators that make electricity.
2.3 Methods of Generating Electricity from Biomass
According to the U.S. Department of Energy (DOE), biomass recently
surpassed hydropower as the largest domestic source of renewable
energy, and consumption by electric utilities is expected to double every
10 years through 2030.The methods of generating electricity can be split
into two different groups. There are the dry processes consisting of
combustion and pyrolysis and wet processes consisting of anaerobic
digestion, gasification and fermentation.
17

2.3.1 Combustion
The most obvious way of extracting energy from biomass is by use of the
technology of direct combustion. Which is straightforward and
commercially available. Combustion systems come in a wide range of
shapes and sizes burning virtually any kind of fuel, from chicken droppings
and straw bales to tree trunks, municipal refuse and scrap tyres. Some of
the ways in which heat from burning wastes is currently used include
space and water heating, industrial processing and electricity generation.
One problem with this method is its very low efficiency. With an open fire
most of the heat is wasted. One method of improving the efficiency in
developing countries is to build stoves out of mud and scrap iron.
2.3.2 Pyrolysis
A wide range of energy-rich fuels can be produced by roasting dry woody
matter like straw and woodchips. The process has been used for centuries
to produce charcoal. The material is pulverized or shredded then fed into
a reactor vessel and heated in the absence of air. Pyrolysis can also be
carried out in the presence of a small quantity of oxygen (‘gasification’),
water (‘steam gasification’) or hydrogen (‘hydrogenation’). One of the
most useful products is methane, which is a suitable fuel for electricity
generation using high-efficiency gas turbines.
18

2.3.3 Anaerobic Digestion
Biogas is produced when wet sewage sludge, animal dung or green plants
are allowed to decompose in a sealed tank under anaerobic (oxygen-free)
conditions. Feedstock like wood shavings, straw and refuse may be used,
but digestion takes much longer. Each kilogram of organic material (dry
weight) can be expected to yield 450-500 litres of biogas (Ibidapo and
Ajibola, 2011). The residue left after digestion is a potentially valuable
fertilizer or compost. Fermentation of sugar solution by natural yeasts
yields ethanol. Suitable feedstocks include crushed sugar beet and fruit.
Sugars can also be manufactured from vegetable starches and cellulose
by pulping and cooking, or from cellulose by milling and treatment with
hot acid. After about 30 hours of fermentation, the brew cantains 6-10 per
cent alcohol, which can be removed by distillation as a fuel.
2.3.4 Gasification
This process, usually using wood, produces a flammable gas mixture of
hydrogen, carbon monoxide, methane and other non flammable by
products. This is done by partially burning and partially heating the
biomass (using the heat from the limited burning) in the presence of
charcoal (a natural by-product of burning biomass). The gas can be used
instead of petrol and reduces the power output of the car is reduced by
about 40%. It is also possible that in the future this fuel could be a major
source of energy for power stations.
19

2.3.5 CO-FIRING
Co-firing substitutes biomass for a portion of coal in an existing power
plant furnace, significantly reducing toxic emissions
2.3.6 Modular Systems
Modular systems employ some of the same technologies mentioned
above, but on a smaller scale that is more applicable to villages, farms,
and small industry. These systems are now under development and could
be most useful in remote areas where biomass is abundant and electricity
is scarce. There are many opportunities for these systems in developing
countries
2.3.7 Landfill Gas
Landfill gas uses a similar technology to anaerobic digestion and it carries
the same benefits. It occurs as a by-product of the decomposition of solid
waste and consists of 50 percent methane (natural gas), 45 percent
carbon dioxide and 4 percent nitrogen. Additionally, it helps to reduce
landfill waste by using the waste stream for electricity generation.
20

2.4 Renewable Electricity Generation by Energy Source
BWIan K~cqat Horns
800
700 31.7% Biomass
600
500 17.~winci
400 3.1%Solar3.1% Urban Waste
300 3.0% Geothermal
200
100 41.3% Hydropower
0 2007 2010 2020 2030
FIGURE. 2.4.1: Illustrated renewable electricity projection byenergy source in a bar diagram by percentage (Department ofenergy, Energy information Administration, Energy Outlook).
Electric energy from a power plant is measured in kilowatt-hours (kWh)
and is priced in t/kWh. (Department of Energy, Energy Information
Administration, Energy Outlook 2009).
Fig. 2.5.1 shows that biomass is expected to be the second-largest source
of renewable electricity generation (behind hydropower) through 2030. Of
all the renewable energy sources, biomass is projected to be the fastest
growing, going from 11°k of the total in 2007, to more than 41% in 2030.
Electricity generation from biomass, both dedicated and co-firing, is
expected to grow from 39 billion kilowatt-hours in 2007 to 231 billion
kilowatt-hours in 2030. This co-firing has been tried successfully in Brazil.

2.5 Generation of electricity from biomass in Africa
Africa has a high potential of renewable energy in terms of its
biomass resources mostly in the rural areas. The climatic condition which
varies across the continent allows for the growth of trees and other types
of biomass.
Africa is a very large continent it has many countries. It is blessed with
huge energy resources. In 2004, the proved oil ,gas and coal reserves
were 9.4%,7.9% and 5.5% of the world total respectively. The
hydropower potential of the continent amounts to 13% of the world’s
potential. In the African continent energy is acquired mainly from
biomass 47%, oil 24.8% coal 16.5%, gas 10.4% and other renewable
sources (Osaghea, 2009).
There are different technologies for the production of energy from
biomass sources. These technologies involve the combustion or
gasification of biomass to produce either steam or a clean gas that can be
used in a steam or gas turbine to generate electricity
There are many plants that were installed in many parts of the
global world purposely for the energy production from different biomass.
In different countries of Africa many such plants have been installed. An
example is the installation of a 35kw down draft gasifier in Seychelles
which uses wood and coconut shell as fuel for electricity production
(Osaghea, 2009). In the Eastern part of Africa like in Burundi it also has
an installation in Tora village which has a capacity of 36kw down draft
gasifier for industrial electricity production using peat. In Mali, in western
22

part of Africa, there is the installation, in Dogofiri community, of a gasifier
for the production of 160kw using rice husks as a fuel(Osaghea, 2009). In
Mauritus, in the northern part of Africa, the country which is devoid of any
fossils fuels, about 300GWh of the country electricity is from bagasse
residue (Osaghea, 2009). Eleven cane sugar factories are in operation
and ten of them export electricity to the grid (Stephen et al, 2003).
There are so many plants that have been installed in other less
developed countries of the world, India, Thailand, Brazil, Indonesia and
Malaysia. These plants use the biomass resources available in these areas
for electricity production( Osaghea,2009).
The African continent’s electricity consumption was the lowest in
the world at only 5l4kwh per capita as at 2002. The Scarcity of the
generated electricity coupled with poor economy standard of the populace
make it to be very difficult to find and use in most of the African
countries. The International Energy Agency (LEA) reports shows that in
2002, access to electricity ranges from YO% to over 95°k in Northern
Africa, and to an average of 23% in sub-saharan Africa. These results do
not reflect disparities between countries(for instance less than 4°!o in
Uganda compared to 66% in South Africa or 100% in (Mauritius) and
between urban and rural areas, where in the latter access can be low as
1%(Osaghea,2009).
Energy from biomass accounts for more than 3O% of energy consumed in
Africa and more than 80% in some countries, such as
Burundi(91%),Rwanda and Central Africa(90°k),Mozambique(89%),
Burkina fasso (87%),Benin(86%), Madagascar and Niger 85%. From 1994
23

to 2004, primary energy consumption in Africa has increased by
24%(Osaghea,2009).
Africa is estimated to have about 82 millions tons of biomass resources
with an average growth of 1.7 billions tons. This rate growth affords
nearly three times the per capita wood demand in the continent at current
consumption level. In most part of the continent Forestry by product were
not properly utilized in tapping their energy(Osaghea, 2009).
Even though, there are abundant energy resources in Africa but it is the
continent which is generating only 3.1% of the world electricity this makes
it to be the least among all the regions world wide. It was stated that the
this situation has not improved for over ten years and it was even
projected that it may reach many more years the production will be at
stand still or slowly (Osaghea, 2009).
Electricity is generated mainly from coal (46%), gas(23%), hydro(18%),
oil(11%), and nuclear (2°k in South Africa only).The renewable sources
such as solar, geothermal, wind etc play an insignificant role so far,
despite some noteworthy initiatives such as the development of wind farm
in Egypt, Morocco, Algeria and South Africa (Osaghea, 2009).
On the continent, there are marked disparities; South Africa alone
generates close to half of the total African electricity. Many African
countries rely heavily on hydropower(70% to 80% for their electricity
generation).
According to (Osaghea, 2009),the bulk of the region generating
capacity and transmission network was built in the 1950s and 1960s.The
continued under-investment in maintenance and renewal has left many
24

African countries in worsening energy situations. Technical and non
technical losses typically exceeds 20%, power outrages, black outs and
power surges are common place, while load shedding in times of drought
are routine.
With 13.1% of the world total energy production Africa consumes only
5.5%.The energy consumption per capita is 58.15kw/h per year, which is
far lower than the world average of 13956kw/h per capita per year,
making the continent lag behind all others in energy (Osaghea, 2009).
Moreover, there is a need for the African countries to double their effort in
exploiting the available sources to generate electricity.
2.6 Available sources of biomass energy generation in Nigeria
Nigeria is located in sub-sahara Africa ,between latitude 4 and 14
and longitude 2 45 and 14 3E, it has a populauon of over 100 million, with
a population growth rate of 3.3%.At present, about 40% of the total
population have access to grid electricity, of this only 6% in rural areas
where a large percentage of the population live (Osaghea,2009).
Nigerias climate permits the cultivation of a variety of crops. As in other
west Africa states, rain fall is heavier in the south, where the forest and
savannah benefits from abundant precipitation are relatively short dry
seasons, (Mother land, 2005). The crops grown include cassava, yam,
cocoyam, and sweet potato. Tree crops like cocoa, palm oil, rubber and
timber. The northern part of the country experiences less rain. The region
lies mostly in the Sudan savannah and Sahel savannah, where the crops
cultivated are millet, cowpeas, sorghum, rice, cotton and groundnut
(Osaghea,2009).
25

Therefore, biomass resources in the country include agricultural crops,
wood, grasses, and shrubs, residues and waste (agricultural, forestry,
municipal, and industrial ), and aquatic biomass. The total biomass
potential in Nigeria was estimated to be 1.2x10¹² j in 1990 (Obio and
Fagbenle, 2004), in 2005 research revealed that bio-energy
resource/potential of Nigeria stood at: Fuel wood 13,071,464 hectares,
animal waste, 61 million tones per year, crop residues 83 million tones
(Agba et al..,2010).
In North America, 62% of all residue occur between October and
December while in Nigeria , about 80% of the residue occur between April
and September (Odia, 2006).
Nigeria has a total of 1,160 constituted forest reserves covering a total
area of 10,752,702 hectares representing about 10% of the total land
area (Ojonigu et al 2010, Oladipo, 2010). All these sources can be use to
generate heat and electricity.
(Von Braun and Abila, 2010) classified Nigeria as one of the countries with
very high potential for energy crops production, hence with potentiality of
tapping or generating electricity from these sources.
Nigerian current major source of energy are from the combustible
renewable oil and natural gas. The combustible renewable dominates as
the principal source of primary energy for majority of Nigerians. Energy
supply from this source has increased over the years from about
44000GWh in 1971 to about 93000GWh in 2003 corresponding to an
increase of 111%.This increase is mainly due to the increase in population
which on the long run has caused an increase in pressure on the use of
26

renewable mainly in the form of wood-fuel as a major source of energy
supply (Osaghea, 2009).
The other sources of energy supply are the oil and natural gas. The
supply of energy from these sources for domestic need is low. About 95%
of the countries revenue comes from these sources (Osaghea,2009).
The electricity supplies from hydropower has increased
considerably over the years. It has increased from about 2000GWh in
1971 to about 7000GWh in 2002, although this is not enough to provide
all the potential users partly because of the continuously increasing
number of inhabitants and partly the excessive energy losses in the
transmission and distribution (TEA energy statistics 2007).
In Nigeria the power sector Is presently being manage by power
holding company, plc (PHCN), formally national electric power authority
(NEPA).As an integrated utility company providing generation,
transmission and distribution services.
Nigeria has a grid capacity of 4000MW, as at 2003, but the present peak
demand is about 6000MW far higher than the generating capacity. The
demand has been estimated to increase to about 8000MW in the year
2007 and 1000MW in the year 2010. Subsequently, the country may face
serious power shortage due to low electricity generation in years to come
(Osaghea,2009).
This problem of energy generation may be due to lukewarm attitude of
the government on domestic energy production, very low participation of
27

private sector or their partial participation and investment, improper policy
regulation and institutional frame work, above all insufficient and in
adequate utilization of the available biomass sources for the energy
generation. Hence this study make use of rice husk, saw dust and coconut
shell in the thermal generation of electricity , and it will serve as a means
of selecting the most efficient among the selected biofuels.
28

CHAPTER THREE
METHODOLOGY
There are many ways to generate electricity from biomass. Among them
are direct-fired or conventional steam approach, pyrolysis, co-firing,
biomass gasification , anaerobic digestion, landfill gas collection and
modular system. These were described in details in chapter two. The
study was conducted at Hadejia municipal, Hadejia local government
jigawa state, Nigeria.
However, this study employed direct-fired method for the generation of
electricity.
Furnace/boil
Biomass Steam
FIGURE: 3.1 Experimental set up in block form for the thermalgeneration of electricity.
Above is the experimental set up in a block form which shows the
biomasses saw dusts, rice husks and coconut shells, how they are stored,
and processed(dried and milled) and a required quantity of each biomass
was measured and put in a furnace with a boiler containing measured
quantity of water which was heated to produces a steam that blew a
thermopile which subsequently generated an electromotive force (emf)
which is detected using a digital multimeter in milli volts (my). The e.m.f
was recorded when it reached peak or maximum stage before it falls or
decreases.
29
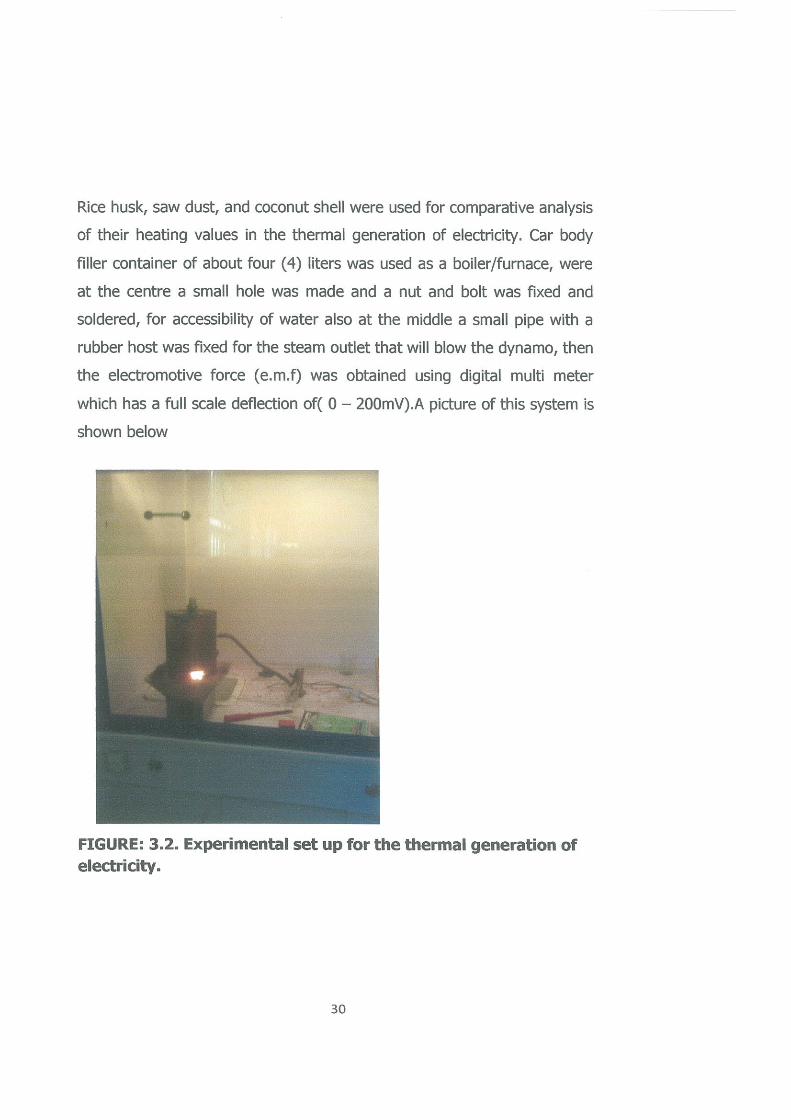
Rice husk, saw dust, and coconut shell were used for comparative analysis
of their heating values in the thermal generation of electricity. Car body
filler container of about four (4) liters was used as a boiler/furnace, were
at the centre a small hole was made and a nut and bolt was fixed and
soldered, for accessibility of water also at the middle a small pipe with a
rubber host was fixed for the steam outlet that will blow the dynamo, then
the electromotive force (e.m.f) was obtained using digital multi meter
which has a full scale deflection of( 0 — 200mV).A picture of this system is
shown below
FIGURE: 3.2. Experimental set up for the thermal generation ofelectricity.

When the biomass is directly fired, or burnt it must first be dried , as it will
burns more efficiently, sized into smaller pieces, and briquetted.
Briquetting is a densification process of loose organic materials aiming to
improve handling and combustion characteristics.
The samples used were Rice husk, as shown in figure 3.3;Saw dust, figure
3.4; and coconut shell, figure 3.5; respectively.
Figure: 3.3 Milled and briquetted Rice husk Sample
Above is the sample of rice husks which was milled and the particles
appeared to be very small in size. This is one of the sample used for
experiment it was milled and dried so that it can easily be use for burning
and obtaining an accurate result.

Figure:3.4 Milled and briquetted saw dust Sample
The figure above also shows sample of saw dust when milled has
appeared to be finest than the particles of rice husks and coconut shell.
The sample was also milled and dried so as to hasten its burning and
make the result to be more accurate.
Figure: 3.4 Milled and briquetted coconut shell Sample

The figure sample of coconut shell despite been milled appeared to be
bigger than the sample particles of rice husks and saw dust, this may be
due to the facts that it is stronger than the other biomass. The sample
was milled and dried so that it can easily be burnt to obtain accurate
result.
When the preparation is complete different quantity of each
biomass ranging from bOg, 200g, 300g, 400g and 500g was measured
using weighing balance and put in a furnace, about 25m1 volume of water
was put in a boiler and heated that generated a steam as per each
quantity of biofuel which eventually heated the thermopile and generated
electricity. In each case the electromotive force (e.m f) was determined
and the initial and final temperatures was taken and recorded likewise the
time of the experiment was noted through out the experiment.
The set up above shows how the experiment was conducted. The process
was repeated with different masses of the biomass and the electromotive
forces (e.m.f) obtained respectively. Data obtained was analyzed using
Microsoft Excel.
33

CHAPTER FOUR
RESULTS AND DISCUSSION
The experiment was performed at an interval so as to avoid or minimize
instrumental and other possible errors.
The parameters considered in the experiment were masses of the biomass
measured in grams,(gm),the initial and final temperatures of the water as
01 and 02 in degree Celsius(°C) and the volume of the water in milliliter
,(ml) while the time in seconds(s) was considered to be constant
throughout the experiments.
For all the measured parameters different values were obtained according
to the quantity of the used biomasses, an average of two(2) readings for
each parameter was considered moreover, reading of the final
temperature was taken as the water boils and releases steam. The slope
or gradient which is the ratio of the change in Y-value over the change in
the X-value was obtained for each biomass likewise the point of intercept
was determined. It was visualized that the steepness of the graph
becomes higher at the highest value of the corresponding electromotive
force and masses of biomass. All the graphs have Y-intercept where the
graph crosses Y-axis that means X is zero. It is the gradient that manifest
the most efficient among the three biomass. Moreover, different masses
was used so as to obtained a diversed values that will give an accurate
and reliable result. Hence the result was recorded accordingly ,Below is
the table of values of the experiment.
34

TABLE. 4.1: Table of values of Saw Dust
S/N MASS(gm) E.M.F(mV) INITIAL FINAL H=MC A 0
± 0.lmV TEMPERATURE TEMPERATURE 02
01 (°C) (°C)
± 0.1°C ± 0.1°C1 100.0 7.2 30.0 100.0 6300
2 200.0 9.1 32.0 99.5 12060
3 300.0 13.2 30.0 100.0 18900
4 400.0 16.0 30.0 98.5 24480
5 500.0 20.2 30.0 100.0 31500
This is the table of the values obtained for rice husk
TABLE.4.2: Table of value for Rice Husks
S/N MASS(mg) E.M .F(mV) INITIAL FINAL H=MC A 0TEMPERATURE TEMPERATURE
± 0.1 mV 01(°C) 02(°C)± 0.1°C ± 0.1°C
1 100.0 5.2 30.0 100.0 1309
2 200.0 8.3 30.0 100.0 2618
3 300.0 10.0 29.5 99.5 3927
4 400.0 14.2 30.0 100.0 5236
5 500.0 15.2 28.5 100.0 6732
35

TABLE 4.3: Table of values for Coconut Shell
S/N MASS(gm) E.M.F(mV) INITIAL FINAL H=MC AG
± 0.lmV TEMPERATURE TEMPERATURE
e1(°C) 02(°C)±0.1°C ± 0.1°C
1 100.0 10.1 30.0 100.0 11690
2 200.0 11.0 30.0 100.0 23380
3 300.0 15.2 29.5 100.0 35571
4 400.0 19.2 29.5 98.5 46092
5 500.0 22.0 30.0 100.0 58450
For each biomass a graph of electromotive force was plotted
against mass and a gradient is also obtained.
GRAPH OF E.M.F VERSUS MASS FOR SAWDUST
I!100 200 300 400 500 600
MASS{g)
36

FIGURE.4.4: Graph of E.M.F Against Mass of Saw Dust
From the above graph one can see that the minimum electromotive
force (e.m.f) was 7Mv and the maximum electromotive force (e.m.f) was
2OMv at the mass of bOg and 500g respectively. The gradient was
O.O33mV/g with an intercept of 3.lmV.
FIGURE.4.5: Graph of E.M.F Against Mass of Rice Husks
From the graph above it can be seen that the minimum
electromotive force (e.m.f) was 5mV and the maximum electromotive
force (e.m.f) was lSmV at mass of bOg and 500g respectively with a
gradient of O.O26mV/g and an intercept of 2.6mV.
18
GRAPH OF E.M.F VERSUS MASS FOR RICEHUSKS
1614
512~1o
ui 642a
0 100 200 300 400 500 600
MASS(g)
37

GRAPH OF E.M.F VERSUS MASS OF COCONUT SHELL
25~ —____________
>0.031x+2.9
0 -~
0 100 200 300 400 500 600MASS{g)
FIGURE.4.6: Graph of E.M.F against Mass of Coconut Shell
From the graph also it can be seen that the minimum electromotive
force (e.m.f) was lQmV and the maximum electromotive force (e.m.f) was
22mV at mass of bOg and SOOg respectively with a gradient of
O.O3bmV/g and an intercept of 2.9mV.
Generally, the gradient of the three (3) biomass used shows that
saw dust is having O.O33mV/g, rice husks with O.O26mV/g, and coconut
shell with O.O3lMv/g.
The result therefore, indicated that saw dust is having the highest
gradient of O.O33mV/g followed by coconut shell with O.O3lmV/g and rice
husks with O.O26mV/g. This results indicated that saw dust is the most
efficient in the thermal generation of electricity then followed by coconut
shell and then rice husks.
38

The obtained values of e.m.f against masses of different biomass
were represented using bar graph for the rice husks, saw dust and
coconut shell.
FIGURE.4.7 Bar graph of E.M.F Against Mass of Rice Husks
The bar graph represent the linear graph of the values of
electromotive force (e.m.f) and mass(g).The graph indicated an increase
in mass goes with increase in electromotive force.
18
BAR GRAPH OF EMS AGAINST MASS
1614
—12E 10
UJ 5
420
100 200 300 400 500
MASS(g)
39

FIGURE.4.8: Bar graph of E.M.F Against mass of Saw Dust
The bar graph represent the linear graph of electromotive
force(e.m.f) and mass(g).The bar graph shows that increase in mass goes
Shell
>E
LI-
2LU
Mass of Coconut
EU
LU
BAR GRAPH OF E.M.F AGAINST MASS25
20
15
10
5
0
100 200 300 400 500
MASS(g)
with the increase in electromotive force.
BAR GRAPH OF E.M1F AGAINST MASS25
20
15
10
5
0
100 200 300 400 500
MASS(g)
FIGURE.4S: Bar Graph of E.M.F Against
40

The bar graph represent the linear graph of electromotive force
(e.m.f) and mass(g).The bar shows increase in mass goes with an
increase in electromotive force. The different masses oflOOg, 300g and
500g of saw dust , rice husks and coconut shell were plotted in a single
bar graph to compare their e.m.f. The graphs obtained were shown
below.
~:— 4~ 4
—~
. *
FIGURE.4.1O: Bar Graph Comparing E.M.F With bOg of DifferentBiomass
BAR GRAPH REPRESENTING SAW DUST, RICE HUSKSAND COCONUT SHELI OF 100(gm) MASS
12——— — ___
10
.4UI
2
0
SAW DUST RICE HUSKS COCONUT SHELL
41

It is visualized that Coconut Shell gives highest am! than Saw Dust andRice Husks at bOg mass
1 -~
.L_ •
[ -—
.~—~—--~ •‘
FIGURE.4.11: Bar Graph Comparing E.M.F With 300g
Biomass
of Different
It is visualized that the Coconut Shell gives the highest e.m.f than Saw
Dust and Rice Husks at 300g mass.
FIGLJRE.4.12: Bar Graph
Biomass
Comparing E.M.F With 500g of Different
BAR GRAPH REPRESENTING 300g OF DIFFERENTBIOMASS
>E
LU
20
15
10
5
0
SAW DUST RICE HUSK COCONUT SHELL
DIFFERENT BIOMASS
——
~ -
~ —
BAR GRAPH REPRESENTING SOOg OF DIFFERENTBIOMASS
25 —_________ ——
20
E 15rn’10
LU ______ ______
0
SAW DUST RICE HUSKS COCONUT SHELL
DIFFERENT BIOMASS
42

It is also visualized that the Coconut Shell gives the highest e.m.f than
Saw Dust and Rice husks at 500g mass.
The above figures compare different masses of biomass with their e.m.f,
according to the bar diagram coconut shell is having the highest
electromotive force then followed by saw dust and then rice husks.
~j~j~E
FIGURE.4.13: Graph of E.M.F Against Heating Value of Saw Dust
From the graph as the electromotive force increases the heating value of
saw dust equally increases. Saw Dust is having a gradient of
O.000S5mV/kj and an intercept of 3.188mV, it has a specific heat capacity
of O,9kj/kg°c.
GRAPH OF E.M.F VERSUS HEAT VALUEOF SAW DUST
25
20>E 15
IA.
10Lu
5
0
0 5000 10000 15000 20000
HEATVALUEQ(KJ)
25000 30000 35000
43

FIGURE 4.14: Graph of E.M.F Against Heating Value of Rice Husk
From the above graph of electromotive force against heating value of rice
husk it can be seen that as e.m.f increase the heating value of rice husk
also increases, it has a gradient of O.OOlmV/kj and an intercept of
2.774mV.It has a specific heat capacity of O.187kJ/kg°c.
I—
9_ ~—_4I_• ~
~—~—-—l--—-—-1——-rm~T~C
FIGURE.4.15: Graph of E.M.F Against Heating Value of Coconut
Shell
E.M.F. VERSUS HEAT VALUE OFRICE HUSKS
20 r
0 2000 4000 6000 8000
HEAT VALUE ci (1<))
GRAPH OF E.MF VERSUS HEATVALUE OF COCONUT SHELL
25
5 20~15
10Lii
0 10000 20000 30000 40000 50000 60000 70000
HEAT VALUE ci (1(J)
44

From the above graph one can see that as the electromotive force
increase the heating value of Coconut Shell also increases. It has a
gradient of O.OO3mV/kj and an intercept of 5.77OmV, with specific heat
capacity of 1,67k3/kg°c
45

CHAPTER FIVE:
CONCLUSION AND RECOMMENDATION
5.1 Conclusion
In this dissertation a comparative analysis of the heating values of saw
dust ,rice husks and coconut shell in the thermal generation of electricity
was carried out. Different masses of the biomass were used, namely;
lOOg,200g,300g, 400g and SOOg and for each biomass a corresponding
value of the electromotive force was measured using a digital multimeter
in millivolts and other parameters considered were initial and final
temperature in degree Celsius, time and volume of water in seconds and
milliliter respectively.
It was observed that there was a relationship between the slope or
gradient and efficiencies of the biomass, this was justified in each
obtained graph as the mass was increased there was equally an increases
in the electromotive force and hence a higher gradient was obtained this
signifies that the gradient has a relationship with the efficiency of the
biomass. It can be deduced that Saw dust with gradient O.OO33mV/g
followed by Coconut shell with O.OO3lmV/g and than Rice husk with
O.0026mv/g is the most efficient biomass in the thermal generation of
electricity than Coconut shell and Rice husk.
In conclusion therefore, Saw dust is recommended to be use in the
thermal generation of electricity.
46

5.2 Recommendationi. Further research should be carried out with these biomass on a
large scale, this will give room for the exploitation of these
available resources in this locality.
ii. There is a need to explore more of the available biomass so as to
further find out the most effective among them since they are
affordable, efficient and abundant sources of domestic electricity.
iii. For all different samples, not all was burnt, so I suggest in future
one to measure the input sample and the left over sample and then
this makes the difference in masses as the actual burnt that
generated the e.m.f. as the researcher does not burnt all the
biomass since reading was taken when the meter shows peak value
iv. Finally, I recommend saw dust to be use in the thermal generation
of electricity since it has the highest gradient.
47

REFERENCES
1. Abila N (2010) Bio fuels adopting in Nigeria Preliminary review of
Feedstock and fuel Provation potatel, department of industrial
management Oxford University of vaasa, vaasa, Finland pp 1-11.
2. Agba A.M, Ushie M.E..,Abam RI, Agba M.S, Okoro 3 (2010).
Developing the Bio fuel industry for Effective Rural
Transformation. European journal of Scientific Research, Vol
40 No: 3, Pp 441-449.
3. A.V Bridgewater et al (2002). A techno-economic Comparison of
power production by biomass fast pyrolysis with gasification and
combustion.
4. A. Demirbas (2001) Energy conversion and management
5. Berxson, William (1974) Helds of force: the development of a
world view from Faraday to Einstein P.148 Routledge, 1974.
6. Boyle, G Renewable Energy Power for a sustainable future.Vt Ed:
Oxford University Press; UK 1996; 1-34
7. CIA-The World factbook. (2005). World Electricity production.
8. “Direct Fire Technologies.” Office of Energy Efficiency and Renewable
Energy, Department of Energy.
htt~://www.eere.energy.gov/consumerinfo/pdfs/’direct fire bio.pd f
9. Didem Vecan (2011) measurement and comparison of solar
radiation estimation models for IZMIR/ TURKEY, IZMIR
institute of technology case masters thesis, submitted to the
graduate school of engineering of and science of IZMIR
institute of technology in partial fulfillment of the requirement for
the degree of masters science in mechanical engineering.
48

10. Edirin B Agbo and Nosa A Ogle (2012) Department of mechanical
engineering Fedral Unit of Petroleum resources, effurum.
11. Foreign Agricultural Services, United States Department of
Agriculture(USDA).(2002).Crop Calendar of Nigeria.
http:flwww.fas.usda.aovlpecad
12. http:// mnes.nic/ach 1 htm (Accessed June 2013).
13. http: //odci.gov/cia/publications/factbook/fields/2038.html Accessed
July 20 2013.
14. International Energy Agency (IEA),Energy
statistics.(2003).Electricity Generation per fuel in Africa in 2002
<http://www.iea.org/textbase/stats/pdf> Accessed march 2007
15. International Energy Agency (rEA).(2004).Evolution of total primary Energy
Supply from 1971 to 2003.
16. International Energy Agency(IEA), Energy Statistics.(2003)
Electricity Generation per fue in Africa in 2002
http://www/iea.org/textbase/stats/pdf Accessed march 2007
17. International Energy Agency(IEA).(2002).Africa key Energy
Statistics<htt://www.iea.org> Accessed November 2005.
18. National Renewable Energy Laboratory. http:/fwww.nrel.gov/bioenercjy.
19 National Population commission draft book (2006).
20 New Partnership for Africa’s Development(NEPAD)(2003).Taking the
NEPAD Energy Initiative Forward: Regional and sub-regional
perspectives. httix//www.un.orWesa/sustdev/sdisscus/enerov/oo/neoadzhou. pdf
Accessed July 2013.
49

21 Odio.O.O(2006)Biomass as an Sustainable Domestic/Industrial
Fuel. PhD thesis, Department of Mechanical Engineering,
Ambrose Ali University Ekpoma.
22 Ojonigu F.A, Tabitha 5, Innocent A and Seidu O.M
(2010).Assessing Changes in Kangaro Forest, Kaduna state,
Nigeria, using Remote Sensing and GIS. Research Journal of
Applied Sciences, Engineering and Technology 2(2): 121-132
23 Osaghae O.J (2009). Potential Biomass Based Electricity
Generation in a Rural Community in Nigeria. Masters Thesis,
Department of Applie Physics and Engineering, Division of
Energy Engineering, Lulea University of Technology.
24 Obioh I and Fagbenle R.O (2004) Energy System: Vulnerability
Adaptation Resilience(VAR). Hello International journal in
engineering and applied science (ISSN:2276-8467).
25 Pricewater housecoopers.(2002).Sub-sahara Africa’s Energy
Conundrum. Pages
1&2< hUp ://www. pwc. com/gx/eng/about/ind/gov/ifi/pdf/electric
ity sector overview in Africa Accessed June 28,2006
26 Ramachandra, T.V; Subramanian, D.K Industrial Energy
Utilization in kamataka and potential savings. Energy
Conversion and management 1997, 38(6), 563-599.
27 Sears, Francis et al Young (1983), university physics, sixth
edition. Addison Wesley, pp 843 — 4.
28 Solymarl (1984), Lectures on electromagnetic theory, Oxford
University Press p, 140.
so

29 Stephen Karekezi, John kimani and Jennifer wangeci.
(2003).East Africa REEP Regional consultation workshop.
Draft workshop Report.
http://www.reep.org/media/downloaddabled
documentfdraft%20 workshop%20-%20 East. Accessed August
6 2013
30 United Nation Food and Agricultural organization. (FAO).(2005)
Report on Energy for sustainable Development.
31 Wikipedia. (2005) Geography of Nigeria
http://www.en.wikipedia.org/wiki/Geography of Nigeria
Accessed November 2013.
32 ‘Wood Energy Users.” Regional Wood Energy Development
Program in Asia. http://www.rwedp.org/index.html
33 <http:/www.uneca.org/csd/CSDA Report on Energy for
sustainable Development. htm (Accessed march 2013)
51