a comparative study of environmental taxes in the …
TRANSCRIPT

A COMPARATIVE STUDY OF ENVIRONMENTAL TAXES IN THE SOUTH AFRICAN CONTEXT
by
Annelie Laage
Submitted in partial fulfilment of the requirements for the degree MAGISTER COMMERCII in Taxation
in the Faculty of Economic and Management Sciences
University of Pretoria
Pretoria
Study leader: Mr.F. Opperman
September 2010
©© UUnniivveerrssiittyy ooff PPrreettoorriiaa

- i -
DEDICATION
To the four pillars of my life: my Father in Heaven, my husband and my parents. Without
you, my life would fall apart.
I am eternally grateful for all the blessings God has undeservedly graced me with...I have
lost count.
Paul, you are my everything. Thank you for your love, understanding, support, motivation
and unfailing belief in me.
Vicky, for all the countless hours you have invested in me; your time, your prayers, your
support, your advice, your ear and your love; thank you.
Dad, thank you for helping me keep things in perspective, teaching me the value of hard
work, putting mind over matter and especially for being my reserve parachute.
We did it!

- ii -
TABLE OF CONTENTS
DEDICATION ........................................................................................................................ i
LIST OF TABLES ................................................................................................................ v
LIST OF FIGURES ............................................................................................................. v
LIST OF ABBREVIATIONS ................................................................................................ vi
ABSTRACT ........................................................................................................................ vii
OPSOMMING ..................................................................................................................... ix
CHAPTER 1: INTRODUCTION............................................................................................ 1
1.1 Background ........................................................................................................... 1
1.2 Problem statement ................................................................................................ 3
1.3 Purpose statement ................................................................................................ 4
1.4 Research objectives .............................................................................................. 6
1.5 Importance and benefits of the proposed study ..................................................... 7
1.6 Delimitations .......................................................................................................... 9
1.7 Assumptions ........................................................................................................ 10
1.8 Definitions of key terms ....................................................................................... 10
CHAPTER 2: THE KYOTO PROTOCOL ........................................................................... 13
2.1 Background ......................................................................................................... 13
2.1.1 Emissions trading known as the ‘carbon market’ or the ‘cap-and-trade
system’ ......................................................................................................... 14
2.1.2 Clean development mechanism (CDM) ........................................................ 14
2.1.3 Joint implementation .................................................................................... 14
2.2 The Global perspective ........................................................................................ 14
2.3 The South African perspective ............................................................................. 16
2.4 Conclusion ........................................................................................................... 18

- iii -
CHAPTER 3: EVALUATION OF DIFFERENT ECONOMIC MECHANISMS IN
REACHING THE KYOTO GOALS ..................................................................................... 22
3.1 Introduction: the status of the Kyoto Protocol ...................................................... 22
3.2 Advantages of tax mechanisms as opposed to quantitative limitation policy ...... 24
3.3 The advantages of a tax system diametrically opposed to quantitative
policies ................................................................................................................ 26
3.4 Illustration of environmental responses to a taxes and credit system .................. 27
3.5 Conclusion ........................................................................................................... 28
CHAPTER 4: RECENT EXPERIENCE AND TRENDS IN ENVIRONMENTAL TAXES .... 30
4.1 Classifying environmental taxes and charges ...................................................... 30
4.1.1 Cost-covering charges ................................................................................. 30
4.1.2 Incentive taxes ............................................................................................. 31
4.1.3 Revenue-raising taxes .................................................................................. 31
4.2 Current tendencies and practices ........................................................................ 32
4.2.1 Cost-covering charges: user charges ........................................................... 32
4.2.2 Cost-covering charges: earmarked charges ................................................. 33
4.2.3 Optimal incentive taxes ................................................................................ 34
4.2.4 Instrumental incentive taxes ......................................................................... 34
4.2.5 Revenue-raising taxes .................................................................................. 35
4.3 Conclusion ........................................................................................................... 36
CHAPTER 5: CASE STUDY EXAMINING THE ENVIRONMENTAL TAX REGIMES
IN MEXICO, MALAYSIA AND THE UNITED STATES OF AMERICA ............................... 37
5.1 Introduction .......................................................................................................... 37
5.2 The role of environmental taxation in Mexico ...................................................... 37
5.2.1 Introduction ................................................................................................... 37
5.2.2 Environmental taxation in Mexico ................................................................. 38
5.2.3 Conclusion .................................................................................................... 40
5.3 The role of environmental taxation in Malaysia.................................................... 41
5.3.1 Introduction ................................................................................................... 41

- iv -
5.3.2 Environmental taxation in Malaysia .............................................................. 41
5.3.3 Conclusion .................................................................................................... 46
5.4 The role of environmental taxation in the United States (US) .............................. 48
5.4.1 Introduction ................................................................................................... 48
5.4.2 Environmental taxation in the USA ............................................................... 48
5.4.3 Conclusion .................................................................................................... 50
5.5 Conclusion ........................................................................................................... 50
CHAPTER 6: PROPOSED SOUTH AFRICAN ENVIRONMENTAL TAX SYSTEM ........... 52
6.1 Introduction .......................................................................................................... 52
6.2 South Africa’s current environmental tax system ................................................. 53
6.2.1 Land rehabilitation ........................................................................................ 53
6.2.2 Environmental capital expenditure allowances ............................................. 53
6.2.3 Environmental conservation and maintenance ............................................. 54
6.2.4 Land declared as a national park or nature reserve ..................................... 55
6.2.5 Plant and machinery used in the production of renewable energy ............... 55
6.2.6 Wear and tear rates on solar energy units.................................................... 56
6.2.7 Carbon dioxide emissions tax ....................................................................... 56
6.3 Proposed amendments to the current environmental tax system ........................ 57
6.3.1 Environmental capital expenditure allowances ............................................. 59
6.3.2 Wear and tear rates on solar energy units.................................................... 59
6.3.3 Carbon dioxide emissions tax ....................................................................... 60
6.3.4 Tax Concessions for investing in environment-friendly projects ................... 60
6.3.5 Carbon tax .................................................................................................... 60
6.4 Conclusion ........................................................................................................... 63
LIST OF REFERENCES .................................................................................................... 64

- v -
LIST OF TABLES
Table 5.1: Summary of Malaysian environmental taxation sections .................................. 42
Table 5.2: Summary of Malaysian environmental taxation sections relating to research and
development ..................................................................................................... 45
LIST OF FIGURES
Figure 3.1: Emission responses to tax and credit systems ................................................ 27
Figure 6.1: Comparison of the intensity of emissions ........................................................ 57
Figure 6.2: Illustration of the gap in emissions between emission scenarios ..................... 58
Figure 6.3: Average and marginal impact of various tax levels .......................................... 61

- vi -
LIST OF ABBREVIATIONS
Abbreviation Meaning
AUS $ Australian dollar
CDM clean development mechanism
CDP carbon disclosure project
CFC Chlorofluorocarbon
DEA Department of Environmental Affairs
EIA Energy Information Administration
EFR Environmental Fiscal Reform
ETR Ecological Tax Reform
ETS Emissions Trading Scheme
EU European Union
GDP gross domestic product
GHG greenhouse gases
IPCC Intergovernmental Panel on Climate Change
JI Joint Implementation
ITA Income Tax Act No 58 of 1962
LTMS long-term mitigation scenario
MDGs Millennium Development Goals
NERSA National Energy Regulator of South Africa
OECD Organisation of Economic Co-operation and
Development
SARS South African Revenue Service
UN United Nations
UNFCCC United Nations Framework Convention on
Climate Change
US United States (of America)
USD United States dollar

- vii -
ABSTRACT
A COMPARATIVE STUDY OF ENVIRONMENTAL TAXES IN THE SOUTH AFRICAN CONTEXT
by
ANNELIE LAAGE
STUDY LEADER : MR. F. OPPERMAN DEPARTMENT : TAXATION DEGREE : MAGISTER COMERCII (TAXATION)
The environment is in crisis, it has recently been reported that cars and trucks in the
United States of America emit 314 million metric tons of carbon dioxide annually. To put it
into perspective, that as much as would be released from burning all the coal in a freight
train 80 467 kilometres long – enough to circle the world, twice (Science News, 2008).
The world’s response to the environmental crisis is through the ratification of the Kyoto
Protocol. Currently, there are 190 parties (189 states and one regional economic
integration organisation) to the Kyoto Protocol, of which the developed nations that are
parties to the protocol account for 63.7% of global greenhouse gas emissions. The Kyoto
Protocol is, however, proving to be inefficient in curbing greenhouse gas emissions due to
the following reasons:
• there are currently no ramifications if agreed targets are not reached by member states;
• in its current form, the protocol only sets emission limits for the period ending 2012;
• the protocol subscribes mostly to quantitative measures as opposed to the introduction
of a tax system to penalise emission producers.
Through extensive research conducted as part of this study, it was shown that a tax
system is more efficient in ensuring a double dividend and achieving the Kyoto goals than
a quantitative system as currently promoted under the Kyoto Protocol.

- viii -
On the premise that a taxation system is preferable, this study sought to understand the
current trends in environmental taxes and combined the available research in a
comprehensive environmental tax matrix. The matrix of the various environmental taxes
clearly distinguished between the incentive or revenue-raising functions of a tax and the
main uses of the revenues. Each category was clearly illustrated through examples of its
application based on extensive research.
The study further sought to demonstrate the practical application of environmental tax
systems through an analysis of the environmental tax systems of Mexico, Malaysia and
the United States, or sections in their tax law, dealing specifically with environmental-
related tax matters.
Lastly, the research culminated in a review of the current environmental tax regime
followed in South Africa in terms of normal income tax ,and proposed various alternatives,
which can be considered for introduction by the South African Revenue Service.
Based on the literature reviewed the study concluded that a tax system is preferable to a
quantitative system in order to limit GHG emissions. The various environmental taxes were
investigated by taking into account an environmental tax matrix as well as experience
gained from other countries in order to support, amongst other recommendations, the
establishment of a carbon tax system in South Africa.

- ix -
OPSOMMING
‘’N VERGELYKENDE STUDIE VAN OMGEWINGSBELASTING IN DIE SUID-AFRIKAANSE KONTEKS
deur
ANNELIE LAAGE
STUDIELEIER : MNR. F. OPPERMAN DEPARTEMENT : BELASTING GRAAD : MAGISTER COMERCII (BELASTING)
Die omgewing is in ’n krisis, daar is onlangs berig dat voertuie in die Verenigde State van
Amerika jaarliks verantwoordelik is vir 314 miljoen metrieke ton koolstofdioksied-
besoedeling. Om dit in perspektief te plaas, dit is die koolstofdioksied wat vrygestel sou
word as ‘’n 80 467 kilometer vragtrein vol steenkool verbrand sou word. Hierdie trein sou
lank genoeg wees om twee maal om die aarde te strek (Science News, 2008).
Die wêreld se reaksie op die omgewingskrisis is deur die bekragtiging van die Kyoto-
protokol. Daar is tans 190 partye tot die protokol (189 lande en een ekonomiese
integrasie-organisasie). Sommige van die ontwikkelde lande wat lede van die protokol is
verantwoordelik vir 63.7% van wêreldwye kweekhuisgasbesoedeling.
Die Kyoto-protokol is egter nie in staat om kweekhuisgasbesoedeling teë te werk nie om
die volgende redes:
• daar is tans geen strafmaatreëls indien doelwitte deur deelnemende lande nie bereik
word nie;
• in sy huidige vorm stel die protokol slegs beperkings op besoedeling tot 2012;
• die protokol onderskryf meestal kwantitatiewe beginsels in teenstelling met die voorstel
van‘’n belastingstelsel wat die belastinglas op die bron van die besoedeling plaas.
Daar word aan die hand van die uitgebreide ondersoek, wat as deel van hierdie studie
onderneem is, getoon dat ’n belastingstelsel ’n doeltreffender manier is om‘’n dubbel-

- x -
dividend te verseker ter bereiking van die Kyotodoelwitte in teenstelling met die huidige
kwantitatiewe beginsels wat tans deur die protokol onderskryf word.
In die veronderstelling dat ’n omgewingsbelasting die voordeligste opsie is om te volg, bied
hierdie studie meer inligting oor die huidige tendense in omgewingsbelasting en kombineer
die beskikbare inligting in hierdie verband in ’n omgewingsbelasting-matriks. Die matriks
klassifiseer die verskillende soorte omgewings-belasting in die voordeel of inkomste-
genererende funksie van ’n belasting en die hoofgebruike van die inkomstes. Elke
kategorie word duidelik geïllustreer deur toegepaste voorbeelde wat gegrond is op
deeglike ondersoek.
Verder het die studie die volgende ondersoek: die praktiese toepassing van
omgewingbelastingstelsels deur ’n analise van die Mexikaanse, Maleise en Amerikaanse
omgewingsbelastingstelsels, of gedeeltes van hul belastingwette wat spesifiek verband
hou met omgewingsbelastingsake.
Laastens het die studie gekyk na die huidige belastingstelsel in Suid-Afrika in die lig van
omgewingsbelastingsake en stel alternatiewe voor vir die huidige belastingstelsel wat deur
die Suid-Afrikaanse Inkomstediens oorweeg kan word.
Die studie het bevind dat ’n belastingstelsel meer gunstig is as ’n kwantitatiewe stelsel ten
einde kweekhuisgasse te beperk. Die verskeie omgewingsbelasting opsies is ondersoek
deur die omgewingsbelasting-matriks sowel as ervaring van ander lande te bestudeer.
Hierdie studie het bevind dat, tesame met ander moontlike wysigings van die huidige Suid-
Afrikaanse belastingstelsel, ’n koolstof-belasting in die Suid-Afrikaanse konteks oorweeg
moet word.

- 1 -
CHAPTER 1
INTRODUCTION
1.1 BACKGROUND
Eskom, South Africa’s state-owned electricity provider, has recently come under fire
following its demand of three price increases of 45% per year to fund its power
station building programme. Its regulator ,the National Energy Regulator of South
Africa (Nersa), finally consented to three consecutive increases of around 25% each.
This will lead to an effective doubling of South Africa’s electricity price over three
years.
The question remains: will a unilateral increase in tariffs be the best way to go for the
South African economy as a whole and specifically, should other means of ensuring
the achievement of environmental goals not be investigated? Foreign investors are
dissuaded from investing in a country that is proving less and less competitive in
terms of labour cost, energy prices, political instability and unfavourable labour
practices.
There are many questions of great concern to the South African taxpayer such as:
should alternative methods of deriving much-needed income not be considered by
the fiscus? Should Eskom not strive to employ some out-of-the-box thinking to
ensure that the burden of a rate increase is borne more equitably? Should Eskom not
be called to task about pumping millions of tons of carbon dioxide into the
atmosphere on a daily basis because of South Africa’s archaic fossil fuel-intensive
energy generation?
The decisions made by the South African Government concerning environmental
taxes during this time of increased focus on global environmental issues are
therefore relevant and important.

- 2 -
There is a means by which much-needed revenue can be channelled to the fiscus in
an equitable manner while working towards solving South Africa’s present-day
ecological conundrum at the same time. The answer comes in the form of
environmental taxes.
Parry recently raised the debate in literature on the likely economic and social
impacts of different types of environmental taxes and he placed specific focus on
determining the effectiveness of these taxes to improve the environmental
externalities, investigating equity concerns as well as potential market distortion
caused by the environmental tax system in Scrimgeour, Oxley & Fatai, 2005:1439.
The Kyoto Protocol and more recently the UN Climate Talks in Copenhagen have
added force to the debate and revealed the need for empirical analysis to assist
policy-makers in making important decisions as supported by Pan and Lanza
(Scrimgeour, Oxley, & Fatai, 2005:1439).
The need for empirical analysis has also generated a vast amount of literature
relating to the study of economic and environmental issues in relation to the Kyoto
Protocol as well as the Copenhagen talks.
What these studies lack is to explore options of maximising society welfare while
simultaneously minimising greenhouse gas (GHG) emissions and the likely cost of
achieving such a feat. Although this was explored in more detail in the New Zealand
context (Scrimgeour et al., 2005), indicating the impact of alternative carbon, energy
and petroleum taxes on the New Zealand economy and the competitiveness of the
energy-intensive industy sector, no such comparative study has to date been
performed in the South African context.
The status of the Kyoto Protocol in South Africa as well as alternative means of
achieving environmental goals by comparing carbon credit trading (also referred to as
a quantitative system) and environmental taxes have also not been reviewed in
current literature.

- 3 -
Amundsen and Schob (1999:311) investigated the placement of the tax burden on
resource owners and the correlating effect thereof on the international distribution of
wealth. The study showed that the solution for small countries who do not co-ordinate
their national environmental policies is to impose a time-variant Pigovian tax to
ensure the change in international distribution of income while still resulting in Pareto
optimality. The authors did, however, not propose the best-suited type of tax and
again this study did not focus on the particular set of circumstances in South Africa.
This study also did not investigate the various types of environmental taxes by
looking at their classification in an attempt to understand the specific goal of the
various tax types.
In Sebitosi and Pillay (2008:2513), the South African environmental policy and power
sector was investigated in more detail with the authors painting a bleak picture of
South Africa’s future with continued envronmental degradation and intermittent power
supplies due to the country’s energy-intensive economy.
Sebitosi and Pillay (2008) do, however, not propose a solution to avoid such a
cynical outcome and do not explore the potential that environmental taxes hold in this
context.
1.2 PROBLEM STATEMENT
Despite at least two decades of various articles and books being published on the
topic of environmental reform, most studies in the field of environmental taxes have
focused on the theoretical implementation of environmental taxes and on the
environmental and tax burdens placed by authorities, mostly using the examples set
by the so-called eco-leaders being Denmark, the Netherlands, Norway and Sweden.
Sebitosi and Pillay (2008:2516) argue strongly that a critical factor that South Africa
can no longer afford to ignore is the prospect of tighter international environmental
regulations. This can come in various guises as shown by Ellis (2008) in terms of
‘food miles’ where African agricultural exports to Europe are quickly becoming a
target of debate. If South Africa envisions continuing trade with the rest of the global

- 4 -
community, the issue of carbon emissions primarily related to the exportation of such
products will become increasingly relevant.
Sebitosi and Pillay (2008:2516) predict that in future manufacturing with power from
untaxed GHG emission plants might be viewed as an industrial subsidy of local
production. South African competitiveness in the light of global subsidisation
protocols observed in international trade agreements would be adversely affected by
such a stance.
The potential that environmental taxes hold in a South African context has not been
investigated and is becoming increasingly important. Consequently, this study seeks
to firstly understand South Africa’s obligations in terms of the Kyoto Protocol in order
to establish the for environmental discussion in the context of environmental taxes.
The study will then investigate the various environmental tax regimes and provide a
clear picture of the current environmental taxes available worldwide based on an
established classification methodology. The practical application of these taxes will
then be investigated through a brief analysis of the environmental taxes applied in
Mexico, Malaysia and the United States (US). Lastly, the study will investigate the
current and potential environmental taxes, which could alleviate the financial burden
placed on regular South Africans while obtaining the added benefit of environmental
conservation and conforming to increasing international pressure placed on ‘going
green’ – the double dividend objective.
1.3 PURPOSE STATEMENT
The main purpose of this study is to understand the boundaries as set by the Kyoto
Protocol for South Africa to operate in. It is important to understand global trends in
analysing South Africa’s situation as this research will establish the measure of
importance being placed globally on achieving certain environmental goals.
There is much speculation currently in the media on whether a quantitative limitation
strategy (a so-called cap-and-trade system) or a taxing system would be more

- 5 -
effective in South Africa (Temkin, 2006:2). This study will seek to establish the most
beneficial system based on a review of available literature.
The various taxation alternatives are largely unknown, especially because South
Africa is still in its infancy in applying an environmental tax regime. Consequently, this
study will examine the current environmental tax trends by using a classification
matrix supported by the appropriate literature.
The interaction between the various taxes available under the matrix will then be
expanded on through an investigation into the green tax regimes of other countries.
The study will then seek to understand the current South African environmental tax
regime and propose amendments to the current tax system largely through the
introduction of carbon tax to achieve the double dividend in a South African context.
Van der Merwe (2010:22) remarks that ‘green taxes’ have an impact on the cost of
doing business. This, together with the drive to improve the global carbon footprint,
makes it a key business risk for businesses not to invest time and money to quantify
and reduce their carbon footprint.
South Africa has recently introduced a plastic bag levy with the aim of collecting
funds for a national recycling programme and has been partly successful in curbing
plastic bag use and waste. This levy has been placed squarely on the consumer.
From 1 October 2009 energy-hungry incandescent light bulbs became subject to an
environmental levy and from 1 September 2010 emissions taxes charged on newly
sold vehicles have become a reality. The tax burden is therefore being placed on the
consumer.
The message is clear: the consumer has a choice. If the consumer does not bring
his/her own bag to do grocery shopping, he/she would need to pay a levy for the
luxury of not recycling old bags. If the consumer wants the luxury of using a lightbulb
of choice, the consumer should be willing to pay a premium for exercising his/her
right to choose.

- 6 -
But what about electricity? The consumer can be more economical in his/her
electricity usage, however, the use of electricity in business and at home is a crucial
element of any developing country. There are very few alternatives available to the
consumer for other suppliers of electricity and as Bisseker states (2009:34) Eskom is
the main decision-maker of South Africa’s new electricity master plan, which leaves
little room for private sector involvement in the power generation field and also does
not allow for renewable energy plans.
1.4 RESEARCH OBJECTIVES
This study will be guided by the following research objectives:
• to understand the boundaries as set by the Kyoto Protocol and what South
Africa’s responsibilities are in terms of the protocol. It is important to understand
global trends in analysing South Africa’s situation as this research will establish
the measure of importance that is placed globally on achieving certain
environmental goals and the potential repercussions if these goals are not
achieved;
• to evaluate different economic mechanisms, which have been developed to reach
the Kyoto goals, including a critical analysis of a tax mechanism as opposed to a
quantitative limitation policy (cap-and-trade system). The difference between
these two systems will also be diagrammatically represented and the study will
indicate the preferred approach to ensure that double dividends are achieved.
Currently, two main schools of thought abound with some believing that a cap-
and-trade system is optimal for reaching environmental goals, whereas others
favour a tax system;
• to examine the current trends in environmental taxes by differentiating between
the various systems based on an accepted classification matrix;
• to analyse the environmental taxes imposed in Mexico, Malaysia and the United
States to indicate how these tax systems currently function and to clearly illustrate
the interaction between the various tax sections;

- 7 -
• to analyse South Africa’s current income tax regime with regard to environmental
taxes and to propose certain improvements in the environmental tax system,
which could be applied to the South African context.
1.5 IMPORTANCE AND BENEFITS OF THE PROPOSED STUDY
This study explores the knowledge gaps that exist currently in the academic world as
none of the studies to date have focused on South Africa’s context exclusively.
The study seeks to understand South Africa’s role in the global fight against GHG
emissions and what limitations (if any) the Kyoto Protocol place on South Africa.
There is much debate, especially in the media, on whether a cap-and-trade system
would be preferable to an environmental tax system. Tax and environmental
specialists disagree to a large extent on the preferred approach. The relative benefits
of each respective system will be investigated and through a diagrammatic
representation the two systems’ efficacy in dealing with ecological challenges will be
compared.
Once the study has indicated, through an analysis of available literature, what the
most suitable system is, the knowledge gaps of the options, which are available in
terms of environmental taxes, will be explored. The study will provide a matrix of
environmental taxes in general in order to serve as a classification system of the
various tax alternatives.
The theoretical knowledge will then be investigated through an analysis of the
practical application of environmental tax systems in three other countries in a bid to
understand the interaction of various taxes in a real-life scenario.
The final benefit of the study is to explain the current environmental taxes through an
examination of the current Income Tax Act No 58 of 1962 (ITA) sections dealing with
environmental taxes. Even among taxation specialists there appears to be some
confusion as to the tax allowances/incentives provided in terms of the ITA in the
South African context. Dermot Gaffney, head of indirect taxes at advisory and

- 8 -
auditing firm KPMG, was recently quoted in a newspaper article as stating that “in
South Africa there are no environmental taxes” (Pile, 2008:55). Gaffney did, however,
not take into effect the current tax allowances available in the ITA as well as the
environmental taxes imposed in terms of the Customs and Excise Act (1964). This
goes to illustrate the importance of expanding on these sections in order to decrease
the knowledge gap in the market on environmental tax matters.
The study will also provide some insight into potential section amendments and new
taxes, which might be introduced in due course.
The Kyoto Protocol and the recent UN talks in Copenhagen will be investigated in
more detail in the following chapter in order to put the South African situation in a
global context and to demonstrate South Africa’s agreed responsibilities in terms of
these global treaties.
This will be followed by a discussion of the economic mechanisms that were
introduced globally. These mechanisms were introduced to achieve environmental
reform and the study will illustrate, based on both a review of the available literature
as well as diagrammatical representation, the optimal alternative. Following from the
establishment of the optimal mechanism, the current ecological tax trends will be
explored first to set the scene for the various country applications.
Through the analysis of the tax regimes in a selected few countries, a South African
solution will be proposed after investigating the current income tax relief measures
currently available in terms of the ITA.
This study will be to the benefit of any individual that might seek to understand the
options available under an environmental tax regime instead of a unilateral increase
in rates.
Through investigating the benefits of an environmental tax regime, this study seeks to
fill the knowledge gap currently in literature as no previous study focused on the
unique South African perspective and current tax regime regarding environmental
taxes.

- 9 -
1.6 DELIMITATIONS
The proposed study has several delimitations related to the context, constructs and
theoretical perspectives of the study. Firstly, it will be limited to the South African
context with specific emphasis on the South African tax, ecological and economic
environment. As such, the study does not seek to explore alternatives applicable to
other countries or economies.
Secondly, the study will probably indicate that a carbon credit system is not the
optimal solution and therefore will not focus on the implementation of a carbon credit
system and will not investigate the economic, ecological or tax implications of such a
system in detail.
The study will not cover the analysis of existing taxes and excise duties that were not
imposed for environmental reasons, such as those to maintain stockpiles of fuel.
This study is limited to the analysis of environmental taxes in Mexico and Malaysia
due to both countries being extremely wealthy in natural resources and being
developing countries. Although potential tax systems in European Union (EU)
countries are investigated in broad terms, this study does not seek to specifically
focus on these countries as the particular economic situation of these countries differ
from that of a developing country. A brief investigation into the US tax environment is
provided due to the US’s ratification status of the Kyoto Protocol.
The primary objective of the study is a focus on environmental taxes in a normal
income tax context. Therefore the study will not focus on the environmental taxes
currently imposed under the Customs and Excise Act (1964), such as the customs
and excise levy on fuel, ad valorem excise duties on motor vehicles, air passenger
departure tax and environmental levies on plastic bags, electricity from non-
renewable sources and filament light bulbs.

- 10 -
1.7 ASSUMPTIONS
This study is based on the assumption that the environmental tax recommendations
investigated are the most appropriate in the South African context. Although the
study is not exhaustive in its analysis of these tax regimes, it is assumed that the
analysis provides a sound basis for potential tax regimes to be employed in South
Africa.
It is furthermore assumed that businesses would respond to the proposed
environmental taxes by employing sound business principles in order to strive to
alleviate their additional tax burden and seek more ecologically friendly means of
pursuing their business objectives.
In this manner, environmental taxes should not be seen as a deterrent for the growth
of a business but rather as an incentive to pursue cleaner, greener commodity
production.
1.8 DEFINITIONS OF KEY TERMS
This study also involves a number of key concepts, which had to be defined due to
the technical nature of the research. The key definitions are listed below.
Act means the Income Tax Act (58/1962).
Approved research company is defined by Ansari (2007:72) as an institute, including
a company licensed under Section 24 of the Malaysian Companies Act (1965).
Contract research and development company is defined by Ansari (2007:72) as a
company which provides research and development services in Malaysia only to a
company other than to a related company.
Environmental fiscal reform is defined by the Organisation of Economic Co-operation
and Development (OECD) in Speck & Datta, 2009:808 as “a range of taxation and

- 11 -
pricing measures which can raise fiscal revenues while furthering environmental
goals”.
Environmental treatment and recycling asset is defined in section 37B of the ITA as
any air, water, and solid waste treatment and recycling plant or pollution control and
monitoring equipment (as well as any improvement thereto) if the plant or equipment
is utilised in the taxpayer’s trade in an ancillary process to any process of
manufacture or similar process and is required by any South African law for purposes
of complying with measures that protect the environment.
Environmental waste disposal asset is defined in Section 37B of the ITA as any
water, air and solid waste disposal site, dam, dump, reservoir or other similar
structure or any improvement thereto if the structure is of a permanent nature, the
plant or equipment is utilised in the taxpayer’s trade in an ancillary process to any
process of manufacture or similar process and is required by any South African law
for purposes of complying with measures that protect the environment.
Global public goods is defined by Nordhaus (2005:2) as public goods whose
influences are felt globally as opposed to only in one country, town or nation. He
further explains that what make these economic issues unique is the fact that there
are only weak economic and political mechanisms to resolve these issues efficiently
and effectively. Examples of global public goods are climate change, the threat of
avian flu, the decline of many ocean fisheries and transanational terrorism.
Greenhouse gas is defined as carbon dioxide, methane, nitrous oxide,
hydroflourocarbons, perfluorocarbons and sulphur hexafluoride and it is widely held
that these gases increase the temperature of the Earth’s atmosphere.
Kyoto Protocol is defined by the United Nations Framework Convention on Climate
Change (UNFCCC) as an international agreement which sets binding targets for 37
industrialised countries and the European community for reducing GHG emissions.
The protocol was adopted in Kyoto, Japan on 11 December 1997 and came in force
on 16 February 2005 (UNFCCC, 2010).

- 12 -
Research and development companies is defined by Ansari (2007:72) as companies
which provide research and development in Malaysia to both related companies and
other companies.

- 13 -
CHAPTER 2
THE KYOTO PROTOCOL
2.1 BACKGROUND
The history of the Kyoto Protocol is described on the EIA website (2010). The
Intergovernmental Panel on Climate Change (IPCC) was established in 1988 to
assess the available information on climate change as it had been hypothesised over
a number of years that GHGs could cause an increase in the Earth’s temperature,
which may lead to changes in the global climate. The UN adopted a Framework
Convention on Climate Change (UNFCCC) in 1992 and the signatories agreed to
formulate programmes to mitigate climate change and developed countries agreed to
implement means of reducing emissions compared with their 1990 levels of
emissions.
In 1997, representatives from more than 160 countries met in Kyoto, Japan to
negotiate binding limits on greenhouse gas emissions for developed nations.
Following on this, the Kyoto Protocol was established, setting emission targets for
each of the participating developed countries.The targets were, for example, an 8%
reduction for the European Union, a 7% reduction for the US and an allowed
increase of 10% for Iceland. These targets, if accepted by participating countries,
would need to be reached by 2012.
The UNFCCC (2010) explains that the protocol recognises that developed countries
are principally responsible for the high GHG emissions, which are experienced
globally in the atmosphere and therefore it places a heavier burden on developed
countries under the auspices of “common but differentiated responsibilities”.
The treaty sets certain targets for countries, which have to be achieved through
national measures. The protocol offers an additional means for countries to meet
their targets by way of market-based mechanisms, which is described in more detail
below: These mechanisms are described in more detail below:

- 14 -
2.1.1 Emissions trading known as the ‘carbon market’ or the ‘cap-and-trade system’
The EIA website (2010) in its Energy Outlook 1998 states that there may be
165 metric tons of carbon permits available from the developed countries of the
former Soviet Union in 2010. This is because GHG emissions in 2010 for those
countries are expected to be 165 metric tons below the levels in 1990 due to the
economic decline that has occurred in the region since 1990. These carbon credits
can be traded on international markets; and procedures, rules and regulations for
trading these credits are to be agreed between member countries.
2.1.2 Clean development mechanism (CDM)
This mechanism is available to developed countries, which reduce developing
countries’ emissions; and credits can be earned by the developed countries for these
initiatives. Ferreira (2009:12) explains that companies, which cannot meet their Kyoto
targets by increasing their energy efficiency, can buy set-off certificates from other
projects (such as wind farms), which create carbon credits.
2.1.3 Joint implementation
This mechanism allows joint projects between developed countries where one
country can earn emission credits through the reduction of emissions in another
developed country.
Currently, there are 190 parties (189 states and one regional economic integration
organisation) to the Kyoto Protocol, of which the developed nations that are parties to
the protocol account for 63.7% of global GHG emissions.
2.2 THE GLOBAL PERSPECTIVE
Kahn and Franceschi (2006:778) are of the opinion that the Kyoto Protocol
represents an initial step for working towards a solution for global climate change.

- 15 -
The Kyoto Protocol on its own will not lead to the decline in the atmospheric
concentrations of GHGs mostly due to the fact that emissions of developing countries
are not dealt with stringently in the protocol.
According to the IPCC Synthesis report (Kahn and Franceschi, 2006:779), the
stabilisation of concentrations of carbon dioxide needs to be reduced to the levels
experienced in 1990 within several decades in order to limit the temperature change
to 2 degrees Celcius and a sea level rise of 0.3 metres by 2100. Khan and
Franceschi (2006) are of the opinion that the Kyoto Protocol alone cannot achieve
this and recommend the implementation of an international system based on per unit
carbon taxes.
The first reason for their dire outlook is due to the fact that, in terms of the protocol,
Annex I countries (OECD countries and formerly communist Europe) are required to
reduce their emissions to 6% below the 1990 levels by 2010. No limits are, however,
placed on Annex II countries (developing countries such as China, India, Brazil and
Mexico); and it has been projected that, if these four countries embarked on a
development path that results in the same per capita emissions as the United States,
the emissions of these four countries alone would exceed the wordwide emissions
recorded in 2000.
The second reason why Khan and Franceschi (2006) assert that the Kyoto Protocol
in itself cannot achieve the environmental goals is that there are no limits set beyond
the proposed limits of the protocol. For an emission reduction protocol to be
succesful, the increases in emissions from the developing countries have to be
slowed down and the decrease in emissions by developed countries has to be
increased beyond the levels stipulated by the Kyoto Protocol.
Mason (2009:8) reports that the US, which has never ratified the Kyoto Protocol,
pledged a 17% reduction of its GHG emissions by 2020 (against a 2006 baseline) at
the UN climate change meeting in Copenhagen, with China committing itself to cut
the output of carbon per unit of gross domestic product by 40 - 45% by 2020,
compared with levels experienced in 2005 (Business Day, 2009a:7). This is quite an
ambitious target for China, especially when it is considered that coal accounts for

- 16 -
69% of primary energy in China, which is 42% higher than the world’s average
(Sunday Independent, 2009:8). Due to the fact that the US uses a 2006 baseline to
determine its projected reduction, compared with a 1990 baseline (used in the Kyoto
Protocol), the US has only committed itself to a 3% reduction against a 1990
baseline.
The US’s pledge also falls far short of India, which recently committed itself to
reducing its carbon emissions by 20 - 25% by 2020. Measures to achieve this
proposed reduction include a mandatory fuel efficiency standard for all vehicles by
2011 and a building code to ensure that at least 50% of coal plants built use clean-
coal technology where the carbon emissions are trapped underground as opposed to
being dispersed into the atmosphere (Business Day., 2009b:8).
The US’s failings are, however, nothing compared with the failings of Canada, whose
government announced in 2006 that it was abandoning its targets to cut GHGs under
the Kyoto Protocol altogether.
Canada is the only country which had ratified the treaty and then abandoned its
targets. As the treaty does not have any legal force but relies solely on the goodwill of
the member countries there have been no repercussions to Canada for breaking its
ratification other than potentially accepting punitive future obligations if its targets are
not achieved (Monbiot, 2009:17). Canada initially commited itself to a reduction in
GHG emissions of 6% between 1990 and 2012, instead their emissions rose by 26%.
2.3 THE SOUTH AFRICAN PERSPECTIVE
South Africa is classified as an Annex II country and as such, no limits are placed on
South African GHG emissions. South Africa ratified the UN Framework Convention
on Climate Change and its Kyoto Protocol and may continue without carbon caps
until 2012.
Estimations are that South Africa’s GHG emissions rank among the top 20
worldwide, the country’s estimated contribution to global emissions is reported to be

- 17 -
1.8% and South Africa is responsible for 42% of Africa’s emissions, largely due to the
use of fossil fuels in the generation of energy. Government’s intentions have been
clear in promising that businesses will be assisted to reduce emissions using tax
incentives and savings (Smit, 2009:47). Smit (2009:47) also notes that globally there
is a movement towards the exportation of cross-border carbon adjustments. What
this means is that carbon-taxing countries (in their attempt to conform to the Kyoto
protocol) can levy importation fees on goods manufactured in countries with no taxes
on carbon.
Williams (2009:50) points out that South Africa requires legislative changes in order
to ensure that business and the government subscribe to the envisioned purpose of
the Kyoto Protocol. This is required as South African industry’s perspective is that it
considers GDP growth impossible wihout a correlating increase in higher GHG
emissions due to an increase in energy consumption.
South Africa is lagging behind in terms of its participation in the CDP, where leading
companies do not take the trouble to respond to requests to take part in disclosing
their carbon emissions as is envisaged by the Kyoto Protocol, according to Williams
(2009:51). In his article, Williams reports his discussion with Johann Scholtz, a
partner of Webber Wentzel, who is of the opinion that the low respondence rate is
due to the fact that there are no legal enforcable regulations for the disclosure of
GHG emissions currently in South Africa. Johann Scholtz was of the opinion that
legislative changes forcing disclosure will, however, come into effect in the near
future, stating that by 2012 Johann Scholtz envisions disclosure to be mandatory.
South Africa is also lagging behind with the registration of projects under the CDM.
Ferreira (2009:12) notes that although European-based companies, which are
obliged by their governments to meet carbon emission reduction targets in terms of
the Kyoto Protocol, seek to invest in developing countries such as South Africa to
improve their carbon profiles, South Africa has been slow to cash in. Less than 20
South African projects are registered with the CDM as providers of certified carbon
set-off credits with only three having issued certificates to date. Davenport (2009:37)
estimates the value of the global carbon market to have increased from USD 30

- 18 -
billion in 2006 to an astounding USD 126 billion in 2008. South Africa’s share in this
market has stayed constant at only 3%.
At the recent Copenhagen summit, South Africa pledged a reduction of its carbon
emissions growth by 42% compared to current levels by 2025, on condition of the
financial and technological support of developed countries (Mundy, 2009:1).
Salgado (2009:20) points out that amid the praise that South Africa received for its
aggressive target, South Africa is also currently building two new coal-fired power
stations, an oil refinery and considers building a new coal-to-liquids plant.
Salgado (2009) states that the targets set are exactly as modelled in the Long-term
mitigation scenario (LTMS) which calculated South Africa’s options with regard to
emission reduction strategies.
A proposed 42% reduction appears consistent with the “use the market” line, which
supports the stimulation of the use of new technologies and sustainable behaviours
by imposing certain incentives and environmental taxes. The key driver in the LTMS
is the need to impose carbon tax, initially at a level of R140 per ton and then
increasing to R750 per ton by 2050. Other drivers include providing incentives for
renewable electricity generation, biofuels and solar water heaters.
The message communicated by government is clear: Minister Buyelwa Sonjica has
indicated that the DEA will release a climate change Green Paper for public comment
in December 2010, while the White Paper is expected in April 2011.
2.4 CONCLUSION
Africa stands to lose most from climate change resulting from unchecked GHG
emissions. At the Copenhagen summit held in December 2009, delegates were
informed that, among other consequences, Africa faced up to 250 million people
being exposed to water stress due to climate change with a 50% decrease in
agricultural yields by 2020 if decisive action is not taken to enforce GHG reduction
(Business Day, 2009c:5).

- 19 -
With China’s pledge to reduce its GHG emissions by 40 - 45% and the US slowly
coming aboard by pledging a modest effective reduction of 3%, international
pressure is mounting. The Kyoto Protocol still provides the only mechansim to force
rich country signatories to cut emissions.
South Africa has pledged its commitment to the reduction of GHG emissions by 42%
by 2025. Environmental taxes and incentives are a crucial element of the modelling
done in the LTMS, which was used as a basis to arrive at the 42% target. As Joubert
(2009:5) explains, the outcome of the the Copenhagen summit has been the
Copenhagen Accord, which was agreed to by the 192 signatory countries of the
UNFCCC. The accord postpones the signing of a strong climate law until the next
summit which is to be held in Mexico in December 2010. The accord does, however,
impose USD 30 billion from 2010 to 2012 to be provided of which the main
contributors are the European Union (USD 10.6 billion), Japan (USD 11 billion) and
the US (USD 3.6 billion).
The Kyoto Protocol does not prescribe firm regulations to the global community or
South Africa with regard to reduction of GHGs and the protocol does not make
provision for disciplinary action if agreed targets are not reached. Furthermore, the
protocol only makes provision for targets for the period ending 2012. It is believed
that firm, enforcable targets will be set at the Mexico summit and as a consequence
countries are gearing towards firm commitments in respect of GHG emissions
globally.
Although the Kyoto Protocol is not believed to have much force, developed and
developing countries are, however, not only bound to environmental targets by the
Kyoto Protocol and the accord as agreed to at the Copenhagen summit. According
to Speck and Datta (2009:806-810), the concept of environmental fiscal and taxation
reform has been topical for over 15 years in Europe and various European countries
have successfully implemented such reforms. Speck and Datta (2009) argue that the
reasons for implementation may differ between developing countries (such as South
Africa) and developed countries.

- 20 -
If one first investigates the reasons for implementation in developing countries, one
needs to take cognisance of major pillars of sustainable development as determined
at the 1992 Earth Summit in Rio de Janeiro. These pillars are economic,
environmental and social objectives and were reaffirmed at the World Summit on
Sustainable Development held in Johannesburg in 2002 as well as through the
Millennium Declaration and Millennium Development Goals, in which member nations
committed themselves to halving poverty by 2015. One of the major challenges in
achieving these goals was identified as being the mobilisation of domestic resources.
In this regard, it is quite clear that the revenue-generating effect of market-based
instruments could be used to create additional financial resources for developing
countries to alleviate poverty.
The World Bank (2005:iii) recently reaffirmed the Millennium Development Goals as
follows: ”To help achieve the MDGs, developing country governments need to raise
revenues to invest in schools, healthcare, infrastructure and the
environment...[Environmental Fiscal Reform] (EFR) can play an important role in this
regard, helping countries raise revenues, while creating incentives that generate
environmental benefits and support poverty reduction efforts.”
Although poverty reduction is one of the major goals determined by the Millennium
Declaration, solving other major challenges faced by developing countries might
solve poverty as an added benefit. So, for example, government spending in
environmental infrastructure (such as water supply or sanitation) would improve the
poverty situation as the poor are mostly affected by environmental problems.
For developed countries on the other hand, the reasons for implementation of
Ecological Tax Reform (ETR) is to reform the national fiscal system by moving away
from conventional taxes whereby ‘good’ behaviour, such as labour taxes, is taxed to
taxes on ‘bad’ behaviour such as environmental pollution. By giving these very clear
price signals, it is hoped that the bahavious of consumers and producers would be
influenced and ultimately changed. Another reason for implementation would be the
distribution of the tax burden on a fairer basis from a sustainable development and
envirnomental perspective. It is believed that a reduction of the tax burden on labour,
for example, will lead to an increase in employment thereby alleviating

- 21 -
unemployment as high labour cost is seen as one of the main reasons for
unemployment in Europe (Speck & Datta, 2009:809).
It is thus clear that the Kyoto Protocol sets certain standards that need to be
achieved by participating countries in terms of GHG emissions. In the next chapter,
this study seeks to understand the various economic mechanisms that are available
in reaching the Kyoto goals by investigating tax mechanisms as opposed to
quantitative mechanisms to achieve the Kyoto goals.

- 22 -
CHAPTER 3
EVALUATION OF DIFFERENT ECONOMIC MECHANISMS IN REACHING THE KYOTO GOALS
3
3.1 INTRODUCTION: THE STATUS OF THE KYOTO PROTOCOL
Nordhaus (2005:2) notes that the institutional framework of the Kyoto Protocol has
had a considerable effect on the EU’s Emissions Trading Scheme (ETS), which
covers almost half of Europe’s carbon dioxide emissions. The protocol covers 30% of
global emissions (without any enforcement provisions), whereas the enforceable ETS
covers only 8% of global emissions. As the protocol’s set targets expire in 2012,
countries are starting to consider alternative policies and approaches especially in
the light of increased global pressure.
Nordhaus (2005:5) argues that there are currently only two efficient methods of
managing the risks associated with economic public goods, in this instance global
warming. These methods are:
• Quantitative limitation – this is the limitation method currently advocated by the
Kyoto Protocol and is therefore an agreement that limits emissions by different
countries.
• Price or tax mechanisms – this signifies the usage of prices, tariffs or fees to
harmonize prices and co-ordinate policies globally.
The price or tax mechanisms are widely viewed as the most effective means of
reaching environmental objectives. Bithas (2006:159-161) supports the view of
Nordhaus, who disputes claims made by Bazin, Ballet and Touahri (2004:129-134)
that environmental taxes stimulate less environmentally friendly behaviours whereby
a mere ‘sin tax’ is paid on the environmental damage caused. It is
Bazin et al. (2004:129-134) contention that this could induce environmental

- 23 -
degradation and therefore they call for a quantitative limitation policy rather than a
price or tax mechanism policy to reduce global warming.
Bithas (2006:160) contends that, through the use of the “polluter pays” principle
(where the polluter pays for the damage caused to the detriment of other members of
society) the optimisation of the allocation of social resources (including environmental
resources) is attained.
Bithas (2006:161) continues to argue that although standards can be adopted in line
with the quantitative limitation method, the adoption of standards would not limit
environmental welfare thievery as no fine is associated with the contravention of the
set standards.
Beder (1996:51-63) contends that quantitative limitation can be used to force the
polluter to take note of the costs of its environmental thievery, but that economists
are opposed to this method and favour the much harsher method of allowing price
mechanisms in the market to enforce the environmental policies.
As this paper seeks to provide further guidance on the ideal mechanisms that can be
used to limit environmental degradation it is important to understand the benefits of a
price approach versus a quantity approach as explained below and supported by
Nordhaus (2005:12-22).

- 24 -
3.2 ADVANTAGES OF A TAX MECHANISM AS OPPOSED TO QUANTITATIVE LIMITATION POLICY
The following are the advantages of a price mechanism policy, which have been
mostly overlooked by policy-makers with regard to global warming environmental
policy formulation as opposed to a quantitative limitation policy as confirmed by
Nordhaus (2005:12-22):
• Quantitative policies such as the Kyoto Protocol do not have a clear economic
objective, which would balance the costs and benefits of GHG reductions and
ensure that well-formulated economic objectives are met.
Tax mechanisms have identifiable goals, which can be attained and demonstrated
through the use of modelling.
• Quantitative policies tend to use a baseline approach (the Kyoto Protocol, for
example, uses a baseline of emissions recorded in 1990). This does not include
other dynamic variables such as growing economies, technological change and
different economic growth for different countries. The Kyoto Protocol based its
projections on historical data, which penalises countries which are rapidly growing
(such as Korea) and provides an advantage to countries with high 1990 baselines
where economical growth has slowed in the intermittent period (such as Ukraine).
Tax mechanisms use a baseline of zero and all countries can be measured
against a set standard, instead of different baselines being applied to different
countries. Countries would therefore also not be advantaged or disadvantaged by
past performance or previous levels of emissions.
• Studies undertaken have shown that price-type regulation is more efficient, due to
the structure of the uncertainties where the marginal costs of emissions
reductions are highly sensitive while the marginal benefits of emissions are largely
invariant to the current level of emission reductions (Hoel & Karp, 2001:91-114).
• Tax mechanisms offer a ‘double burden’ of environmental taxes. If, for example,
carbon taxes are imposed and rebated through taxes then the overall loss from
taxation will remain unchanged. If restraints are imposed under a quantitative

- 25 -
policy, no such double burden will be imposed and therefore an increase in prices
will not be set off against the potential rebates.
• A quantitative policy is largely seen as more susceptible to corruption than tax
mechanisms. One of the outflows of a quantitative approach is that it creates an
emissions trading system where tradeable emissions permits are allocated to
different countries.
The limiting of emissions creates a scarcity where the value of the countries who
own permits will rise in line with the economic principle of supply and demand. A
case in point is Russia, which owns tens of billions of dollars of tradeable
emission permits, currently held in state hands, however, there are reports that
inhabitants are seeking ways to ‘privatise’ the owning of these permits.
• A price approach gives less room for corruption as there are no permits
transferred and as such, these permits cannot be sold for purposes other than to
benefit the environment.
• A quantitative policy is also limited in the fact that there is a great need for
transparency and accurate measurement of emissions. If the company selling its
emissions permits did not measure the actual emissions reliably (therefore
overstating the emissions reduction) and the buyer uses the emissions certificates
to offset GHG emissions, there is a risk that the buyer would effectively increase
emissions unknowingly.
The need for independent verification is apparent, and seen in the light of the
recent lack of independent monitoring evidenced by the accounting scandals
experienced in the US the risk of falsification of information is very real.
• Quantitative policies do not take cognisance of the potential disparities already in
place where, for example, some countries in Europe have higher carbon taxes. A
price approach would accurately eliminate the disparities currently facing global
trade by ensuring that a consistent pricing approach is applied.
- 26 -
3.3 THE ADVANTAGES OF A TAX SYSTEMS DIAMATIGRALLY OPPOSED TO QUANTITATIVE POLICIES
Kahn and Franceschi (2006:781) support the view of Nordhaus that a tax or pricing
system is the more optimal solution and introduced the following four significant
advantages in comparison with a quantitative policy:
• a tax system offers a continuous incentive to reduce emissions even if the tax
remains constant;
• a tax system functions as a greater incentive for technological innovation in
emissions reduction technologies and therefore stimulates a multi-level solution;
• a tax system offers the small polluters (such as households) an easier inclusion in
the tax reform regime through the use of incentive systems;
• a tax system offers a greater likelihood of developing countries (currently
excluded from the Kyoto Protocol) participating in environmental reform.
Command and control systems (based on the principles of quantitative policies) tend
to exacerbate the costs of controlling emissions due to the fact that they do not
provide options for reducing emissions.
On the other hand, tax mechanisms may make it costly for polluters to emit GHGs,
but these systems leave them free to choose the most cost-efficient method of
reducing pollution.
Creating a never-ending incentive to reduce emissions is an important advantage of
a tax system as opposed to a cap-and-trade system. This is due to the fact that
technological innovations resulting in a decrease in the cost associated with pollution
create very different results for a tax system when compared with a quantitative
system as illustrated through the following diagrams:
- 27 -
3.4 ILLUSTRATION OF ENVIRONMENTAL RESPONSES TO A TAXES AND CREDIT SYSTEM
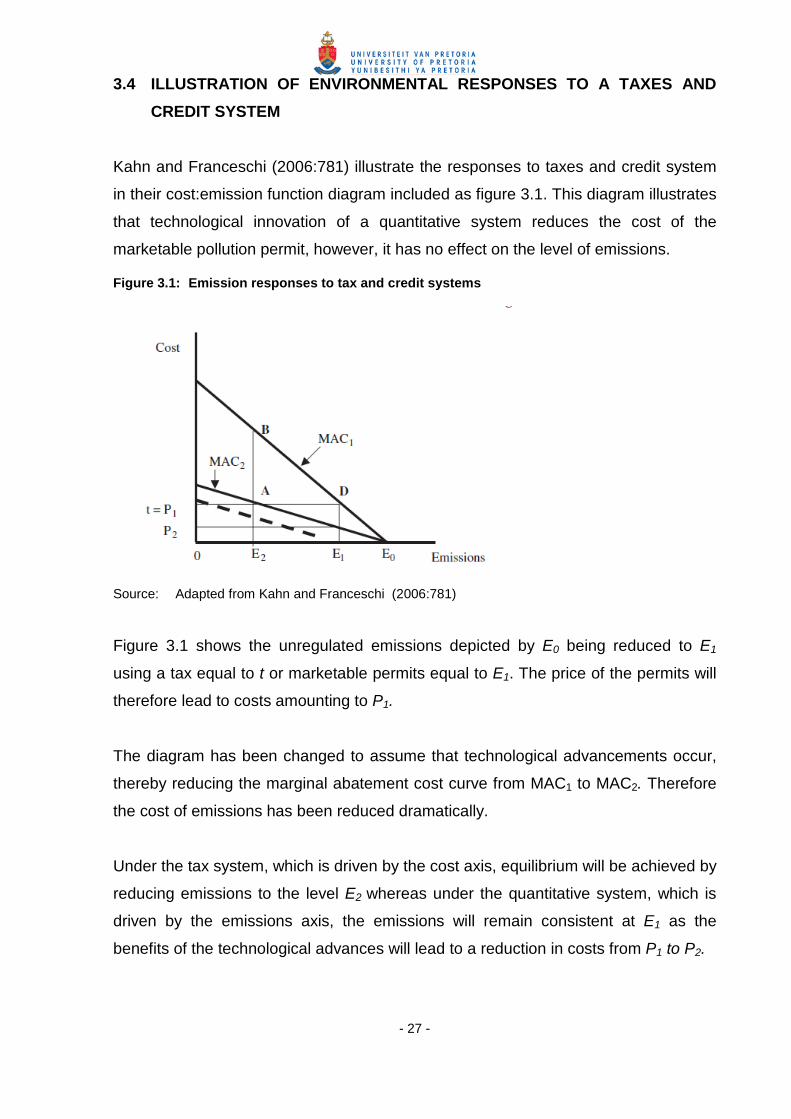
Kahn and Franceschi (2006:781) illustrate the responses to taxes and credit system
in their cost:emission function diagram included as figure 3.1. This diagram illustrates
that technological innovation of a quantitative system reduces the cost of the
marketable pollution permit, however, it has no effect on the level of emissions.
Figure 3.1: Emission responses to tax and credit systems
Source: Adapted from Kahn and Franceschi (2006:781)
Figure 3.1 shows the unregulated emissions depicted by E0 being reduced to E1
using a tax equal to t or marketable permits equal to E1. The price of the permits will
therefore lead to costs amounting to P1.
The diagram has been changed to assume that technological advancements occur,
thereby reducing the marginal abatement cost curve from MAC1 to MAC2. Therefore
the cost of emissions has been reduced dramatically.
Under the tax system, which is driven by the cost axis, equilibrium will be achieved by
reducing emissions to the level E2 whereas under the quantitative system, which is
driven by the emissions axis, the emissions will remain consistent at E1 as the
benefits of the technological advances will lead to a reduction in costs from P1 to P2.

- 28 -
If the advancement in technology leads to lower costs associated with the same
levels of emissions, the only option through which emissions will be reduced is
through the tax system. If, however, technology is invented to reduce the levels of
emissions itself (as illustrated by the broken line) emissions will decrease under a
quantitative system, however, not as much as it would under a tax system.
Although technological innovation leads to cost savings under the tax and
quantitative systems, a greater cost saving is achieved through the use of the tax
system. These cost savings can then be used to reinvest in additional technological
advancements in order to stimulate research and development initiatives in cost- and
emission-saving technologies.
3.5 CONCLUSION
In arriving at a conclusion on the best mechanism to achieve the Kyoto goals, the
following important points have crystallised through the review of the available
literature:
1) The Kyoto Protocol, whether it is ratified or unratified, will not significantly slow
down global warming. This is due to the fact that it does not encourage
emissions reductions for developing countries and it makes no provision for
reducing emissions for developed countries below 94% of their 1990 levels.
2) A tax-based system has the potential for providing incentives for reductions in
emissions that are needed, giving developing countries an incentive to
constrain the growth of emissions without placing a limit on emissions in
absolute terms.
A tax-based system provides developed nations with an incentive to continue
to reduce emissions in the future. Furthermore, the advantages of a tax-based
system greatly outweigh the advantages of a quantitative system as detailed
by the discussion above on the advantages of a tax mechanism as opposed to
quantitative limitation policies.
3) As diagrammatically presented, a tax-based system is the only system
providing real emission reduction benefits, which are linked closely to
technological research and development advances. These advances which

- 29 -
will eventually lead to the perpetual benefit of emission reduction as well as
cost saving for polluters.
A study of the available literature proved that a tax-based system is the most efficient
manner to provide much-needed benefits associated with emissions reductions.
The contention that a tax-based system is preferable to a quantitative system (cap-
and-trade system) was substantiated.
The next chapter investigates the current trends in the environmental tax
environment in an attempt to understand which tax mechanisms are currently in use
and are available to be tailored to the South African context.

- 30 -
CHAPTER 4
RECENT EXPERIENCE AND TRENDS IN ENVIRONMENTAL TAXES
Ekins (1999:39) points out that the use of environmental taxes and charges in OECD
countries increased by over 50% between 1987 and 1994. Relative to overall
taxation, revenues generated through the levying of environmental taxes remain
small, however, they comprise a rising proportion in most European countries.
Several European countries either have undertaken, or are considering, systematic
shifts in taxes away from labour towards the use of environmental resources.
4
4.1 CLASSIFYING ENVIRONMENTAL TAXES AND CHARGES
Ekins (1999:42-43) provided the following classification system to discern between
the various environmental taxes and charges. This classification system is based on
the distinction between the incentive and revenue-raising functions of a tax and
between the main uses to which the revenues can be put which are described in
more detail below:
4.1.1 Cost-covering charges
Regulating emissions to land or water costs money and in accordance with the
‘polluter pays’ principle it seemed appropriate that the regulation should be paid by
the ones that are being regulated. Consequently, the cost-covering charge basis for
accounting for environmental taxes was the earliest method of tax that arose from the
implementation of the environmental policies. Under this method, the entities making
use of the environment also contribute to the costs of monitoring and controlling that
use.
Cost-covering charges can take the form of two distinguishable types:
• user charges - where the charge is being paid for a specific environmental
service, for example, treatment of waste-water charges;

- 31 -
• earmarked charges - where the revenue from the charge is spent on related
environmental services but is not directly linked to a specific service provided to
the taxpayer. An example of this type of cost-covering charge is a land
remediation charge.
The quantum of the charge is determined by the service it is intended to deliver.
4.1.2 Incentive taxes
An environmental tax can also purely have the purpose of changing an
environmental harming behaviour, in which case its sole purpose is not to raise
revenue but to serve as a behaviour-changing incentive.
The level of the incentive tax can be determined by two methods:
• the optimal approach - where the marginal damage cost as well as the marginal
benefit (therefore the cost of damage and benefit per unit of cause of damage) is
determinable, then the level of tax would be optimal at the level where the
marginal benefit and the marginal cost are equal;
• the instrumental approach - where the numbers are too uncertain and the
marginal damage cost cannot be determined, an incentive tax can be used with
other mechanisms to achieve environmental objectives according to other criteria
such as environmental sustainability criteria.
4.1.3 Revenue-raising taxes
Environmental taxes that are intended not only to change behaviour but also to yield
revenues over and above those required for restitution of the environmental damage
caused are termed revenue-raising taxes. Governments generally use these tax
forms to shift tax away from fiscal requirements such as high marginal rates of
income tax.
- 32 -
These three types of taxes should not be seen as being mutually exclusive, as a
revenue-raising charge may have a cost-covering benefit as well; however, there is a
two-fold reason for classifying environmental charges in this fashion. This
classification method clarifies the main objective of a tax, which may not be
consistent for the various categories, and the intention behind the tax can be more
clearly identified with the relevant effect on determining the desired level of revenue
to be generated.
It is therefore important that the objective of the tax is determined in advance
according to this classification matrix in order to determine the choice of what is to be
taxed as well as the level of taxation.
This study will now focus in greater detail on the current trends and practices
followed specifically in the European Union.
4.2 CURRENT TENDENCIES AND PRACTICES
The current tendencies and practices are discussed in more detail below, which
provide a summary of the comprehensive database of environmental taxes and
charges in the European Union as well as in Norway and Switzerland as detailed in
Ekins (1999:45-52).
The intention of providing this summary is to give the clearest example of a particular
tax or charge currently applied in the European Union, Norway and Sweden based
on the classification method as provided above:
4.2.1 Cost-covering charges: user charges
The following environmental tax mechanisms are currently being applied:
• Waste-water charges are imposed by most OECD countries for the treatment and
disposal of sewage and/or other water-carried effluents. Charges for sewage are
mostly based on water usage, whereas the charges on other water-carried
effluents are calculated with reference to actual measurements of pollution.

- 33 -
• Waste charges are charged by almost all of the OECD countries to cover the
costs of the collection and disposal of waste. The charge on households is mostly
not related to the volume of waste and therefore does not have an incentive
effect. Except for instances where companies dispose of their own waste in landfill
sites, the charging of the fees based on quantity is more common.
• Water supply charges are in place in Denmark and the United Kingdom in order to
maintain an adequate water supply throughout the year.
4.2.2 Cost-covering charges: earmarked charges
The following environmental tax mechanisms are currently being applied:
• Belgium and the Netherlands levies surplus manure charges based on the
phosphorus and/or nitrogen levels in excess of acceptable minimum levels per
hectare.
• Emission charges: France’s charges on polluting atmospheric emissions were
introduced in 1985. Revenues are spent on the prevention of air pollution as well
as monitoring and control.
• Aircraft noise tax has been imposed by various countries including Belgium,
France, Germany and Japan and is imposed as a charge on aircraft noise. These
charges are then again used for noise abatement projects.
• Batteries tax has been imposed in Denmark and Sweden and take the form of a
levy charged on each battery sold. The revenues are then used to fund the
recycling and recovery of old batteries and in Sweden they are used to contribute
to the Swedish government’s planned lead and mercury phase-out plan.
• A landfill charge, such as the one Germany seeks to impose at rates higher than
in the United Kingdom, is intended to reduce the quantity of waste going into
landfill and is to be charged as different rates for inert, non-hazardous and
hazardous waste. This proposed charge is intended to raise the cost of disposal
to reflect the scarcity of landfill space in Germany as well as to conserve the
environment.

- 34 -
4.2.3 Optimal incentive taxes
The following environmental tax mechanisms are currently being applied:
• Landfill tax as imposed in the United Kingdom in 1996 is determined at different
rates depending on whether the waste is ‘active’ waste or ‘inert’ waste. The
charge is payable by operators of landfill sites, who may pay up to 20% of their
taxes to approved environmental trusts, which have the purpose of performing
land remediation. The remaining taxes are used to reduce employers’ national
insurance contributions.
4.2.4 Instrumental incentive taxes
The following environmental tax mechanisms are currently being applied:
• Nitrogen oxide (NOx) tax as utilised in Sweden was introduced in 1992. This tax is
payable by a small group of large producers of heat and power on a plant’s
emissions. Revenues generated from these plants are recycled to each charge-
paying plant according to the proportion of the group’s energy that the plant
created. The plants therefore seek to minimise their NOx output whereas they
seek to increase their power output. Emissions from the plants per unit of energy
output have fallen by 60% from the 1990s level.
• Waste tax as implemented in Denmark was introduced as early as 1986 and
differentiates between waste for landfill as opposed to incineration. This tax seeks
to support Denmark’s waste action plan, which strives to encourage the reduction
in landfills through the use of recycling, reuse and waste reduction. These targets
were set in order to achieve Denmark’s vision of sustainable development. These
revenues go into the state budget and as a result are used to decrease direct
taxation.
• Waste tax as implemented by the Netherlands was introduced in 1995 and is
calculated as a charge on combustible waste.
• Unleaded petrol tax differential is applied by various countries which form part of
the OECD and which supply leaded as well as unleaded petrol. A different tax
differential is applied to leaded petrol as opposed to unleaded petrol. Various

- 35 -
OECD countries also levy a different tax differential on the sale of environmental
considerations such as fuel efficiency or emission standards.
• Product taxes are levied by a number of OECD countries on a wide range of
different products such as pesticides, beverage containers, plastic bags and
packaging. As this is an incentive-based tax where consumers are encouraged to
use a more environmentally friendly available alternative, the objective with
imposing this tax is to reduce the taxes as far as possible by virtue of consumers
choosing to spend more on environmentally friendly substitutes.
• Minerals tax is levied by Denmark in the form of an excise duty on the extraction
and export of sand, gravel and various other minerals.
4.2.5 Revenue-raising taxes
The following environmental tax mechanisms are currently being applied:
• Fuel tax has two applications in the Netherlands. Firstly a general fuel tax was
introduced in 1992 and secondly, the small-energy user tax was introduced in
1996. This tax is based on the carbon and energy content of different fuels with
lower rates for energy-intensive industries.
• Road fuel duty as imposed in the United Kingdom was introduced in 1993
whereby road fuel was increased by 5% per annum in real terms and in 1997 this
was increased to 6%.
• Uranium taxes are charged in the Netherlands and have the effect that nuclear
power stations will bear the same taxes as those that generate electricity from
fossil fuels.
• CFC taxes as charged in Denmark and in the United States seek to tax ozone-
depleting chemicals including CFCs.
• Groundwater extraction charges as imposed in the Netherlands have been levied
since 1983 and there are separate rates for water companies and for other large
companies.
• Traffic congestion charges as imposed in Italy are charged to road users
according to the daily road congestion conditions. Alternatively, road users can be
charged for entering an urban area as is the case in some cities in Norway.

- 36 -
4.3 CONCLUSION
In the South African context, it would seem to be appropriate that the regulator
should be paid by the ones that are being regulated and therefore there is much
argument in support of the cost-covering charges.
One must, however, also consider the benefits of an incentive tax regime where the
purpose of the tax is solely to change a certain behaviour which might be harmful to
the environment. In order to ensure that there is retribution to the fiscus as well as a
change in environmentally damaging behaviour, a revenue-raising tax is, however,
deemed to have qualitites of a cost-covering basis as well as an incentive tax regime
and therefore the proper integration of these various alternatives is seen as the
optimal approach.
With a detailed analysis of the main classifications of environmental taxes as well as
examples of each class from current practice in OECD countries, the study will now
explore the environmental tax systems that have been implemented in Mexico,
Malaysia and the United States to investigate the practical application of the various
tax incentives in an authentic context.
This study seeks to use the lessons learnt from the various tax systems in order to
formulate the optimal environmental tax system in the South African context.

- 37 -
CHAPTER 5
CASE STUDY EXAMINING THE ENVIRONMENTAL TAX REGIMES IN MEXICO, MALAYSIA AND THE UNITED STATES OF
AMERICA
5.1 INTRODUCTION
Concerns about the impact of human activities on the environment have encouraged
policy-makers in various developing and developed nations to reconsider the
measures that can be taken in order to align their environmental responsibility with
broader economic objectives.
As indicated in Chapter 4, there are various ways in which environmental taxes can
be applied to achieve various objectives. In order to evaluate environmental taxes
critically the environmental tax regimes of Mexico, Malaysia and the United States
will be analysed in further detail to evaluate the interaction between various tax
mechanisms currently in place in two developing countries and one developed
country.
5.2 THE ROLE OF ENVIRONMENTAL TAXATION IN MEXICO
5.2.1 Introduction
Carbon dioxide is responsible for over 60% of the enhanced greenhouse effect and is
released as a result of burning coal, oil and natural gas (UNFCCC,2010a).
Gonzalez (2007:40) states that Mexico ranks seventh in the world crude oil
production and 21st in the natural gas proven reserves and is responsible for 2% of
the world’s fossil fuel carbon emissions, placing it 15th in the world. The emissions
are mainly derived from fossil fuel consumption by industry and vehicles, very similar
to South Africa.

- 38 -
In 1996, several new tax mechanisms were introduced to deal with air pollution in
Mexico, however, these systems have not yet been implemented. The main
characteristics of Mexico’s environmental tax system are discussed below:
5.2.2 Environmental taxation in Mexico
The following mechanisms are used in Mexico to encourage the reduction in
greenhouse gas emissions as well as incentives to discourage activities that cause
pollution in Mexico (Gonzalez,2007:46-50).
• Special rates of depreciation:
Mexican tax law is very similar to South African tax law and is governed by
Articles 41 to 46, which relate to the deduction of certain capital costs over a
period of time from gross income. Only the decline in value of a depreciating
asset for an income year is an allowable deduction. In addition to this, the
depreciation rates are determined in terms of Articles 44 and 45 and are based on
the period of life of a particular asset.
When the Mexican Income Tax Act was originally enacted in 1980, Article 44
provided for a rate of 35% depreciation for investments for conversion of
equipment to reduce pollution as well as for conversions of equipment to enable
natural gas to be used as fuel. Under the 1994 amendments, this rate was
increased to 100% thereby signifying that all investments for conversion of
equipment to reduce pollution as well as any cost of conversion to enable the use
of natural gas as fuel instead of petrol can be deducted in full in the year of
acquisition (Gonzalez,2007:46-47).

- 39 -
• Tax exemption for some organisations:
Article 95 of the Mexican Tax Act (Diario Oficial de la Federacion 30 December
1980) also provides that organisations which develop activities related to the
conservation of natural resources are exempt from tax (Gonzalez, 2007:47).
• Petrol taxes:
A tax on petrol consumption was established by implementing Articles 1, 2 and
2A of the Special Tax on Services and Commodities Act (Ley del Impuesto
Especial sobre Produccion y Servicious) (Gonzalez, 2007:47).
• Taxes on vehicle ownership:
The Act of the Tax on Property and Possession of Vehicles provisions oblige
vehicle owners to pay this tax on an annual basis by taking into consideration the
value, year, model and depreciation of the vehicle without considering ecological
reasons. No such tax is payable in terms of Article 8 by the owners of electric
vehicles used for the transportation of people (Gonzalez, 2007:47-48).
• VAT:
Title 3 of the Act to Develop and Promote Bioenergetics, which was promulgated
for the objective of promoting the use of biomass as a source of energy, exempts
bioenergetics producers from VAT in accordance with Article 23 (Gonzalez,
2007:49).
• Three environmental taxes have been suggested to be enforced by way of a new
environmental tax act. These taxes consist of a tax on persistent pollutants, a tax
on possession of dangerous and toxic substances and a tax on deterioration of
forest ecosystems (Gonzalez, 2007:50).

- 40 -
5.2.3 Conclusion
Mexico is not obliged to decrease its CO2 emission under the Kyoto Protocol as it
qualifies for developing country status. As such, it is crucial that quantitative methods
of environmental conservation (for which there is no formal liability in terms of the
Kyoto Protocol) are put aside in favour of a tax approach.
The proposed Mexican legislation is still in its infancy stages, however, the
depreciation allowances are very similar to the Section 11D research and
development allowances in terms of the ITA that the South African Revenue Service
(SARS) have favoured in order to stimulate scientific and technological research. It is
therefore quite clear to see that SARS does favour these types of mechanisms to
further a specific objective.
Mexican tax law-makers also appear to understand that an integrated approach is
needed to achieve environmental tax objectives. They have expanded their tax
system by including incentives for supported behaviours such as special depreciation
rates, tax exemption of companies involved in the conservation of natural resources
and by granting VAT exemption to bioenergetics producers from VAT.
Mexican tax authorities have launched taxes to discourage negative behaviours so
that money generated from these taxes could be used in meeting the social cost of
pollution. Examples of these taxes can be found in taxes on vehicle ownership, petrol
taxes as well as the proposed new environmental tax act, which seeks to raise a tax
on persistent pollutants, a tax on possession of dangerous and toxic substances and
a tax on deterioration of forest ecosystems.
It is clear that strategic objectives of environmental taxes can only be achieved
through the successful application of an integrated tax approach.

- 41 -
5.3 THE ROLE OF ENVIRONMENTAL TAXATION IN MALAYSIA
5.3.1 Introduction
Ansari (2007:65) notes that Malaysia is moving forward to ensuring that renewable
energy sources amount to 5% of the total power generation in the country and in
order to achieve this, it has declared renewable energy sources as priority industrial
sources in its tax regime.
The study will now explore the Malaysian tax regime in more detail and evaluate
Ansari’s recommendations on adjusting the current tax regime to make it more
proactive in dealing with the Malaysian government’s goal of encouraging the use of
renewable sources of energy.
5.3.2 Environmental taxation in Malaysia
Capital allowances are granted on investments pertaining to certain activities and
plant and machinery in Malaysia. Similar to South African taxation, the term plant and
machinery has not been defined, however, the definition of what would constitute
plant and machinery can be found in case law.
In broad terms, the Malaysian courts have decided that plant and machinery would
include whatever apparatus is used by a businessman in order to carry on his
business and all goods and chattels, whether fixed or moveable, live or dead, which
he keeps for permanent employment in his business. According to the Malaysian
Income Tax Act 1967, paragraph 2 of Schedule 3, the following expenditure is
considered to have been made on plant and machinery - any expenditure incurred
with regard to the:
• alteration of the existing building for the purpose of installation of the plant or
machinery;
• preparation, cutting, tunnelling or levelling of land in order to prepare it for the
installation of the plant or machinery; and

- 42 -
• expenditure incurred on fishponds, animal pens, chicken houses, cages, buildings
other than those used wholly or partly for the living accommodation of a director,
an individual having control of that business, or an individual who is a member of
the management, administrative or clerical staff engaged in the business and
other structural improvements on land which are used for the purposes of poultry
farms, animal farms, inland fishing industry or other agricultural or pastoral
pursuits (Ansari, 2007:66).
In 2005, the paragraph dealing with plant and machinery was made applicable to
renewable energy sources as well. The allowances claimable are determined
according to paragraphs 15 and 19 of Schedule 3 of the Malaysian Income Tax Act
and with respect to environmental-related expenditure, the following is applicable:
• The Malaysian Income Tax Act provides for an initial allowance of 40% on plant
and machinery used for managing wastes, and generating electricity from
renewable sources.
• The Malaysian Income Tax act also allows for this initial allowance of 40% with
regard to investments in acquiring plant and machinery providing natural gas at
petrol stations and acquiring and running monogas buses. An annual allowance of
20% can also be claimed on both.
These allowances therefore effectively combine to allow a 60% allowance in the first
year with a 20% allowance in the two years thereafter (Ansari, 2007:66-67).
In addition to capital allowances, the Malaysian Income Tax Act also provides for
incentives for the conservation of energy. These incentives can be classified as
follows according to Ansari (2007:67-70) and are summarised for ease of reference
in table 5.1:
Table 5.1: Summary of Malaysian environmental taxation sections
Applicable to Detail
Companies which establish or
provide energy conservation services
Qualify for either one of the following:
• tax exemption of 70% of statutory income

- 43 -
or produce equipment which can be
used for energy efficiency purposes.
for a period of 5 years or
• a capital allowance of 60% on all
qualifying expenditure incurred within a
period of 5 years. This allowance cannot
exceed 70% of statutory income for each
year of assessment.
Expenses incurred by companies to
conserve their own energy.
Qualify for accelerated capital allowances
over 3 years.
Imported foreign-manufactured
equipment to be used in conserving
energy.
Exempt from import duty if it is used in the
conservation of energy.
Locally manufactured equipment to
be used in conserving energy.
Exempt from sales tax subject to the following
conditions:
• application for the incentive must be made
within a specified period.
• the energy-conserving project must be
implemented within one year from the date
of approval.
Plant and machinery used exclusively
for the conservation of energy.
Qualify for an initial allowance of 40% and an
annual allowance of 60% thereby making the
full cost deductible in the year of acquisition.
Energy-generating companies which
use biomass (waste from a rice mill,
sugar cane mill, sawmill, paper
recycling mill, municipal sources) as
a renewable source of energy
(steam, electricity, chilled water and
heat). These companies would
include as promoted activities and
promoted products the produciton of
fuel cells, polymer batteries, solar
cells as well as renewable energy in
• Initial allowance of 20% of the qualifying
plant expenditure and an annual
allowance of 80% thereby making the full
cost of these plant expenditures
deductible in the year of acquisition.
In addition, these companies qualify for either
one of the following:
• tax exemption of 70% of statutory income
for a period of 5 years or
• a capital allowance of 60% on all

- 44 -
general. qualifying expenditure incurred within a
period of 5 years. This allowance cannot
exceed 70% of statutory income for each
year of assessment.
All equipment not produced locally would
qualify for an expemption of import duty and
locally produced equipment would qualify for
an exemption of sales tax.
Companies which undertake forest
plantation projects.
These companies are eligible for either of the
following:
• full tax exemption of their statutory income
for 5 years and a further extension of
exemption for an additional 5 years or
• an allowance of 100% in respect of
qualifying capital expenditure incurred
within 5 years of the date when the first
capital expenditure was incurred. This
allowance can be utilised in full against the
full taxable income (therefore 100% of the
statutory income can be claimed resulting
in zero taxes payable).
Companies which are directly
involved in the storage, treatment
and disposal of toxic and hazardous
waste in an integrated manner.
These companies are eligible for either of the
following:
• tax exemption of 70% of statutory income
for a period of 5 years. The company will
therefore only be taxed on the remaining
30% of the statutory income or
• an allowance of 60% in respect of
qualifying capital expenditure (plant,
machinery) incurred within 5 years from
the date when the first capital expenditure
is incurred. This allowance can exempt up

- 45 -
to 70% of the statutory income in the year
of assessment, and any unutilised portion
can be carried forward to be utilised in the
following years until it has been utilised.
Source: Adapted from Ansari (2007:67-70)
Certain administrative requirements are to be met in order to qualify for these
incentives such as that approval has to be obtained from the applicable authority with
implementation of the project within one year of date of approval.
Ansari (2007:71-73) further describes various incentives available with regard to
research and development activities. These are summarised in tabular format as
follows:
Table 5.2: Summary of Malaysian environmental taxation sections relating to research and
development
Applicable to Detail
Scientific research expenditure (other
than capital expenditure) (including
research relating to generating and
transmitting energy from renewable
sources, which is not of a capital
nature).
• 100% deduction if related to the taxpayer’s
business;
• 200% deduction is available for
expenditure incurred in any research
approved by the ministry or if the person
incurring the expenditure is doing so as
part of his/her participation in industrial
adjustment plan even if the research is not
related to the taxpayer’s business, or if the
expenditure is incurred by a third party on
the taxpayer’s behalf.
Contributions to an approved
research company, research and
development company or a contract
research and development company.
Qualifies for a 200% deduction.

- 46 -
Incentives available to be applied by
research and development
companies.
Investment tax allowance of 100% for
10 years on all qualifying capital expenditure,
which will be abated from the statutory
income and will be limited to 70% of the
statutory income.
If this investment incentive is utilised, any
related company will not be able to enjoy
double deduction for payments made to these
companies, however, if the reserach and
development company chooses not to utilise
the investment allowance, the related party
would qualify for double deduction.
Incentives available to be applied by
contract research and development
companies.
Either one of the following incentives is
available:
• full tax exemption of statutory income for a
period of 5 years or
• investment tax allowance of 100% for
10 years on all qualifying capital
expenditure, which will be abated from the
statutory income and will be limited to 70%
of the statutory income.
Source: Adapted from Ansari (2007:71-72)
5.3.3 Conclusion
In Malaysia, the majority of its environmental tax incentives are centred around tax
exemption of statutory income (partially or in full) or capital allowances on qualifying
capital equipment where the allowances are limited to a percentage of taxable
income.
In view of the instability of oil prices, all countries want to increase their reliance on
renewable sources of energy where the production is mostly under the countries’

- 47 -
control. In Malaysia, companies engaged in these energy sources qualify for tax
exemption of 70% of the statutory income for five years, or investment tax allowances
of 60% of the qualifying capital expenditure incurred within five years (restricted to a
maximum of 70% of statutory income per year of assessment).
In addition to this, all equipment imported would also qualify for an exemption from
sales tax and import duty whereas locally manufactured equipment would qualify for
an exemption from sales tax.
Qualifying contributions to research and development companies also qualify for
double deduction, with special allowances available to research and development
and contract research and development companies.
Although these incentives are seen as very robust, the total energy production from
renewable energy sources in Malaysia is in the order of 5% of the total energy
production in Malaysia (Ansari, 2007:75).
The reasons for the relatively slow increase in biofuel production are given by Ansari
(2007:75-77) are as follows:
• Projects for renewable energy sources are not seen to be high-profit endeavours
by banks from which the initial sourcing of funds needs to be done.
• The cost of energy supplied by utility companies is much lower than the current
cost of bioenergy.
• There are certain concerns regarding the sustainability of the fuel supply for
renewable energy projects.
• The country has significant coal reserves which can be used for its coal-fired
power plants.
An integrated approach with regard to environmental taxation (for example where
coal generation power plants are taxed) is required. This will ensure that money
generated from the tax can be used in meeting the social cost of pollution. This will
indirectly ensure an improved business case for the purchase of untaxed, subsidised
bio-energy. Incentives alone do not appear sufficient to achieve the desired result.

- 48 -
5.4 THE ROLE OF ENVIRONMENTAL TAXATION IN THE UNITED STATES (US)
5.4.1 Introduction
Richards (2007:190) notes that, although there is a perception that the US favours a
quantitative limitation policy in its environmental tax regime, the US does in fact
employ environmental taxes in many areas including transportation, hazardous and
solid waste and water protection.
This study shares the view of Richards (2007:202) that a normative, revenue-raising
approach such as environmental taxes is preferable to a quantitative approach
regarding environmental taxation methodologies. Richard (2007:205) does, however,
continue to raise an interesting point, namely that he sees the greatest obstacle to
the use of environmental taxes in the US as political, rather than practical or
administrative. He explains that quantitative measures are preferred in the US due to
them being less distorting to the public finance system than the alternatives of
environmental taxes.
5.4.2 Environmental taxation in the USA
Some specific environmental taxes currently employed at state, local and federal
level have been highlighted by Richards (2007:206-214) and are discussed in more
detail below:
• Superfund tax:
This tax imposes ‘feedstock’ taxes on petroleum and 42 chemicals as well as ‘waste-
end’ taxes on hazardous waste materials and is an earmarked cost-covering charge
as the revenues generated by these taxes were earmarked to be used for the clean-
up of contaminated sites. This tax was abolished in 1995 and has as yet not been
resurrected.

- 49 -
• Ozone-depleting substance tax:
This tax is levied on five CFCs and other gases which are responsible for depleting
the ozone layer. This tax is calculated by taking into account the ozone-depleting
potential of the substance as well as the quantity of the gases imported or produced.
Starting in 1995, the tax increased by USD 0.45 per pound from a base rate of USD
5.35 per pound.
• Motor fuels tax:
There are many federal taxes imposed on motor fuels, which range from USD 0.131
to USD 0.244 per gallon on all types of fuels. In addition to the federal taxes, almost
all US states have some sort of tax levied on motor fuels, petroleum products and
underground storage of petroleum. Across the US, the average combined federal,
state and local tax on gasoline is USD 0.40 per gallon.
• Gas guzzler tax:
This tax is assessed at the time of purchase of a new vehicle and is related to the
gas mileage rating assigned by the US Environmental Protection Agency. Cars with
ratings above 22.5 miles per gallon are exempted from the charge, whereas cars just
below that are subject to a fee of USD 1 000. The maximum tax chargeable is USD 7
000.
The gas guzzler tax has, however, been met with severe critisism as it exempts light
duty trucks, minivans and sport/utility vehicles. Over 50% of new vehicle sales in
2004 in the US fell into this category and due to the low fuel efficiency of the exempt
vehicles, it has been suggested that this tax has increased the sales of the exempt
low efficiency category of vehicles.
• Hazardous waste taxes:
This is a tax charged on activities related to hazardous waste generation,
transportation, treatment, storage and disposal. The taxes can be charged once-off
upon commencement of the activity, an annual tax or quantity-based fees in
proportion to the waste involved.

- 50 -
• Solid waste taxes:
Approximately 20% of households in the US are subject to the “pay-as-you-throw”
scheme where householders pay a fee for the curbside collection and disposal of
their waste. The system that is used most is where the homeowner attaches a sticker
(generally purchased for between USD 1 and USD 2) to the waste can or bag.
Therefore, a household disposing of four bags of waste could incur as much as USD
8 for the disposal services.
5.4.3 Conclusion
Although the US environmental tax system is largely in its infancy stages, mostly due
to the popularity of the cap-and-trade system, it is important to note the various
methods imposed in order to generate revenue from an environmental tax regime. As
noted in Chapter 2, the US has not proved itself to be committed to the Kyoto
Protocol; and without restrictions and requirements placed on it through international
pressure, other countries would be hard-pressed to entice the US to a more robust
environmental tax regime.
5.5 CONCLUSION
This study of the environmental tax systems of different countries indicates some
trends in environmental tax legislation, which could also be applied to the South
African context. These are the following:
• increased allowances on capital expenditures incurred for certain purposes. An
example of this is the Mexican tax system where allowances can be claimed for
conversion of equipment to be less energy-intensive. The Malaysian tax regime
further limits these allowances to a percentage of taxable income to ensure that
these allowances do not drain the fiscus in the first few years of implementation;
• tax exemption granted for certain organisations taking part in specific activities
with an environmental benefit;
• VAT and import tax exemption on the purchase and importation of capital
equipment, which can be used to achieve certain environmental goals;
- 51 -
• additional taxes placed on petrol, hazardous waste and ozone-depletion
substances as illustrated through the US tax system;
• taxes imposed on vehicles and gas guzzlers;
• research and development activity stimulation in the specific fields relating to the
development of environmental protection inventions.
Another important factor in the Malaysian tax system, which can be applied in the
South African context, is the administrative requirements, which ensure that only
qualifying activities contributing to the overall environmental objectives are
incentivised.
After examining the tax systems in other countries, the final chapter will focus on this
study’s proposed taxation system in the South African context.

- 52 -
CHAPTER 6
PROPOSED SOUTH AFRICAN ENVIRONMENTAL TAX SYSTEM
6
6.1 INTRODUCTION
According to Du Plessis (2007: 218), policy documents in South Africa refer more
and more to economic instruments to assist in environmental protection such as
tariffs, levies, tax imposition, incentives and reductions. According to Williams
(2009:50), expectations are that the South African Government will produce a White
Paper on a national climate change reaction plan completed by December 2010 with
a Green Paper to be published by April 2011 for comments
There is much debate in the media on a suitable tax mechanism to produce the
desired results. Izak Swart, an associate director in tax at Deloitte was quoted as
preferring a cap-and-trade system (quantitative approach) as the best option,
whereas Chaya Lakhani from PriceWaterhouseCoopers supports a taxation system
(Williams, 2009:50).
This study indicated in Chapter 3 that it is in support of a taxation system, therefore
this section will look at specific taxation recommendations with regard to the levying
of environmental taxation.
In attempting to recommend a suitable taxation system, the environmental taxes
currently available in the South African tax system will first be analysed. Following
this analysis, the study will propose certain changes to the Act in order to expand on
the current environmental tax system.

- 53 -
6.2 SOUTH AFRICA’S CURRENT ENVIRONMENTAL TAX SYSTEM
The Act currently contains the following measures that can be seen as tax measures
to protect the environment:
6.2.1 Land rehabilitation
Section 10(1)(cP) of the Act exempts “the receipts and accruals of a company or trust
contemplated in section 37A”.
Section 37A of the Act relates to a closure rehabilitation company or trust whose sole
objective is to apply its property solely for rehabilitation upon premature closure,
decommissioning and final closure, and post-closure coverage of any latent and
residual environmental impacts on the area covered in terms of any permit, right,
reservation or permission granted to restore one or more areas to their natural or
predetermined state.
The profits of such an institution may not be distributed and must be utilised for the
purpose for which it was created.
Section 37A also states that any contributions made by a taxpayer to such a
rehabilitiation company or trust is tax-deductible.
6.2.2 Environmental capital expenditure allowances
The ITA provides for an allowance equal to 40% of the cost of any new and unused
environmental treatment and recycling asset in the year in which it is brought into use
and 20% in each succeeding year of assessment in terms of Section 37B.
Section 37B allows for a write-off of 5% for any new and unused environmental waste
disposal assets as soon as they are brought into use and 5% for each succeeding
year of assessment. These deductions would not exceed the actual cost incurred by
the taxpayer.

- 54 -
6.2.3 Environmental conservation and maintenance
The ITA allows as a deduction in terms of Section 11(a) for expenditure and losses
actually incurred in the production of the income provided that such expenditure and
losses are not of a capital nature.
Before the introduction of Section 37C, it was difficult for taxpayers to claim
expenditure incurred for the conservation and/or maintenance of the environment as
a deduction in terms of Section 11(a) as they found it difficult to prove that it was in
the production of income.
Firstly, Section 37C deals with land not owned by the taxpayer and determines that
expenditure incurred by the taxpayer to conserve or maintain land is deemed to be
expenditure incurred in the production of income for purposes of a trade carried on if
the:
• conservation or maintenance is carried on in terms of biodiversity management
arrangement with a duration of at least five years and entered into by the taxpayer
under Section 44 of the National Environmental Management:
Biodiversity Act (10/2004) and
• land utilised by the taxpayer for the production of income consists of, includes or
is in the immediate proximity of the land that is subject to the agreement.
No assessed loss can be created through the deduction of these costs from the
taxpayer’s income, however, these unutilised deductions can be carried forward to
the following year/s of assessment.
Secondly, Section 37C determines that, if the taxpayer conserves or maintains
his/her own land, this expenditure is also deductible if the conservation or
maintenance is carried out in terms of a declaration that has a duration of at least 30
years in terms of Section 20, 23 or 28 of the National Environment Management:
Protected Areas Act (57/2003).
It is important to note that this expenditure is deductible in terms of Section 18A of
the Act, which deals with donations, and therefore this deduction is limited to 10% of
the taxable income of the taxpayer. Should the taxpayer not have taxable income in a

- 55 -
particular year of assessment, he/she would not be able to claim the deduction in a
following year.
If the taxpayer is in breach of the agreement or violates the declaration, the taxpayer
must include in his/her taxable income all the deductions that were allowed within a
period of five years prior to the breach.
6.2.4 Land declared as a national park or nature reserve
Section 37C of the ITA lastly allows a deduction over 10% of the lesser of the cost or
the market value of land declared a national park or nature reserve in terms of an
agreement under Section 20(3) or 23(3) of the National Environmental Management:
Protected Areas Act (57/2003) if the declaration is endorsed in the title deed of the
land for a duration of at least 99 years.
It is important to note that this expenditure is deductible in terms of Section 18A of
the Act, which deals with donations, and therefore this expenditure is limited to 10%
of the taxable income of the taxpayer. Should the taxpayer not have taxable income
in a particular year of assessment, he/she would not be able to claim the deduction in
a following year.
If the taxpayer is in breach of the agreement or violates the declaration, the taxpayer
must include in his/her taxable income all the deductions that were allowed within a
period of five years prior to the breach.
6.2.5 Plant and machinery used in the production of renewable energy
Section 12B allows for a deduction of the cost of the taxpayer of the following assets
owned by the taxpayer or acquired by him/her in terms of an instalment credit
agreement or any improvements to these assets, which were brought into use for the
first time by the taxpayer for the purposes of his/her trade:
• machinery, plant, utensil or article used for the purpose of the production of
biodiesel or bioethanol;

- 56 -
• machinery, plant, utensil or article used for the purpose of the generation of
electricity from wind, sunlight, gravitational water forces to produce electricity of
less than 30 megawatts or biomass consisting of organic waste, landfill gas or
plants.
The deduction is determined as 50% of the lesser of the actual or arm’s length cost of
the asset in the first year from when it was brought into use, 30% in the following year
and 20% in the last year.
6.2.6 Wear and tear rates on solar energy units
Interpretation Note 47, which is currently used in conjunction with Section 11(e) of the
ITA to determine the write-off period of certain assets, determines that the write-off
period that can be used to determine the wear and tear claimable on solar energy
units is five years.
6.2.7 Carbon dioxide emissions tax
From 1 September 2010, this emissions tax has been introduced on all new
passenger vehicles and is in addition to the ad valorum luxury tax already in place on
new vehicles.
Certified carbon dioxide emissions are now taxed at R75 per g/km for each g/km
above 120 g/km.
The new tax regime favours the use of more fuel-efficient vehicles that emit less
carbon dioxide.

- 57 -
6.3 PROPOSED AMENDMENTS TO THE CURRENT ENVIRONMENTAL TAX SYSTEM
In March 2006, the South African Cabinet commissioned the Scenario Building Team
to examine the potential for the mitigation of South Africa’s GHG emissions. The
results were to be used in developing a long-term climate policy.
According to the research done by Hughes, Haw, Winkler, Marquad and Bruno
(2007:3) in 2004, South Africa produced 1% of all the carbon dioxide produced
worldwide. The main sources of the carbon dioxide were deforestation and power
generation.
South Africa’s historically low energy prices favoured energy-intensive industries in
the past, resulting in a very high emissions intensity (i.e. emissions per GDP)
compared with most developing and developed countries as illustrated in the graph
below.
Figure 6.1: Comparison of the intensity of emissions
Source: Adapted from Hughes et al. (2007:3)
The green bars show the result of deforestation, therefore a lack of recycling of
carbon dioxide, rather than actual emissions.

- 58 -
Huges et al. (2007:6-13) evaluated two potential scenarios for South Africa. The first
being a scenario where South Africa continues to develop without any consideration
for GHG emissions. This scenario was called the “growth without constraints”
scenario. The second scenario assumes that South Africa has the resources and
technology at its disposal to take action to stabilise GHG concentrations – they called
this the “required by science” scenario.
Huges et al. (2007:10) modelled the results from these two scenarios in a graph that
shows dramatically different results by 2050.
Figure 6.2: Illustration of the gap in emissions between emission scenarios
Source: Adapted from Hughes et al. (2007:10)
As can be seen, there is a large gap between the emission trajectories for these two
scenarios. The gap in 2050 represents approximately 1 300 mega tons of carbon
dioxide emissions per year and is three times larger than South Africa’s total
emissions in 2003.

- 59 -
One of the strategic options in order to ensure that the “required by science” scenario
is met is through the strategic option “use the market” (Huges et al., 2007:18), where
it is recommended that taxes and incentives be used to ensure that negative social
behaviour is changed and to ensure a faster uptake of accelerated technologies. This
study will now take a closer look at the available taxes and incentives that are
proposed in line with the “required by science” scenario.
6.3.1 Environmental capital expenditure allowances
As noted above, the ITA provides for an allowance equal to 40% of the cost of any
new and unused environmental treatment and recycling asset in the year in which it
is brought into use and 20% in each succeeding year of assessment. It also allows
for a write-off of 5% for any new and unused environmental waste disposal assets as
soon as they are brought into use and 5% for each succeeding year of assessment.
This study proposes that this section of the Act should be amended to not only allow
the allowance for ‘new and unused’ environmental treatment, recycling and
environmental waste disposal assets; but also to include ‘used’ environmental
treatment, recycling and waste disposal assets. This study also proposes that the
allowances available for environmental waste disposal assets be aligned with the
allowances available for the environmental treatment and recycling assets.
6.3.2 Wear and tear rates on solar energy units
The five-year write-off period on solar energy units is in line with the wear and tear
period applicable for portable generators under Interpretation Note 47. The
generators usually function through using petrol or diesel and therefore is a much
more harmful electricity generator than solar energy units. It is therefore proposed
that the write-off period for solar energy units be decreased to two years to
encourage investment in electricity generators that are less harmful to the
environment.

- 60 -
6.3.3 Carbon dioxide emissions tax
It is proposed that this tax be extended to not only include passenger cars, but also
commercial vehicles, which are generally much less fuel efficient and have a higher
carbon dioxide emissions rate than passenger vehicles. This view is supported by
van der Merwe (2010:22) in his article on South Africa’s green taxes.
6.3.4 Tax Concessions for investing in environment-friendly projects
Lester (2009:14) recommends that South Africans seeking to make a meaningful
contribution to a clearner country need a tax incentive that would assist Eskom in
rebuilding a modern, environment-friendly energy grid. He proposes that South
Africans should be encouraged to invest in environment-friendly projects by making
these investments tax-deductible.
In addition to this, Lester (2009) proposes that the growth in these investments
should be tax-free where the cash out could take the form of electricity credits (which
can be applied against a taxpayer’s electricity bill), or which can be tradeable without
any tax consequences on date of disposal.
Currently, any investment would be regarded as being of a capital nature and would
therefore fall foul of the general deduction formula. Any investment made would
consequently be of a capital nature and not be deductible for tax purposes. The only
tax break that one would qualify for in accordance with the current ITA is that, upon
disposal of the investment (assuming that the taxpayer does not trade in these types
of investments), the profit would be subject to capital gains tax at an inclusion rate of
50% and not 100%.
6.3.5 Carbon tax
It is very likely that South Africa will pass legislation aimed at reducing its carbon
footprint in the near future. Due to South Africa’s high emissions rate and reliance on
coal as energy source, the government is widely expected to commit to a carbon

- 61 -
emission reduction programme and common thinking at the moment is that it would
opt for a carbon tax. The main reason for this is that SARS is seen as the most
efficient department in government and a tax would therefore be relatively easy to
introduce and administer (Transnet National Ports Authority, 2010:21).
Hughes, Haw, Winkler, Marquad and Bruno (2007:72) investigated the mitigation of
carbon dioxide emissions through different tax levels specifically with reference to the
introduction of carbon taxes, the results of which were modelled in a study on energy
modeling done for the Department of Environmental Affairs and Tourism.
Hughes et al.(2007) found that there are limits to the impact that a carbon tax would
have on the energy system as a whole. This is due to vary few options currently
available to the South African economy in terms of limited technologies and energy
carriers as a whole.
Through extensive modelling they have ascertained that, after a certain threshold,
imposing a higher tax makes no difference to the carbon dioxide emissions.
Figure 6.3 illustrates the modelled response of the energy system to different tax
levels.
Figure 6.3: Average and marginal impact of various tax levels
Source: Adapted from Hughes et al. (2007:74)

- 62 -
As can clearly be seen, a R50 per ton carbon dioxide equivalent emission tax has a
negligible impact. From R100 per ton carbon dioxide equivalent carbon tax there is a
greater impact on reduction of emissions. Hughes et al. (2007:72) maintain that the
average impact of higher tax levels peak at R140 per ton carbon dioxide equivalent
emission and declines steadily after that.
Scrimgeour, Oxley and Fatai (2005:1439-1447) investigated the relative effectiveness
and efficiency of alternative environmental taxation by investigating carbon, energy
and petroleum taxes. Their study included an evaluation of international experiences
with carbon taxes and found that the introduction of carbon taxes was generally part
of a larger tax reform process, which also included rebates and exemptions and other
measures to lessen the impact of the carbon taxes.
In order to lessen the impact of carbon tax on the industries which are vital to
economic growth and job creation in South Africa, the research recommends that
government should consider alternative methods of alleviating the burden of this
environmental tax. Scrimgeour et al. (2005:1442) note that in Sweden, for example,
manufacturing industries are only subject to 50% of the carbon tax, whereas in
countries like Denmark, there are different carbon tax rates for medium energy-
intensive industries and high energy-intensive industries.
Humpreys (2007:1-9) argues that a carbon tax is preferable to a carbon trading
system as it was found through his research to be more efficient, effective, simple,
flexible and transparent. Carbon tax has the added benefit of providing revenue,
which can be used to cut other taxes. Humpreys’s modelling revealed that, if a
carbon tax of AUS $ 15 per ton carbon dioxide equivalent emissions were to be
imposed in Australia, the resulting tax would be enough to lead to an increase in the
tax-free threshold from AUS $ 6 000 to AUS $ 10 000 or to decrease the top marginal
rate from 45% to 30%. By increasing the carbon tax to AUS $ 30 both these tax cuts
can be achieved.

- 63 -
Humpreys’s study also found that by introducing a carbon tax, fuel taxes could be
fully offset, thereby transferring environmental taxes on fuel to a lower rate on a
broader base. The introduction of carbon tax would shift Australia’s reliance on ‘dirty’
coal away to cleaner alternatives.
6.4 CONCLUSION
Although South Africa is in the initial phase of introducing an environmental tax
system, it would appear that an increased emphasis is being placed on finding a
suitable alternative to offset the carbon emissions, generating tax revenues and
supporting industrial economic growth.
Increasing pressure is placed on companies in a move away from a single bottom
line of shareholder profit to a triple bottom line that embraces the economic,
environmental and social aspects of a company’s activities as regulated by the King
Report on Corporate Governance (Temkin, 2006:2).
By far the largest contribution to environmental taxes can be made by imposing a
system of carbon tax at a suggested rate of R140 per ton carbon dioxide equivalent
as studies have shown to be the preferred rate. Alternatives such as extending
environmental capital expenditure allowances, increased wear and tear rates on solar
energy units, tax concessions in investing in environmentally friendly projects as well
as introducing carbon emissions taxes on commercial vehicles are also expected to
effectively expand on South Africa’s current environmental tax regime.

- 64 -
LIST OF REFERENCES
Amundsen, E.S. & Schob, R. 1999. Environmental taxes on exhaustible resources.
European Journal of Political Economy, 15:311-329.
Ansari, A.H. 2007. Tax incentives to renewable energy sources in Malaysia: a critical
appraisal. In Deketelaere, K., Milne, J.E., Kreiser, L. & Ashiabor, H. Critical issues in
environmental taxation: international and comparative perspectives. Oxford: Oxford
University Press.
Bazin, D., Ballet, J. & Touahri, D. 2004. Environmental responsibility versus taxation.
Ecological Economics, 49:129-134.
Beder, S. 1996. Charging the earth: the promotion of price-based measures for pollution
control. Ecological Economics, 16:51-63.
Bisseker, C. 2009. What SA's energy mix should be; more hot air. Financial Mail, 20
November 2009:34.
Bithas, K. 2006. The necessity for environmental taxes for the avoidance of environmental
thievery. A note on the paper "Environmental responsibility versus taxation". Ecological
Economics, 56:159-161.
Business Day. 2009a. China sets first target on emissions. 27 November:7.
Business Day. 2009b. India sets carbon targets but insists on following its own path.
4 December:8.
Business Day. 2009c. What the earth faces, and the cost of fixing it. 8 December:5.
Davenport, J. 2009. Carbon Laggard. Engineering News, 20 November:37.

- 65 -
Du Plessis, W. 2007. Recent developments in the use of environmental and energy taxes
in South Africa. In: Deketelaere, K., Milne, J.E., Kreiser, L. & Ashiabor, H. Critical issues in
environmental taxation: international and comparative perspectives. Oxford: Oxford
University Press.
Ekins, P. 1999. European environmental taxes and charges: recent experience, issues
and trends. Ecological Economics , 31:39-62.
Ellis, H. 2008. Food miles. Available online:
http://www.bbc.co.uk/food/food_matters/foodmiles.shtml
[Accessed: 5 July 2010].
Ferreira, A. 2009. SA missing the carbon bandwagon. The Business Times,
16 November:12.
Gonzalez, J.J. 2007. Legal mechanisms to promote the use of renewable sources of
energy in Mexico: the role of taxation. In: Deketelaere, K., Milne, J.E., Kreiser, L. &
Ashiabor, H. Critical issues in environmental taxation: international and comparative
perspectives. Oxford: Oxford University Press.
Hoel, M. & Karp, L. 2001. Taxes and quotas for a stock pollutant with multiplicative
uncertainty. Journal of Public Economics, 82:91-114.
Hughes, A., Haw, M., Winkler, H., Marquad, A. & Merven, B. 2007. Department of
Environment Affairs and Tourism; a modelling input into the long-term mitigation scenarios
process. Available online:
http://www.environment.gov.za/HotIssues/2009/LTMS2/EnergyModeling.pdf
[Accessed: 2 September 2010].
Humpreys, J. 2007. Exploring carbon tax for Australia. The Centre for Independent
Studies: perspectives on tax reform, 1:9. Available online:
IPCC Home Page. (2001). Retrieved from http://www.ipcc.ch/
[Accessed: 5 July 2010].

- 66 -
Joubert, L. 2009. Copenhagen wraps up with toothless argument. Sunday Independent, 20
December:5.
Kahn, J.R. & Franceschi, D. 2006. Beyond Kyoto: a tax-based system for the global
reduction of greenhouse gas emissions. Ecological Economics, 58:778-787.
Lester, M. 2009. Turn greenbacks into green bucks with real tax concessions. Business
Times, 6 December:14.
Mason, J. 2009. US to pledge 17% reduction in emissions in Copenhagen. Business Day,
26 November:8.
Monbiot, G. 2009. Canada's climate shame. Mail & Guardian, 4 December:17.
Mundy, S. 2009. SA surprises with pledge of 42% emissions slowdown. Business Day,
8 December:1.
Nordhaus, W.D. 2005. Life after Kyoto: alternative approaches to global warming policies.
National Bureau of Economic Research Working Paper 11889, December 2005:1-31.
Pile, J. 2008. Cutting cleaning costs. Financial Mail, 7 March:55.
Richards, K.R. 2007. Environmental taxes in the United States. In: Deketelaere, K., Milne,
J.E., Kreiser, L. & Ashiabor, H. Critical issues in environmental taxation: international and
comparative perspectives. Oxford: Oxford University Press.
Salgado, I. 2009. SA may be 'star of climate talks' but change requires funding. The Star,
Business Report, 15 December:20.
Science News. 2008. Motor vehicles and carbon emissions; a general overview. Available
Online: http://science-news.org/category/carbon-emissions/
[Accessed 30 September 2010].

- 67 -
Scrimgeour, F., Oxley, L. & Fatai, K. 2005. Reducing carbon emissions? The relative
effectiveness of different types of environmental tax: the case of New Zealand.
Environmental Modelling & Software, 20:1439-1448.
Sebitosi, A.B. & Pillay, P. 2008. Grappling with a half-hearted policy: the case of
renewable energy and the environment in South Africa. Energy Policy, 36: 2513-2516.
Smit, P. 2009. Environmental protection: SA businesses to feel climate change impacts.
Engineering News , 30 October:47.
Speck, S. & Datta, A. 2009. Environmental fiscal reform; differences and similarities
between developed and developing countries, based on a case study of the current
situation in Sri Lanka. In: Cottrell, J., Milne, J.E., Ashiabor, H., Kreiser,L. & Deketelaere, K.
Critical Issues in Environmental Taxation (pp. 805-830). Oxford: Oxford University Press.
Sunday Independent. 2009. China sets ambitious targets on emission cuts.
29 November:8.
Temkin, S. 2006. Government moots introduction of 'green tax' to clean up environment.
Business Day, 20 April:2.
Transnet National Ports Authority. 2010. Carbon tax legislation: what SA businesses
should know. Ports SA, Autumn:21.
UNFCCC (United Nations Framework Convention on Climate Change). 2010a. Feeling the
Heat: The Greenhouse effect and the Carbon cycle. Available online:
http://unfccc.int/essential_background/feeling_the_heat/items/2903.php
[Accessed: 10 June 2010].
UNFCCC (United Nations Framework Convention on Climate Change). 2010b.
Kyoto Protocol. Available online: http://unfccc.int/kyoto_protocol/items/2830.php
[Accessed: 15 April 2010].

- 68 -
Van der Merwe, C. 2010. Green Impacts: South Africa's green taxes, carbon choices to
affect cost of doing business. Engineering News, 19 March:22.
Williams, F. 2009. Focus on carbon disclosure project results: shying away from
disclosing. Finweek, 29 October:50-51.
World Bank. 2005. Environmental Fiscal Reform – what should be done and how to
achieve it. Washington.Retrieved 30 September 2010 from
http://siteresources.worldbank.org/INTRANETENVIRONMENT/Publications/20712869/Env
FiscalReform.pdf
[Accessed 30 September 2010].