a comparative study of valuation methodologies for mineral ... · pdf filein order to...
TRANSCRIPT

▲29The Journal of The South African Institute of Mining and Metallurgy JANUARY 2005
Introduction
The value of a mineral project can bedetermined using a variety of valuationtechniques and associated methodologies. Thispaper highlights the preferred methodologiesand demonstrates their comparative resultsusing a series of five real-life numericalexamples. The methodologies to be consideredare:
The market approach, including:
➤ Lilford Techno Economic Matrix Method(Lilford TEM Method, (Lilford 2004))
➤ US$ per unit of commodity (such asUS$/oz) and
➤ Kilburn method.
The cost approach, including:➤ Multiples of exploration expenditure.
Income approach, including:
➤ Discounted cash flow (DCF) techniques➤ Tail margin analysis (derived from cash
flows) and➤ Option (derivative) pricing techniques.
Mineral developments generally have longlead times before they come to full production.This is followed by a period of mineralproduction at or near full capacity, leadingeventually to mine closure and rehabilitation.Valuation of the mineral asset could berequired at any stage in its life, but not all ofthe valuation techniques are applicable to allstages of such a development. Thus, whilemineral valuation techniques are not all stagespecific, there are some that may only apply tocertain stages. Since the different valuationmethodologies cannot be satisfactorily usedacross all the stages of development of amineral project, five examples which exemplifycertain stages of development are considered.
Practical examples
The valuation methodologies described abovewere applied to the five examples of mineraldevelopments and the outcomes of theapplication of each method are compared. Thisapproach allowed the preferred methodologyunder specific circumstances to be identified.The broad parameters for five South Africangold projects, each in different stages ofdevelopment will be considered and include:
➤ a greenfield exploration target (ProjectA)
➤ an identified and partially sampledmineral occurrence (Project B)
A comparative study of valuationmethodologies for mineraldevelopmentsby E.V. Lilford* and R.C.A. Minnitt†
Synopsis
Valuators of mineral properties are faced with a range of valuationmethodologies, the most important of which are grouped under theheadings of the market approach, the cost approach and the incomeapproach. The way in which value is defined and the detail of thedifferent valuation methodologies is examined here. This paper aimsat documenting the variety of valuation procedures and applyingeach method to a variety of gold projects and comparing theoutcomes.
Any decision to apply a valuation technique will dependprincipally on the stage to which the project has been developed.The valuation approach to a greenfield project will be substantiallydifferent from that applied to a well-drilled, extensively exploredmineral property. Furthermore, a valuation exercise may producedifferent outcomes for the same gold project depending on whichmethod is applied.
In order to investigate the variability in valuation methods andto explore the outcomes of different approaches, a series of five goldprojects was analysed. The projects differ in regard to levels ofcapital application, infrastructural setting, depth below surface, insitu grade, and the stage of development, and were valued using thedifferent methods.
The most critical aspect of any valuation is the capacity of thevaluer to identify the salient issues and ensure that they areincorporated into the valuation. The danger of simply applying‘black box’ solutions to valuation problems without a fullunderstanding of the parameters and the areas of uncertainty isemphasized. The importance of the valuator’s experience, insightsinto best practice and the ability to recognize and submit to therequirements of compliance within the minerals industry is amongthe most important characteristics of a valuer.
* Resource Finance Advisors, Parktown West, SouthAfrica.
† School of Mining Engineering, University of theWitwatersrand, Wits, South Africa.
© The South African Institute of Mining andMetallurgy, 2005. SA ISSN 0038–223X/3.00 +0.00. Paper received Jun. 2004; revised paperreceived Nov. 2004.
A comparative study of valuation methodologies for mineral developments
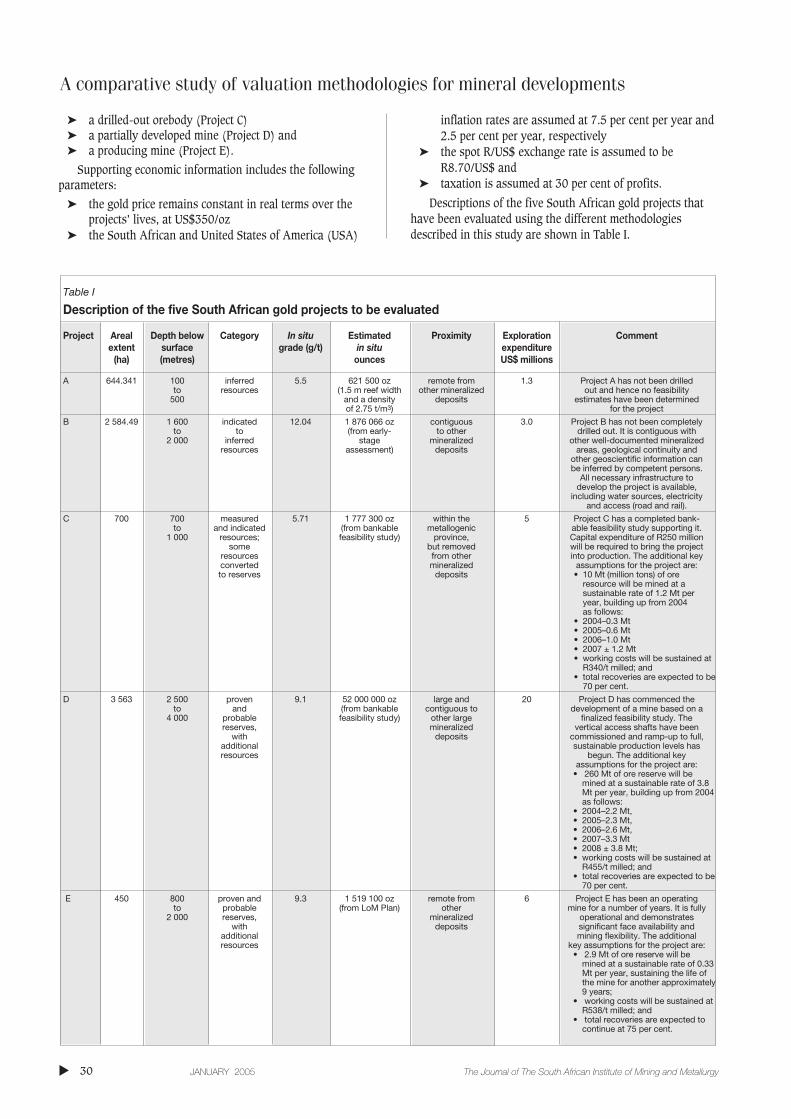
➤ a drilled-out orebody (Project C)➤ a partially developed mine (Project D) and➤ a producing mine (Project E).
Supporting economic information includes the followingparameters:
➤ the gold price remains constant in real terms over theprojects’ lives, at US$350/oz
➤ the South African and United States of America (USA)
inflation rates are assumed at 7.5 per cent per year and2.5 per cent per year, respectively
➤ the spot R/US$ exchange rate is assumed to beR8.70/US$ and
➤ taxation is assumed at 30 per cent of profits.
Descriptions of the five South African gold projects thathave been evaluated using the different methodologiesdescribed in this study are shown in Table I.
▲
30 JANUARY 2005 The Journal of The South African Institute of Mining and Metallurgy
Table I
Description of the five South African gold projects to be evaluated
Project Areal Depth below Category In situ Estimated Proximity Exploration Commentextent surface grade (g/t) in situ expenditure
(ha) (metres) ounces US$ millions
A 644.341 100 inferred 5.5 621 500 oz remote from 1.3 Project A has not been drilledto resources (1.5 m reef width other mineralized out and hence no feasibility
500 and a density deposits estimates have been determinedof 2.75 t/m3) for the project
B 2 584.49 1 600 indicated 12.04 1 876 066 oz contiguous 3.0 Project B has not been completelyto to (from early- to other drilled out. It is contiguous with
2 000 inferred stage mineralized other well-documented mineralized resources assessment) deposits areas, geological continuity and
other geoscientific information canbe inferred by competent persons.
All necessary infrastructure to develop the project is available,
including water sources, electricityand access (road and rail).
C 700 700 measured 5.71 1 777 300 oz within the 5 Project C has a completed bank-to and indicated (from bankable metallogenic able feasibility study supporting it.
1 000 resources; feasibility study) province, Capital expenditure of R250 millionsome but removed will be required to bring the project
resources from other into production. The additional keyconverted mineralized assumptions for the project are:to reserves deposits • 10 Mt (million tons) of ore
resource will be mined at a sustainable rate of 1.2 Mt per year, building up from 2004 as follows:
• 2004–0.3 Mt• 2005–0.6 Mt• 2006–1.0 Mt• 2007 ± 1.2 Mt• working costs will be sustained at
R340/t milled; and• total recoveries are expected to be
70 per cent.
D 3 563 2 500 proven 9.1 52 000 000 oz large and 20 Project D has commenced the to and (from bankable contiguous to development of a mine based on a
4 000 probable feasibility study) other large finalized feasibility study. Thereserves, mineralized vertical access shafts have been
with deposits commissioned and ramp-up to full,additional sustainable production levels hasresources begun. The additional key
assumptions for the project are:• 260 Mt of ore reserve will be
mined at a sustainable rate of 3.8Mt per year, building up from 2004as follows:
• 2004–2.2 Mt,• 2005–2.3 Mt,• 2006–2.6 Mt,• 2007–3.3 Mt• 2008 ± 3.8 Mt;• working costs will be sustained at
R455/t milled; and• total recoveries are expected to be
70 per cent.
E 450 800 proven and 9.3 1 519 100 oz remote from 6 Project E has been an operating to probable (from LoM Plan) other mine for a number of years. It is fully
2 000 reserves, mineralized operational and demonstrates with deposits significant face availability and
additional mining flexibility. The additional resources key assumptions for the project are:
• 2.9 Mt of ore reserve will bemined at a sustainable rate of 0.33Mt per year, sustaining the life ofthe mine for another approximately9 years;
• working costs will be sustained atR538/t milled; and
• total recoveries are expected tocontinue at 75 per cent.

Defining value
The Oxford Dictionary defines ‘value’ as: ‘the amount ofmoney something is worth. The attributable value of amineral development may change depending on the valuationmethod applied and the fundamental economic and technicalinputs. Hence, the value of an asset is only valid for a givenpoint in time, and assuming specific economic inputs. Theimpact of changing economic inputs on the technicalparameters of an asset is not linear, since they directly affectmore than one of the following at time:
➤ the pay limit of a mineral asset, leading to higher orlower mining grade of the deposit
➤ the effective economic life of the project➤ attributable costs associated with exploitation (notably
additional development for increased face availabilitymay be required).
Market approach
The market approach of mineral property valuationsencompasses all of the methodologies that rely on databasesof historical mineral property transactions. These databasestabulate the prices at which all previous mineral propertytransactions occurred. Such data provide a benchmarkagainst which current property information and prices can becompared in order to estimate the value of the mineralproperty under question. The transactions referred to includeacquisitions, disposals and mergers. These transactions wereideally completed at arm’s length with the transacting partiesbeing under no compulsion to transact.
Rand per hectare
The rand per hectare valuation method simply links value tothe areal extent of a property and has been used in SouthAfrica for many years. The strength of inferences andassumptions about the nature of the mineralization may varyfrom one metallogenic region to another, and the subjectivityof both the inputs and misinterpretations of the derivedresults means that the method is viewed with someskepticism. Lilford (2002) developed the framework of theso-called Lilford TEM Method that is suitable for valuingmineral properties with limited technical information andprovides ways of circumventing the weaknesses andshortcomings associated with the traditional R/ha method.
In the event that insufficient geological and techno-economic information is available on a mineral property toperform a cash flow analysis, the R/ha method of valuationor equivalent can be considered. This method relies onknowledge about, or the ability to comfortably infer,information on four key input parameters attributable to themineral property, namely:
➤ the depth of mineralization below surface➤ the resource categorization➤ the in situ grade and➤ the proximity of the mineral property to existing
mining activities and assets or other essentialinfrastructure.
It is preferable that detailed knowledge about the depositis available for input into the valuation method, but currentlyno international reporting codes provide standards for thistype of valuation method. With the above information, theproperty’s value is determined using a series of valuationtables and matrices, details of which are provided in Lilford(2002) and are provided below for completeness.
Each of the Projects A to E listed in Table I, was valuedusing the Lilford TEM Method. The results of the valuationsare shown in Table IV.
The values shown in Table IV demonstrate the limitationsof this technique when attempting to attribute value tomineral properties that should be valued using incomeapproach methods. These limitations manifest in under -valuing the more advanced projects. Nevertheless, theresulting comparative values tabled above show the relativevalues of the properties, while showing the explicit values ofProjects A and B, and to a lesser extent Project C.
A comparative study of valuation methodologies for mineral developments
▲31The Journal of The South African Institute of Mining and Metallurgy JANUARY 2005
Market approach: ‘Any approach to value based uponthe use of data that reflect market transactions andreasoning that corresponds to the thinking of marketparticipants.A general way of estimating a value indication for anasset using one or more methods that compare thesubject to similar assets that have been sold.’ (IVS, 2001)
Table II
Valuation matrix for gold mineral properties
Depth below surface Resource category In situ grade Proximity
km points points g/t points points
0.00–0.25 0 Proven 0 0–1 7 Contiguous to HG* 10.25–2.00 1 Probable 1 1–2 6 Adjacent to LG* 22.00–4.00 2 Measured 2 2–3 5 Non-contiguous 34.00–5.00 3 Indicated 2 3–4 4 Remote and large 4+ 5.00 4 Inferred 3 4–5 3 Remote and small 5
Blue sky 4 5–6 26–8 1+8 0
• HG – high grade; • LG – low grade

A comparative study of valuation methodologies for mineral developments
Kilburn method of mineral property valuation
An alternative matrix valuation methodology is the Kilburnmethod. Kilburn (1990) developed a valuation method formineral properties that do not contain exploitable resources.In his opinion there is significantly less objectivity in thevaluation of exploration opportunities than there is formineral properties. Kilburn’s valuation method is a geologicalengineering method based on four broad mineral propertycharacteristics, including:
➤ proximity or location relative to any existing favourablegeological occurrences or properties
➤ volume and grade of mineralization➤ geophysical and geochemical properties associated with
the deposit and their relationship to one another➤ observed geological patterns or sequences representing
mineralization markers, which is indicative of thelikelihood of occurrence of economic mineralization.
The first three factors are common to the Lilford TEMmethod. Nevertheless, using Kilburn’s mineral propertycharacteristics, the categories are subdivided into 19numerically sequential sub-categories (Columns 2 and 5,Table V). Each sub-category is associated with a value factor,as indicated below.
An inherent difficulty in the application of the Kilburnvaluation method rests with the interpretation of the geosci-entific and geotechnical data. Even experienced valuers whodo not have sufficient geological background will finddifficulty in correctly and consistently applying the valuefactors devised by Kilburn. The method has been designedfor use by valuers with a strong geological understanding, arelatively limited group unless appropriate inputs of geosci-entific information can be obtained from other earthscientists. This may be commendable, but value driversextend beyond these parameters. While geological interpre-tation of an orebody is very important, it is not relevantunless other equally important factors, including commodityprices and exchange rates, socio-political and country risk,and financial and legal stability, have been accounted for.These factors have been held constant in the case studycomparisons used in this paper.
▲
32 JANUARY 2005 The Journal of The South African Institute of Mining and Metallurgy
Table III
Determination of applicable value rating
Points Attributable Attributable R/ha summed rating rating applicable
1 1 1 75 0002 2 2 70 0004 3 3 65 000
4 56 0006 4–5 5 47 000
6 40 0009 6–7 7 32 000
8 24 00011 8–9 9 18 000
10 14 00013 10–11 11 11 000
12 8 00015 12–13 13 5 000
14 3 50017 14–15 15 1 500+17 16 16 + 0
Table IV
Values of projects A to E using the Lilford TEM method
Value determination
Project Total Points Rating Unit value (R/ha) Area (ha) Value range (R’000)
A 10 7–8 24 000–32 000 644.341 15 464–20 619B 4 3 65 000 2 584.49 167 992C 5–6 4–5 47 000–56 000 700 32 900–39 200D 3 2–3 65 000–70 000 3 563 231 595–249 410E 4 3 65 000 450 29 250
Table V
The Kilburn valuation matrix
Characters Sub-category Value factor Characters Sub-category Value factor
1 1 1.5 2 11 5.0
1 2 2.0 2 12 6.0–8.0
1 3 2.5 2 13 7.0–8.0
1 4 3.0 2 14 9.0–10.0
1 5 4.0 3 15 2.0
1 6 5.0 3 16 3.0
2 7 1.3 3 17 3.5
2 8 1.5 4 18 2.0
2 9 2.0 4 19 3.0
2 10 3.0
Source: Kilburn, (1990), where:Character 1 = proximityCharacter 2 = volume and gradeCharacter 3 = geophysical and geochemical propertiesCharacter 4 = mineralization markers

Using the Kilburn method of mineral property valuationsfor each of the examples outlined previously, the valuefactors provided in Table VI were determined.
Kilburn gives the base cost per hectare as US$400/ha.Therefore, from the value factors in Table VI, the valuesshown in Table VII are the result.
US Dollar per Ounce
A commonly used valuation methodology in the goldindustry is the US Dollar per ounce (US$/oz) method. Miningcompanies are valued on a ‘per ounce’ basis for geologicallyand geographically diverse mining assets and operations. Thein situ gold content of a property is estimated fromexploration results or interpolated information from adjacentproperties and a US$/oz value is attributed to that property.The US$/oz figure is usually based on recently concludedtransactions in that country or on country-specific valuationmatrices.
Application of the US$/oz rating, requires that each of theprojects in Table I be compared with actual transactions overproperties that most closely reflect their respective character-istics. These characteristics include geographical and jurisdic-tional location, technical attributes and other fundamentalelements of risk and uncertainty. On this basis, values foreach of the projects in Table I are provided in Table VIII.Intuitively, there is an element of subjectivity in determiningthe ideal comparative unit value, and the experience of thevaluer is called to account in this case.
Cost approach
The Uniform Standards of Professional Appraisal Practice(USPAP) is an American code promulgated for appraisingproperty values in the US, although not specifically for thevaluation of mineral properties. Adherence to the USPAPcode is required by various US regulatory bodies andfinancial institutions for property valuations. To demonstratea complete appraisal to these regulating authorities, USPAPdictates that the use of the cost approach valuationmethodology must be considered.
However, use of this approach is often discounted andrejected by valuers of mineral assets in the US because it isconsidered inappropriate for this purpose. A number ofproperty valuation experts believe that the cost approach canonly be used to value improvements on buildings and other
infrastructure and cannot be applied to land (AppraisalInstitute, 1993, p. 197). The definition of land in this caseincludes a mineral deposit. Some appraisers, includingPaschall (1998), only use the cost approach in mineralproperty valuations to determine the values attributable tothe plant and movable equipment on that specific property.Outside the US, Canada and Australia have accepted theappropriateness of the cost approach specifically forexploration properties. The methods have been designed toprovide modifying factors to exploration expenditures thatcompensate for market recognition of value and hence a morescientifically determined mineral property value. Theseadapted methods reflect flexible thinking and application ofthe traditional methods that are categorized by the costapproach.
The cost approach is based on the premise that a mineralproperty is worth at least that meaningful explorationexpenditure incurred as well as the warranted future costsnecessary to improve the geological understanding of thatdeposit (Roscoe, 1999). Emphasis must be on the signif-icance of the exploration. That is, only those past
A comparative study of valuation methodologies for mineral developments
▲33The Journal of The South African Institute of Mining and Metallurgy JANUARY 2005
Table VI
Projects value factors derived from the Kilburnmatrix
Project A B C D E
Characteristic 1 2 4 5 5 5Value factor 2.0 3.0 4.0 4.0 4.0Characteristic 2 9 11 12 12 13Value factor 2.0 5.0 6–8 6–8 7–8Characteristic 3 15 15 16 17 17Value factor 2.0 2.0 3.0 3.5 3.5Characteristic 4 18 19 19 19 19Value factor 2.0 3.0 3.0 3.0 3.0
Table VII
Resulting Kilburn values for projects A to E (US$1 = R8.70)
Project Value / hectare Value (US$’000) Value (R’000)
A 6 400 4 124 35 877B 36 000 9 304 80 946C 100 800 70 560 613 872D 117 600 419 008 3 645 377E 134 400 53 760 467 712
Table VIII
Project values using US$/oz comparatives (US$1 = R8.70)
Project Unit value In situ Value Value (US$/oz) ounces (oz) (US$’000) (R’000)
A 15 621 500 9 323 81 106B 25 1 876 066 46 902 408 044C 40 1 777 300 71 092 618 500D 70 52 000 000 3 640 000 31 668 000E 110 1 519 100 167 101 1 453 779
Cost approach: ‘A comparative appoach to the valueof property or another asset, that considers as asubstitute for the purchase of a given property, thepossibility of constructing another property that is areplica of the original or one that could furnish equalutility with no undue cost due to delay. The valuer‘sestimate is based on the reproduction or replacementcost of the subject property or asset, less total(accrued) depreciation, plus the value of the land towhich an estimate of entrepreneurial incentive ordeveloper’s profit/loss is commonly added.’ (IVS,2001, p. 359)
A comparative study of valuation methodologies for mineral developments
expenditures that are considered reasonable and productiveare retained as value contributors. Productive means that theresults of the work undertaken evidence sufficient encour-agement to warrant further work on that specific deposit. Theadditional work is warranted due to the identification of thepotential for the existence and discovery of an economicmineral deposit. Therefore, the cost approach methodassumes that the amount of exploration expenditure justifiedand justifiable on a mineral property is related to thatproperty’s value. The cost approach is often referred to as theappraised value method, an evaluation technique more fullyexplained by Agnerian (1996a) and Lawrence (1989, 1998).
Multiples of exploration expenditure
A number of proposed mineral property transactions havebeen considered and concluded based on a multiples ofexploration expenditure quantum. From these expenditures,an indicative value is determined and a transaction priceagreed upon. Baxter and Chisholm (1990) and Buttler (1991)consider the use of the multiples of exploration expendituremethod of valuation as an acceptable approach to mineralproperty valuations. However, they emphasize that thismethod is acceptable provided that only expenditure relevantto significant exploration is included, and that the quality ofthe exploration work is considered to be of a minimumstandard.
In this valuation approach, the original owner of theproperty in question wishes to at least recover his explorationoutlay expended on the property. The owner in this instancemay also be an option-holder with certain rights to theproperty, potentially being exploration rights. This owner,other than recouping his exploration capital, ideally wishes tosecure a premium to that capital outlay. In addition, theowner will also include some further value that can beassociated with additional, warranted explorationexpenditure necessary to enhance the geologicalunderstanding of that property. These warranted future costscomprise a reasonable exploration budget to test the potentialof the property.
It has been suggested that if additional exploration workdowngrades potential, it is not productive and shouldtherefore not be incorporated for valuation purposes (Roscoe,1999). This has to be challenged. Not all exploration willintersect additional mineralization on a property, nor will itnecessarily enhance the inherent value of a mineraloccurrence. However, exploration will generally assist indelineating the mineral occurrence, yielding additionalinformation on the size, depth, orientation and other physicalattributes of the deposit and the surrounding strata. Thislatter point is important in determining the competency of thesurrounding country rock that may be relied on in the eventthat exploitation is considered. Some of this so-called non-productive exploration work may actually be more valuablethan other exploration work that only targets the mineralizedzone on the property.
Therefore, it is important to discern what explorationwork is productive, even though it may downgrade a mineralproperty’s potential, and what exploration work is truly non-productive. Only the non-productive efforts must bediscarded and not considered for valuation purposes.
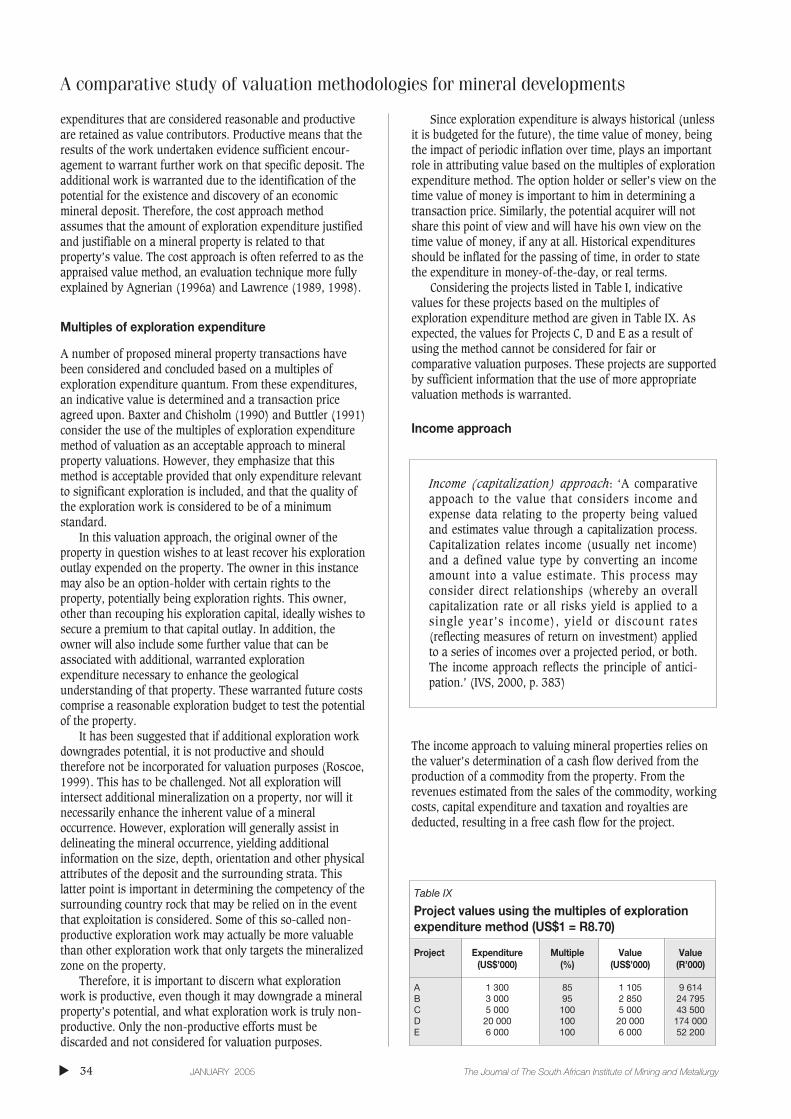
Since exploration expenditure is always historical (unlessit is budgeted for the future), the time value of money, beingthe impact of periodic inflation over time, plays an importantrole in attributing value based on the multiples of explorationexpenditure method. The option holder or seller’s view on thetime value of money is important to him in determining atransaction price. Similarly, the potential acquirer will notshare this point of view and will have his own view on thetime value of money, if any at all. Historical expendituresshould be inflated for the passing of time, in order to statethe expenditure in money-of-the-day, or real terms.
Considering the projects listed in Table I, indicativevalues for these projects based on the multiples ofexploration expenditure method are given in Table IX. Asexpected, the values for Projects C, D and E as a result ofusing the method cannot be considered for fair orcomparative valuation purposes. These projects are supportedby sufficient information that the use of more appropriatevaluation methods is warranted.
Income approach
The income approach to valuing mineral properties relies onthe valuer’s determination of a cash flow derived from theproduction of a commodity from the property. From therevenues estimated from the sales of the commodity, workingcosts, capital expenditure and taxation and royalties arededucted, resulting in a free cash flow for the project.
▲
34 JANUARY 2005 The Journal of The South African Institute of Mining and Metallurgy
Income (capitalization) approach: ‘A comparativeappoach to the value that considers income andexpense data relating to the property being valuedand estimates value through a capitalization process.Capitalization relates income (usually net income)and a defined value type by converting an incomeamount into a value estimate. This process mayconsider direct relationships (whereby an overallcapitalization rate or all risks yield is applied to asingle year’s income), yield or discount rates(reflecting measures of return on investment) appliedto a series of incomes over a projected period, or both.The income approach reflects the principle of antici-pation.’ (IVS, 2000, p. 383)
Table IX
Project values using the multiples of explorationexpenditure method (US$1 = R8.70)
Project Expenditure Multiple Value Value (US$’000) (%) (US$’000) (R’000)
A 1 300 85 1 105 9 614B 3 000 95 2 850 24 795C 5 000 100 5 000 43 500D 20 000 100 20 000 174 000E 6 000 100 6 000 52 200
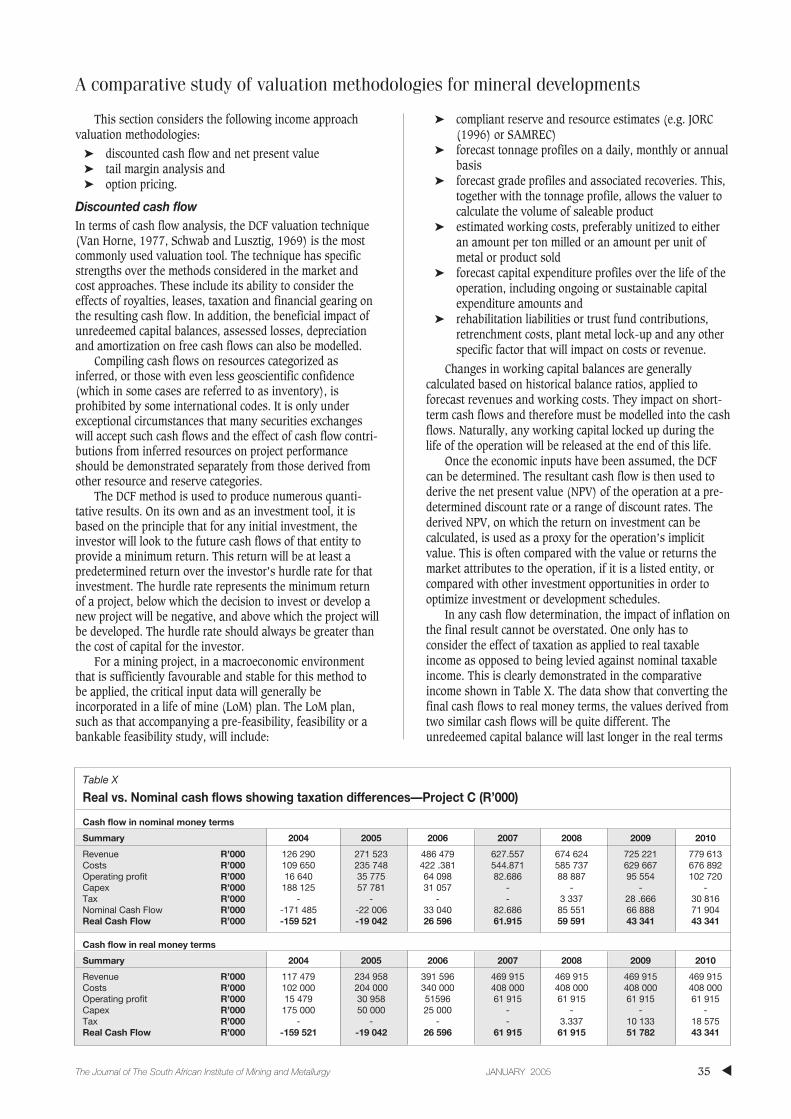
Table X
Real vs. Nominal cash flows showing taxation differences—Project C (R’000)
Cash flow in nominal money terms
Summary 2004 2005 2006 2007 2008 2009 2010
Revenue R’000 126 290 271 523 486 479 627.557 674 624 725 221 779 613Costs R’000 109 650 235 748 422 .381 544.871 585 737 629 667 676 892Operating profit R’000 16 640 35 775 64 098 82.686 88 887 95 554 102 720Capex R’000 188 125 57 781 31 057 - - - -Tax R’000 - - - - 3 337 28 .666 30 816Nominal Cash Flow R’000 -171 485 -22 006 33 040 82.686 85 551 66 888 71 904Real Cash Flow R’000 -159 521 -19 042 26 596 61.915 59 591 43 341 43 341
Cash flow in real money terms
Summary 2004 2005 2006 2007 2008 2009 2010
Revenue R’000 117 479 234 958 391 596 469 915 469 915 469 915 469 915Costs R’000 102 000 204 000 340 000 408 000 408 000 408 000 408 000Operating profit R’000 15 479 30 958 51596 61 915 61 915 61 915 61 915Capex R’000 175 000 50 000 25 000 - - - -Tax R’000 - - - - 3.337 10 133 18 575Real Cash Flow R’000 -159 521 -19 042 26 596 61 915 61 915 51 782 43 341
This section considers the following income approachvaluation methodologies:
➤ discounted cash flow and net present value➤ tail margin analysis and➤ option pricing.
Discounted cash flowIn terms of cash flow analysis, the DCF valuation technique(Van Horne, 1977, Schwab and Lusztig, 1969) is the mostcommonly used valuation tool. The technique has specificstrengths over the methods considered in the market andcost approaches. These include its ability to consider theeffects of royalties, leases, taxation and financial gearing onthe resulting cash flow. In addition, the beneficial impact ofunredeemed capital balances, assessed losses, depreciationand amortization on free cash flows can also be modelled.
Compiling cash flows on resources categorized asinferred, or those with even less geoscientific confidence(which in some cases are referred to as inventory), isprohibited by some international codes. It is only underexceptional circumstances that many securities exchangeswill accept such cash flows and the effect of cash flow contri-butions from inferred resources on project performanceshould be demonstrated separately from those derived fromother resource and reserve categories.
The DCF method is used to produce numerous quanti-tative results. On its own and as an investment tool, it isbased on the principle that for any initial investment, theinvestor will look to the future cash flows of that entity toprovide a minimum return. This return will be at least apredetermined return over the investor’s hurdle rate for thatinvestment. The hurdle rate represents the minimum returnof a project, below which the decision to invest or develop anew project will be negative, and above which the project willbe developed. The hurdle rate should always be greater thanthe cost of capital for the investor.
For a mining project, in a macroeconomic environmentthat is sufficiently favourable and stable for this method tobe applied, the critical input data will generally beincorporated in a life of mine (LoM) plan. The LoM plan,such as that accompanying a pre-feasibility, feasibility or abankable feasibility study, will include:
➤ compliant reserve and resource estimates (e.g. JORC(1996) or SAMREC)
➤ forecast tonnage profiles on a daily, monthly or annualbasis
➤ forecast grade profiles and associated recoveries. This,together with the tonnage profile, allows the valuer tocalculate the volume of saleable product
➤ estimated working costs, preferably unitized to eitheran amount per ton milled or an amount per unit ofmetal or product sold
➤ forecast capital expenditure profiles over the life of theoperation, including ongoing or sustainable capitalexpenditure amounts and
➤ rehabilitation liabilities or trust fund contributions,retrenchment costs, plant metal lock-up and any otherspecific factor that will impact on costs or revenue.
Changes in working capital balances are generallycalculated based on historical balance ratios, applied toforecast revenues and working costs. They impact on short-term cash flows and therefore must be modelled into the cashflows. Naturally, any working capital locked up during thelife of the operation will be released at the end of this life.
Once the economic inputs have been assumed, the DCFcan be determined. The resultant cash flow is then used toderive the net present value (NPV) of the operation at a pre-determined discount rate or a range of discount rates. Thederived NPV, on which the return on investment can becalculated, is used as a proxy for the operation’s implicitvalue. This is often compared with the value or returns themarket attributes to the operation, if it is a listed entity, orcompared with other investment opportunities in order tooptimize investment or development schedules.
In any cash flow determination, the impact of inflation onthe final result cannot be overstated. One only has toconsider the effect of taxation as applied to real taxableincome as opposed to being levied against nominal taxableincome. This is clearly demonstrated in the comparativeincome shown in Table X. The data show that converting thefinal cash flows to real money terms, the values derived fromtwo similar cash flows will be quite different. Theunredeemed capital balance will last longer in the real terms
A comparative study of valuation methodologies for mineral developments
▲35The Journal of The South African Institute of Mining and Metallurgy JANUARY 2005

A comparative study of valuation methodologies for mineral developments
case, incorrectly enhancing the value of the same project. Thereal cash flow lines in Table X must be compared torecognize the impact of taxation on real and nominal cashflows.
As a result of the difficulty in obtaining agreement onappropriate inflation forecasts to use in the specific valuationof a project, valuers often exclude a forecast on inflationrates. This in itself may be construed as an inflationassumption, in that inflation is taken to be zero per cent peryear. However, this reflects an ideal world, which isunrealistic.
Cash flow values compiled for each of the mineraldevelopment Projects A to E (in Table I) are shown in Table XI. The uncertainties associated with Project A makeany analysis of cash flows for this project questionable, andconsequently no DCF analysis has been compiled for ProjectA. The results of the DCF NPV analyses for each of theremaining projects, indicating their calculated discount rates,are considered in the Table XI.
The values estimated for Projects A to E in Table XI arenot comparable if the same discount rate is used for eachproject. This is in spite of the argument that ideally technicalrisks or uncertainties are not included in a discount rate butare rather taken into consideration through sensitivityanalyses. An exception to this preference in Table XI prevailsbecause the results are for comparative purposes. As a resultof additional risk analysis, the recommended discount ratesand associated values for each of the projects are highlightedin bold in Table XI.
Tail margin method
An extension of the DCF NPV method of valuation led to thedevelopment of the tail margin valuation method (Lilford,2002). Before applying this method, consider that a LoM planor mining profile can be estimated with a degree of certaintysince it is based on mineral reserves. However, the miningprofile does not consider the exploitation of the total mineralresource. Alternatively, in the event that mineral rights are tobe valued, these rights must be located adjacent to orcontiguous with an existing mining operation. This will allowa valuer to infer critical assumptions regarding its operatingparameters.
Once the cash flow profile of an existing operation hasachieved a steady state, the free cash flow is unitized to aUS$/oz rate or any other commodity related unit. Steadystate refers to the operation working within sustainable,stable levels in terms of production, working costs, capitalexpenditure, working capital and taxation. For applicationpurposes, steady state can be taken as being a three– to five-year period, in which the margin does not vary by more than20 per cent between the two end periods and by no morethan 10 per cent between two successive years.
The unit annual rates are calculated over a pre-determined steady-state period and then averaged to reflect asingle, deflated and discounted unit rate. Cash flows fromthese periods are deflated to real money terms anddiscounted at an appropriately determined discount rate. Aunit rate is then applied to the metal units, being theanticipated tail kilograms or ounces that fall outside the LoMprofile. Estimates of the recoverable metal units are based onthe operation’s existing mining and metallurgical factors.
The tail margin valuation method can be applied inalmost any circumstance. However, it is marginally restrictedin mineral properties valuations, although not as a result ofthe commodity type. The method tends to be restricted to oneor more of the following:
➤ where the resources of an operation are so vast that aDCF analysis can only effectively value a portion of thelife of the asset. The impact of the discount rate in theoperation’s later years is value restrictive, or moreaccurately, the discount rate diminishes additive valueover time
➤ where a LoM plan does not consider the exploitation ofthe entire resource base of an existing miningoperation or exploration area
➤ the valuation of an area of mineral rights where theadjoining property is being exploited. The adjoiningoperation will have sufficient data available for avaluer to compile a DCF analysis and hence determinean applicable unit value rating. This rating (assumingthat a competent person considers the assets to besignificantly similar) can then be applied to the mineralrights area
➤ a mineral deposit, through interpolation owing to itssimilarity in certain key aspects to an existingoperation or project. The operation does not necessarilyhave to be located near to the mineral property inquestion. However, its attributes must be similar tothose of the mineral rights area.
Furthermore it is unlikely that the full extent of themineral resources that could be exploited will be correctlyestimated at the time of the feasibility study. The orebody onwhich the initial operation is established is likely to representonly a portion of what might be exploited by the time theoperation is finally closed. In this case mineral productionbeyond the expected ‘life of mine’ at the feasibility stage isexpected to be sourced from new orebodies or extensions ofthe same orebody. Continued mineral extraction from newextensions to known orebodies would have to be servicedthrough existing infrastructure or, in the case of newdiscoveries that are economic, the development of newinfrastructure. As a result, a LoM is drawn up. The conceptgives assent to the uncertainty inherent in any estimation ofthe resource-reserve base and the axiom that knowledgeobtained during exploitation may add mineral resources andmineral reserves to the LoM plan. This would be particularlysignificant when exhaustion of mineral reserves in anoperating mine is imminent and the late discovery ofmineralized extensions (the tail margin) adds value and lifeto the mine. It is this particular event that the tail marginmethod of valuation seeks to address.
▲
36 JANUARY 2005 The Journal of The South African Institute of Mining and Metallurgy
Table XI
DCF NPV results for projects A to E (R’000)
Real Project Project Project Project Projectdiscount rate A B C D E
8% - 699 284 55 902 3 821 678 491 6509% - 605 036 45 741 3 514 174 473 63410% - 519 483 36 353 3 275 268 456 56711% - 441 804 27 673 3 087 152 440 38712% - 371 259 19 645 2 937 284 425 03913% - 307 183 12 214 2 816 706 410 468

In the event that an orebody is not geologically uniform,the lease area may have to be treated as two or more separatevaluation blocks. Each block will be accredited a sustainableunit value per volume of product. Again the experience andsapiential geological knowledge of the valuer (competentperson) will affect the valuation.
Table XII shows simplistically how the tail marginanalysis works, based on Project C. However, in thisexample, no cognizance has been taken of the impact ofdiscount rates on value over time. That is, the margin hasbeen determined for an effective zero discount rate.
It is not necessary to replicate the entire cash flowsshown in Table XII to demonstrate the impact on values ofdiscounting the unit margins. Table XIII below shows thetotal discounted values at different discount rates, being thecash flow NPV plus the discounted tail margin value, bothdiscounted at the same real rate over time for Project C.
Without repeating the previous discussions, the values ofthe projects discussed previously are tabled below. As withthe DCF NPV method, no calculated value for Project A can bederived as a result of insufficient available technicalinformation on the project.
Although sufficient information exists to compile avaluation of Project B, insufficient reserves and resourcesexist for the tail margin method to be applied. On a DCF NPVbasis, the project’s life is determined to be only three years ofproduction, with a five-year lead time. That is, the life of theproject is eight years, five years for construction and commis-sioning and the remaining three years for gold production.
Project C’s value calculations are discussed in theprevious paragraphs. For Projects D and E, the samediscussions apply but the values differ. Therefore, for
completeness, the Tables XV and XVI show the more detailedcalculated results for the values of Projects D and E. The DCFcolumn reflects discounted values for the project’s goldproduction contained within the LoM Plan. The $/oz columnshows the estimated real, discounted tail margin for theproject. The $’000 and the R’000 columns are the estimatedvalues of the remaining gold excluded from the DCF values,and the final column is the overall project value i.e. the valueof the cash flow and the tail value combined.
Option pricing valuation methodology using Black-Scholes
The theory surrounding option pricing was introduced in1900, when the French mathematician, Louis Bachelier,developed an option pricing formula in his thesis. From thistime onwards, a number of researchers have contributed tothis valuation theory (Cootner, 1964). Modern option pricing(Hull, 1997) is often accomplished by means of applying theBlack–Scholes model (Black and Scholes, 1973). Kwok(1997), however, suggests that analysts have encounteredproblems with this pricing technique and in his work,recommends other option-value alternatives.
Option pricing theory provides an invaluable tool formineral properties and project valuations since it reflects theproperty’s implicit option value. This value is dependent onthe property’s gearing to commodity (and currency) pricechanges. The methodology also, more importantly, assists inthe evaluation of investment options and decisions. Optionpricing and many of its real option adaptations modelflexibility within a project. Flexibility reflects the ability ofmanagement to:
A comparative study of valuation methodologies for mineral developments
▲37The Journal of The South African Institute of Mining and Metallurgy JANUARY 2005
Table XII
Tail margin valuation, excluding effects of discount rate—project C

➤ temporarily close a mine or a section of a mine➤ optimize shareholder and stakeholder returns by
selectively mining high grade, low grade or acombination of sections
➤ defer production from sections or the entire operation➤ abandon the mining operation.
For a gold-hosting property, in terms of using the Black-Scholes method of valuation for a mineral property, the goldprice can be considered to follow a Markov process. This is aparticular type of stochastic process where only the presentvalue of the gold price (or any other variable such as another
commodity) is relevant for predicting the future price. In astochastic process, the gold price (or any such variable)changes over time in an uncertain way. That is, theprediction of future prices is not dependent on past prices butrather on the current price. Since the gold price is reflected inUS dollar terms, it is the US dollar gold price that must beconsidered in option pricing for gold-hosting mineralproperties. The US dollar gold price is a stochastic variable.
The basis of valuation using the option pricing techniquedepends on the establishment and accuracy of the DCFvaluation model. The principle of the technique’s application
Table XV
Tail margin valuation calculations – Project D
% DCF $/oz $’000 R’000 Total (R’000)
0 4 573 817 41.25 1 703 525 14 820 668 19 394 4841 4 243 561 24.35 1 005 346 8 746 513 12 990 0742 3 961 417 14.44 596 402 5 188 701 9 150 1193 3 720 002 8.61 355 611 3 093 819 6 813 8214 3 513 135 5.16 213 099 1 853 962 5 367 0975 3 335 632 3.11 128 326 1 116 439 4 452 0716 3 183 135 1.88 77 649 675 549 3 858 6847 3 051 974 1.14 47 207 410 703 3 462 6768 2 939 048 0.70 28 833 250 847 3 189 8959 2 841 736 0.43 17 691 153 909 2 995 64510 2 757 817 0.26 10 903 94 854 2 852 67111 2 685 402 0.16 6 749 58 715 2 744 11812 2 622 888 0.10 4 196 36 502 2 659 38913 2 568 904 0.06 2 619 22 788 2 591 69214 2 522 283 0.04 1 642 14 286 2 536 56915 2 482 023 0.03 1 034 8 993 2 491 016
Table XVI
Tail margin valuation calculations – Project D
DCF $/oz $’000 R’000 Total (R’000)
0 577 788 76.82 24 120 209 842 787 6301 556 060 70.24 22 054 191 867 747 9272 535 485 64.28 20 182 175 587 711 0723 515 990 58.88 18 486 160 827 676 8174 497 503 53.97 16 946 147 432 644 9365 479 962 49.52 15 548 135 266 615 2286 463 305 45.47 14 276 124 205 587 5107 447 479 41.79 13 120 114 140 561 6198 432 431 38.43 12 066 104 973 537 4049 418 115 35.37 11 105 96 617 514 73210 404 487 32.58 10 229 88 994 493 48011 391 503 30.03 9 429 82 033 473 53612 379 129 27.70 8 698 75 671 454 80013 367 328 25.57 8 029 69 853 437 18114 356 066 23.62 7 417 64 528 420 59415 345 313 21.84 6 856 59 650 404 964
A comparative study of valuation methodologies for mineral developments
▲
38 JANUARY 2005 The Journal of The South African Institute of Mining and Metallurgy
Table XIII
Tailing margin valuation, including effects of discount rate—Project C
Discount rate % Margin value (R.oz) Total value (R’000) Discount rate (%) Margin value (R/oz) Total value (R’000)
0 290 175 407 12 259 101 5541 287 167 150 13 257 97 3152 285 159 365 14 255 93 2903 282 152 021 15 252 89 4684 279 145 087 16 250 85 8355 276 138 536 17 248 82 3826 274 132 345 18 246 79 0977 271 126 490 19 244 75 9718 269 120 949 20 242 72 9959 266 115 703 21 240 70 16010 264 110 733 22 238 67 45811 262 106 022 23 236 64 883
Table XIV
Tail margin valuation results for projects A to E (R’000)
Project A Project B Project C Project D Project E
Ounces in tail - - 559 863 41 294 421 313 972Tail margin (0%) - - $33.3/oz $41.3/oz $76.8/oz
Cash flow discount rate (real)8% - - 132 988 3 189 895 537 4049% - - 129 122 2 995 645 514 73210% - - 125 508 2 852 671 493 48011% - - 122 128 2 744 118 473 53612% - - 118 968 2 659 389 454 800

lies in the acknowledgement that a mineral property whichhosts an exploitable commodity or mineral, whethereconomic or not, must possess an option value. Even if thespot price was so low that the property has a negative NPV,the property is likely to have a positive value at a highercommodity price. The property therefore possesses anintrinsic value that is correlated to the commodity price andtherefore has an option value.
An option is a contract that gives the holder the right, butnot the obligation, to buy or sell a commodity or stock at aspecific future date (European option) at a pre determinedprice, or at a specific price over a period of time (Americanoption). This suggests that any deposit hosting a metal orcommodity can at least be attributed some value on the basisof a contract or option. That is, a mineral deposit will have animplicit in situ value based on the expectation that it will beexploited at a future date, assuming that the price of themineral improves or local currency depreciates. The future-dated contract is tantamount to an option contract.
For example, a mineral project requires an initialdevelopment capital amount of US$150 million, but owing touncertainties in metal prices and other factors at the time ofthe investment, may return either US$250 million or onlyUS$40 million. According to traditional valuation methods,the net value of the project is either a profit of US$100million or a loss of US$110 million. Assuming an equallikelihood for each outcome, the expected value of the projectis negative US$10 million. However, if the capital investmentdecision can be delayed, the expected value of the project willchange. That is, if the metal price is lower than at the timethe decision was taken to potentially develop the project, theproject will not be developed. The reciprocal is true.Therefore, the value of the project is represented by the valueof an option to develop a project worth US$100 million with a50 per cent probability.
Options valuations focus on the value attributable toflexibility. Valuation techniques that ignore the valueassociated with the optionality of a mineral property tend toundervalue the property. This is because these methods donot take into consideration the additional value of flexibilityin the face of future uncertain events.
Clearly then, in the event that two mineral projects areidentical, except that one has greater operational flexibility,the more flexible project will have greater value. The reasonfor this is that the more flexible project enables the owner toreact to impending events in ways that will enhance theproject’s value or at least minimize its potential losses. These
actions may include targeting higher grade areas of mineral-ization, considering the reprocessing of waste dumps orslimes dams that still contain economic grades, closingmarginal sections of the operation, or slowing down capitaldevelopment or expenditure. With the less flexible operation,the owner has little opportunity to alter the course of theproject in the event of inherent challenges, such as acommodity price decrease.
To introduce basic option pricing theory, anunderstanding of the Black-Scholes formula is required. Theformula is the result of extensive research conducted byFischer Black and Myron Scholes in the early 1970s on non-dividend paying stocks. The principle of a non-dividendpaying stock can be extended to include mineral propertiesvaluations for the following reasons:
➤ the lead time to a mineral property being brought intoproduction tends to be long, typically more than twoyears for a near-surface deposit or at least six years fora deeper deposit. A long lead time, during which nodividends will be paid, will invariably cover the optionterm
➤ mining operations will typically reinvest in exploration,refurbishment, expansions, etc., rather than pay outfree cash as dividends and
➤ once commissioned, the mining operation will stillrequire repaying outstanding loans or may still beexposed to capital commitments, thus restricting thepayment of dividends to beyond the option term.
Unfortunately, the Black-Scholes option pricing formularelies on certain assumptions, or shortfalls, being:
➤ interest rates remain constant over the option periodand are known
➤ the returns on the mineral properties are lognormallydistributed and
➤ the volatility of the returns is constant.
The assumptions may not always be valid under allcircumstances for which the Black-Scholes option pricingformula is used and the valuer should be aware of theselimitations.
For our examples, as with DCF and tail marginvaluations, the fact that a reliable cash flow cannot bedetermined for Project A renders the option pricing methodunreliable and questionable for this project. Each of the otherprojects can be valued using option pricing theory, the resultsfor which are tabled below.
A comparative study of valuation methodologies for mineral developments
▲39The Journal of The South African Institute of Mining and Metallurgy JANUARY 2005
Table XVII
Option pricing values for projects A to E
Real discount rate (%) 5-yr strike price (R/kg) Optioned gold (kg) Delta * Value (R’000)
Project A N/A N/A N/A N/A N/AProject B 12 101 194 60 317 0.22498 612 308Project C 10 137 535 40 000 0.41990 458 326Project D 9 99 306 1 727 409 0.03260 2 596 002Project E 8 81 895 33 075 0.37483 683 696
• Delta is the proportionality constant

A comparative study of valuation methodologies for mineral developments
Conclusion
The most fundamental limitation governing all valuationmethodologies rests with the valuer. The ability to correctlyinterpret all of the available information in order to select apreferred valuation methodology is important. Once thevaluer has received the information, he/she must be aware ofthe shortfalls of each of the methods available for use. Ofcourse, new methods can be developed, but they are noteasily motivated to acceptance by the valuation fraternity atlarge.
The market approach relies on historical mineral propertytransactions in order to provide a best estimate for thecurrent value of a property. The most widely acceptedvaluation methodologies within this approach include thevalue per unit methods, which are the rand per property,rand per hectare and Lilford TEM method, Kilburn, US$ perounce, market capitalization per ounce and comparable assetvaluation methods.
The cost approach is one of the most simple valuationapproaches available. It relies on the premise that the valueof a property must be worth at least that amount expendedon the property to achieve a certain level of geologicalunderstanding. Owing to its simplicity, the approach ignoresmany of the critical value drivers inherent in any mineralproperty. The two important methodologies here are themultiples of exploration expenditure and the farm-in analysismethods.
The income approach presents the most widely used andunderstood valuation methodologies available to valuers. Thebasis for many of the specific methods under this heading is
the discounted cash flow method. With the correct discountrate, the DCF method assists the developer in the consider-ations for commencing the development of a project,extending the life of a project or/and expanding the size of aproject. Of course, financiers and other stakeholders can alsoconsider DCF valuations for their specific purposes. With thisas a base, sensitivity analyses and simulation analyses canbe conducted to assess the robustness of a project underdifferent scenarios. Furthering the strengths of DCF methods,the tail margin and option pricing methods of valuation arenoted.
The technological advances witnessed over the past twodecades have assisted in making the use of previouslyuntenable valuation methods more appreciated. Both thebinomial method of mineral property analysis and the MonteCarlo simulation method have now become reliant oncomputers for their use. It is not difficult to appreciate whythis is the case.
It must be acknowledged that valuation methodologiesare not typically black boxes that anyone can use to generatean answer. Experienced valuers are armed with theknowledge of best practice and therefore will select the mostapplicable methodologies as required. They may also altermethodologies to suit specific circumstances, but will have tobe able to justify their deviances from the norm. To providesome guiding principles on the selection of a methodology, Table XVIII shows the fundamental factors required for eachapplication.
For ease of comparison, Table XIX below collates theresults of the valuation methodologies contemplated in this
▲
40 JANUARY 2005 The Journal of The South African Institute of Mining and Metallurgy
Table XVIII
Key value drivers for mineral property valuations
Methodology Commodity Exchange Technical Economic Comparative Uncertaintyprices rate information information transactions risk
DCF NPV � � � � × �
Differential discounting � � � � × �
Tail margin � � � � × �
Real options × × � � × ×
Black–Scholes option pricing × × � � × ×
Binomial tree � � � � × �
Monte Carlo simulation � � � � × �
Lilford TEM × × � × � ×
US$/oz × × � × � ×
Exploration expenditure × × � × × ×
Farm-in analysis � � � � × ×
Table XIX
Values of projects A to E compared by valuation methodology
Values (R’millions)Project Kilburn US$/oz MEExp DCF NPV Tail Margin Option Pricing Lilford TEM
A 35.9 81.1 9.6 - - - 20.6B 80.9 408.0 24.8 371.312% - 612.312% 168.0C 613.9 618.5 43.5 36.410% 125.510% 458.310% 39.2D 3 645.4 31 668.0 174.0 3 514.29% 2 995.69% 2 596.09% 249.4E 467.7 1 453.8 52.2 491.78% 537.48% 683.78% 29.25
xxx.x n% indicates the real discount rate used in the cash flowMEExp is the Multiples of Exploration Expenditure method

report, cognizance being given to those methodologies thatare inappropriate for the specific examples outlined.
In Table XIX, the recommended valuation methodologiesfor each of the projects are highlighted in bold. It is necessaryagain to iterate the importance of the valuer’s valuationexperience in ensuring that the most applicable valuationmethodologies are considered for valuation undertakings.
References
AGNERIAN, H. 1996. Survey of Mineral Property Transactions July 1994 to June1996. Canadian Mining Journal, July 1996.
APPRAISAL INSTITUTE. The Dictionary of Real Estate Appraisal. ThirdEdition, Chicago, Illinois. 1993.
BAXTER, J.L. and CHISHOLM, J.M. Valuation reflections. The AusIMM Bulletin, vol. 3, 1990. pp. 22–26.
BLACK, F. and SCHOLES, M. The Pricing of Options and Corporate Liabilities,Journal of Political Economy, vol. 81, May–June, 1973. pp. 637–654.
COOTNER, P.H. The Random Character of Stock Market Prices, M.I.T. Press,Cambridge, 1964. 1964. pp. 1–129.
HULL, J.C. 1997. Options, Futures and Other Derivatives, Prentice-Hall, NewJersey.
IVS, 2001. INTERNATIONAL VALUATION STANDARDS. http://www.ivsc.org/pubs/IVS2001.html
JORC. Australian Code for Reporting of Identified Mineral Resources and OreReserves, issued by the Joint Ore Reserve Committee (JORC), comprising
Australasian Institute of Mining and Metallurgy (AusIMM), AustralianInstitute of Geoscientists (AIG) and Minerals Council of Australia (MCA),July, 19 p. (AusIMM, Melbourne). 1996.
KILBURN, L.C. Valuation of Mineral Properties which do not Contain ExploitableReserves, CIM Bulletin, vol. 83, pp. 90–93, August 1990.
Kwok, Y. Mathematical Models of Financial Derivatives, Springer Finance,Singapore. 1998.
LAWRENCE, R.D. Valuation of Mineral Assets: Accountancy or Alchemy? Paperpresented at CIM Annual General Meeting, Quebec, 2, May 1989.
LAWRENCE, R.D. Valuation of Mineral Assets: An Overview. Paper presented aspart of a course for the Geological Association of Canada and theProspectors and Developers Association of Canada, 17, May 1998.
LILFORD, E.V. Methodologies in the Valuation of Mineral Rights. Project Reportsubmitted to the Faculty of Engineering, University of the Witwatersrand,Johannesburg 2002.
LILFORD, E.V. Advanced Considerations, Applications and Methodologies in theValuation of Mineral Properties. Doctoral thesis submitted to the Facultyof Engineering and the Built Environment, University of theWitwatersrand, Johannesburg 2004.
PASCHALL, R.H. Appraisal of Construction Rocks. Second Edition, AmericanInstitute of Professional Geologists, Arvada, Colorado. 1998.
ROSCOE, W.E. The Valuation of Mineral Properties for Compensation.Presentation to the British Colombia Expropriation Society, Fall Seminar,Vancouver, October 1999.
SCHWAB, B. and LUSZTIG, P. A Comparative Analysis of the Net Present Valueand the Benefit-Cost Ratio as Measures of the Economic Desirability ofInvestments, Journal of Finance, 24 June 1969, pp. 507–511.
VAN HORNE, J. Financial Management and Policy, Fourth Edition, Prentice/HallInternational editions, 1977, pp. 84–95, pp. 197–225. ◆
A comparative study of valuation methodologies for mineral developments
▲41The Journal of The South African Institute of Mining and Metallurgy JANUARY 2005

▲
42 JANUARY 2005 The Journal of The South African Institute of Mining and Metallurgy
Ms May Hermanus—Chief Inspector of Mines,distinguished guests, CSIR mining technology staff.Good morning. Thank you for joining us thismorning and for taking the time to share this specialcelebration with us.
The mining industry in South Africa is unique. Ithas its own set of ever-growing challenges thatmake it a tough, extremely competitive, and yet veryexciting place to be.
Amidst all the highs (such as the gold price), thelows (the rand/dollar exchange rate), and themergers and takeovers (some welcomed, some not…), it is reassuring for us at CSIR MiningTechnology to be able to pause for a moment andreflect on something that has remained constant,unchanging, for the past 100 years, somethingwhich we have helped to create and sustain for acentury in South African mining.
I refer to the event today that celebrates 100years of ensuring safe mine hoisting, through thestatutory testing of steel wire rope.
It might not sound as exciting as some of thecurrent mining issues being covered in the press, butit is a success record of which CSIR MiningTechnology—and the industry as a whole—can bevery proud.
I joined the CSIR Mining Technology team in Julyof this year, after many years within the industry,because I believe this organization has a critical,strategic role to play in the transformation and long-term success of South African mining companies.
Our vision is to be the national centre ofexcellence for mining and mining-related researchand development. With facilities like Cottesloe—which is among the best in the world and one ofonly two of its kind in South Africa—we are wellpositioned to provide the services and in-depthsolutions that the South African mining industry sodesperately needs.
To date, research for the mining industry hasbeen reactive, and usually in response to a disaster.At CSIR Mining Technology, we intend raising the
profile of research into a boardroom issue, as muchpart of mining company’s strategy as budgeting andbeneficiation.
Today’s celebration represents one of the manyways in which CSIR Mining Technology iscontributing to the safety, cost-effectiveness andcompetitive edge of South African mining. But thisevent also represents an important turning point forour team: the needs of the local mining industry arechanging, and CSIR Mining Technology is rising tothis challenge.
We are recreating ourselves as the premiermining research facility in South Africa and Africa,focusing on critical strategic research for surface andunderground mining. We also have a wealth ofunique experience and skill to create world-classsolutions that will ensure the safety, health, produc-tivity and sustainability of the industry. Throughpartnerships and collaborative programmes withgovernment, science councils and the public andprivate sectors, CSIR Mining Technology is bringingtogether the knowledge, skills and research talentneeded to increase the true value—and life span—ofSouth Africa’s natural resources. I foresee CSIRMining Technology playing a greater, more proactivenational role in the years ahead—a role in which ourstrategic research, through facilities such as thisone—will help to ensure that emerging andtraditional stakeholders remain globally competitive.
Today’s event will showcase some of theachievements and successes of this facility over thepast 100 years. It will also introduce you to therenewed energy, commitment and strategic intent ofour organization.
Welcome to all of you. I trust you will find todayenjoyable, and enlightening.
Thank you �
Issued by: Sophia Dower, Words’WorthPublishing consultants, Tel: 011 381-777
Hoist rope testing centenary celebration:welcoming address*