a comparative study: taxonomic grouping of … · -pcr, box-pcr). these different techniques...
TRANSCRIPT

Polish Journal of Microbiology2017, Vol. 66, No 1, 39–56
ORIGINAL PAPER
* Corresponding author: C. Cokmus, Konya Food and Agriculture University, Dede Korkut Mahallesi, Beyşehir, Meram, Konya, Turkey; e-mail: [email protected]
Introduction
Alkaliphilic bacteria, which are also called as extre-mophiles, can grow at high pH conditions. They split into two groups as alkaliphiles and alkalitolerants. While alkaliphiles grow optimally at pH 9.0 and also at higher alkaline conditions like pH 10.0, they cannot grow at or below pH 7.0. On the other hand, alkalotolerants can grow both at high (like pH 10.0) and neutral pH values. The enzymes of these alkaliphilic bacteria have a high demand for many industrial branches due to their sta-bility at high pH values (Horikoshi, 1999; Kumar and Takagi, 1999). Of these enzymes, alkaline proteases take the lead and have been used in many areas such as deter-gent, medicine, food, leather, pharmaceuticals, biologi-cal waste elimination and textile industry. Alkaliphilic Bacillus strains, which are one of the well-known and well-studied alkaline protease producers, secrete very stable alkaline proteases against pH, temperature, and detergent additives (Ito et al., 1998; Horikoshi, 1999). In many countries, obtaining legal permission is necessary
in order to produce industrial enzymes and the types of microorganisms that produce enzymes with industrial importance should be identified to use the enzymes commercially (Arellano-Carbajal and Olmos-Soto, 2002). Several PCR based nucleic acid fingerprinting methods have been used to characterize and differen-tiate Bacillus strains when 16S rRNA gene sequencing failed to give the information at subspecies and strain level. 16S-23S intergenic transcribed spacer region PCR (ITS-PCR), BOX and (GTG)5-PCR as repetitive element sequence-based PCR (rep-PCR) which are pow-erful methods to screen the several parts of bacterial genome, have been used to identification, differentiation and comparing the bacterial genome diversity (Freitas et al., 2008; Cihan, 2013). In the present study, 56 rod shaped bacteria, capable of growing under highly alka-line conditions were isolated from different regions of Turkey. Carbon sources as a nutrient factor and the pH of the culture medium have a critical importance in the alkaline protease production. As a primary purpose of this study, we aimed to determine the optimal alkaline
A Comparative Study:Taxonomic Grouping of Alkaline Protease Producing Bacilli
NILGUN TEKIN1, ARZU COLERI CIHAN2, BASAR KARACA2 and CUMHUR COKMUS3*
1 Biotechnology Institute, Ankara University, Besevler, Ankara, Turkey2 Faculty of Science, Biology Department, Ankara University, Tandogan, Ankara, Turkey
3 Konya Food and Agriculture University, Dede Korkut Mahallesi, Beyşehir, Meram, Konya, Turkey
Submitted 5 November 2015, revised 17 February 2016, accepted 19 February 2016
A b s t r a c t
Alkaline proteases have biotechnological importance due to their activity and stability at alkaline pH. 56 bacteria, capable of growing under alkaline conditions were isolated and their alkaline protease activities were carried out at different parameters to determine their optimum alkaline protease production conditions. Seven isolates were showed higher alkaline protease production capacity than the reference strains. The highest alkaline protease producing isolates (103125 U/g), E114 and C265, were identified as Bacillus licheniformis with 99.4% and Bacillus mojavensis 99.8% based on 16S rRNA gene sequence similarities, respectively. Interestingly, the isolates identified as Bacillus safensis were also found to be high alkaline protease producing strains. Genotypic characterizations of the isolates were also determined by using a wide range of molecular techniques (ARDRA, ITS-PCR, (GTG)5-PCR, BOX-PCR). These different techniques allowed us to differentiate the alkaliphilic isolates and the results were in concurrence with phylogenetic analyses of the 16S rRNA genes. While ITS-PCR provided the highest correlation with 16S rRNA groups, (GTG)5-PCR showed the highest differentiation at species and intra-species level. In this study, each of the biotechnologically valuable alkaline protease producing isolates was grouped into their taxonomic positions with multi-genotypic analyses.
K e y w o r d s: 16S rRNA gene sequence, alkaline protease, alkaliphilic Bacillus, ARDRA, ITS-PCR, rep-PCR
Tekin N. et al. 140
production and enzyme activity conditions by using dif-ferent growth parameters in order to cover the needs for determining different alkaliphilic and alkalotoler-ant bacterial strains. Thus, two different culture media having two different pH values were used for cultivation and the enzyme activity experiments were carried with a buffer having two different pH. In addition, we aimed to compare and combine the alkaline protease produc-tion capacities of the isolates with their phylogenetic data. In this context, besides 16S rRNA gene sequence similarities, amplified rDNA (Ribosomal DNA) restric-tion analysis (ARDRA), internal transcribed spacer (ITS)-PCR, (GTG)5 and BOX-PCR as a repetitive extra-genic palindromic (Rep-PCR) were applied as nucleic acid fingerprinting techniques to obtain detailed infor-mation about the taxonomic position of the isolates at the subspecies and strain level.
Experimental
Materials and Methods
Strains. In this study, water and soil samples were collected from different areas of Turkey. The isolates used in this study, their origins and their isolation sources are presented in Table I. In order to isolate new alkaliphilic bacilli having alkaline protease activities, samples were mostly collected from extreme environ-ments having alkaline and saline conditions or contain-ing sulfur and soda. For the bacterial isolation, the soil (0.2–0.4 g) and the water samples (0.5 ml) were inocu-lated in to Nutrient Broth (pH 9.0) and were cultivated at 37°C by shaking at 200 rpm for 48 h. The turbid cultures were diluted with sterile saline solution and transferred onto Skim Milk Agar plates, which include 0.1% glucose, 2% peptone, 0.5% yeast extract, 0.1% K2HPO4, 0.02% MgSO47H2O, 0.5% skim milk (steri-lized separately) (Denizci et al., 2004). After steriliza-tion, the pH of the medium was adjusted to 9.0 by add-ing 10% Na2CO3. The isolates, which gave a clear zone around the colonies due to the hydrolysis of skim milk were selected as an alkaline protease producing strains (Denizci et al., 2004; Tekin et al., 2012).
Following Bacillus strains were also used as ref-erence strains; Bacillus licheniformis DSM 13, Bacil-lus coagulans DSM 1T, Bacillus subtilis ATCC 6633T, Bacillus alcalophilus DSM 485T, Bacillus subtilis DSM 1971, Bacillus clausii DSM 8716T, Bacillus cohnii DSM 6307T, Bacillus horikoshii DSM 8719T, Bacillus gibsonii 8722T, Bacillus agaradhaerens DSM 8721T, Bacillus halo-durans DSM 497T and Bacillus pseudalcaliphilus DSM 8725T. The alkaline protease production capacities of all the isolates and reference strains were qualitatively screened on Skim Milk Agar medium.
Alkaline protease production and quantita-tive determination of enzyme activity. Two differ-ent medium was used for enzyme production. The first medium, which contains casein was prepared according to Gessesse and Gashe (1997) (0.5% Casein, 0.5% Peptone, 0.2% Yeast extract, 0.5% NaCl, 0.02% MgSO47H2O, 0.01% CaCl22H2O, 0.1% K2HPO4). The second medium, which contains starch, was prepared according to Denizci et al. (2004) (1.0% starch, 0.5% yeast extract, 0.1% K2HPO4 and 0.02% MgSO4.7H2O). The pH of the media was adjusted to pH 7.5 (for alkali-tolerant and facultative alkaliphiles) and 9.5 (for alkaliphiles and obligate alkaliphiles) and the incuba-tion was carried out for 48 h and 72 h. The extracel-lular alkaline proteases were obtained from the culture supernatant as described by Tekin et al. (2012) and the same procedures were applied for the determination of alkaline protease activity. All enzyme activity assays were carried out in triplicate (technical replica) from triplicate cultivations (biological replica) and the results were calculated as mean standard values. Analysis of variance with repeated measures was performed using the Software IBM SPSS Statistics (Version 22, USA). Enzymatic activity means and standard deviation were calculated. Univariate analysis of variance was employed on the data with nutritional supplements (casein or starch)-alkaline protease activity, pH-alkaline protease activity, incubation period-alkaline protease activity, and enzyme reaction buffers having different pH values-alkaline protease activity were tested for sig-nificance. Main effects and interaction were also tested for significance.
The parameters for alkaline protease production and activity were summarized at Fig. 1. While determining the alkaline protease production capacities of the iso-lates, the enzyme activity values per pellet-wet weight (U/g) were determined. The micro molar extinction value of tyrosine, used at enzyme activity formula, was determined by measuring the optic densities of differ-ent concentration of tyrosine dilutions at spectropho-tometry (660 nm). Tyrosine micro molar extinction value was calculated as 0.0011 µM/ml. One unit of alkaline protease activity was defined as the amount of the enzyme capable of producing 1 μg of tyrosine in 1 min under standard assay conditions.
Morphologic and physiologic characterization of the isolates. Actively growing cells on Nutrient Agar plates (pH 7.0 and 9.0) at 37°C were used for cell and colony morphology analyses. The formation of the spores (spore shape, position in vegetative cell and swell-ing property) and motility were tested by using 18–24 h Nutrient Broth cultures supplemented with 5 mg/l MnSO4 . 4H2O and observed on the phase-contrast microscope (Suzuki et al., 1976). Colony morpho logy of the isolates determined by using 18 h-old cultures

Taxonomy and alkaline protease capacity of bacilli1 41
on Nutrient Agar plates at 37°C. Gram staining, cata-lase and amylase activities were carried out according to the methods of Claus and Berkeley (1986). The optimal
pH for growth was defined in Nutrient Broth, which was adjusted to different pH values from 7.0 to 13.0 after incubating at 37°C for 24–48 h. The temperature
APT1, APT2, APT5, APT8, APT9 Soil Besevler, AnkaraAPT10, APT11, APT12 Soil Hazar Lake, Diyarbakır coastAPT13a, APT14, APT20b Mud Hazar Lake, Diyarbakır coastAPT23, APT24, APT25, APT26 Soil Sulu Ada, Adrasan, AntalyaAPT30 Soil Acısu Deresi, Baskoy, KastamonuAPT32 Water Burdur Lake, BurdurAPT34 Mud Burdur Lake, BurdurAPT35, APT36 Soil Burdur Lake, BurdurAPT37, APT38 Water Güvercinlik Cave, Guneysinir, KonyaAPT39, APT40, APT41 Soil Güvercinlik Cave, Guneysinir, KonyaAPT42 Mud Avlan Lake, Elmalı, AntalyaAPT43 Water Avlan Lake, Elmalı, AntalyaAPT44 Mud Kükürtlü Su, Demre İcmeleri, AntalyaAPT47 Water Kükürtlü Su, Demre İcmeleri, AntalyaAPT48 Mud Burguç Su Kaynagı, Demre, AntalyaTG11, TG20 Soil Salt Lake, AksarayA107, A131, A151, A185 Sediment Omerbeyli, Germencik, AydinA111, A325, A331 Soil Omerbeyli, Germencik, AydinA363 Soil Yavuzkoy, Salavatli, AydinB16 Water Urganlı, Turgutlu, ManisaB65 Soil Urganlı, Turgutlu, ManisaC83ca, C91, C92 Water Buharekent, Tekkehamam/Tekkekoy, DenizliC234, C235, C236, C241, C244, C251, C265 Soil Buharekent, Tekkehamam/Tekkekoy, DenizliD311 Water Doganbey, Seferhisar, İzmirE114, E287 Sediment Altinsu, Kozakli, NevsehirE215 Soil Baglica, Kozakli, Nevsehir
Table IDiversity and origin of the bacterial isolates
Bacterial isolates Sample Origin
Fig. 1. The design of the enzyme activity experiments.

Tekin N. et al. 142
requirements were tested in Nutrient Broth at pH 10.0 after 24–48 h incubation at different temperatures (5–70°C). The salinity (0–10% NaCl) tolerance for growth was tested in Nutrient Broth and after 24–48 h incubation at 37°C (Nielsen et al., 1995). The growth properties of the isolates were determined according to their optic density at 660 nm. All characterization assays were performed with monocultures in triplicates.
Amplification and sequencing of 16S rRNA gene. Genomic DNA extraction, 16S rRNA gene amplifica-tion, purification of the PCR products and sequenc-ing reactions were carried out as previously described (Tekin et al., 2012). In phylogenetic analyses, the evolu-tionary distances were computed using the Maximum Composite Likelihood method (Tamura et al., 2004) and the evolutionary history was derived using the Neighbor-Joining method (Saitou and Nei, 1987) with the bootstrap values based on 1000 replicates (Felsen-stein, 1985). The phylogenetic tree was constructed with the MEGA package version 4 (Tamura et al., 2007).
Amplified ribosomal DNA restriction analysis (ARDRA) of 16S rRNA gene. The same PCR ampli-cons that used for sequencing reactions were taken into ARDRA analysis of the 16S rRNA gene primed by 27F/1492R (Tekin et al., 2012). The PCR prod-ucts were digested with the restriction enzymes with Fast digest AluI, HaeIII and TaqI restriction enzymes (MBI Fermentas). ARDRA profiles were detected and statistically analyzed as previously described (Cihan et al., 2011). Finally, the individually examined all the ARDRA analyses were then taken into a cumulative cluster analysis which combined all these tests in a den-drogram by using the GelCompar II software pack-ages (Applied Maths, Belgium). In clustering analyses, according to the presence or absence of DNA bands and also to their densities, the similarity shade limits of 16.66, 33.33, 49.99, 66.66 and 83.3% values were used with GelCompar II software (Applied Maths, Belgium). In this context, the bacteria displaying lower similarities than 97% were denoted as having unique distinctive profiles; the ones having similarities between 97.0% and 100% were determined as sharing similar profiles and then were implied as displaying the same profiles.
PCR based fingerprinting analyses of Rep ele-ments and intergenic 16S-23S rRNA gene. Repetitive elements (Rep-PCR) genomic fingerprintings (BOXA1- and (GTG)5-PCR) and intergenic transcribed spacers (ITS) between 16S and 23S rRNA genes were performed according to Cihan (2013). Distinctive ITS-PCR, BOXA1 and (GTG)5-PCR fingerprintings were ana-lyzed by the GelCompar II software packages (Applied Maths, Belgium). Similarities of the digitized profiles were calculated using Dice correlation and an aver-age linkage (UPGMA) dendrogram was obtained. The individually examined all the ITS-, (GTG)5- and BOX-
PCR fingerprintings were then taken into a cumula-tive cluster analysis which combined all these tests in a dendrogram by using the GelCompar II software packages (Applied Maths, Belgium). This combined results containing dendrogram was presented in this paper, instead of showing all the three individual cluster analyses of these fingerprinting tests. In clustering anal-yses according to the presence or absence of DNA bands and also to their densities, the similarity shade limits of 16.66, 33.33, 49.99, 66.66 and 83.3% values were used in GelCompar II software. In this context, the bacteria displaying lower similarities than 83 % were denoted as having unique distinctive profiles, the ones having simi- larities between 83.3.0% and 99.9% were determined as showing similar profiles and the ones with 100% similarity were implied as displaying the same profiles.
For the all PCR based reactions, the DNA templates were analyzed spectrophotometrically on Nanodrop (NanoDrop 1000 Spectrophotometer V3.7, Thermo Fisher Scientific Inc, Wilmington, DE, USA). Then the concentrations of genomic DNA samples were diluted to 200 ng/µl as stock DNA. For the each PCR based experiment same amount of DNA was used from 200 ng/µl stocks to standardize the band density.
Results
Alkaline protease producing isolates. All of the 56 isolates determined as alkaline protease produ cers due to growing and producing proteolytic zone on skim milk agar plates at different pH values (7.0, 9.0 and 10.0) as reference Bacillus strains. Qualitative pro-teolytic activity was expressed as a diameter of clear zones in mm (data not shown).
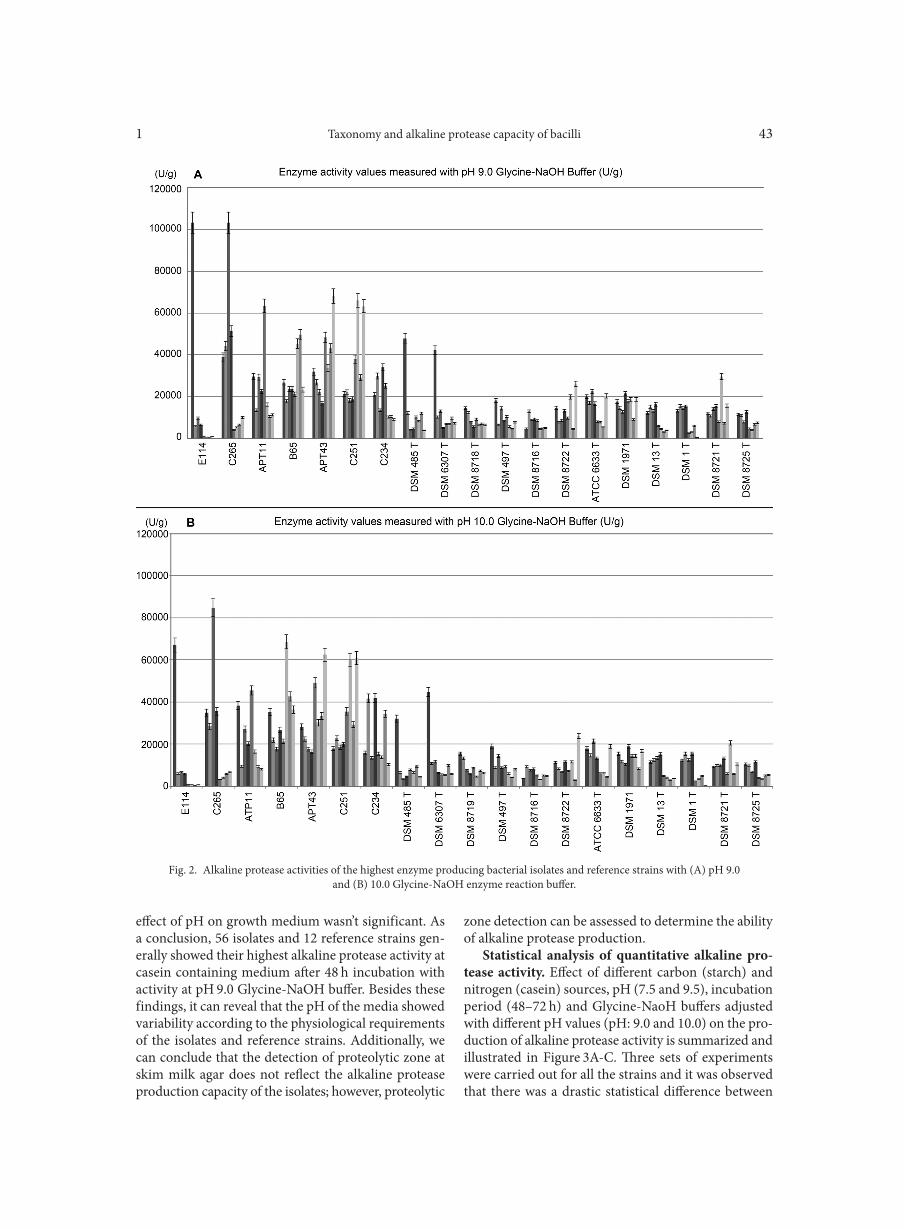
Quantitative alkaline protease production. Enzyme activity values of the isolates and reference strains per pellet-wet weight (U/g) generally were differed between 353-103125 U/g. Isolates E114 and C265 were produced the highest amounts of alkaline protease (103125 U/g) when compared with the other isolates and reference strains. Besides these two isolates APT11, B65, APT43, C251 and C234 were also showed higher alkaline pro-tease production than the reference strains at the dif-ferent parameters which were summarized in Fig. 1. Alkaline protease production capacities of the seven highest enzyme producing strains and the reference strains were showed in graphs on Fig. 2. Prominently, it’s assessed that 70% of the bacteria showed high alka-line protease activity after 48 h incubation. In addi-tion, 76% of the isolates displayed high enzyme activ-ity after incubating at the casein containing medium. Also, 73% of the isolates were carried out the highest enzyme activity measurements at the Glycine-NaOH reaction buffer at pH 9.0. However, it’s revealed that
Taxonomy and alkaline protease capacity of bacilli1 43
effect of pH on growth medium wasn’t significant. As a conclusion, 56 isolates and 12 reference strains gen-erally showed their highest alkaline protease activity at casein containing medium after 48 h incubation with activity at pH 9.0 Glycine-NaOH buffer. Besides these findings, it can reveal that the pH of the media showed variability according to the physiological requirements of the isolates and reference strains. Additionally, we can conclude that the detection of proteolytic zone at skim milk agar does not reflect the alkaline protease production capacity of the isolates; however, proteolytic
zone detection can be assessed to determine the ability of alkaline protease production.
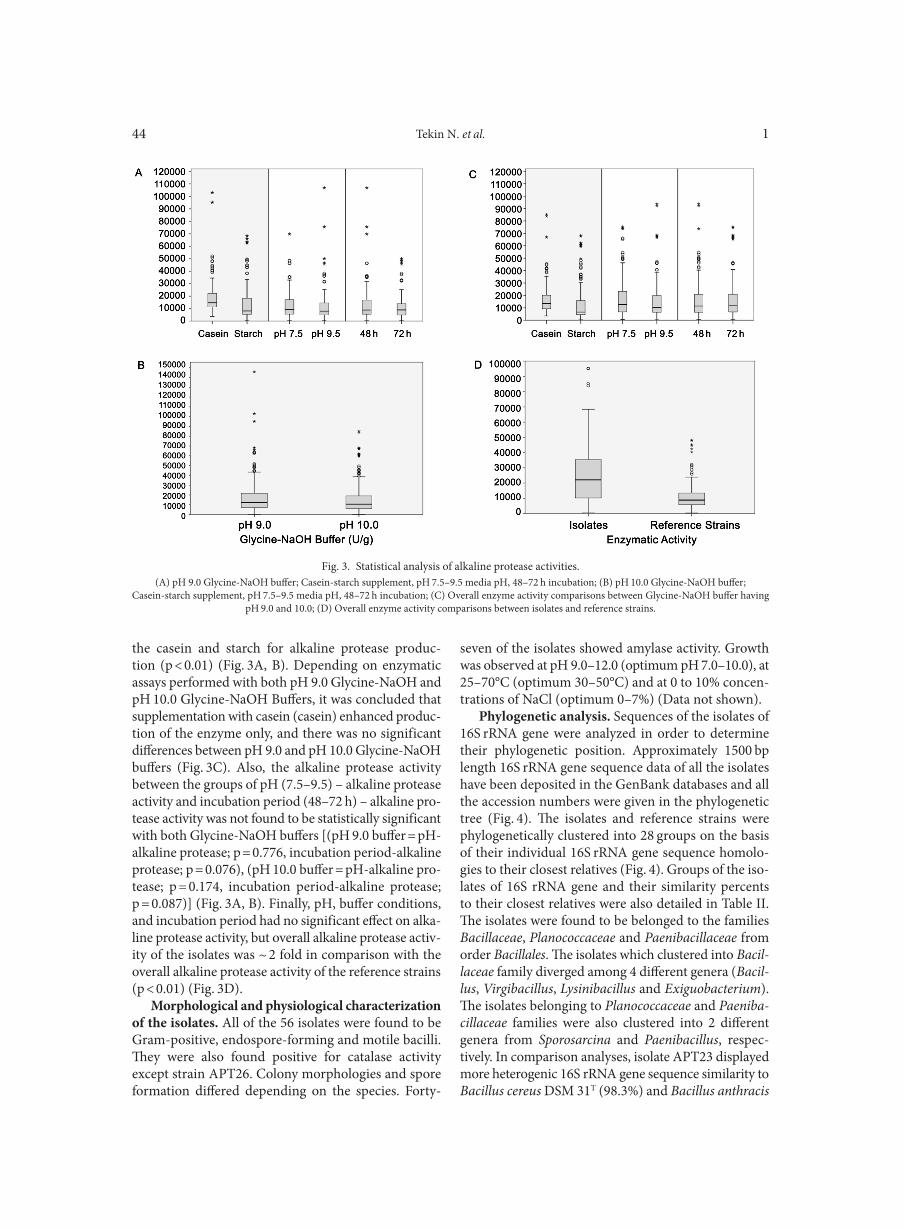
Statistical analysis of quantitative alkaline pro-tease activity. Effect of different carbon (starch) and nitrogen (casein) sources, pH (7.5 and 9.5), incubation period (48–72 h) and Glycine-NaoH buffers adjusted with different pH values (pH: 9.0 and 10.0) on the pro-duction of alkaline protease activity is summarized and illustrated in Figure 3A-C. Three sets of experiments were carried out for all the strains and it was observed that there was a drastic statistical difference between
Fig. 2. Alkaline protease activities of the highest enzyme producing bacterial isolates and reference strains with (A) pH 9.0and (B) 10.0 Glycine-NaOH enzyme reaction buffer.
Tekin N. et al. 144
the casein and starch for alkaline protease produc-tion (p < 0.01) (Fig. 3A, B). Depending on enzymatic assays performed with both pH 9.0 Glycine-NaOH and pH 10.0 Glycine-NaOH Buffers, it was concluded that supplementation with casein (casein) enhanced produc-tion of the enzyme only, and there was no significant differences between pH 9.0 and pH 10.0 Glycine-NaOH buffers (Fig. 3C). Also, the alkaline protease activity between the groups of pH (7.5–9.5) – alkaline protease activity and incubation period (48–72 h) – alkaline pro-tease activity was not found to be statistically significant with both Glycine-NaOH buffers [(pH 9.0 buffer = pH-alkaline protease; p = 0.776, incubation period-alkaline protease; p = 0.076), (pH 10.0 buffer = pH-alkaline pro-tease; p = 0.174, incubation period-alkaline protease; p = 0.087)] (Fig. 3A, B). Finally, pH, buffer conditions, and incubation period had no significant effect on alka-line protease activity, but overall alkaline protease activ-ity of the isolates was ~ 2 fold in comparison with the overall alkaline protease activity of the reference strains (p < 0.01) (Fig. 3D).
Morphological and physiological characterization of the isolates. All of the 56 isolates were found to be Gram-positive, endospore-forming and motile bacilli. They were also found positive for catalase activity except strain APT26. Colony morphologies and spore formation differed depending on the species. Forty-
seven of the isolates showed amylase activity. Growth was observed at pH 9.0–12.0 (optimum pH 7.0–10.0), at 25–70°C (optimum 30–50°C) and at 0 to 10% concen-trations of NaCl (optimum 0–7%) (Data not shown).
Phylogenetic analysis. Sequences of the isolates of 16S rRNA gene were analyzed in order to determine their phylogenetic position. Approximately 1500 bp length 16S rRNA gene sequence data of all the isolates have been deposited in the GenBank databases and all the accession numbers were given in the phylogenetic tree (Fig. 4). The isolates and reference strains were phylogenetically clustered into 28 groups on the basis of their individual 16S rRNA gene sequence homolo-gies to their closest relatives (Fig. 4). Groups of the iso-lates of 16S rRNA gene and their similarity percents to their closest relatives were also detailed in Table II. The isolates were found to be belonged to the families Bacillaceae, Planococcaceae and Paenibacillaceae from order Bacillales. The isolates which clustered into Bacil-laceae family diverged among 4 different genera (Bacil-lus, Virgibacillus, Lysinibacillus and Exiguobacterium). The isolates belonging to Planococcaceae and Paeniba- cillaceae families were also clustered into 2 different genera from Sporosarcina and Paenibacillus, respec-tively. In comparison analyses, isolate APT23 displayed more heterogenic 16S rRNA gene sequence similarity to Bacillus cereus DSM 31T (98.3%) and Bacillus anthracis
Fig. 3. Statistical analysis of alkaline protease activities.(A) pH 9.0 Glycine-NaOH buffer; Casein-starch supplement, pH 7.5–9.5 media pH, 48–72 h incubation; (B) pH 10.0 Glycine-NaOH buffer;
Casein-starch supplement, pH 7.5–9.5 media pH, 48–72 h incubation; (C) Overall enzyme activity comparisons between Glycine-NaOH buffer having pH 9.0 and 10.0; (D) Overall enzyme activity comparisons between isolates and reference strains.

Taxonomy and alkaline protease capacity of bacilli1 45
Fig. 4. A phylogenetic tree based on the 16S rRNA gene sequences.The tree was generated by neighbor-joining method. Bootstrap values (%) are based on 1.000 replicates and shown for branches with more than 30%
bootstrap support. Bar indicates 0.01 substitutions per 100 nucleotide positions.

Tekin N. et al. 146
(99.2%) reference strains. The rest of the isolates clus-tered between % 99.1 and 100 similarity values to their type strains as indicated at Table II.
Benchmark of alkaline protease production with phylogenetic clusters. It is obvious that genus Bacil-lus heads a list in the alkaline protease in producing bacteria. Similarly in our study, the highest alkaline protease producing isolates, E114 (103125 U/g) and C265 (103125 U/g) were clustered in B. licheniformis and Bacillus mojavensis, respectively (Fig. 2 and 4). Other highest alkaline protease producing strain B65 (68506 U/g) was clustered with Bacillus aerophilus, and isolates APT11 (63429 U/g), APT43 (68082 U/g), C251 (65939 U/g) and C234 (41834 U/g) were clus-tered with Bacillus safensis. In addition, the isolate APT36 was grouped within Paenibacillus dendritiformis (3824 U/g), identified as the lowest alkaline protease producer within all isolates and the reference strains. Notwithstanding, while APT23 was clustered with B. cereus, APT1, APT9, APT10, APT24, APT25 and TG11 were clustered with B. anthracis, which are class III pathogen strains. Despite of the alkaline protease production capacities of these isolates, as they produced
higher amount of protease than most of the strains, they are not sufficient for the industrial enzyme production due to their pathogenic identity (Table IIIA, B). Conse-quently, 49 isolates except these 7 isolates were clustered within non-pathogenic strains. Within the context of optimal alkaline protease production conditions, it was assessed that while B. safensis group isolates produced highest alkaline protease in the starch medium, the isolates belonging to B. licheniformis, B. anthracis and Exiguobacterium groups produced their highest alka-line protease in the casein medium. According to alka-line protease production capacity of the isolates against to reference strains, it is observed that all of the isolates belonging to B. subtilis and B. subtilis subsp. subtilis group displayed higher enzyme production levels than the reference strains of B. subtilis DSM 1971 and B. subtilis ATCC 6633T. Similarly, the isolate APT36 grouped as B. clausii, and the isolate APT5 belonging to B. cohnii, showed higher alkaline protease production capacities than their reference strains B. clausii DSM 8716T and B. cohnii DSM 6307T, respectively (Table IIIA, B).
The Rep-PCR and ITS-PCR fingerprintings of the isolates. The isolates and the reference strains were
Bacillus subtilis 1 E287 (97)Bacillus subtilis subsp. subtilis 7 A363 (99.9), E215 (99.8), A151 (99.9), D311 (99.9), A325 (99.9), A107 (99.8), A331(99.6)Bacillus mojavensis 3 A185 (99.8), C265 (99.8), A131 (99.8)Bacillus licheniformis 10 C83ca (99.9), C92 (99.9), C91 (99.8), A111 (99.8), APT38 (99.7), APT39 (99.7), APT47 (99.6), TG20 (99.5), E114 (99.4), APT40 (99.3)Bacillus aerophilus 1 B65 (100)Bacillus pumilus 1 APT37 (99.8)Bacillus safensis 9 B16 (100), APT43 (99.9), C235 (100), C244 (100), C241 (100), C234 (99.9), C236 (99.9), C251 (99.9), APT11 (99.7)Bacillus oceanisediminis 1 APT26 (99.6)Bacillus pseudofirmus 1 APT35 (99.9)Bacillus clausii 1 APT32 (99.7)Bacillus flexus 1 APT12 (99.9)Bacillus cohnii 1 APT5 (99.9)Bacillus cereus 1 APT23 (98.3)Bacillus anthracis 6 APT10 (100), APT24 (100), APT9 (100), APT25 (100), APT1 (99.9), TG11 (99.9)Virgibacillus proomii 1 APT2 (99.9)Sporosarcina koreensis 1 APT41 (99.7)Lysinibacillus sphaericus 1 APT42 (99.8)Exiguobacterium arabatum 5 APT14 (99.9), APT13a (99.9), APT44 (99.9), APT48 (99.9), APT30 (99.8)Exiguobacterium aurantiacum 1 APT34 (99.9)Exiguobacterium mexicanum 1 APT20b (99.4)Paenibacillus dendritiformis 1 APT36 (99.1)
Table IIThe species groups of the isolates and the number of the bacteria belonging to these groups derived from 16S rRNA gene
nucleotide sequences
16S rRNA Gene Groups Number ofthe isolates Isolates and similarity percentages (%)

Taxonomy and alkaline protease capacity of bacilli1 47
implemented to the Rep-PCR and ITS fingerprinting analyses. These fingerprinting results, the fingerprint-ing groups and the individual 16S rRNA gene groups were presented in Fig. 5, Table IV, Table V A-B respec-tively. The isolates, having unique distinctive profiles, were indicated in Table V A-B. In the individual cluster analyses of the Rep-PCR containing BOX- and (GTG)5-PCR fingerprintings, totally 33 to 51 clusters were obtained, whereas 28 clusters were obtained from ITS-PCR fingerprintings. According to these results Rep-
PCR products, especially (GTG)5-PCR fingerprintings were generated a high number of bands giving discrimi-native information below species and subspecies level between the endospore-forming bacilli isolates when compared with ITS-PCR fingerprintings and 16S rRNA phylogenetic analyses. Additionally to these findings, the clusters obtained with ITS-PCR fingerprints and 16S rRNA phylogenetic analyses showed codependency and sustained the relation between the isolates. In con-clusion, the cluster analyses of the Rep- and ITS-PCR
Bacillus subtilis subsp. subtilis A363 44864 Casein 7.5 48 9.0 E215 43725 Starch 9.5 48 9.0 A151 29906 Starch 7.5 48 9.0 D311 53350 Starch 7.5 48 10.0 A325 27726 Casein 7.5 72 9.0 A107 22471 Casein 9.5 48 9.0 A331 22367 Casein 9.5 72 9.0Bacillus subtilis E287 41708 Casein 9.5 48 9.0 DSM1971 21450 Casein 9.5 72 9.0 ATCC6633 22458 Casein 9.5 48 9.0Bacillus mojavensis A185 33950 Starch 7.5 48 9.0 C265 103125 Casein 9.5 48 9.0 A131 30425 Casein 7.5 48 9.0Bacillus licheniformis C83ca 12844 Casein 7.5 72 10.0 C92 18116 Casein 9.5 48 9.0 C91 18700 Casein 7.5 48 10.0 A111 17233 Casein 9.5 72 9.0 APT38 7398 Casein 7.5 48 10.0 APT39 9888 Casein 7.5 48 9.0 APT47 26308 Casein 7.5 48 9.0 TG20 10529 Casein 7.5 48 10.0 E114 103125 Casein 7.5 48 9.0 APT40 11648 Casein 7.5 48 10.0 DSM13 16323 Casein 9.5 72 9.0Bacillus aerophilus B65 68506 Starch 7.5 72 10.0Bacillus pumilus APT37 31656 Casein 9.5 72 9.0Bacillus safensis B16 42961 Starch 7.5 48 9.0 APT43 68082 Starch 9.5 72 9.0 C235 37492 Starch 9.5 48 9.0 C244 65939 Starch 7.5 72 9.0 C241 34490 Starch 7.5 48 10.0 C234 34375 Starch 9.5 48 10.0 C236 53763 Starch 9.5 72 9.0 C251 65939 Starch 7.5 72 9.0 APT11 63429 Starch 7.5 48 9.0
Table IIIA16S rRNA groups of the isolates and their individual optimum alkaline protease activity conditions
16S rRNA species groups Bacteria
Alkalineprotease
activity (U/g)
The highest alkaline protease activity conditions
Medium pH of themedium
Incubationtime (h)
pH of glycine-NaOH buffer
Tekin N. et al. 148
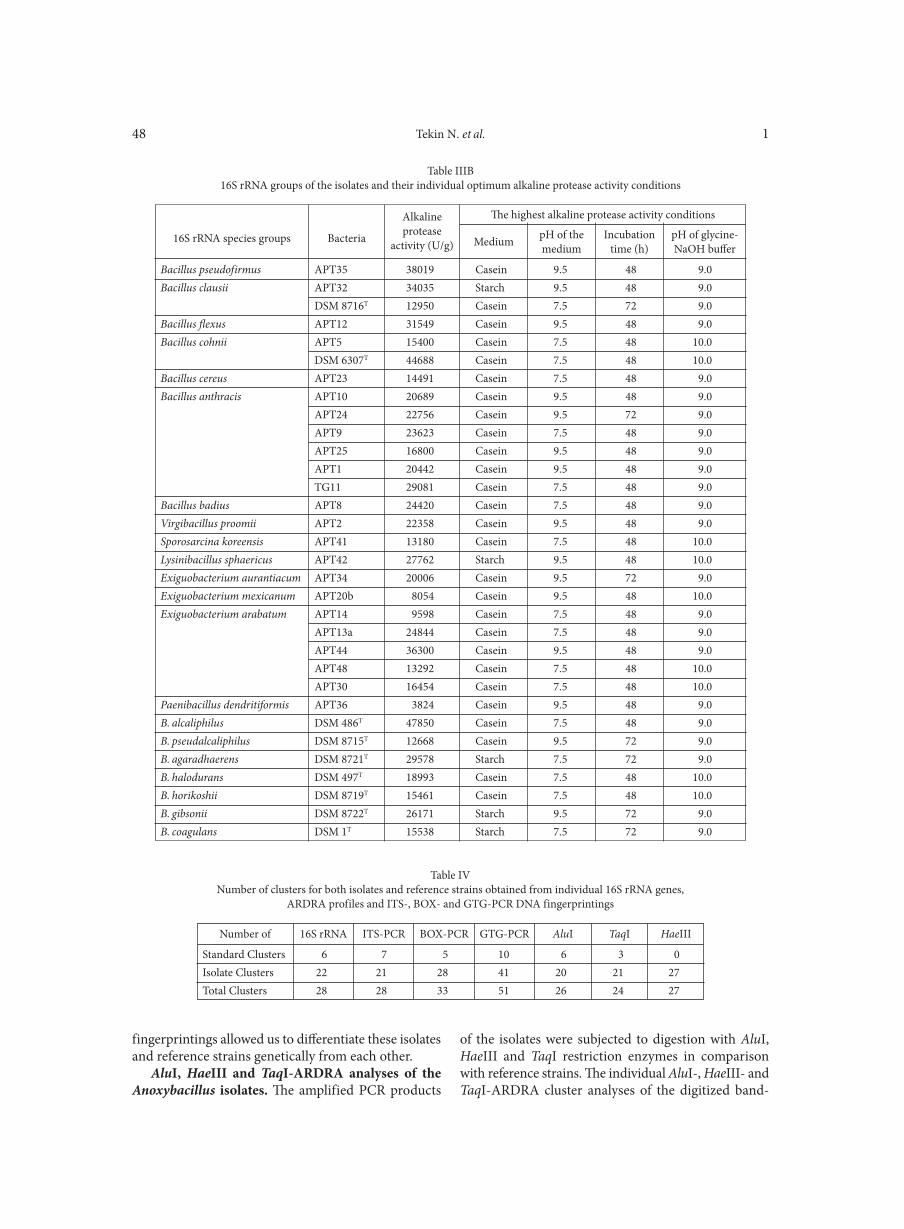
Table IIIB16S rRNA groups of the isolates and their individual optimum alkaline protease activity conditions
16S rRNA species groups Bacteria
Alkalineprotease
activity (U/g)
The highest alkaline protease activity conditions
Medium pH of themedium
Incubationtime (h)
pH of glycine-NaOH buffer
Bacillus pseudofirmus APT35 38019 Casein 9.5 48 9.0Bacillus clausii APT32 34035 Starch 9.5 48 9.0 DSM 8716T 12950 Casein 7.5 72 9.0Bacillus flexus APT12 31549 Casein 9.5 48 9.0Bacillus cohnii APT5 15400 Casein 7.5 48 10.0 DSM 6307T 44688 Casein 7.5 48 10.0Bacillus cereus APT23 14491 Casein 7.5 48 9.0Bacillus anthracis APT10 20689 Casein 9.5 48 9.0 APT24 22756 Casein 9.5 72 9.0 APT9 23623 Casein 7.5 48 9.0 APT25 16800 Casein 9.5 48 9.0 APT1 20442 Casein 9.5 48 9.0 TG11 29081 Casein 7.5 48 9.0Bacillus badius APT8 24420 Casein 7.5 48 9.0Virgibacillus proomii APT2 22358 Casein 9.5 48 9.0Sporosarcina koreensis APT41 13180 Casein 7.5 48 10.0Lysinibacillus sphaericus APT42 27762 Starch 9.5 48 10.0Exiguobacterium aurantiacum APT34 20006 Casein 9.5 72 9.0Exiguobacterium mexicanum APT20b 8054 Casein 9.5 48 10.0Exiguobacterium arabatum APT14 9598 Casein 7.5 48 9.0 APT13a 24844 Casein 7.5 48 9.0 APT44 36300 Casein 9.5 48 9.0 APT48 13292 Casein 7.5 48 10.0 APT30 16454 Casein 7.5 48 10.0Paenibacillus dendritiformis APT36 3824 Casein 9.5 48 9.0B. alcaliphilus DSM 486T 47850 Casein 7.5 48 9.0B. pseudalcaliphilus DSM 8715T 12668 Casein 9.5 72 9.0B. agaradhaerens DSM 8721T 29578 Starch 7.5 72 9.0B. halodurans DSM 497T 18993 Casein 7.5 48 10.0B. horikoshii DSM 8719T 15461 Casein 7.5 48 10.0B. gibsonii DSM 8722T 26171 Starch 9.5 72 9.0B. coagulans DSM 1T 15538 Starch 7.5 72 9.0
Standard Clusters 6 7 5 10 6 3 0Isolate Clusters 22 21 28 41 20 21 27Total Clusters 28 28 33 51 26 24 27
Table IVNumber of clusters for both isolates and reference strains obtained from individual 16S rRNA genes,
ARDRA profiles and ITS-, BOX- and GTG-PCR DNA fingerprintings
Number of 16S rRNA ITS-PCR BOX-PCR GTG-PCR AluI TaqI HaeIII
fingerprintings allowed us to differentiate these isolates and reference strains genetically from each other.
AluI, HaeIII and TaqI-ARDRA analyses of the Anoxybacillus isolates. The amplified PCR products
of the isolates were subjected to digestion with AluI, HaeIII and TaqI restriction enzymes in comparison with reference strains. The individual AluI-, HaeIII- and TaqI-ARDRA cluster analyses of the digitized band-

Taxonomy and alkaline protease capacity of bacilli1 49
Fig. 5. The cumulative cluster analysis of representative digitized banding patterns, generated by ITS-, BOX- and GTG-PCR profiles from isolates and reference strains.
The dendrogram was constructed by using UPGMA, with correlation levels expressed as percentage values of the Dice coefficient. Due to the correla-tion between 16S rRNA groups, the numbers of clusters obtained from the ITS-PCR cumulative analysis were indicated in the right side of the figure.
Tekin N. et al. 150
ing patterns derived from the isolates and the reference strains can be seen in Fig. 6. The numbers of clusters obtained from these three ARDRA profiles and the iso-lates, having unique distinctive profiles, were shown in Table VIA and VIB. In individual cluster analysis based on the AluI-, HaeIII- and TaqI-ARDRA profiles of the amplified 16S rRNA genes, totally 26, 27 and 24 clus-ters were observed when the presence or absence of the restriction fragments and also the density of these DNA bands were considered. The highest group numbers
were determined by HaeIII-ARDRA analyses. How-ever, HaeIII-ARDRA band patterns did not show any correlation with 16S rRNA clusters. Both HaeIII- and TaqI-ARDRA groups showed a similar restriction band patterns between phylogenetically distinct strains and reference strains, and could not give any discrimina-tive result even in genus level. This can be the result of the evolutionary conserved property of 16S rRNA gene. On the contrary to HaeIII- and TaqI-ARDRA analyses, AluI-ARDRA analysis was found to be superior on the
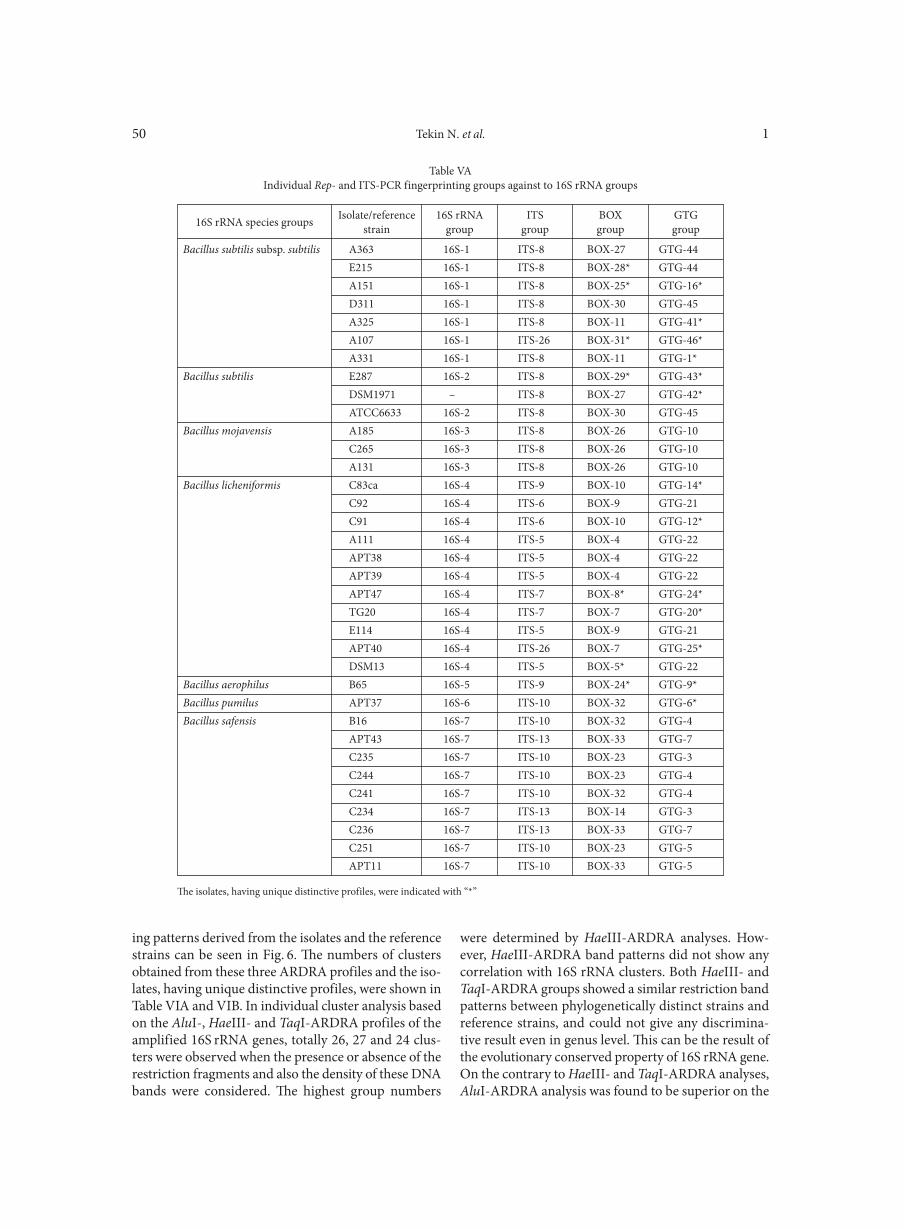
Bacillus subtilis subsp. subtilis A363 16S-1 ITS-8 BOX-27 GTG-44 E215 16S-1 ITS-8 BOX-28* GTG-44 A151 16S-1 ITS-8 BOX-25* GTG-16* D311 16S-1 ITS-8 BOX-30 GTG-45 A325 16S-1 ITS-8 BOX-11 GTG-41* A107 16S-1 ITS-26 BOX-31* GTG-46* A331 16S-1 ITS-8 BOX-11 GTG-1*Bacillus subtilis E287 16S-2 ITS-8 BOX-29* GTG-43* DSM1971 – ITS-8 BOX-27 GTG-42* ATCC6633 16S-2 ITS-8 BOX-30 GTG-45Bacillus mojavensis A185 16S-3 ITS-8 BOX-26 GTG-10 C265 16S-3 ITS-8 BOX-26 GTG-10 A131 16S-3 ITS-8 BOX-26 GTG-10Bacillus licheniformis C83ca 16S-4 ITS-9 BOX-10 GTG-14* C92 16S-4 ITS-6 BOX-9 GTG-21 C91 16S-4 ITS-6 BOX-10 GTG-12* A111 16S-4 ITS-5 BOX-4 GTG-22 APT38 16S-4 ITS-5 BOX-4 GTG-22 APT39 16S-4 ITS-5 BOX-4 GTG-22 APT47 16S-4 ITS-7 BOX-8* GTG-24* TG20 16S-4 ITS-7 BOX-7 GTG-20* E114 16S-4 ITS-5 BOX-9 GTG-21 APT40 16S-4 ITS-26 BOX-7 GTG-25* DSM13 16S-4 ITS-5 BOX-5* GTG-22Bacillus aerophilus B65 16S-5 ITS-9 BOX-24* GTG-9*Bacillus pumilus APT37 16S-6 ITS-10 BOX-32 GTG-6*Bacillus safensis B16 16S-7 ITS-10 BOX-32 GTG-4 APT43 16S-7 ITS-13 BOX-33 GTG-7 C235 16S-7 ITS-10 BOX-23 GTG-3 C244 16S-7 ITS-10 BOX-23 GTG-4 C241 16S-7 ITS-10 BOX-32 GTG-4 C234 16S-7 ITS-13 BOX-14 GTG-3 C236 16S-7 ITS-13 BOX-33 GTG-7 C251 16S-7 ITS-10 BOX-23 GTG-5 APT11 16S-7 ITS-10 BOX-33 GTG-5
Table VAIndividual Rep- and ITS-PCR fingerprinting groups against to 16S rRNA groups
The isolates, having unique distinctive profiles, were indicated with “*”
16S rRNA species groups Isolate/referencestrain
16S rRNAgroup
ITSgroup
BOXgroup
GTGgroup

Taxonomy and alkaline protease capacity of bacilli1 51
other restriction enzyme digestions for differentiating the reference strains within 6 unique clusters. Also, the differences at species and genus level were correlated with 16S rRNA phylogenetic groups.
Discussion
Because of the high value of the alkaline proteases, many new data regarding the alkaline protease produc-ing Bacillus strains have been publishing during the last years (Niyonzima and More, 2014; Sari et al., 2015).
Especially B. licheniformis, B. subtilis, B. amyloliquifa-ciens and B. mojavensis are the most preferred alkaline protease producing Bacillus species due to their high enzyme production capacities and their non-toxic properties. Some of the alkaline proteases, produced by B. licheniformis were patented and they have been widely using as laundry detergent additives (Kumar and Takagi, 1999). Also, Haddar et al. (2009) announced that serine alkaline proteases produced from B. mojavensis, are effaceable for the industrial usage. Likewise, in our study the highest alkaline protease producer strains E114 and C265 were identified as B. licheniformis and
Table VBIndividual Rep- and ITS-PCR fingerprinting groups against to 16S rRNA groups
The isolates, having unique distinctive profiles, were indicated with “*”
16S rRNA species groups Isolate/referencestrain
16S rRNAgroup
ITSgroup
BOXgroup
GTGgroup
Bacillus oceanisediminis APT26 16S-8 ITS-4* BOX-14 GTG-15*Bacillus pseudofirmus APT35 16S-24 ITS-11* BOX-14 GTG-11*Bacillus clausii APT32 16S-27 ITS-23 BOX-2* GTG-19* DSM8716 16S-27 ITS-23 BOX-1* GTG-26*Bacillus flexus APT12 16S-9 ITS-1* BOX-14 GTG-13*Bacillus cohnii APT5 16S-10 ITS-24 BOX-14 GTG-51* DSM6307 16S-10 ITS-24 BOX-14 GTG-38*Bacillus cereus APT23 16S-12 ITS-18* BOX-14 GTG-37*Bacillus anthracis APT10 16S-13 ITS-17 BOX-14 GTG-36* APT24 16S-13 ITS-17 BOX-14 GTG-35 APT9 16S-13 ITS-17 BOX-14 GTG-33 APT25 16S-13 ITS-17 BOX-14 GTG-35 APT1 16S-13 ITS-17 BOX-14 GTG-34* TG11 16S-13 ITS-17 BOX-14 GTG-33Bacillus badius APT8 16S-16 ITS-2* BOX-14 GTG-28*Virgibacillus proomii APT2 16S-14 ITS-19* BOX-14 GTG-50*Sporosarcina koreensis APT41 16S-17 ITS-21* BOX-12* GTG-47*Lysinibacillus sphaericus APT42 16S-18 ITS-25* BOX-14 GTG-2*Exiguobacterium aurantiacum APT34 16S-19 ITS-16 BOX-17* GTG-39*Exiguobacterium mexicanum APT20b 16S-20 ITS-16 BOX-18* GTG-48*Exiguobacterium arabatum APT14 16S-21 ITS-16 BOX-19* GTG-29 APT13a 16S-21 ITS-16 BOX-22 GTG-27 APT44 16S-21 ITS-16 BOX-20* GTG-27 APT48 16S-21 ITS-16 BOX-21* GTG-30* APT30 16S-21 ITS-16 BOX-22 GTG-29Paenibacillus dendritiformis APT36 16S-28 ITS-15* BOX-13* GTG-17*B. alcaliphilus DSM486 16S-25 ITS-28* BOX-16* GTG-49*B. pseudalcaliphilus DSM8715 16S-25 ITS-20* BOX-14 GTG-18*B. agaradhaerens DSM8721 16S-22 ITS-22* BOX-14 GTG-31*B. halodurans DSM497 16S-23 ITS-27* BOX-3* GTG-40*B. horikoshii DSM8719 16S-11 ITS-3* BOX-15* GTG-8*B. gibsonii DSM8722 16S-26 ITS-12* BOX-14 GTG-32*B. coagulans DSM1 16S-15 ITS-14* BOX-6* GTG-23*

Tekin N. et al. 152
Fig. 6. The cumulative cluster analysis of representative digitized banding patterns, generated by ARDRA profiles from isolatesand reference strains.
The dendrogram was constructed by using UPGMA, with correlation levels expressed as percentage values of the Dice coefficient. Due to the correla-tion between 16S rRNA groups, the numbers of clusters obtained from the AluI profile cumulative analysis were indicated in the right side of the figure.

Taxonomy and alkaline protease capacity of bacilli1 53
B. mojavensis, respectively, according to their 16S rRNA gene sequence similarities. Additionally to these spe-cies strain B65 identified as B. aerophilus, strains APT11, APT43, C251 and C234 were identified as B. safensis. Both B. aerophilus and B. safensis species previously have not been defined as alkaline protease producing Bacillus species. Therefore, in the scope of this study, we con-clude that these species may be new alkaline protease producing Bacillus species and also can be a potential for new alkaline protease sources. Their non-pathogenic property also supports their industrial usage.
Due to its evolutionary protected property, 16S rRNA gene sequences provide distinguishing the microorgan-isms at the genus level but also its conserved property fails while differentiating the closely related species at subspecies level (Clarridge, 2004). Therefore, when 16S rRNA gene sequence similarities show 97.0% or more similarity within the closest relative species, the Ad Hoc Committee recommends the DNA-DNA hybridizations to determine the novel species (Stack-ebrandt et al., 2002; Logan et al., 2009). In our study, all of the isolates show higher 16S rRNA gene sequence
Bacillus subtilis subsp. subtilis A363 16S-1 AluI-8 TaqI-5 HaeIII-1* E215 16S-1 AluI-8 TaqI-5 HaeIII-14* A151 16S-1 AluI-8 TaqI-17* HaeIII-10 D311 16S-1 AluI-18 TaqI-2 HaeIII-5* A325 16S-1 AluI-17 TaqI-8 HaeIII-9* A107 16S-1 AluI-18 TaqI-8 HaeIII-17* A331 16S-1 AluI-8 TaqI-8 HaeIII-15*Bacillus subtilis E287 16S-2 AluI-24 TaqI-1 HaeIII-26* DSM1971 – AluI-24 TaqI-1 HaeIII-6 ATCC6633 16S-2 AluI-24 TaqI-1 HaeIII-6Bacillus mojavensis A185 16S-3 AluI-24 TaqI-2 HaeIII-6 C265 16S-3 AluI-24 TaqI-2 HaeIII-6 A131 16S-3 AluI-24 TaqI-2 HaeIII-6Bacillus licheniformis C83ca 16S-4 AluI-26 TaqI-6 HaeIII-22 C92 16S-4 AluI-26 TaqI-5 HaeIII-25* C91 16S-4 AluI-26 TaqI-6 HaeIII-22 A111 16S-4 AluI-26 TaqI-15* HaeIII-10 APT38 16S-4 AluI-26 TaqI-6 HaeIII-3* APT39 16S-4 AluI-26 TaqI-5 HaeIII-12* APT47 16S-4 AluI-26 TaqI-2 HaeIII-23* TG20 16S-4 AluI-26 TaqI-6 HaeIII-22 E114 16S-4 AluI-26 TaqI-7* HaeIII-7* APT40 16S-4 AluI-26 TaqI-6 HaeIII-24 DSM13 16S-4 AluI-26 TaqI-4* HaeIII-24Bacillus aerophilus B65 16S-5 AluI-25 TaqI-6 HaeIII-19*Bacillus pumilus APT37 16S-6 AluI-25 TaqI-22* HaeIII-13*Bacillus safensis B16 16S-7 AluI-25 TaqI-24 HaeIII-16* APT43 16S-7 AluI-9 TaqI-3 HaeIII-27* C235 16S-7 AluI-25 TaqI-23 HaeIII-11 C244 16S-7 AluI-24 TaqI-24 HaeIII-20* C241 16S-7 AluI-25 TaqI-3 HaeIII-11 C234 16S-7 AluI-9 TaqI-13* HaeIII-8 C236 16S-7 AluI-17 TaqI-21 HaeIII-2* C251 16S-7 AluI-20* TaqI-21 HaeIII-21* APT11 16S-7 AluI-25 TaqI-23 HaeIII-18*
Table VIAIndividual ARDRA profile groups against to 16S rRNA groups
The isolates, having unique distinctive profiles, were indicated with “*”
16S rRNA species groups Bacteria 16S rRNA group AluI group TaqI group HaeIII Group

Tekin N. et al. 154
similarities than 97% with their closest relative species. Especially in order to use the high alkaline protease producing strains at industrial purposes, their species have to be determined with hybridizing their DNA to their closest relative species. However, before using this expensive method, their suitable closest reference strains have to determine correctly. In this study, the nucleic acid fingerprinting techniques used allow us to determine the most suitable reference strain and avoid the DNA:DNA hybridization between the less similar strains (Cihan et al., 2011).
Intergenic Transcribed Spacers PCR (ITS-PCR) is one of the most suitable nucleic acid fingerprinting
technique by distinguishing the species and intraspecies levels. It provides high range variety according to evolu-tionary highly protected 16S rRNA gene sequences. In parallel with our study, ITS-PCR groups were better cor-related with 16S rRNA groups than (GTG)5 and BOX-PCR groups. Logan et al. (2009) and Daffonchio et al. (1998a; 1998b) reported that 6 species of the B. cereus group (B. anthracis, B. cereus, B. mycoides, B. pseudo-mycoides, B. thuringiensis and B. weihenstephanensis) were showed similar ITS band profile. Therefore, they concluded that this technique is not effective to differ-entiate B. cereus species. Similarly, Huang et al. (2012) reported that ITS-PCR is not effective to differentiate
Table VIBIndividual ARDRA profile groups against to 16S rRNA groups.
The isolates, having unique distinctive profiles, were indicated with “*”
16S rRNA species groups Bacteria 16S rRNA group AluI group TaqI group HaeIII Group
Bacillus oceanisediminis APT26 16S-8 AluI-21* TaqI-10 HaeIII-4Bacillus pseudofirmus APT35 16S-24 AluI-13* TaqI-20 HaeIII-8Bacillus clausii APT32 16S-27 AluI-19 TaqI-19 HaeIII-8 DSM8716 16S-27 AluI-19 TaqI-20 HaeIII-8Bacillus flexus APT12 16S-9 AluI-1 TaqI-10 HaeIII-4Bacillus cohnii APT5 16S-10 AluI-12 TaqI-11 HaeIII-4 DSM6307 16S-10 AluI-12 TaqI-10 HaeIII-4Bacillus cereus APT23 16S-12 AluI-2 TaqI-11 HaeIII-8Bacillus anthracis APT10 16S-13 AluI-2 TaqI-9 HaeIII-8 APT24 16S-13 AluI-2 TaqI-14* HaeIII-4 APT9 16S-13 AluI-2 TaqI-9 HaeIII-8 APT25 16S-13 AluI-2 TaqI-9 HaeIII-8 APT1 16S-13 AluI-2 TaqI-9 HaeIII-8 TG11 16S-13 AluI-2 TaqI-10 HaeIII-8Bacillus badius APT8 16S-16 AluI-11* TaqI-12 HaeIII-4Virgibacillus proomii APT2 16S-14 AluI-22* TaqI-12 HaeIII-4Sporosarcina koreensis APT41 16S-17 AluI-10* TaqI-10 HaeIII-4Lysinibacillus sphaericus APT42 16S-18 AluI-3* TaqI-10 HaeIII-4Exiguobacterium aurantiacum APT34 16S-19 AluI-16 TaqI-12 HaeIII-4Exiguobacterium mexicanum APT20b 16S-20 AluI-16 TaqI-9 HaeIII-4Exiguobacterium arabatum APT14 16S-21 AluI-16 TaqI-9 HaeIII-4 APT13a 16S-21 AluI-16 TaqI-12 HaeIII-8 APT44 16S-21 AluI-16 TaqI-9 HaeIII-8 APT48 16S-21 AluI-16 TaqI-20 HaeIII-8 APT30 16S-21 AluI-16 TaqI-9 HaeIII-8Paenibacillus dendritiformis APT36 16S-28 AluI-5* TaqI-19 HaeIII-8B. alcaliphilus DSM486 16S-25 AluI-14* TaqI-16 HaeIII-8B. pseudalcaliphilus DSM8715 16S-25 AluI-7* TaqI-18 HaeIII-8B. agaradhaerens DSM8721 16S-22 AluI-23* TaqI-16 HaeIII-8B. halodurans DSM497 16S-23 AluI-6* TaqI-16 HaeIII-8B. horikoshii DSM8719 16S-11 AluI-12 TaqI-10 HaeIII-4B. gibsonii DSM8722 16S-26 AluI-4* TaqI-18 HaeIII-8B. coagulans DSM1 16S-15 AluI-15* TaqI-9 HaeIII-4

Taxonomy and alkaline protease capacity of bacilli1 55
B. cereus and B. subtilis specie. However, contrary to these studies B. cereus, B. anthracis and B. subtilis species showed different ITS band profiles and distinguished from each other successfully in this study (Fig. 5). Our results also showed that ITS-PCR was not discrimina-tive for B. subtilis and B. mojavensis species, which were identified by 16S rRNA gene sequences. However, it obviously illuminated the diversity for B. licheniformis and B. safensis groups at intraspecies level.
The main difference of Rep-PCR from the other fin-gerprinting techniques is that it provides scanning of the repetitive sequences on complete bacterial genomes (Versalovic et al., 1994). The discriminative efficacy of BOX and (GTG)5 elements on taxonomic classification of endospore forming bacilli were showed at various studies (Freitas et al., 2008; Logan et al., 2009; Cihan et al., 2011). According to our results, BOX-PCR pro-files correlated with 16S rRNA groups. Especially the species of B. subtilis, B. subtilis subsp. subtilis, B. licheni-formis, B. safensis and the species of genus Exiguobac-terium discriminated at intraspecies level. However, BOX elements of B. anthracis and B. cereus could not amplified with the same PCR conditions of other sam-ples. Similarly Freitas et al. (2008) reported that BOX elements of some samples were not amplified while the reactions were successful for the other isolates. We con-cluded that new PCR conditions have to be determined for B. anthracis and B. cereus species when BOX-PCR was used as a discriminative fingerprinting method. Contrary to the BOX-PCR, (GTG)5-PCR efficiently distinguished the isolates at species and intraspecies level. Especially B. cohnii, B. anthracis and Exiguobac-terium groups, which were not discriminated by ITS and BOX-PCR, were distinguished at intraspecies level with a higher resolution. Similarly, Freitas et al. (2008) reported that they were carried genomic fingerprint analysis with (GTG)5, BOXA1R and ERIC (Enterobac-terial Repetitive Intergenic Consensus) PCR primers on many different Bacillus isolates and of these tech-niques (GTG)5-PCR provided a wide variety of band profiles. Again similarly, at their study (GTG)5-PCR was not efficient grouping the microorganism accord-ing to BOX and ERIC-PCRs. Also, De Clerck and De Vos (2004) highlighted the efficiency of (GTG)5-PCR when distinguishing the intraspecies level. ARDRA analyses are carried on evolutionarily highly conserved 16S rRNA gene. Despite the conserved property of 16S rRNA gene, AluI restriction fragments correlated with 16S rRNA gene sequence analyses and the isolates partly distinguished at species and intraspecies level. rRNA genes are organized as multiple gene families and it is known that they express from 1 to 15, different copy numbers (Klappenbach and Dunbar, 2000). The mixed groups obtained by HaeIII and TaqI ARDRA analysis may occur because of the different copy num-
bers of 16S rRNA gene. Many studies were carried out on ARDRA analysis of 16S rRNA gene with different restriction enzymes. But, according to our knowledge this is the first study analyzing the ARDRA profiles of alkaline protease producing strains belonging to the Bacillaceae family. In conclusion, by this study, we determined the alkaline protease production capaci-ties of the each isolates and reference strains according to; their carbon source requirements (casein or starch containing growth media), the effect of growth time on enzyme activities (48 and 72 h incubation) and also the effect of pH on enzyme activities (Glycine-NaOH buffer at pH 9.0 and 10.0) by applying various param-eters. Moreover, we identified the taxonomic positions of these numerous endospore-forming bacilli, alkaline protease producing isolates in a polyphasic approach which leads to determine their appropriate taxonomic levels by investigating their phenotypic and genotypic diversity (White et al., 1993; Mora et al., 1998). Accord-ing to the literature, this is the first report that compares many DNA fingerprint techniques with on alkaline protease production capacities of the Bacillus strains. Moreover, many novel Bacillus species were introduced as alkaline protease producers and enumerated accord-ing to their enzyme production capacities.
AcknowledgementsThe Scientific Research Project Office of Ankara University was
supported this research with the project number 11B4240003. DNA sequencing and PCR experiments were carried out at Ankara Uni-versity Biotechnology Institute Central Laboratory Genomics Unit. We would like to thank to Prof. Hilal Ozdag (Ankara University Biotechnology Institute) for her contributions and supports.
Literature
Arellano-Carbajal F. and J. Olmos-Soto. 2002. Thermostable α-1, 4-and α-1, 6-glucosidase enzymes from Bacillus sp. isolated from a marine environment. World J. Microb. Biot. 18: 791–795. Cihan A.C. 2013. Taxonomic classification of Anoxybacillus iso- lates from geothermal regions in Turkey by 16S rRNA gene sequences and ARDRA, ITS-PCR, Rep-PCR analyses. Pol. J. Microbiol. 62: 149–163.Cihan A.C., B. Ozcan, N. Tekin and C. Cokmus. 2011. Phylo-genetic diversity of isolates belonging to genera Geobacillus and Aeribacillus isolated from different geothermal regions of Turkey. World J. Microb. Biot. 27: 2683–2696.Clarridge J.E. 2004. Impact of 16S rRNA gene sequence analysis for identification of bacteria on clinical microbiology and infectious diseases. Clin. Microbiol. Rev. 17: 840–62. Claus D. and C.W. Berkeley. 1986. The genus Bacillus, pp. 1105–1139. In: Sneath pHA (eds). Bergey’s Manual of Systematic Bacterio-logy. Volume 2. Williams, Wilkins, Baltimore. Daffonchio D, S. Borin, A.D. Consolandi, D. Mora, P.L. Manachini and C. Sorlini. 1998a. 16S–23S rRNA internal transcribed spacers as molecular markers for the species of the 16S rRNA group I of the genus Bacillus. FEMS Microbiol. Lett. 163: 229–236.

Tekin N. et al. 156
Daffonchio D., S. Borin, G. Frova, P.L. Manachini and C. Sorlini. 1998b. PCR fingerprinting of whole genomes: the spacers between the 16S and 23S rRNA genes and of intergenic tRNA gene regions reveal a different intraspecific genomic variability of Bacillus cereus and Bacillus licheniformis. Int. J. Syst. Bacteriol. 48: 107–116.De Clerck E. and P. De Vos. 2004. Genotypic diversity among Bacil-lus licheniformis strains from various sources. FEMS Microbiol. Lett. 231: 91–98. Denizci A.A., D. Kazan, E.C.A Abeln and A. Erarslan. 2004. Newly isolated Bacillus clausii GMBAE 42: an alkaline protease producer capable to grow under higly alkaline conditions. J. Appl. Microbiol. 96: 320–327. Felsenstein J. 1985. Confidence-limits on phylogenies – an approach using the bootstrap. Evolution. 39: 783–791.Freitas D.B., M.P. Reis, C.I. Lima-Bittencourt, P.S. Costa, P.S. Assis, E. Chartone-Souza and A.M.A. Nascimento. 2008. Geno- typic and phenotypic diversity of Bacillus spp. isolated from steel plant waste. BMC Res. Notes. 1: 92. Gessesse A. and B.A. Gashe BA. 1997. Production of alkaline pro-tease by an alkaliphilic bacteria isolated from an alkaline soda lake. Biotechnol. Lett. 19: 479–481.Haddar A., R. Agrebi, A. Bougatef, N. Hmidet, A. Sellami-Kamoun and M. Nasri. 2009. Two detergent stable alkaline serine-proteases from Bacillus mojavensis A21: purification, characte ri-za tion and potential application as a laundry detergent additive. Bioresour. Technol. 100: 3366–3373. Horikoshi K. 1999. Alkaliphiles: some applications of their products for biotechnology. Microbiol. Mol. Biol. Rev. 63: 735–50.Huang T.-P., D.D.-S. Tzeng, A.C.L. Wong, C.-H. Chen, K.-M. Lu. Y.-H. Lee, W.-D. Huang, B.-F. Hwang and K.-C. Tzeng. 2012. DNA polymorphisms and biocontrol of Bacillus antagonistic to citrus bacterial canker with indication of the interference of phyllosphere biofilms. PLoS ONE. 7: 421–424.Ito S., T. Kobayashi, K. Ara, K. Ozaki, S. Kawai and Y. Hatada. 1998. Alkaline detergent enzymes from alkaliphiles: enzymatic properties, genetics, and structures. Extremophiles 2: 185–190.Klappenbach J.A. and J.M. Dunbar. 2000. rRNA operon copy num-ber reflects ecological strategies of bacteria. Appl. Environ. Microb. 66: 1328–1333Kumar C.G. and H. Takagi. 1999. Microbial alkaline proteases: from a bioindustrial viewpoint. Biotechnol. Adv. 17: 561–594Logan N.A., O. Berge, A.H. Bishop, H.J. Busse, P. De Vos, D. Fritze, M. Heyndrickx, P. Kämpfer, L. Rabinovitch, M.S. Salkinoja-
Salonen and others. 2009. Proposed minimal standards for describ-ing new taxa of aerobic, endospore-forming bacteria. Int. J. Syst. Evol. Microbiol. 59: 2114–2121. Mora D., M.G. Fortina, G. Nicastro, C. Parini and P.L. Manachini. 1998. Genotypic characterization of thermophilic bacilli: a study on new soil isolates and several reference strains. Res. Microbiol. 149: 711–722.Nielsen P., D. Fritze and F.G. Priest. 1995. Phenetic diversity of alkaliphilic Bacillus strains: proposal for nine new species. Micro-biology 141: 1745–1761. Niyonzima F.N. and S.S. More. 2014. Concomitant production of detergent compatible enzymes by Bacillus flexus XJU-1. Braz. J. Microbiol. 45: 903–910.Saitou N. and M. Nei. 1987. The neighbor-joining method: a new method for reconstructing phylogenetic trees. Mol. Biol. Evol. 4: 406–425.Sari E., E. Loğoğlu and A. Öktemer. 2015. Purification and char-acterization of organic solvent stable serine alkaline protease from newly isolated Bacillus circulans M34. Biomed. Chromatogr. 29: 1356–1363.Stackebrandt E., W. Frederiksen, G.M. Garrity, P.A Grimont, P. Kämpfer, M.C. Maiden, X. Nesme, R. Rosselló-Mora, J. Swings, H.G. Trüper and others. 2002. Report of the ad hoc committee for the re-evaluation of the species definition in bacteriology. Int. J. Syst. Evol. Microbiol. 52: 1043–1047.Suzuki Y., T. Kishigami and S. Abe. 1976. Production of extra-cellular alpha-glucosidase by a thermophilic Bacillus species. Appl. Environ. Microbiol. 31: 807–812.Tamura K., M. Nei and S. Kumar. 2004. Prospects for inferring very large phylogenies by using the neighbor-joining method. Proc. Natl. Acad. Sci. USA 101: 11030–11035. Tamura K., J. Dudley, M. Nei and S. Kumar. 2007. MEGA4: Mole-cular evolutionary genetics analysis (MEGA) software version 4.0. Mol. Biol. Evol. 24: 1596–1599. Tekin N., A.C. Cihan, Z.S. Takaç, C. Yagci, K. Tunc and C. Cok-mus. 2012. Alkaline protease production of Bacillus cohnii APT5. Turk. J. Biol. 36: 430–440. Versalovic J., M. Schneider and F.J. De Bruijn. 1994. Genomic finger printing of bacteria using repetitive sequence-based poly-merase chain reaction. Method. Mol. Cell. Biol. 5: 25–40.White D., R.J. Sharpand and F.G. Priest. 1993. A polyphasic taxo-nomic study of thermophilic bacilli from a wide geographical area. Antonie Van Leeuwenhoek. 64: 357–386.