a comparison of calving and post-calving photo-surveys of...
TRANSCRIPT

A Comparison of Calving and Post-calving
Photo-surveys of the Bluenose-East Herd of
Barren-ground Caribou in Northern Canada in
2010
Jan ADAMCZEWSKI1, John BOULANGER2, Bruno CROFT3, Tracy DAVISON4,
Heather SAYINE-CRAWFORD5, and Boyan TRACZ6
1 Wildlife Division, Environment and Natural Resources, Government of the Northwest Territories, Yellowknife, Northwest
Territories, X1A 2L9, Canada. Email: [email protected] 2 Integrated Ecological Research, Nelson, British Columbia, Canada. 3 North Slave Region, Environment and Natural Resources, Government of the Northwest Territories, Yellowknife, Northwest
Territories, Canada. 4 Inuvik Region, Environment and Natural Resources, Government of the Northwest Territories, Inuvik, Northwest Territories,
Canada. 5Wildlife Division, Environment and Natural Resources, Government of the Northwest Territories, Yellowknife, Northwest
Territories, Canada 6 Sahtú Region, Environment and Natural Resources, Government of the Northwest Territories, Norman Wells, Northwest
Territories, Canada. Present address: Wek'èezhìɪ Renewable Resources Board, 102A, 4504 – 49 Avenue, Yellowknife,
Northwest Territories, Canada.
Abstract
Two photographic survey methods have long been used in Canada’s Northwest Territories and Nunavut to estimate
herd size in migratory barren-ground caribou herds (Rangifer tarandus groenlandicus). The calving photo-survey
provides an estimate of the abundance of breeding females on the calving grounds in June and can be extrapolated to
an estimate of herd size to account for caribou not on the calving grounds. The post-calving photo-survey is carried
out in July when large dense groups of caribou formed in response to insects can be photographed and counted. We
carried out both surveys for the Bluenose-East caribou herd in 2010 in Nunavut to provide a side-by-side comparison.
Correspondence: J. Adamczewski, GNWT ENR, Box 1320, Yellowknife, Northwest Territories, X1A 2L9, Canada;
Email: [email protected]
CWBM 2017: Volume 6, Number 1
Original Research
ISSN: 1929–3100

5
ADAMCZEWSKI et al.
The calving photo survey in early June produced an estimate of 51,757 ± 11,092 (95% Confidence Interval) breeding
females on the calving grounds. We estimated 114,472 ± 15,845 ≥1-year-old caribou from the photographed and
visually counted June survey strata. The estimate of breeding females was extrapolated to a herd size of 105,326 ±
40,984 ≥2-year-old caribou using estimates of sex ratio and pregnancy rate; an alternate extrapolation of 120,880 ±
13,398 ≥2-year-old caribou was derived from strata-based estimates of cows and an estimate of sex ratio. Counts of
photographed caribou aggregations in July resulted in a total of 92,481 ≥1-year-old caribou in 39 groups. An estimate
of herd size using a Lincoln-Petersen formula was 98,646 ± 13,965 ≥1-year-old caribou and an estimate using the
Rivest estimator was 122,697 ± 31,756 ≥1-year-old caribou. The Rivest-derived estimate was likely closest to true
herd size (all ≥1-year-old caribou). We compared strengths and limitations of the 2 survey methods, and their
applicability for management.
Key Words: Barren-ground Caribou, Calving, Photo-survey, Population Estimate, Post-calving.
INTRODUCTION Estimating population size in migratory caribou (Rangifer
tarandus) herds that may number more than half a million
(Bergerud et al. 2008) remains challenging in the 21st
century. Two photographic surveys have been used since the
1980s in the Northwest Territories (NT) and Nunavut (NU)
in northern Canada to estimate population size in migratory
barren-ground caribou (R. t. groenlandicus) herds. Calving
photo-surveys in June (Heard 1985) and post-calving photo-
surveys in July (Valkenburg et al. 1985) take advantage of
caribou aggregating spatially at a time when there is good
separation between herds. Calving photo-surveys have been
used more for eastern herds in NT and NU (Williams 1995;
Nishi et al. 2007; Campbell et al. 2010). Post-calving photo-
surveys have been used more for western herds in NT and
NU (Patterson et al. 2004; Nagy and Johnson 2006), Alaska
(Harper 2013), and Québec (V. Brodeur, 2016, Government
of Québec, personal communication). A side-by-side
comparison of the 2 methods had not been previously carried
out in NT and NU, and was recommended by an independent
review of the Government of Northwest Territories (GNWT)
barren-ground caribou program (Fisher et al. 2009).
Calving photo-surveys, the first of the 2 methods, are
carried out near the peak of calving in June and provide
estimates of the abundance of breeding females on the
calving grounds (Heard 1985; Nishi et al. 2007; Campbell et
al. 2010). Movement rates of cows with newborn calves are
limited, reducing the likelihood of movements inside or
outside the survey area (Gunn et al. 2005). The survey area
is defined by previous knowledge of a herd’s calving
grounds, recent locations of radio-collared cows, and
extensive systematic reconnaissance flights that define the
full distribution of breeding females. In the early years of
calving photo surveys, surveys were completed without
radio-collared caribou (e.g., Heard and Jackson 1990).
However, calving may sometimes occur south of normally
used calving grounds in years of late snowmelt (e.g.,
Porcupine herd in 2000 and 2001, Griffith et al. 2002), thus
a sample of radio-collared cows in June is key confirmation
that the bulk of the herd’s cows are within the survey area.
Survey strata are defined on the calving grounds based on
patterns of spatial aggregation and relative densities and
composition of caribou observed during systematic
reconnaissance flights. A photo plane flies transects of
continuous photos over the higher-density strata with
breeding cows at ground coverage of at least 30-40% (Heard
1985; Gunn et al. 2005; Nishi et al. 2007; Boulanger et al.
2014) and caribou are counted on the photos. Lower-density
strata are re-flown by visual strip-transect methods. A
ground and helicopter-based composition survey in all strata
provides a precise estimate of the proportion of breeding
females and of other sex and age classes in the survey area.
The counts and composition percentages from each stratum
are combined to derive an estimate of the number of breeding
females on the calving ground (Gunn et al. 2005; Nishi et al.
2007; Boulanger et al. 2014).
Because most of the bulls and some of the yearlings and
non-pregnant cows are not on the calving grounds in June,
an extrapolation has been used to account for the missing
caribou to derive an estimate of overall herd size (Heard
1985; Heard and Williams 1990). An estimate of sex ratio
from fall composition surveys is used to account for the bulls,
and an estimate of pregnancy rate is used to account for non-
pregnant breeding-age cows (Heard 1985; Heard and
Williams 1990; Nishi et al. 2007; Campbell et al. 2010).
Since the 2010 Bluenose-East (BE) herd June survey
described in this paper, a revised approach to accounting for
breeding and non-breeding females on the calving ground
survey area was first used by Campbell et al. (2016) for a
2014 calving photo survey of the Qamanirjuaq herd and
more recently for a 2015 survey for the BE herd (Boulanger

6
ADAMCZEWSKI et al.
et al. 2016). This approach uses the estimated totals of
breeding and non-breeding females on the June survey area
directly, and a correction based on sex ratio is applied to
account for bulls. We refer to the earlier extrapolation
method as A, and the more recent one as B.
The large variance on early surveys of this type and the
extrapolation calculations have led some biologists (Thomas
1998; Rivest et al. 1998) to question the value of the calving
photo-survey as a method of counting caribou. Over the
years, however, careful attention to allocation of survey
effort has reduced the variance on estimates of breeding
females (Nishi et al. 2007; Campbell et al. 2010; Boulanger
et al. 2014). Biologists using this survey have emphasized
that the method is repeatable and provides a reliable and
relatively precise way of monitoring size and trend in the
abundance of breeding cows, which are key demographic
variables for the herd (Boulanger et al. 2011).
Post-calving photo-surveys are the second of the 2 survey
methods and are usually carried out in early to mid-July
when warm weather may lead caribou to aggregate in large
groups of hundreds or thousands in response to biting flies.
These groups can be photographed from small fixed-wing
aircraft or helicopters and the caribou counted on the photos
(Valkenburg et al. 1985; Patterson et al. 2004; Nagy and
Johnson 2006; Alaska Fish and Game 2011). Groups of
caribou without radio-collars are also photographed and
counted. This survey includes male and female caribou in
the herd that are at least 1 year old. In some surveys it is
possible to count calves of the year (V. Brodeur, 2016,
Government of Québec, personal communication). In the NT,
the experience has been that some calves of the year are not
always visible in tightly bunched groups of caribou, thus
only ≥1-year-old caribou are counted (e.g., Nagy and
Johnson 2006).
The post-calving survey depends on having adequate
numbers of radio-collared caribou to find the groups
(Valkenburg et al. 1985; Rivest et al. 1998; Rettie 2008),
particularly because movement rates in July can be high due
to biting flies and caribou may use large ranges during this
season. The survey area is essentially defined by flying to the
radio-collared caribou, with additional groups of caribou
(without radio-collars) generally found incidentally near
groups with radio-collars or en route flying to radio-collared
caribou. Post-calving surveys appear capable of enumerating
nearly the entire herd under the right field conditions with
herd-wide aggregation and with adequate radio-collar
numbers (e.g., post-calving surveys of the Western Arctic
Herd in Alaska with 90-100 radio-collars; Alaska Fish and
Game 2011; Harper 2013).
Post-calving surveys, like calving photo-surveys, have
their limitations. Caribou may not aggregate tightly if the
July weather has cool, wet or windy conditions when biting
flies are less active. If the caribou are well dispersed,
photography is not feasible and the survey fails. Post-calving
surveys were attempted for the Porcupine herd annually from
2004 to 2010 and failed due to weather and insufficient
caribou aggregation (Porcupine Caribou Management Board,
www.taiga.net/pcmb/population.html). A further limitation
of this survey is that estimation of caribou groups missed
during the survey is difficult. If there are many small groups
of caribou during post-calving (e.g., BE herd in 2000,
Patterson et al. 2004), then a large number of radio-collars
may be needed to find a high proportion of the groups (Rettie
2008). Under these conditions, there may also be multiple
groups with no radio-collars, which may be less likely to be
found than groups with radio-collars (Rivest et al. 1998).
Two methods have been used to estimate the proportion of
the herd missed by the post-calving survey. One method has
relied on the simple proportion of available radio-collared
caribou in the herd found in photographed groups (e.g.,
Russell et al. 1996; Nagy and Johnson 2006). Some authors
have suggested that only counts of groups with radio-collars
should be used with the Lincoln-Petersen estimator (Russell
et al. 1996, Patterson et al. 2004) whereas other studies have
included caribou from groups without radio-collars (Nagy
and Johnson 2006). In the current paper, we have included
the groups without radio-collars in the Lincoln-Petersen
calculations. The Lincoln-Petersen mark-recapture estimator
was questioned by Rivest et al. (1998), as both population
estimates and variance estimates are likely to be negatively
biased. Rivest et al. (1998) proposed an alternate way of
estimating missed caribou groups and an alternate way of
estimating population size and variance from post-calving
surveys. These methods are statistically more complex but
have been increasingly adopted in Alaska (Harper 2013) and
Québec (V. Brodeur, 2016, Government of Québec, personal
communication), where the Rivest methods were developed.
After an attempted post-calving survey of the Bluenose-
East (BE) herd in July 2009 failed due to poor weather and
insufficient aggregation in portions of the herd, both calving
and post-calving surveys of this herd were planned for 2010.
Declines had been documented in this herd and neighbouring
herds between 2000 and 2006 (Adamczewski et al. 2009).
Attempting both surveys increased the likelihood of securing
an up-to-date population estimate, and allowed for a side-by-
side comparison of the 2 survey methods.

7
ADAMCZEWSKI et al.
In the past, calving ground surveys were used for the
Bluenose herd in the 1980s (e.g., 1983, Latour et al. 1986),
followed by post-calving surveys for this herd in 1986,
198and 1992 (e.g., McLean and Russell 1992). Satellite
radio-collaring studies initiated in the late 1990s then showed
that the Bluenose herd was composed of 3 herds with
individual calving grounds, one of them being the BE herd,
and the other 2, the Bluenose-West and Cape Bathurst herds
(Nagy et al. 2005). Dedicated post-calving surveys for the
BE herd began in 2000 (Patterson et al. 2004).
A modified June calving photo-survey and a post-calving
survey were carried out in 1993 on the George River herd in
Québec/Labrador (Couturier et al. 1996) and produced
similar population estimates. Our objectives in this paper are
to compare results of the 2 BE 2010 surveys, to assess their
strengths and limitations, and to assess their suitability for
management. An earlier version of these results was
documented in a government report (Adamczewski et al.
2014). In this paper we consider all ≥1-year-old caribou in
June or July to be adults; however we note that our re-
examination of the extrapolation calculations of Heard
(1985) and Heard and Williams (1990) indicates that those
calculations omit the yearlings and these estimates are
effectively for ≥2-year-old caribou. We used both the earlier
(A) and the more recent (B) extrapolation calculations for the
BE June 2010 survey data.
Management context of calving and post-calving surveys
in the NT
Although this paper is primarily focused on caribou survey
methods, we provide some context on the management
significance of the population estimates these surveys
generate. Migratory barren-ground caribou herds have long
been known to vary widely in abundance over time scales of
decades (Zalatan et al. 2006; Bergerud et al. 2008; Beaulieu
2012) and have been of enormous significance to Aboriginal
cultures in the Canadian north for thousands of years
(Gordon 2008; Beaulieu 2012). Management plans for herds
like the BE recognize these long-term fluctuations and tie
management strategies for harvest, predators and land use to
herd size, trend and other indicators. A plan called “Taking
Care of Caribou” finalized in 2014 (ACCWM 2014) includes
the BE herd and defines 4 colour phases for this herd as red
(low herd size, ≤20,000), green (high herd size, ≥60,000),
yellow (intermediate herd size, 20,000–60,000, and
increasing) and orange (intermediate herd size, 20,000-
60,000, and declining).
After the 2010 BE surveys described here, further calving
photo surveys in 2013 and 2015 documented a rapid decline
(Boulanger et al. 2014, 2016) with the extrapolated estimate
of ≥2-year-old caribou in 2015 at 38,592 ± 4,733 (95% CI)
and a near 50% loss of breeding females in just 2 years
(Boulanger et al. 2016). These results, in combination with
other indicators and Aboriginal Traditional Knowledge, have
resulted in the herd being designated as in the orange
declining phase, and led to a series of formal hearings in the
NT and NU on management actions in 2016 for this herd,
including severe reductions in harvest (e.g., WRRB 2016).
Although many sources of knowledge are considered in
management, the herd’s size and trend, as defined by photo
surveys every 2-3 years, are key sources of information.
Because of the importance of population estimates for
barren-ground caribou management, the GNWT has since
2006 monitored 5 neighbouring herds (including the BE)
every 3 years via photographic surveys to ensure that size
and trend are adequately known. An assessment of preferable
frequency of population surveys focused on trend and ability
to detect change either by sequential t-tests or regression
analysis, with an average Coefficient of Variation (CV) on
breeding female estimates of 15%, and suggested that
surveys every 3 years were appropriate for herds at low
numbers (Boulanger 2011). Heard and Williams (1990)
carried out an equivalent assessment and reached similar
conclusions. Considerable effort has gone into increasing the
precision of NT post-calving surveys through increased
numbers of caribou radio-collars (e.g., Nagy and Johnson
2006; Rettie 2008) and optimal allocation of survey efforts
has been used to increase precision of calving photo survey
methods (e.g., Boulanger et al. 2014, 2016). The comparison
described here for the BE herd was carried out to assess the
comparability of the 2 survey methods with respect to
estimates of adult caribou and adequacy of precision, using
as a benchmark a CV of 20% or less (Pollock et al. 1990).
True herd size in 2010 was not known and thus the accuracy
of both surveys cannot be assessed directly. However,
similar herd estimates from 2 very different survey methods
in which a high proportion of the counted caribou is from
high-resolution photos should provide some assurance that
the methods are basically sound and can be used for
management as described in the ACCWM (2014) plan for
this herd.
MATERIAL AND METHODS Calving photo-survey in June 2010
June reconnaissance survey and radio-collars
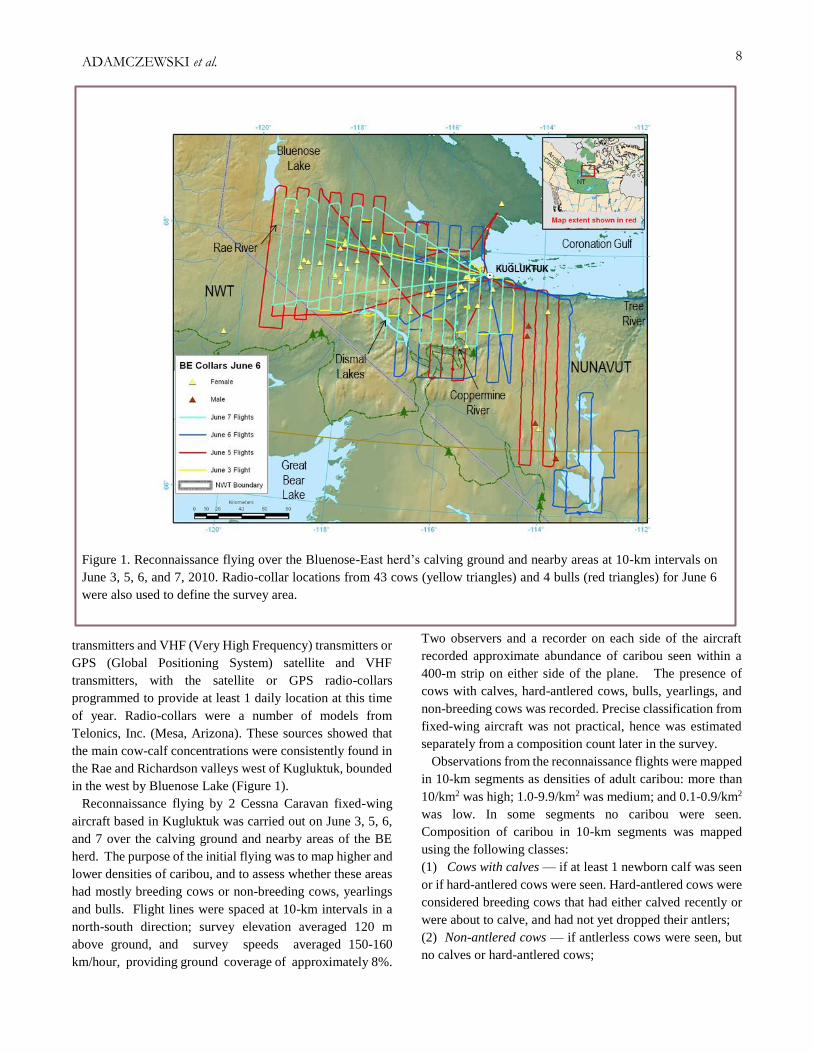
The study area was defined based on previous surveys of
this herd’s calving ground, local knowledge, and locations of
43 radio-collared cows and 4 radio-collared bulls in June
2010 (Figure 1). All radio-collars had either satellite (Argos)
8
ADAMCZEWSKI et al.
transmitters and VHF (Very High Frequency) transmitters or
GPS (Global Positioning System) satellite and VHF
transmitters, with the satellite or GPS radio-collars
programmed to provide at least 1 daily location at this time
of year. Radio-collars were a number of models from
Telonics, Inc. (Mesa, Arizona). These sources showed that
the main cow-calf concentrations were consistently found in
the Rae and Richardson valleys west of Kugluktuk, bounded
in the west by Bluenose Lake (Figure 1).
Reconnaissance flying by 2 Cessna Caravan fixed-wing
aircraft based in Kugluktuk was carried out on June 3, 5, 6,
and 7 over the calving ground and nearby areas of the BE
herd. The purpose of the initial flying was to map higher and
lower densities of caribou, and to assess whether these areas
had mostly breeding cows or non-breeding cows, yearlings
and bulls. Flight lines were spaced at 10-km intervals in a
north-south direction; survey elevation averaged 120 m
above ground, and survey speeds averaged 150-160
km/hour, providing ground coverage of approximately 8%.
Two observers and a recorder on each side of the aircraft
recorded approximate abundance of caribou seen within a
400-m strip on either side of the plane. The presence of
cows with calves, hard-antlered cows, bulls, yearlings, and
non-breeding cows was recorded. Precise classification from
fixed-wing aircraft was not practical, hence was estimated
separately from a composition count later in the survey.
Observations from the reconnaissance flights were mapped
in 10-km segments as densities of adult caribou: more than
10/km2 was high; 1.0-9.9/km2 was medium; and 0.1-0.9/km2
was low. In some segments no caribou were seen.
Composition of caribou in 10-km segments was mapped
using the following classes:
(1) Cows with calves — if at least 1 newborn calf was seen
or if hard-antlered cows were seen. Hard-antlered cows were
considered breeding cows that had either calved recently or
were about to calve, and had not yet dropped their antlers;
(2) Non-antlered cows — if antlerless cows were seen, but
no calves or hard-antlered cows;
Figure 1. Reconnaissance flying over the Bluenose-East herd’s calving ground and nearby areas at 10-km intervals on
June 3, 5, 6, and 7, 2010. Radio-collar locations from 43 cows (yellow triangles) and 4 bulls (red triangles) for June 6
were also used to define the survey area.

9
ADAMCZEWSKI et al.
(3) Non-breeding caribou — if cows without hard antlers
and yearlings were seen; non-breeding cows may have small
new antlers in velvet in June;
(4) Bulls — if bulls were seen;
(5) Mixed non-breeders — if non-breeding cows, yearlings
and bulls were seen.
In the periphery of the study area, few caribou were seen and
composition was sometimes recorded as unknown.
In addition to the 47 (43 cows and 4 bulls) known BE radio-
collared caribou during the June and July 2010 surveys,
within the range of the BE herd, 1 radio-collared cow from
the Bathurst herd (eastern neighbour of the BE herd) died in
mid-June 2010 north of the main BE calving area. Two radio-
collared caribou from the Bluenose-West herd (western
neighbour of the BE herd) were within the summer range of
the BE herd in 2010. One of these was briefly east of
Bluenose Lake in June and early July and then returned to
spend the rest of the summer well west of Bluenose Lake in
Bluenose-West summer range. A second radio-collared cow
that calved on the Bluenose-West calving ground in 2009
was within the BE summer range in June and July 2010, and
in June 2011. Low rates of exchange of radio-collared cows
between neighbouring herds in NT/NU and elsewhere have
been known for many years (Adamczewski et al. 2009;
Boulanger et al. 2011; Davison et al. 2014). These 3 radio-
collared caribou were considered as falling within this
normal low rate of exchange and were not considered further
in estimating population size.
The reconnaissance flights in early June 2010 confirmed
previous information about the distribution of cows, calves
and bulls in this herd , as we found very few cows with young
calves or hard-antlered cows east of the Coppermine River.
Bulls, yearlings and non-breeding cows were observed
consistently in this area. A few lines were flown further east
to ensure spatial separation from Bathurst caribou.
June 2010 survey strata, photos, and strip transect counts
Reconnaissance flying was used to define 6 survey strata
including 1 high-density stratum (Figure 2) and 1 medium-
density stratum with mostly cow-calf caribou, 2 visual low-
density strata with mostly cow-calf caribou (north and
northwest), and 2 strata flown visually with low-medium
densities and mostly bulls, yearlings and non-breeding cows
(east and south). The south stratum was extended south by
10 km further than the initial reconnaissance flight lines due
to the densities of caribou seen at the southern ends of the
lines during the reconnaissance flights.
An optimal-allocation algorithm was used to determine the
number of transect lines and coverage for each of the 6 strata,
depending on stratum size and densities of caribou
seen during the reconnaissance flights. Following
recommendations by Gunn et al. (2005), a minimum of 10
transect lines were used for each stratum to reduce variance.
Consistent with previous surveys of this type, the high and
medium strata were re-flown on June 8 and 9 with a
Commander aircraft (Geographic Air Survey Ltd.,
Edmonton) at an elevation of approximately 610 m taking
continuous photo-transects to provide ground coverage of
31.3% and 16.8% in the high and medium strata (Figure 2).
A total of 7,000 photos were taken. These 2 strata are referred
to as photo strata in the remainder of the paper, and the other
4 strata are referred to as visual strata.
The other 4 strata were re-flown on June 8 and 9 with strip-
transect methods with ground coverage varying from 14.2%
to 28.2%. Survey lines were flown at an elevation of 120 m
and an average survey speed of 150 km/hour, with 2
observers and a recorder on each side of the aircraft. Wing
struts were marked to define a strip of 400 m on the ground
at 120 m above ground on either side of the aircraft, using
methods originally described by Norton-Griffiths (1978),
and followed by previous calving photo-surveys (e.g., Gunn
et al. 2005; Nishi et al. 2007).
Caribou at least 1 year old were counted on the aerial
photos by an experienced consultant (P. Roy) who had
counted caribou on this type of aerial photo for several
previous calving photo-surveys of the Bathurst herd (Gunn
et al. 2005; Nishi et al. 2007) and the Qamanirjuaq herd
(Campbell et al. 2010). The caribou counted on photos could
not be classified as cows, yearlings or bulls, only as ≥1-year-
old caribou. Newborn calves were not counted as they could
not always be seen if hidden by larger caribou or if bedded.
In this paper, we use the term “adult” caribou for any ≥1-
year-old caribou in June or July. In the 4 visual strata, adult
caribou seen by any of the 4 observers were recorded.
June 2010 composition survey
A composition survey was carried out June 8-12 to sample
multiple caribou groups in each of the survey strata (Figure
3). The classification was carried out primarily from the
ground with a telescope and tripod to minimize disturbance
to caribou, with a helicopter used to fly from 1 group of
caribou to the next. Caribou were classified as described by
Gunn et al. (2005) and Nishi et al. (2007) as newborn calves,
cows, yearlings, and bulls. Cows were further classified into
the following categories: (1) antlered cows with a distended
udder; (2) antlerless cows with a distended udder; (3)
antlered cows without a distended udder; and (4) antlerless
cows without a distended udder. The first 2 categories of
cows corresponded to breeding cows based on the distended
udder, and the third, to breeding cows that likely had lost
their calves. The fourth category consisted of non-breeding
females characterized by the absence of a distended udder

10
ADAMCZEWSKI et al.
and usually by the presence of new dark antler growth.
Yearlings were distinguished based on their relatively small
body size and short heads. Bulls were identified based on
their reproductive organs, size and relatively large antlers in
velvet.
Fall 2009 composition survey
To extrapolate from the estimated number of breeding
females on the calving grounds to overall herd size, an
estimate of herd sex ratio has been used from the fall rut in
late October, as it is the one time of year when all sex and
age classes are mixed (Heard 1985; Gunn et al. 2005; Nishi
et al. 2007). A composition survey was carried out on
October 19 and 20, 2009 on the BE range. The survey area
was defined primarily by the locations of 31 radio-collared
BE caribou. In addition, a fixed-wing reconnaissance survey
was flown on October 16, 2009 to verify that substantial
densities of caribou were associated with the concentrations
of radio-collared caribou. Caribou were classified from the
front seat of a helicopter as bulls, cows, and calves of the
year. A total of 4,531 caribou in 79 groups were classified.
Post-calving photo-survey in July 2010
Field methods and photo counts
Reconnaissance flights over the BE summer range were
carried out June 29 to July 4, to gain an overall sense of
caribou distribution and composition of caribou groups
(cows with calves, non-breeding cows, bulls and yearlings;
Figure 4). The survey area was defined based on past July
surveys of this herd and based on the locations of 47 radio-
radio-collared caribou at the beginning of July. One survey
crew was in a Helio-Courier equipped with Telonics RA-
2AK dual antennae and an ATS receiver (Advanced
Telemetry Systems Inc.) and the other survey crew was in a
Cessna 185 equipped with Telonics RA-2AK dual antennae
and a Telonics TR-5 Scanning-Receiver (Telonics, Inc.),
Figure 2. Survey strata, flight lines and coverage for the Bluenose-East June 2010 calving photo-survey. The high-
density and medium-density strata were flown with the Commander photo-plane and the 4 strata outlined in purple
were re-flown visually, with the area coverage as shown for each stratum.

11
ADAMCZEWSKI et al.
with all flights based in Kugluktuk, Nunavut. After the initial
reconnaissance flights, the 2 aircraft were used to check daily
on radio-collared caribou and caribou associated with them,
except during poor weather. Locations of all radio-collared
caribou were received from a satellite link daily in the
mornings and used to plan the day’s flying. Exact locations
of radio-collared caribou were found by homing in on their
VHF signals.
Overall, caribou groups made up mostly of cows with
young calves were found west of Kugluktuk in the Rae and
Richardson valleys and these areas had the largest abundance
of caribou. Mostly cow-calf groups were also found in lower
densities north to the mainland coast (Figure 4). Bulls,
yearlings, and non-breeding cows were primarily east of the
Coppermine River and south-southeast of Kugluktuk, with a
substantial area separating these groups from the cow-calf
groups.
When caribou were seen to be forming groups of hundreds
or thousands suitable for photography, every effort was made
to account for all radio-collared caribou and caribou
associated with them in the area, independently of group size.
Caribou groups found without radio-collars were also
photographed, and GPS locations of all groups were
recorded. Multiple passes of either single photos of entire
groups or multiple series of overlapping photos to cover
larger aggregations were taken. Survey elevation was
adjusted as needed. Photos were taken by 24 megapixel
Nikon D3X cameras set for maximum resolution, through an
open window of the Cessna 185 or through a “shooting
window” on the left side of the Helio-Courier. VHF signals
from the 47 radio-collars were monitored on all flights and
the presence of individual radio-collared caribou was
double-checked to properly identify them in the
photographed groups.
Figure 3: Locations (white triangles) and helicopter flight path (black lines) of caribou groups classified June 8 - 12,
2010 on or near the calving grounds of the Bluenose-East caribou herd.

12
ADAMCZEWSKI et al.
At the end of each day when photos were taken, the photos
were downloaded and reviewed on laptop computers, and the
best images were chosen for each group of caribou. Digital
images were imported into the desktop mapping program Ozi
Explorer (© D & L Software Ltd.) and converted to map files.
Caribou on these images were then marked one after the
other by placing a waypoint for each adult caribou. This
method was developed by biologist J. Nagy and described in
his survey reports (e.g., Nagy and Johnson 2006). All ≥1-
year-old caribou were counted. Calves of the year were not
counted as they could not be reliably identified under or
behind larger caribou, particularly in more closely
aggregated groups.
Caribou on each photo were counted at minimum by 2 of
the authors independently (HS-C and JA). A third person
independently counted a sub-set of the photos as a further
check. On most photos, agreement among counters was close,
with variation of totals well below 1 % (e.g., totals of 915
caribou vs. 918 caribou for a single photo). On a few photos
of larger, tightly aggregated groups taken from higher
elevations, the 2 authors who previously counted all the
photos together counted the photos again to arrive at a final
total.
Estimation of herd size and variance using Lincoln-
Petersen estimator
White and Garrott (1990) augmented the Lincoln-Peterson
Index to apply to radio-collared animals, a method that has
been used in other post-calving surveys (Russell et al. 1996;
Patterson et al. 2004; Nagy and Johnson 2006) to estimate
population size. The formula is:
N = ((M+1)(C+1)/(R+1))-1
Where:
N = estimate of population size during the census;
Figure 4: Initial reconnaissance flights at 10-km intervals at start of July 2010 Bluenose-East caribou post-calving
survey June 29 – July 4, 2010. Radio-collar locations are from 43 cows and 4 bulls on July 1.

13
ADAMCZEWSKI et al.
M = number of radio-collared caribou present in the herd
(including all radio-collars known to be active during the
survey);
C = number of caribou in all aggregations observed during
the survey;
R = number of radio-collared caribou observed in these
aggregations during the survey.
The 95% confidence interval for the estimate is calculated as:
N= 1.96√(Var(N))
Where:
Var(N) = (M+1)(C+1)(M-R)(C-R)/((R+1)2 (R+2))
These calculations were applied to the results of the July
2010 BE post-calving survey.
Estimation of herd size and variance using Rivest
estimator
This section provides a basic summary of the Rivest
approach; readers who want a more detailed statistical
treatment are encouraged to read Rivest et al. (1998). All
calculations were conducted using the R-package (R
Development Core Team 2009) entitled “caribou” (Crépeau
et al. 2012). The Rivest estimator considers the sampling of
post-calving aggregations as a 2-phase sampling process.
The first phase involves the initial radio-collaring of caribou
and how the radio-collared caribou are distributed within the
herd during the post-calving period. For this estimator, it is
assumed that n radio-collared caribou are randomly
distributed into m groups during the post-calving period.
Given that radio-collared caribou are used to estimate
detectability of groups, the Rivest estimator does not use data
for groups of caribou that do not contain radio-collared
caribou.
The second phase of sampling involves the actual aerial
search for groups. For this phase, various models are
proposed as to how the radio-collared caribou represent the
groups, and how the radio-collared caribou and associated
groups are detected. Each model is summarized below.
(1) The homogeneity model — this model assumes that
caribou groups (with radio-collared caribou in the groups)
are missed as a completely random event that is independent
of the number of radio-collared caribou in the group or other
factors. Each group will have the same probability of being
detected by the aerial survey.
(2) The independence model — this model assumes that each
radio-collared caribou in the group has the same independent
probability of being detected and thus the overall probability
of detecting a group increases as a function of the number of
radio-collared caribou in the group. The assumption here is
that the radio-collared caribou are independent so that a
simple probability model can be applied to detection of the
group.
(3) The threshold model — this model assumes that all
groups with more than a threshold level of radio-collared
caribou (symbolized by B) have a detection probability of 1.
For example, it might be that, once more than 3 radio-
collared caribou occur in a group, the group will always be
detected whereas groups with 1 or 2 radio-collars are not
always detected. For this model, all groups with 3 or more
radio-collared caribou are assigned a detection probability of
1, and detection probability is estimated for groups with 1 or
2 radio-collars.
Each of these models can potentially describe detection
probability variation in the data set. As part of the estimation
procedure, a log-likelihood score is produced and the model
with the highest log-likelihood is considered to best fit the
data.
The estimate of herd size is then basically the summation
of each group size divided by the probability of the observed
group having at least 1 radio-collared animal included in it,
and divided by the probability of the group being detected.
The probability of having at least 1 radio-collared caribou is
a function of the group size detection probabilities (which is
associated with the underlying detection model described
previously), the total group size of caribou counted relative
to total herd size, and the overall number of radio-collars
employed in sampling. It is through an iterative likelihood-
based optimization procedure that each of these parameters
is estimated to produce estimates of herd size.
An assumption of this method is that the radio-collared
caribou are randomly distributed among the separate caribou
groups that are photographed. This assumption can be tested
by assessing the number of radio-collared caribou relative to
group sizes that are counted. It is possible to test this
assumption using a test for over-dispersion of the Poisson
probability distribution. Over-dispersion applies to a case
when non-independence of radio-collared caribou produces
a distribution of radio-collared caribou relative to group sizes
that is different from that if the caribou were randomly
distributed. If over-dispersion occurs then both estimates of
population size and variance from the Rivest estimator will
be negatively biased (Rivest et al. 1998).

14
ADAMCZEWSKI et al.
RESULTS
Calving photo-survey in June 2010
Reconnaissance survey June 3-7
Caribou observations recorded during the reconnaissance
flights of June 3, 5, 6 and 7, 2010 were mapped as squares
along the flight lines, with each square representing a 10-km
segment, and darker red squares representing higher
densities (Figure 5a). High (>10/km2) and medium (1.0 -
9.9/km2) adult caribou densities were generally west,
southwest, south, and southeast of Kugluktuk, with lower
densities in more peripheral areas. One high-density stratum,
1 medium-density stratum, and 4 low-density strata were
defined based on the reconnaissance flights (Table 1).
The composition of caribou groups seen in 10-km
segments was similarly mapped (Figure 5b). Cows with
calves and hard-antlered cows were largely clustered in an
elongated area in the Rae and Richardson valleys west of
Kugluktuk. Further south and east in the survey area, non-
breeding caribou predominated, with non-breeding cows and
yearlings closer to the main cow-calf distribution and bulls
in more peripheral areas south and southeast of Kugluktuk.
Caribou counted on photos and in visual strata
Overall, the high and medium density strata were
photographed and contained 77.3% of the 28,478 adult
caribou counted in the 6 survey strata, and a similar 76.1%
of the adult caribou estimated for the entire survey area
(Table 2). These 2 photographed strata also had the highest
densities of adult caribou (10.5 and 8.2/km2). The east and
south visual strata had somewhat lower densities (3.7 and
3.9/km2) and added proportionately to the overall total of
caribou. The north and northwest visual strata had relatively
low caribou densities (0.9 and 1.5/km2).
Observations during the initial reconnaissance flights, along
with composition recorded during June 8-12 indicated that
the peak of calving likely occurred during June 6-9 with
more than 50% of breeding cows observed after these dates
having a calf at heel.
Caribou composition in June 2010 survey strata
The proportion of breeding females among adult caribou
was below 50% in the high stratum, indicating a high number
of non-breeding cows and yearlings (Table 3). The medium
stratum, by contrast, had a much higher proportion of
breeding females (77.0%) and relatively few yearlings. The
calf:cow ratios for breeding females were high in the high
and medium strata (86.0 and 81.2 calves:100 cows), but
because of the large densities of non-breeding cows in the
high stratum, the calf:cow ratio was much lower (49.6
calves:100 cows) when all cows were included, and
somewhat lower (66.2:100) in the medium stratum. The
proportions of breeding cows and estimates of adult caribou
in each stratum were used to derive an estimate of 51,757 (±
11,092) breeding cows for the survey area.
Fall 2009 Bluenose-East composition survey and sex ratio
A total of 79 caribou groups and 4,531 caribou, including
calves of the year, were classified in October 19 - 20, 2009
(Fig. 6, Table 4). This resulted in estimates of 46
calves:100 cows (± 3.5) and 42.9 bulls:100 cows (± 3.4). At
the time of the survey, there were 31 active radio-collars in
the BE herd, of which 30 were within or near the survey area.
There were also 4 radio-collars from the neighbouring
Bathurst herd to the north (Figure 6) but no caribou groups
were classified among these radio-collared caribou.
Table 1. Transect sampling and size of strata for Bluenose-East June 2010 calving photo-survey.

15
ADAMCZEWSKI et al.
Figure 5a. Densities of adult caribou observed during June 2010 Bluenose-East caribou survey during reconnaissance
flights, June 3, 5, 6 and 7. No caribou were seen in white squares and increasing densities are shown as lighter or darker
pink squares, with the highest densities of >10 caribou /km2 in red. Squares represent 10-km segments along flight lines.
Figure 5b. Composition of Bluenose-East caribou groups during reconnaissance flights, June 3, 5, 6 and 7, 2010. The
main cow-calf concentrations were light green squares, bull only areas were dark green and other types of caribou are as
shown in the legend. Squares represent 10-km segments along flight lines.

16
ADAMCZEWSKI et al.
Table 2. Adult caribou estimates by stratum from Bluenose-East June 2010 calving photo-survey. SE = Standard Error;
CV = Coefficient of Variation.
Table 3. June composition survey results and calculated stratum totals, ratios and variance from Bluenose-East June 2010
calving photo-survey. SE = Standard Error; CV = Coefficient of Variation.

17
ADAMCZEWSKI et al.
Figure 6. Composition survey flown October 19 and 20, 2009 in the range of the Bluenose-East caribou herd. Bluenose-
East radio-collar locations are black dots and Bathurst radio-collar locations are blue dots. Composition of caribou groups
near Bathurst radio-collars was not used for this survey.
Table 4. Composition survey results from October 19 and 20, 2009 for the Bluenose-East caribou herd. Ratios are shown ±
95% Confidence Interval.

18
ADAMCZEWSKI et al.
Estimated population size and proportions of cows, bulls
and yearlings from June survey The direct estimate of adult caribou from the June 2010 BE
calving photo-survey included the total estimated number of
≥1-year-old caribou from the survey area of 114,472 ±
15,845 (95% Confidence Interval). The estimated number of
breeding females, 51,757 ± 11,092, was divided by the
proportion of cows in the herd (0.70, from bull:cow ratio of
42.9:100) from the fall 2009 composition survey and by
0.702 as the pregnancy rate for ≥1-year-old cows in the
breeding season, resulting in an extrapolated estimate of
105,326 ± 40,984 ≥2-year-old caribou (Table 5,
extrapolation A). The 0.702 pregnancy rate is based on an
overall pregnancy rate of 285/406 from Dauphiné (1976,
Table 14) for Qamanirjuaq ≥1-year-old cows in the breeding
season in the 1960s. We note that Heard (1985) used a
pregnancy rate of 0.72 based on the same source, which may
have been a rounding error. We also used the more recent
extrapolation method from Campbell et al. (2016), which
included the estimated total of all ≥2-year-old cows in the
survey area, divided by the same proportion of cows in the
herd of 0.70 from the fall 2009 composition survey. This
resulted in a second extrapolated estimate of 120,880 ±
13,398 ≥2-year-old caribou (Table 5, extrapolation B).
We used the totals of adult caribou from Table 2 for each
stratum multiplied by the proportions of cows, bulls, and
yearlings in Table 3 to estimate the total numbers of these 3
sex and age classes in the survey area in each stratum (Table
6). Cows made up 84,603 of the 114,472 adult caribou
(73.9%) estimated for the survey area, and yearlings (13.2%)
and bulls (12.9%) made up the remainder. If the yearlings are
presumed to be divided equally among males and females
(50:50 sex ratio), then the estimated totals overall of adult
females and males were 92,174 (80.5%) and 22,298 (19.5%).
This is equivalent to a ratio of 24.2 bulls:100 cows.
Post-calving survey in July 2010
Radio-collared caribou and photography of aggregated
caribou
The movements of radio-collared caribou varied
considerably in July. The main concentration of radio-
collared cows in cow-calf groups was initially just east of
Bluenose Lake (Figure 4) and later was concentrated further
east and south (Figure 7). Caribou were concentrated in 3
sectors at the time photos were taken in July: bulls, yearlings
and non-breeding cows were primarily in a southern sector
east of the Coppermine River, most of the cow-calf groups
and radio-collared cows were in a main sector west of
Kugluktuk, and some smaller densities of cow-calf groups
were in a northern sector. Aggregation of caribou suitable for
photography generally did not last more than a day, and on
some occasions changing weather meant that groups were
tightly clustered for only a few hours. Caribou in the northern
sector were the least likely to aggregate; caribou with and
without radio-collars in this area tended to remain scattered
except for the one day when photos were taken. Caribou in
the southern sector were more likely to aggregate, which
resulted in 2 separate sets of photos.
Caribou counted on photos from July survey
A total of 40 groups of caribou and 92,481 adult caribou
were counted on photos from the July 2010 BE post-calving
survey (Table 7). Two-thirds of these were in the main sector
that had 30 radio-collars, with the remainder found about
equally in the southern and northern sectors. The number of
radio-collared caribou varied substantially among groups.
There were 22 groups with radio-collars and 18 without
radio-collars. Groups without radio-collared caribou were
mainly between 1,000 and 2,000, with one group of 3,870
caribou. Groups with radio-collared caribou ranged from
1,000 to 11,652. Photos were taken on July 6, 9 and 12; over
this time we monitored collared caribou locations daily and
found no mixing between the main, northern and southern
sectors.
In the northern sector, the largest group photographed had
3 radio-collars and 5,999 caribou, but there was also a group
of nearly 3,870 with a single radio-collar. In the main sector,
the larger groups generally had multiple radio-collars. In the
southern sector on July 6, the largest group was 11,461
caribou with just 1 radio-collar, and another group of 4,080
also had only a single radio-collar. Figure 8 shows a small
group of cows and calves from the July 2010 survey.
The 2 sets of photos of the southern sector resulted in 2
different counts. On July 6, 6 of 7 radio-collared caribou
were found, 9 groups were photographed, and 16,917 adult
caribou were counted on photos. On July 12, 7 of 7 radio-
collared caribou were found, 4 groups were photographed,
and 11,342 adult caribou were counted. We used the higher
July 6 caribou count in the calculations of herd size. We
assumed that the second set of photos was lower because the
caribou had in the meantime formed different groups that
resulted in a few thousand caribou without radio-collars that
were not found on July 12.
Of the 47 radio-collared BE caribou in the survey area in
July 2010, 44 were accounted for at the time of photos taken
on July 6, 9 and 12. The other 3 were active GPS-satellite or
satellite radio-collars. We assumed that these 3 radio-
collared caribou and any caribou associated with them were
in the survey area, given daily and changing GPS locations.
However, although searched for when photos were taken in
the area, they were not found at the time of taking photos due
to erratic signals of VHF transmitters.

19
ADAMCZEWSKI et al.
Table 5. Estimated number of breeding females and extrapolated population estimates (≥2-year-old caribou) for the
Bluenose-East herd in June 2010. Extrapolation A used the estimate of breeding females divided by a sex ratio (42.9
bulls:100 cows, or proportion of females among adult population of 0.70) from an October 2009 Bluenose-East fall
composition survey, and divided by 0.702 from an estimate of 70.2% pregnancy among ≥1-year-old cows in the breeding
season in the herd (Dauphiné 1976). Extrapolation B used the total estimated number of cows on the June survey area divided
by the proportion of females of 0.70. SE = Standard Error, CV = Coefficient of Variation, CI = 95% Confidence Interval.
Table 6. Estimated totals of cows, bulls and yearlings in each stratum, based on estimates of adult caribou in each stratum
(from Table 2) and composition (from Table 3).

20
ADAMCZEWSKI et al.
Figure 7. Locations of main, northern and southern sectors of caribou photographed during July 2010 post-calving survey
of the Bluenose-East herd. Radio-collar locations are from July 10.
Figure 8. Small group of caribou cows and calves photographed during July 2010 post-calving survey of the Bluenose-
East herd. Photo: B. Tracz, Environment and Natural Resources, Government of Northwest Territories.

21
ADAMCZEWSKI et al.
Estimated herd size and variance with Lincoln-Petersen
and Rivest estimators
An estimate of 98,646 ± 13,965 (95% CI) ≥1-year-old
caribou in the BE herd in 2010 was derived using the
Lincoln-Petersen estimator. For the Rivest estimator, only
data for groups that had at least 1 radio-collared caribou were
used. In general, numbers of radio-collared caribou increased
with group size (Figure 9), although 3 groups greater than
4,000 had just one radio-collar.
A suite of detection models was applied to the post-calving
data set. As an initial step, a test for randomness of the
distribution of radio-collars in each caribou group was
conducted using the independence, homogeneity, and
threshold models (Table 8). In all cases, the null hypothesis
of randomness was not rejected, suggesting that this
assumption was reasonable for the BE 2010 data set.
The independence, homogeneity, and threshold models
with thresholds of radio-collared caribou ranging from 2 to 5
were run and compared using log-likelihood scores. A
threshold model that assumed that groups of caribou that had
5 or more radio-collars (B=5) had a detection probability of
1 had the highest likelihood score (2.415; Table 9). This
model indicated that groups with a radio-collar sample size
of < 5 had a detection probability of 0.91. A homogeneity
model had a very similar likelihood (2.412) and in this case
each group had a probability of 0.94 of being detected. A
threshold model with B=2 radio-collars also had a very
similar likelihood (2.409). The estimates and confidence
intervals from these 3 models were very similar (122,697 ±
31,756; 120,495 ± 30,720; and 121,702 ± 31,231) with
acceptable levels of precision (CV<14% for all estimates).
The independence model had a lower likelihood but the
estimate was only marginally higher at 127,101 ± 35,389.
The probability of detection in this case corresponds to the
individual radio-collared caribou and therefore the
probability of detecting a group depended on the number of
radio-collared caribou in the group. For this model the
probability of detecting a group with one radio-collar was
0.83 and the probabilities of detecting a group having 3 or
more radio-collars were very close to 1 (0.99).
DISCUSSION Population estimates for the Bluenose-East herd from
June 2010 calving photo-survey
The BE June 2010 calving photo-survey resulted in 3
estimates of herd size. An estimate of 114,472 ± 15,845 ≥1-
year-old caribou resulted from counts of the 6 survey strata,
Table 7. Groups of caribou, radio-collars, and caribou counted on photos from July 2010 Bluenose-East post-calving survey.

22
ADAMCZEWSKI et al.
including the photographed strata that accounted for about
76% of all caribou counted. The first extrapolated estimate
(A) of 105,326 ± 40,984 caribou was an estimate of ≥2-year-
old caribou, based on further review detailed below, and was
lower primarily because of the omission of yearlings in the
extrapolation. The second extrapolated estimate (B) of
120,880 ± 13,398 was also an estimate of ≥2-year-old
caribou. We suspect that all 3 of these estimates slightly
under-estimated true herd size (all ≥1-year-old caribou).
The calving photo-survey was designed to provide a
precise estimate of the abundance of breeding females on a
herd’s calving grounds (Heard 1985; Gunn et al. 2005;
Boulanger et al. 2014). These surveys were initially carried
out in the 1980s without radio-collared caribou (e.g., Beverly
herd, Heard and Jackson 1990; Williams 1995), relying on
the predictable return of pregnant cows to previous calving
grounds. For the objective of assessing herd status, it could
be argued that assessment of breeding female abundance is
as valuable as an estimate of overall herd size. The use of a
detailed composition survey in June allows for an in-depth
assessment of herd demography (e.g., the proportion of
breeding females on the calving ground and spatial or
temporal variation in composition). The breeding female
sector of the herd will generally be relatively stable over time
and less influenced by annual variation in productivity; the
annual increment of yearlings can vary widely from year to
year (e.g., Boulanger et al. 2011). For the BE June 2010
survey, the first for this herd, the 43 radio-collared cows and
4 radio-collared bulls and extensive reconnaissance flying
allowed us to map and survey the breeding cows on the
calving grounds as planned, with good precision (CV of
9.3%).
The extrapolated estimate (A) of 105,326 ± 40,984 caribou
should be considered a conservative herd estimate as it
effectively is an estimate of ≥2-year-old adults. Yearlings are
not included in the extrapolation because the pregnancy rate
for yearlings (which would be 5-months-old during the
previous fall breeding season) is effectively zero, as caribou
calves almost never breed in their first year and rarely as
yearlings (Dauphiné 1976; Thomas and Kiliaan 1998). Mean
pregnancy rate for extrapolated estimates of herd size has
been estimated by the ratio of caribou that are pregnant
divided by caribou that are capable of being pregnant (0.702,
Dauphiné 1976), and yearlings are almost never pregnant. If
the proportion of yearlings present in the population were
known, then the extrapolated herd estimate could be adjusted
to include yearlings.
Heard (1985) and Heard and Williams (1990) recognized
that an estimate of herd size extrapolated from the estimate
of breeding cows using sex ratio and pregnancy rate was a
“rough estimate” of overall herd size. Our results confirm
their assertion. Some biologists showed little confidence in
this method as an overall estimator of herd size (Rivest et al.
1998; Thomas 1998) because of the assumptions associated
with the extrapolation of the breeding female estimate to
total herd size, and the sometimes large variance of these
estimates. The use of a fall sex ratio and an estimate of
pregnancy rate in the extrapolation can lead to imprecise
herd estimates and inflates variances around the extrapolated
estimates when compared to the estimate of breeding females.
As a percentage of the estimate, the 95% CI on the
extrapolated estimate (A) of ≥2-year-old caribou was 38.9%,
compared to 21.4% on the estimate of breeding females,
17.8% on the estimate of 1-year-old or older caribou on the
June survey area, and 25.9% on the best Rivest estimate from
the post-calving survey.
The estimation of sex ratio from 1 or more recent fall
composition counts is preferable in the extrapolation to using
a fixed sex ratio of 66 bulls:100 cows as initially used by
Heard and Williams (1990, 1991); the sex ratio clearly can
vary and was much lower in the BE herd in 2009 (42.9:100)
than in the increasing herds surveyed by Heard and Williams
in the 1980s. A further BE herd fall composition survey in
October 2013 resulted in a similar bull:cow ratio of 42.6
bulls:100 cows based on a sample of 117 groups and 5,369
caribou (Boulanger et al. 2014), suggesting the 2009-2013
Table 8. Tests for randomness of radio-collared caribou relative to group sizes from Bluenose-East July 2010 post-
calving survey.

23
ADAMCZEWSKI et al.
Table 9. Estimates of Bluenose-East adult caribou herd size in July 2010, based on detection models from Rivest estimation,
ranked by log-likelihood. The Lincoln-Petersen estimate is given for comparison.
Figure 9. Number of caribou counted in individual groups as a function of the number of radio-collared
caribou in each group, for Bluenose-East July 2010 post-calving survey.

24
ADAMCZEWSKI et al.
herd’s sex ratio was relatively constant over that period and
that this ratio could be used reliably in the extrapolation.
The use of a fixed pregnancy rate in the extrapolation
introduces potential error as pregnancy rates vary depending
on cow condition (Gerhart et al. 1997; Russell et al. 1998).
Pregnancy rates in hunter-killed Beverly caribou averaged
75.7% in ≥1-year-old females (605 of 800) from 1981 to
1987, a rate that can be compared directly to Dauphiné’s
(1976) 70% (285 of 406) for ≥1-year-old cows. Annual
pregnancy rates in ≥4-year-old cows during this period in
Beverly caribou ranged from 78 to 98% (Thomas and Kiliaan
1998). Pregnancy rate in ≥2-year-old cows in the George
River herd varied over a similar range from 90-91% during
the herd’s increase to 78-80% near peak herd size and 69-
77 % during its early decline (Bergerud et al. 2008). These
estimates provide an index to the degree to which use of a
constant pregnancy rate of 70% for ≥1-year-old cows based
on Dauphiné (1976) might bias the extrapolation. A potential
improvement in the extrapolation to account for non-
breeding females would be the use of an estimate of
pregnancy rate in the surveyed herd’s females in the winter
before the June survey, either from hunter-killed caribou
(e.g., Thomas and Kiliaan 1998) or from fecal samples
assayed for progesterone (e.g., Joly et al. 2015).
The revised (B) extrapolation approach to accounting for
breeding and non-breeding females on the calving ground
survey area was first used by Campbell et al. (2016); it may
be a preferable approach to extrapolation than the earlier
method (A) that uses ratios for both pregnancy rate and sex
ratio. This approach uses the estimated totals of breeding and
non-breeding females on the June survey area directly, and
there is no calculation based on pregnancy rate. A correction
based on sex ratio is still applied, and this extrapolation still
omits the yearlings. This approach assumes that all ≥2-year-
old cows (that are potential breeders) are within the June
survey area; this assumption is more likely to be valid if there
is an adequate number of radio-collared cows available and
found within the survey area in June. Therefore, the
reliability of this estimate will depend on whether survey
strata included all breeding as well as non-breeding cows. In
June 2010, 41 of 43 BE radio-collared cows were within the
survey area, with the remaining 2 radio-collared cows found
in peripheral areas with very low caribou densities.
The estimate of 114,472 ± 15,845 adults on the June survey
area is based on sample counts of the full survey area, and
76% of the estimated numbers of adults were from the 2
photographed strata. We believe that we defined and
surveyed a high proportion of the non-breeding cows, bulls
and yearlings in the herd, most of them in the south and east
strata that had very few cows with calves. The survey area
included 45 of 47 radio-collared caribou in the herd, with the
other 2 radio-collared caribou in areas with very low
densities of caribou. However, the reconnaissance and
composition survey results suggest that our survey area did
not take in all the bulls, yearlings or non-breeding cows,
particularly at the southern edge of the survey area. The
bull:cow ratio calculated from June counts of strata and the
composition survey was 24.2 bulls:100 cows, well below the
42.9 bull:100 cows estimated in October 2009 for this herd.
The strata-based estimate of 114,472 ≥1-year-old caribou
should be viewed with caution as an unknown proportion of
the bulls, particularly, was missed.
Our June 2010 survey outcome suggests that a modified
June photo-survey for barren-ground caribou that includes
all herd sectors may be feasible, provided that there are
adequate numbers of radio-collared cows and bulls, and if
both the calving grounds and areas with non-breeding
caribou can be comprehensively defined and surveyed. This
could, however, be logistically challenging as the “trailing
edge” of bulls, yearlings and non-breeding cows in early
June may cover a large area with low caribou densities that
extends south of the tree-line.
Population estimates for the Bluenose-East herd from
July 2010 post-calving photo-survey
As with the June survey, the July 2010 BE caribou survey
resulted in 2 population estimates: 122,697 ± 31,756 ≥1-
year-old caribou from the best model of the Rivest estimator
and 98,646 ± 13,965 ≥1-year-old caribou from the Lincoln-
Petersen estimator. All the estimates from the Rivest models
(Table 9) were similar (120,495-127,841) and had similar
confidence intervals.
The estimate of 122,697 ± 31,756 from the Rivest
estimator is the preferred population estimate of the 2 from
the July 2010 BE post-calving survey, as the Lincoln-
Petersen estimate most likely under-estimates herd size and
produces an unrealistically low estimate of variance (Rivest
et al. 1998). A fundamental assumption of the Lincoln-
Petersen estimator is that all radio-collared caribou have
equal probability of detection, and that each radio-collared
caribou will be a random representation of all caribou, so that
the recapture rate of the radio-collared caribou will reflect
the true proportion of the population sampled. This
assumption is problematic given that the number of radio-
collared caribou is very small compared to herd size, and
often larger groups have more radio-collars than smaller
groups. The survey is built around flying to the radio-

25
ADAMCZEWSKI et al.
collared caribou, thus groups with no radio-collars are less
likely to be found. On the BE 2010 survey, all radio-collars
were searched for when photos were being taken, but the 3
radio-collars that were not found at the time of photography
had erratic signals that did not allow us to home in on them.
We had daily GPS or Argos locations for these 3 radio-
collars, which indicated that they were active and moving,
thus were part of the sample of radio-collars available. We
found that VHF transmitters, particularly on older radio-
collars, may sometimes be erratic. Thus some groups,
particularly those with no radio-collars or a single radio-
collar, may have lower detection rates than others. Analysis
of detection probabilities for the current post-calving survey
suggested that groups with several radio-collars were more
likely to be detected than groups with a single radio-collar.
Some ad-hoc methods have been proposed to account for
bias issues with the Lincoln-Petersen estimator (Russell et al.
1996), however, these are subjective and often result in the
loss of data from smaller group sizes (Rivest et al. 1998).
The homogeneity, independence and 5 threshold Rivest
models produced similar estimates between 120,495 and
127,841, similar log-likelihood scores and similar 95% CIs;
thus, there is little clear rationale to select one model over the
others. In practice, it is very likely that a group with 2 or
more radio-collars with functioning GPS/Argos and VHF
transmitters would be found during a post-calving survey
with good conditions and herd-wide aggregation. In
attempted post-calving surveys of this herd in 2009 and 2012,
conditions did arise where a portion of the herd, with
associated radio-collars, did not aggregate sufficiently for
photos and prevented a viable herd estimate. The results we
obtained for caribou in the southern sector where the bulls,
yearlings and non-breeding cows were also concentrated in
July suggest that the number of radio-collars was somewhat
low in this area, and that some caribou may have been missed.
When photos were taken on July 6 in this area, 16,917
caribou in 9 groups were photographed and 6 of 7 radio-
collars were found. Six days later, all 7 radio-collared
caribou in this area were found but the total number of
caribou counted (11,342) in 4 groups was more than 5,000
caribou lower. The groups found on the 2 days were quite
different in size and radio-collar distribution, thus it is
possible that several thousand caribou on July 12 had no
radio-collars and were not found. As we noted for the June
survey, there were just 4 radio-collared bulls (all in the
southern sector, along with 3 radio-collared cows) during the
July survey of this herd, compared to 43 radio-collared cows.
A larger number of radio-collared bulls in closer proportion
to the herd’s bull:cow ratio would improve confidence in the
population estimate from possible future post-calving
surveys of this herd.
Post-calving survey methods with adequate cow and bull
radio-collar numbers can result in estimates of overall herd
size that include all the age classes (≥1-year-old) of the
caribou population. The Rivest estimator can produce robust
population estimates provided radio-collar sample sizes are
adequate (Alaska Department of Fish and Game 2011;
Harper 2013). Analysis of post-calving surveys of the
Western Arctic Herd with 90-100 radio-collared caribou
indicated that the Rivest estimates were generally very
similar to the totals counted on photos, suggesting that the
herd had effectively been censused or counted almost
entirely (Alaska Department of Fish and Game 2011; Harper
2013). The biggest challenge of the post-calving survey
method remains the possibility of caribou not aggregating
sufficiently for photos due to poor weather conditions. As
has happened with other herds, issues with portions of the
herd not aggregating resulted in unsuccessful post-calving
surveys of the BE herd in 2001, 2009, and 2012, and created
challenges in BE surveys flown in 2000, 2005, and 2006.
MANAGEMENT CONSIDERATIONS The preferred population estimate for the BE caribou herd
in 2010 from July of 122,697 ± 31,756 adults had
overlapping confidence intervals with the June strata-based
survey estimate of 114,472 ± 15,845 adults, and differed by
6.7% of the post-calving estimate. The alternate extrapolated
estimate (B) of 120,880 ± 13,398 ≥2-year-old caribou
basedon strata-based estimates of all cows divided by the sex
ratio was very similar to the Rivest July estimate. Because
we suspect that the June strata-based estimate of 114,472 ≥1-
year-old caribou slightly under-estimated the bulls, yearlings
and non-breeding cows in the herd, we suggest that the July
estimate of 122,697 adult caribou is likely closest to the true
population size (≥1-year-old caribou) for the BE herd in
2010. This estimate had a CV of 13.2%, an acceptable
variance below Pollock et al.’s (1990) 20% benchmark, and
the other Rivest models all generated very similar herd
estimates. The biggest problem in using the post-calving
survey for this herd has been the lack of herd-wide
aggregation that has occurred in several attempted surveys of
this herd; attempted surveys in 2001 (Patterson et al. 2004),
and in 2009 and 2012 in the present authors’ experience
resulted in failed surveys and no population estimate.

26
ADAMCZEWSKI et al.
The estimate of breeding females from the June survey had
a CV of 9.3% and the estimate of ≥1-year-old caribou in the
June survey area had a CV of 6.0%, both of which should be
acceptable for management purposes. Heard and Williams
(1990) and Boulanger et al. (2011) emphasized the
importance of size and trend in the breeding female sector of
the herd to its dynamics. The extrapolated estimates of ≥2-
year-old caribou remain rough estimates of herd size, as
described by Heard (1985). The more recent approach to the
extrapolation (B) developed by Campbell et al. (2016) uses
only one ratio calculation and results in a lower variance than
the earlier extrapolation (A) which uses 2 ratios. The BE
2010 estimate from this method of 120,880 was within 1.5%
of the post-calving estimate of 122,697 and this approach
may be preferable for June surveys where there are adequate
radio-collar numbers to define the full distribution of all
cows.
The June and July 1993 surveys of the George River herd
by Couturier et al. (1996) differed somewhat from the
methods and calculations we used, but the June and July
1993 George River population estimates showed good
agreement. Statistically, this is a sample size of just 2
comparisons, and true herd size was not known in either case.
However, the correspondence of the 2 pairs of estimates
suggests that both survey methods are fundamentally sound,
if carried out with adequate radio-collar numbers, field
techniques that emphasize high precision, and appropriate
analyses. Management recommendations about harvest or
other factors (e.g., WRRB 2016) are generally based on a
range in herd sizes and take other factors like trend and key
demographic indicators into account (PCMB 2010;
ACCWM 2014). In the case of the BE herd in 2010, the
management plan (ACCWM 2014) would have identified
the herd as in the green “high numbers” phase based on all
the estimates generated from the June and July 2010 surveys.
ACKNOWLEDGEMENTS Aerial surveys like the June and July 2010 BE calving and
post-calving photo-surveys require months of planning,
logistic support, careful field work, and analysis. We would
like to thank Adam Bourque and Monika Koetzle for capably
piloting the Cessna Caravans during the June survey, Perry
Linton and Brett Van Hearden for capably piloting the Helio-
Courier and Cessna 185 during the July survey, and Jesse
Pierce for flying the helicopter during the June composition
survey. Mathieu Dumond, Jorgen Bolt and Allan Niptanatiak
provided excellent logistic support in Kugluktuk. A special
thank you to Phil Spencer in Norman Wells for daily
supplying the caribou radio-collar locations during the
surveys and for the maps he created for this report.
Our thanks also to Jennifer Bailey for capable support with
data entry and mapping during the June survey. Paul Roy
once again meticulously counted photos from the June
survey, as he has for these surveys for many years. Noel
Doctor, George Mandeville, Kelvin Kotchilea, Joe Blondin,
Nicole McCutchen, Kerri Garner, and Karin Clark were able
observers during the June survey. Andrea Hrynkiw kindly
assisted with the July field work and counting of caribou on
July photos. Judy Williams provided her usual expert support
with logistics and survey planning.
Funding was primarily provided by the GNWT, with
assistance from the Nunavut government. These surveys
represent a collaboration among Inuvik, North Slave and
Sahtú ENR regional staff and ENR headquarters staff.
Alasdair Veitch in Norman Wells provided cheerful support
during the surveys and organized a community observer tour
at the end of the survey in July. We would also like to thank
senior management staff in ENR, including Susan Fleck,
Nicole McCutchen, Ernie Campbell, and Gary Bohnet for
ensuring that we were able to carry out these surveys with
the resources and support that these expensive, time-
consuming surveys depend on.
LITERATURE CITED Advisory Committee for Cooperation on Wildlife
Management (ACCWM). 2014. Taking Care of Caribou
– The Cape Bathurst, Bluenose-West, and Bluenose-East
Barren Ground Caribou Herds Management Plan (Final).
C/O Wek’èezhı̀i Renewable Resources Board, 102A, 4504
– 49 Avenue, Yellowknife, Northwest Territories, Canada.
Adamczewski, J., J. Boulanger, B. Croft, H. D. Cluff, B.
Elkin, J. Nishi, A. Kelly, A. D’Hont, and C. Nicolson.
2009. Decline in the Bathurst caribou herd 2006–2009: a
technical evaluation of field data and modeling.
Department of Environment and Natural Resources,
Government of the Northwest Territories, Yellowknife,
Canada. http://www.wrrb.ca/node/208. Accessed 1
October 2012.
Adamczewski, J., J. Boulanger, B. Croft, T. Davison, H.
Sayine-Crawford, and B. Tracz. 2014. A comparison of
calving and post-calving photo-surveys for the Bluenose-
East herd of barren-ground caribou in the Northwest
Territories, Canada in 2010. Environment and Natural
Resources, Government of Northwest Territories,
Yellowknife, Northwest Territories, Canada, Manuscript
Report no. 244.
Alaska Department of Fish and Game (ADFG). 2011.
Caribou management report of survey-inventory activities
27
ADAMCZEWSKI et al.
1 July 2008 – 30 June 2010. P. Harper, editor. Juneau,
Alaska, USA.
Beaulieu, D. 2012. Dene traditional knowledge about
caribou cycles in the Northwest Territories. Rangifer
Special Issue 20: 59–67.
Bergerud, A. T., S. N. Luttich, and L. Camps. 2008. The
return of caribou to Ungava. Queen's University Press,
Montreal, Québec, Canada.
Boulanger, J. 2011. Optimal survey design, survey intervals,
and analysis strategies for caribou calving ground surveys,
reconnaissance surveys, and composition surveys.
Environment and Natural Resources, Government of
Northwest Territories, Yellowknife, Northwest Territories,
Canada, Unpublished Contract Report.
Boulanger, J., A. Gunn, J. Adamczewski, and B. Croft.
2011. A data-driven demographic model to explore the
decline of the Bathurst caribou herd. Journal of Wildlife
Management 75: 883–896.
Boulanger, J., B. Croft, and J. Adamczewski. 2014. An
estimate of breeding females and analyses of demographics
for the Bluenose-East herd of barren ground caribou: 2013
calving ground photographic survey. Environment and
Natural Resources, Government of Northwest Territories,
Yellowknife, Northwest Territories, Canada, File Report
no.143.
Boulanger, J., B. Croft, J. Adamczewski, D. Lee, N.
Larter, and L.-M. Leclerc. 2016. An estimate of breeding
females and analyses of demographics for the Bluenose-
East herd of barren-ground caribou: 2015 calving ground
photographic survey. Environment and Natural Resources,
Government of Northwest Territories, Yellowknife,
Northwest Territories, Canada, Manuscript Report no. 260.
Campbell, M., J. Nishi, and J. Boulanger. 2010. A calving
ground photo survey of the Qamanirjuaq migratory barren-
ground caribou (Rangifer tarandus groenlandicus)
population, June 2008. Department of Environment,
Nunavut Wildlife Service, Government of Nunavut,
Arviat, Nunavut, Canada, Technical Report Series 2010 -
No. 1-10.
Campbell, M., J. Boulanger, and D. S. Lee. 2016.
Estimating abundance of the Qamanirjuaq mainland
migratory barren-ground caribou subpopulation - June
2014. Department of Environment, Nunavut Wildlife
Service, Government of Nunavut, Arviat, Nunavut,
Canada, Technical Report Series (in preparation).
Couturier, S., R. Courtois, H. Crépeau, L.-P. Rivest, and
S. Luttich. 1996. Calving photocensus of the Rivière
George Caribou Herd and comparison with an independent
census. Rangifer Special Issue no. 9: 283–296.
Crépeau, H., L. P. Rivest, S. Couturier, and S.
Baillargeon. 2012. Package "caribou" (R): Estimation of
caribou abundance based on large scale aggregations
monitored by radio telemetry, Version 1.1. Université
Laval, Québec City, Québec, Canada.
Dauphiné, T. C. Jr. 1976. Biology of the Kaminuriak
population of barren-ground caribou. Part 4: Growth,
reproduction and energy reserves. Canadian Wildlife
Service, Environment Canada, Ottawa, Ontario, Canada,
Canadian Wildlife Service Report Series no. 38.
Davison, T. M., H. Sawada, P. Spencer, M. Branigan, and
R. Popko. 2014. Calving ground fidelity of the
Tuktoyaktuk Peninsula, Cape Bathurst, Bluenose-West
and Bluenose-East barren-ground caribou herds.
Environment and Natural Resources, Government of the
Northwest Territories, Inuvik, NT, Canada. Poster
presentation at the Fifteenth North American Caribou
Workshop, 12 – 16 May 2014, Whitehorse, Yukon,
Canada.
Fisher, J. T., L. D. Roy, and M. Hiltz. 2009. Barren-ground
caribou management in the Northwest Territories: an
independent peer review. Alberta Research Council,
Sustainable Ecosystems Unit, Vegreville, Alberta.
Available from Environment and Natural Resources,
Government of Northwest Territories, Yellowknife,
Northwest Territories, Canada.
Gerhart, K. L., D. E. Russell, D. Van DeWetering, R. G.
White, and R. D. Cameron. 1997. Pregnancy of adult
caribou (Rangifer tarandus): evidence for lactational
infertility. Journal of Zoology, London 242: 17–30.
Gordon, B. C. 2005. 8000 years of caribou and human
seasonal migration in the Canadian Barrenlands. Rangifer
Special Issue 16:155–162.
Griffith, B., D. C. Douglas, N. E. Walsh, D. D. Young, T.
R. McCabe, D. E. Russell, R. G. White, R. D. Cameron,
and K. R. Whitten. 2002. Section 3: the Porcupine
Caribou Herd. US Geological Survey, Biological Science
Report, USGS/BRD 2002-0001.
Gunn, A., J. Nishi, J. Boulanger, and J. Williams. 2005.
An estimate of breeding females in the Bathurst herd of
barren-ground caribou, June 2003. Environment and
Natural Resources, Government of Northwest Territories,
Yellowknife, Northwest Territories, Canada, Manuscript
Report no. 164.
Harper, P., editor. 2013. Caribou management report of
survey-inventory activities 1 July 2010–30 June 2012.
Alaska Department of Fish and Game, Juneau, Alaska,
USA. Species Management Report ADF&G/DWC/SMR-
2013-3, Juneau, Alaska, USA.
Heard, D. C. 1985. Caribou census methods used in the
Northwest Territories. Proceedings of the second North

28
ADAMCZEWSKI et al.
American caribou workshop, Val Morin, Quebec, October
1984. McGill Subarctic Research Paper 40: 229–238.
Heard, D. C., and F. J. Jackson. 1990. Beverly calving
ground survey, June 2-14, 1988. Department of Renewable
Resources, Government of Northwest Territories,
Yellowknife, Northwest Territories, Canada, File Report
no. 86.
Heard, D. C., and M. Williams. 1990. Caribou project
summary and review, February 1990, Part 1. Unpublished
Report. Department of Renewable Resources, Government
of Northwest Territories, Yellowknife, Northwest
Territories, Canada.
Heard, D. C., and M. Williams. 1991. Caribou project
summary and review, February 1990, Part 2, Population
Dynamics. Department of Renewable Resources,
Government of Northwest Territories, Yellowknife,
Northwest Territories, Canada, Unpublished Report.
Joly, K., S. K. Wasser, and R. Booth. 2015. Non-invasive
assessment of the interrelationships of diet, pregnancy rate,
group composition, and physiological and nutritional stress
of barren-ground caribou in late winter. PLoS ONE 10(6):
e0127586.
Latour, P., M. Williams, and D. Heard. 1986. A calving
ground and population estimate for the Bluenose caribou
herd in 1983. Department of Renewable Resources,
Government of Northwest Territories, Yellowknife,
Northwest Territories, Canada, File Report no. 61.
McLean, B. D., and J. D. Russell. 1992. Photocensus of the
Bluenose caribou herd. Department of Renewable
Resources, Government of Northwest Territories,
Yellowknife, Northwest Territories, Canada, File Report
no. 108.
Nagy, J. A., and D. Johnson. 2006. Estimates of the number
of barren-ground caribou in the Cape Bathurst and
Bluenose-West herds and reindeer/caribou on the upper
Tuktoyaktuk Peninsula derived using post-calving
photography, July 2006. Environment and Natural
Resources, Government of Northwest Territories,
Yellowknife, Northwest Territories, Canada, Manuscript
Report no. 171.
Nagy, J.A., W. H. Wright, T. M. Slack, and A. M. Veitch.
2005. Seasonal ranges of the Cape Bathurst, Bluenose-
West, and Bluenose-East barren-ground caribou herds.
Environment and Natural Resources, Government of
Northwest Territories, Yellowknife, Northwest Territories,
Canada, Manuscript Report no. 167.
Nishi, J.S., Croft, B., J. Williams, J. Boulanger, and D.
Johnson. 2007. An estimate of breeding females in the
Bathurst herd of barren-ground caribou, June 2006.
Environment and Natural Resources, Government of
Northwest Territories, Yellowknife, Northwest Territories,
Canada, File Report no. 137.
Norton-Griffiths, M. 1978. Counting Animals: Serengeti
Ecological Monitoring Program Handbook No. 1. African
Wildlife Leadership Foundation, Nairobi, Kenya.
Patterson, B. R., B. T. Olsen, and D. O. Joly. 2004.
Population estimate for the Bluenose-East caribou herd
using post-calving photography. Arctic 57: 47–58.
Pollock, K. H., J. D. Nichols, C. Brownie, and J. E. Hines.
1990. Statistical inference for capture-recapture
experiments. Wildlife Monographs 107: 1–97.
Porcupine Caribou Management Board (PCMB). 2010.
Harvest management plan for the Porcupine Caribou Herd
in Canada. http://www.pcmb.ca/PDF/general
/Plan/Harvest%20Management%20Plan%202010.pdf
R_Development_Core_Team. 2009. R: A language and
environment for statistical computing. In R Foundation for
Statistical Computing, Vienna, Austria.
Rettie, J. 2008. Determining optimal satellite collar sample
sizes for monitoring barren-ground caribou populations.
Environment and Natural Resources, Government of
Northwest Territories, Yellowknife, Northwest Territories,
Canada, Unpublished Contract Report.
Rivest, L. P., S. Couturier, and H. Crepeau. 1998.
Statistical methods for estimating caribou abundance using
postcalving aggregations detected by radio telemetry.
Biometrics 54: 865–876.
Russell, J., S. Couturier, L. G. Sopuck, and K. Ovaska.
1996. Post-calving photocensus of the Rivière George
caribou herd in July 1993. Rangifer 9: 319–330.
Russell, D. E., K. L. Gerhart, R. G. White, and D. Van
De Wetering. 1998. Detection of early pregnancy in
caribou: evidence for embryonic mortality. Journal of
Wildlife Management 62: 1066–1075.
Thomas, D.C. 1998. Needed: less counting of caribou and
more ecology. Rangifer Special Issue 10:15–23.
Thomas, D. C., and H. P. L. Kiliaan. 1998. Fire-caribou
relationships: (II) Fecundity and physical condition of the
Beverly herd. Canadian Wildlife Service, Prairie and
Northern Region, Edmonton, Alberta, Canada., Technical
Report Series no. 310.
Valkenburg, P., D. A. Anderson, J. L. Davis, and D. J.
Reed. 1985. Evaluation of an aerial photocensus technique
for caribou based on radio telemetry. Proceedings of the
second North American caribou workshop, Val Morin,
Québec, October 1984, McGill Subarctic Research Paper
40: 287–299.
White, G. C., and R. A. Garrott. 1990. Analysis of wildlife
Radio tracking data. Academic Press, London, United
Kingdom.

29
ADAMCZEWSKI et al.
Williams, T. M. 1995. Beverly calving ground surveys June
5-16, 1993 and June 2-13, 1994. Department of Renewable
Resources, Government of Northwest Territories,
Yellowknife, Northwest Territories, File Report no. 114.
Wekèezhìı Renewable Resources Board (WRRB). 2016.
Final Report, Part A, Report on a Public Hearing Held by
the Wek'èezhìɪ Renewable Resources Board 6-8 April
2016, Behchokǫ, NT & Reasons for Decisions Related to a
Joint Proposal for the Management of the Bluenose-East
Ɂekwǫ (Barren-ground caribou) Herd. Wek’èezhı̀i
Renewable Resources Board, 102A, 4504 – 49 Avenue,
Yellowknife, Northwest Territories, Canada.
Zalatan, R., A. Gunn, and G. H. R. Henry. 2006. Long-
term abundance patterns of barren-ground caribou using
trampling scars on roots of Picea mariana in the Northwest
Territories, Canada. Arctic, Antarctic and Alpine Research
38: 624–630.
ABOUT THE AUTHORS Jan Adamczewski has a BSc in Wildlife Biology from the
University of Guelph, an MSc from the University of Alberta
in Wildlife Productivity, and a PhD from the University of
Saskatchewan in
Biology. He has
worked as a
biologist for the
Government of
Newfoundland, as
a biologist for the
Sahtú Renewable
Resources Board in Norman Wells, NT, as a regional
biologist for the Yukon Government in Watson Lake, and as
an ungulate biologist with the Government of the Northwest
Territories in Yellowknife. Most of his time since 2007 with
the GNWT has been focused on barren-ground caribou, but
his first love among all wildlife remains muskoxen, which
have the cutest babies on the
planet.
John Boulanger is an
independent wildlife
researcher with Integrated
Ecological Research based out
of Nelson, British Columbia.
He has been working on the
development of barren ground
caribou population estimation
and modeling methods in
Northwest Territories and
Nunavut since 2000. He also specializes in the development
of estimation and modeling methodologies for carnivores
and other wildlife species using DNA mark-recapture
methods. John has a B.Sc. (Wildlife Biology) from Colorado
State University and a Master’s degree (Zoology) from
University of British Columbia. He is a registered
professional biologist in British Columbia.
Bruno Croft began a BSc at the Université du Québec à
Rimouski, then finished it at
Acadia University. Bruno
completed an MSc at the
University of Saskatchewan in
Wildlife Management. Bruno
began working for the
Government of the Northwest
Territories, Environment and
Natural Resources (ENR) as a
wildlife technician in 1986, and
has been a biologist and
wildlife manager since 2006
with main responsibilities for
barren-ground caribou monitoring and management in the
North Slave region. Bruno figures he has probably spent
more time in the air and in the field than anyone else for ENR
since 1986.
Tracy Davison is a regional biologist for the Inuvik region
of the Northwest Territories. The region stretches from the
arctic islands to the Boreal
forest and includes 2 land
claim regions; the Inuvialuit
Settlement Region and the
Gwich’in Settlement Area.
Tracy implements monitoring
and studies in the region to
ensure that the co-
management boards have the
best information possible to make management decisions.
The primary species Tracy monitors are barren-ground
caribou, Peary caribou, muskox, moose and Dall’s Sheep.
Heather Sayine-Crawford holds a BSc in Biology from
the University of Alberta and is working towards an MSc in
fish and wildlife management from Montana State
University. She was a wildlife biologist/manager with the
Government of Northwest
Territories in Norman
Wells, NT for 7 years and
worked on a variety of
wildlife research and
management projects in the
Sahtú region of the
Northwest Territories with most of her time focused on
barren-ground caribou and Dall’s sheep. In April 2017, she

30
ADAMCZEWSKI et al.
moved to Yellowknife to begin a position as Manager of
Wildlife Research and Management in the Wildlife Division.
Boyan Tracz
holds a BSc(H) in
Ecology from the
University of
Manitoba, and both
a MSc in Ecology
and a Master of
Business Administration from the University of Alberta.
Over the past few years, Boyan has focused his activities in
the Northwest Territories, having been the Cumulative
Effects Biologist in the Sahtú Region, and a Program
Manager for the Cumulative Impact Monitoring Program.
Boyan is currently working for the Wek'èezhìɪ Renewable
Resources Board as their Wildlife Management Biologist.
Received 6 June 2016 – Accepted 7 December 2016