a comparison of extreme climate linkages to heat related ... · hrd range hrd count mean hrd mean...
TRANSCRIPT

A Comparison of Extreme Climate Linkages To Heat Related Emergency (911) Calls
in Chicago, Illinois and Phoenix, Arizona 2003 - 2006
Donna A. Hartz
School of Geographical Sciences and Urban Planning
Arizona State University; Tempe, Arizona

Climate Data:
• Phoenix: Sky Harbor NWS ASOS station
• Chicago: Midway Airport (FAA ASOS station)
• Heat Index calculated hourly for both data sets:
HI = -42.379 + 2.04901523T + 10.14333127R - 0.22475541TR - 6.83783x10⁻³T2
- 5.481717x10⁻²R2 + 1.22874x10⁻³T2R + 8.5282x10⁻⁴TR2 - 1.99x10⁻⁶T2R2

Heat Related Emergency Dispatch
(911 call) Data:
• Chicago:
• City of Chicago Department of Environment
• From City of Chicago only: Population 2.8 Million
• Phoenix:
• Phoenix Fire Department’s 911 call dispatch center
• From multiple cities: population 2.7 Million

Chicago versus Phoenix
(Climate)
Chicago Phoenix
Climate Humid Continental
Hot, humid summer
Cool to cold winter
Arid, semi-tropical
Extremely hot summer
Mild winter
Mean rainfall 36.27” 8.29”
July Means:
Maximum Temp
Minimum Temp
83.5°F (28.6°C)
63.2°F (17.3°C)
105.9°F(41.1°C)
82.2°F (27.9°C)
Can reach 103°F (39.4°C) 120°F (48.9°C)

Chicago versus Phoenix
(HRD)
Chicago Phoenix
HRD (2003 – 2006) 1118 4206
Most Occur During May through Sept (2 exceptions: Jan 04 & Oct 05)
March through Oct
(many exceptions)
% Days with HRD
(May – Sept) 32% 92%
% Days w/ 1 or 2 HRD 49% 37%
Highest HRD Count 87 35

Chicago: Days with HRD
with Maximum Temperature and
Maximum Heat Index
2003 - 2006

Phoenix: Days with HRD
with Maximum Temperature and
Maximum Heat Index 2003 - 2006

Phoenix vs Chicago Days with HRD with
Maximum Temperature
2003 - 2006

Phoenix vs Chicago Days with HRD with
Maximum Heat Index
2003 - 2006

HRD
Range
HRD
count
Mean
HRD
Mean
Max T
C
Mean
HI C
Max T
diff
from
Norm
Max T
Max HI
diff
from
Norm
Max T
Chicago HRD
1 to 4 134 1.7 29.2 29.3 1.3 1.4
5 to 9 34 6.5 31.9 32.4 3.8 4.3
10 to 20 17 13.2 33.8 34.9 5.5 6.7
20+ 9 48.3 35.4 39.0 6.3 9.9
Phoenix HRD
1 to 4 418 2.0 34.4 32.5 1.9 0.0
5 to 9 209 7.4 40.1 38.6 2.0 0.2
10 to 20 103 13.0 42.4 40.7 3.3 1.6
20+ 22 26.5 44.3 42.7 4.5 2.9

HRD
Range
HRD
count
Mean
HRD
Mean
Max T
C
Mean
HI C
Max T
diff
from
Norm
Max T
Max HI
diff
from
Norm
Max T
Chicago HRD
1 to 4 134 1.7 29.2 29.3 1.3 1.4
5 to 9 34 6.5 31.9 32.4 3.8 4.3
10 to 20 17 13.2 33.8 34.9 5.5 6.7
20+ 9 48.3 35.4 39.0 6.3 9.9
Phoenix HRD
1 to 4 418 2.0 34.4 32.5 1.9 0.0
5 to 9 209 7.4 40.1 38.6 2.0 0.2
10 to 20 103 13.0 42.4 40.7 3.3 1.6
20+ 22 26.5 44.3 42.7 4.5 2.9
Higher than normal
MaxT and MaxHI does
not play as large a role
in HRD in Phoenix

HRD
Range
HRD
count
Mean
HRD
Mean
MaxT
C
Mean
HI C
Max T
diff
from
Norm
Max T
Max HI
diff
from
Norm
Max T
Chicago HRD
1 to 4 134 1.7 29.2 29.3 1.3 1.4
5 to 9 34 6.5 31.9 32.4 3.8 4.3
10 to 20 17 13.2 33.8 34.9 5.5 6.7
20+ 9 48.3 35.4 39.0 6.3 9.9
Phoenix HRD
1 to 4 418 2.0 34.4 32.5 1.9 0.0
5 to 9 209 7.4 40.1 38.6 2.0 0.2
10 to 20 103 13.0 42.4 40.7 3.3 1.6
20+ 22 26.5 44.3 42.7 4.5 2.9
For 20+ HRD –
Chicago has a much
higher mean number of
HRD than Phoenix
BUT… also a higher than normal
maximum temperature, and much
higher heat index

Heat Wave(s) of 2006 –
Chicago July13 to Aug 3
16 days at or above normal maximum temperatures:
Mean HRD 25.9 Range HRD 1 to 87 Median: 13.5
Mean Max T = 33.4 C (92F) … 4.1 C (7.4F) > normal Mean Heat Index = 36.3 C (97.3F) …7.0 C (12.5F) > normal

Heat Wave of 2006 – Phoenix
July 11 to 26
Mean Max T = 44.4 C (112F) … 4.4 C (8F) > normal Max T)
Mean Heat Index = 42.8C (109F) ... 2.8 C (5F) > normal Max T)
15 days with higher than normal Maximum Temperature
Mean HRD 20.6 Range: 7 to 34 Median: 22

Heat Waves of 2006:
Maximum Temperature
Chicago vs Phoenix
Mean HRD 25.9
Median HRD: 13.5
Range HRD 1 to 87
Mean Max T = 33.4 C (94F)
[4.1 C (7.4F)> normal]
Mean HRD 20.6
Median HRD: 22
Range HRD: 7 to 34
Mean Max T = 44.4 C (112F)
[4.4 C (8F) > normal)

Heat Waves of 2006:
Maximum Heat Index
Chicago vs Phoenix
Mean Heat Index = 42.8C (109F)
[2.8C (5F) > norm]
Mean Heat Index = 36.3 C
(97F) [7.0 C (12.6F) > normal]

Conclusions:
• Phoenix has many more days of HRD each year:
• Begin earlier
• End later in the year
• Chicago has a many fold increase in HRD after about 4 to 5 days of maximum temperature and heat index much higher than the normal maximum temperature
• Phoenix does not experience these huge spikes in HRD
Conclusions:
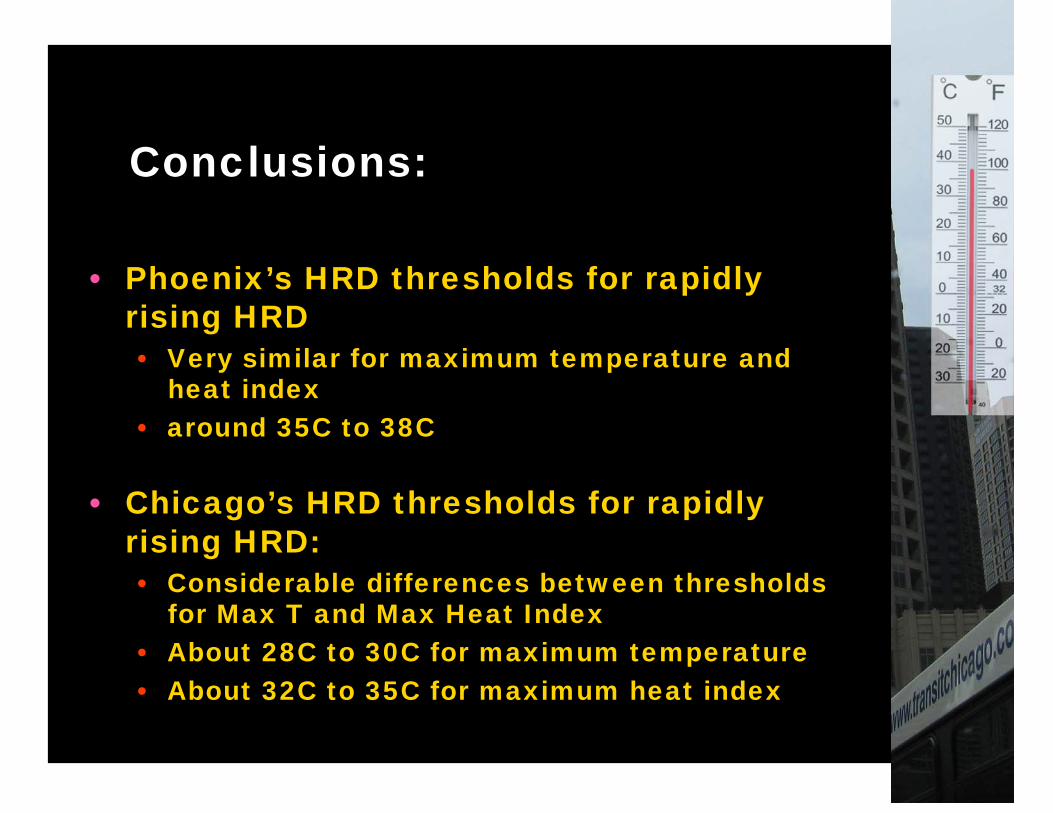
• Phoenix’s HRD thresholds for rapidly
rising HRD
• Very similar for maximum temperature and heat index
• around 35C to 38C
• Chicago’s HRD thresholds for rapidly
rising HRD:
• Considerable differences between thresholds for Max T and Max Heat Index
• About 28C to 30C for maximum temperature
• About 32C to 35C for maximum heat index

Conclusions:
• Maximum temperature and heat index
experienced during Phoenix’s 2006 heat
wave was much less above the normal
maximum temperature than measured
during Chicago’s heat wave.
• Phoenix, during its heat wave experienced relatively moderate increases in HRD
• Chicago had a many fold increase in HRD
when the maximum temperature, and
especially heat index, rose more than 5C
higher than the normal MaxT
Many thanks to my co-authors:
Wen-Ching Chuang, Chona Sister, Anthony Brazel and
Jay Golden, Arizona State University
And:
Nancy Selover, Arizona State Climatologist
City of Chicago
Phoenix Fire Department
Thank you.
Questions?