a comparison of farm-scale models to estimate greenhouse gas emissions from dairy farms in europe
TRANSCRIPT

A comparison of farm-scale models to estimate greenhouse gas emissions
from dairy farms in Europe
The MACSUR Science conference 8-10 April 2015 Reading University UK
Nick Hutchings, Michel De Haan Şeyda Özkan, Daniel Sandars

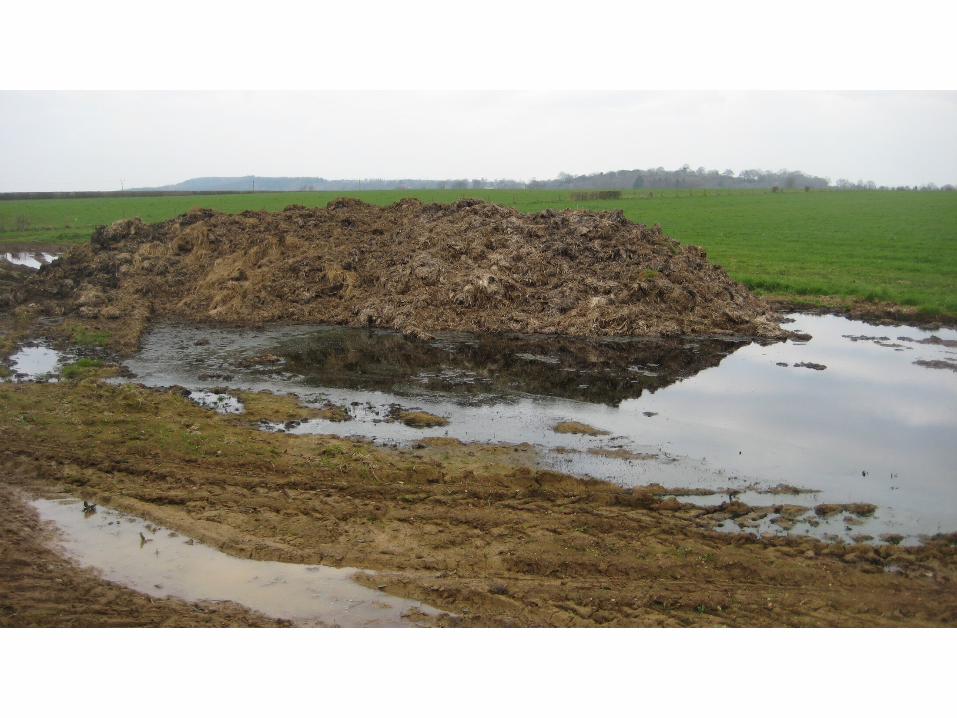
Background
• Farm scale is essential when upscaling ruminant livestock production– significant flexibility in management– substantial internal nutrient cycling
• Farm models differ in:– Focus (production/economics/environment)– Purpose (supporting farmers/farm advisors, regulators)
• How would these differences affect results if the models were used to simulate the same dairy cattle farms?

Models• SFarMod– optimised management– emission factors– portable– 30+ years experience
• Dairywise– optimised feed supply– empirical emission factors– location-specific (Netherlands)– 10+ years of experience

Models• FarmAC– user inputs management– emission factors (except dynamic soil model)– portable– 1 year of experience
• HolosNor– user inputs management– emission factors– Canadian model, adapted for Norway– 2-3 years of experience

Standard factorial scenarios
Warm x cool climate
Sandy x clay soil
Grass only x grass & maize
Cool climate grazing 5 monthsWarm climate grazing 10 months
16 hours/day grazing
Minimum use of concentratesNo manure import/export
600 kg LW & 7000 kg ECM/cow/yr
Dairy cows + followers (1:1)Plant-available N:
Grass 275 kg/ha/yr Maize 150 kg/ha/yr(Manure broadcast)
For each scenario, adjust cow numbers to match feed supply

RESULTS
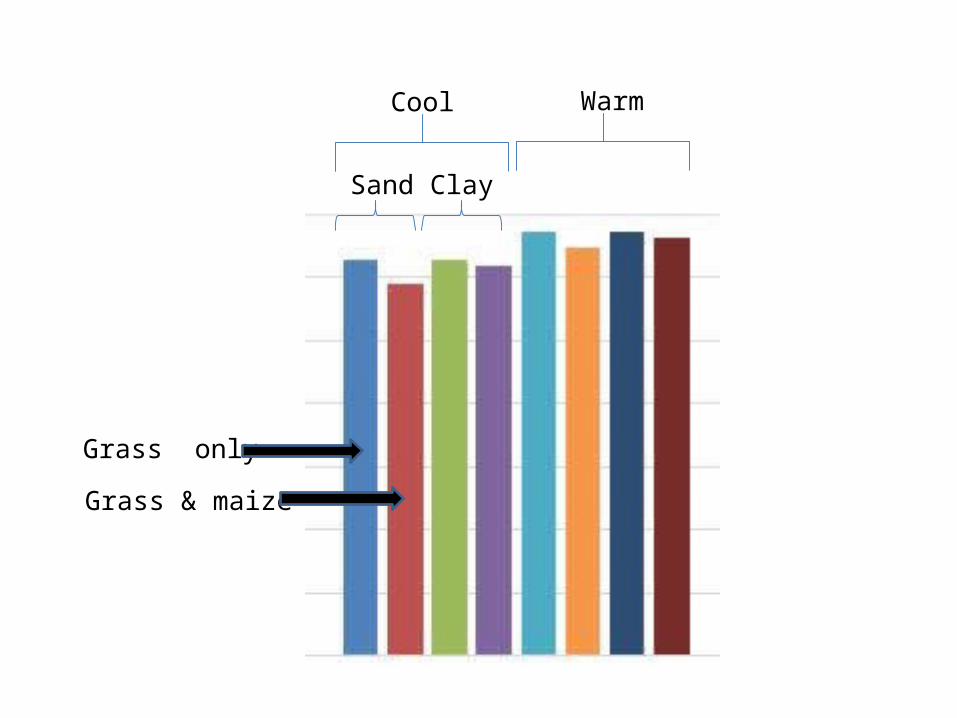
Grass & maize
Grass only
Sand Clay
Cool Warm
SFarMod Dairywise FarmAC HolosNor0.0
0.2
0.4
0.6
0.8
1.0
1.2
1.4
1.6
1.8
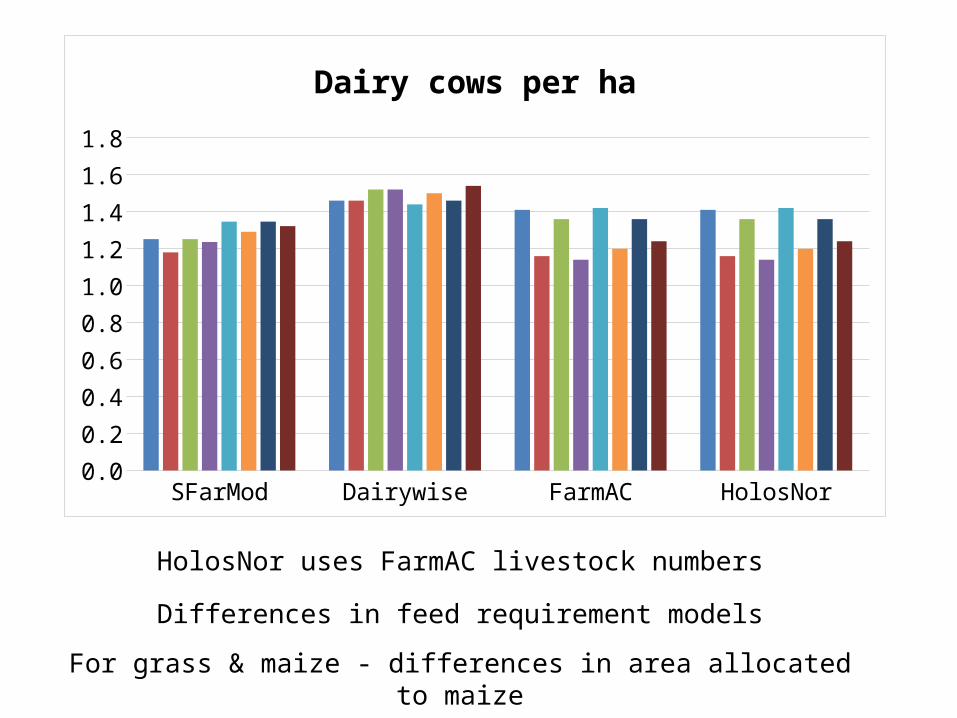
Dairy cows per ha
Differences in feed requirement models
For grass & maize - differences in area allocated to maize
HolosNor uses FarmAC livestock numbers

SFarMod Dairywise FarmAC HolosNor0
2
4
6
8
10
12
14
Total farm GHG emissions (Mg CO2 e / ha)
Note – pre-chain/post-chain not simulated
Grass only > grass & maizeLittle effect of soil type – true for most variables
SFarMod Dairywise FarmAC HolosNor0.00
0.20
0.40
0.60
0.80
1.00
1.20
1.40
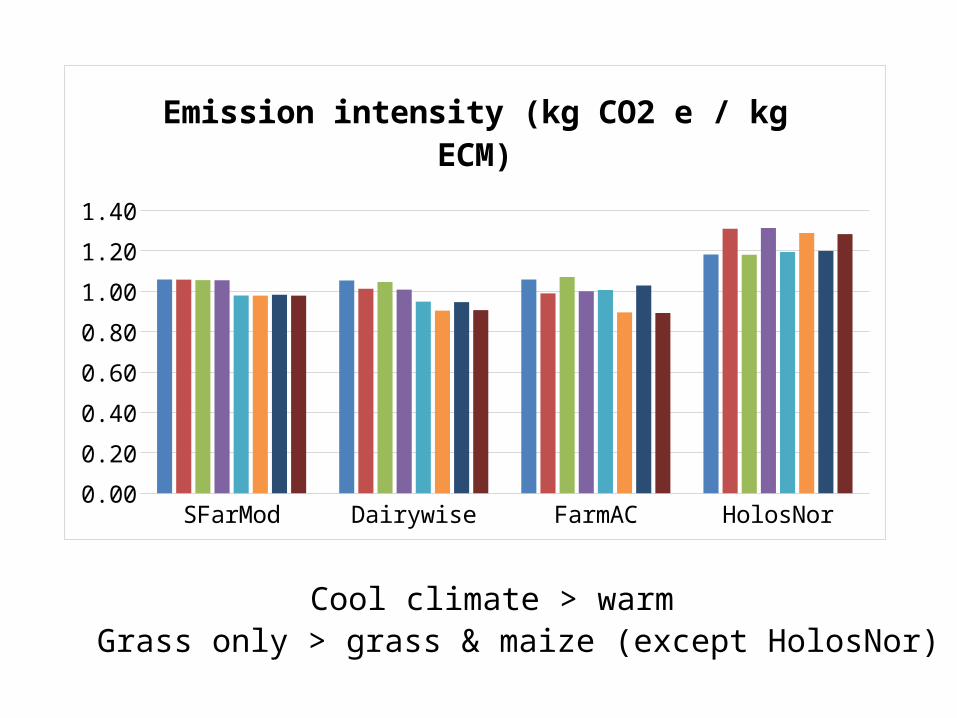
Emission intensity (kg CO2 e / kg ECM)
Cool climate > warmGrass only > grass & maize (except HolosNor)

SFarMod Dairywise FarmAC HolosNor0
1000
2000
3000
4000
5000
6000
7000
Enteric methane emissions (kg CO2 e / ha)
FarmAC low – feed requirement model predicts lower intake necessary to achieve 7000 litres milk/yr

SFarMod Dairywise FarmAC HolosNor0
500
1000
1500
2000
2500
Manure methane emissions (kg CO2 e / ha)
Dairywise imposes Netherlands manure regulations concerning manure storage
Higher for cool climate (more manure produced in housing)

SFarMod Dairywise FarmAC HolosNor0
100
200
300
400
500
600
700
Manure N2O emissions (kg CO2 e / ha)
Higher for cool climate (more manure produced in housing) but relationship between models differs relative to methane

SFarMod Dairywise FarmAC HolosNor0
500100015002000250030003500400045005000
Field N2O emissions (kg CO2 e / ha)
Differences between models in how they treat manure N and excretal N

SFarMod Dairywise FarmAC HolosNor0
200
400
600
800
1000
1200
1400
1600
1800
Total farm indirect GHG emissions (kg CO2 e / ha)
Indirect = nitrous oxide emission resulting from nitrate leaching and ammonia emission
SFarMod Dairywise FarmAC HolosNor0
20
40
60
80
100
120
140
160
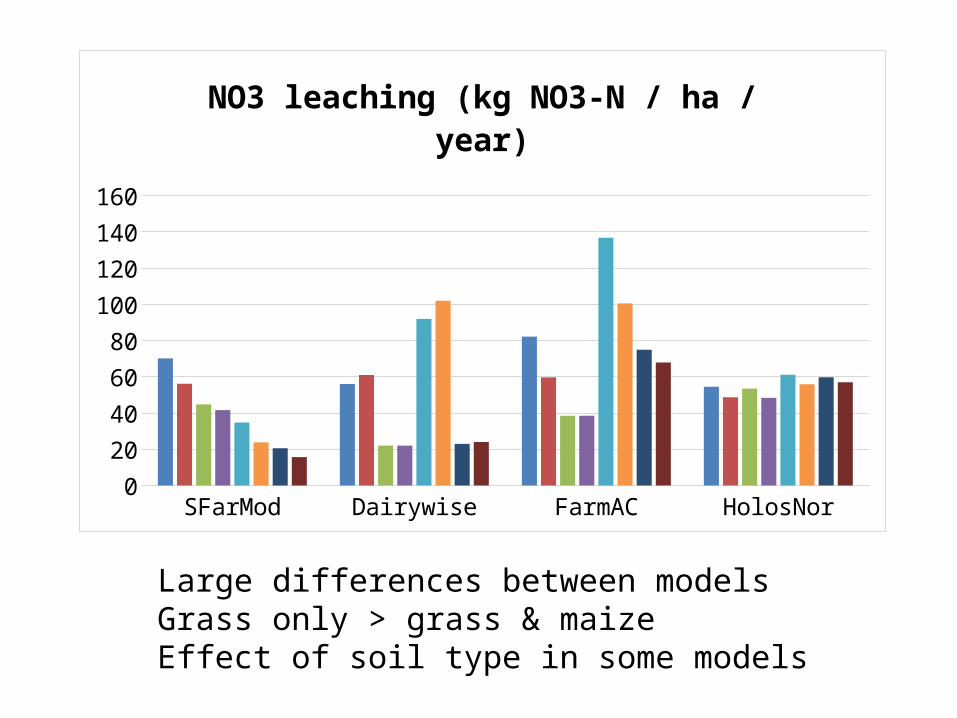
NO3 leaching (kg NO3-N / ha / year)
Large differences between models Grass only > grass & maizeEffect of soil type in some models

SFarMod Dairywise FarmAC HolosNor0
10
20
30
40
50
60
70
80
90
NH3 emissions from field (kg NH3-N / ha / year)
Large differences between models (different emission factors) Grass only > grass & maize
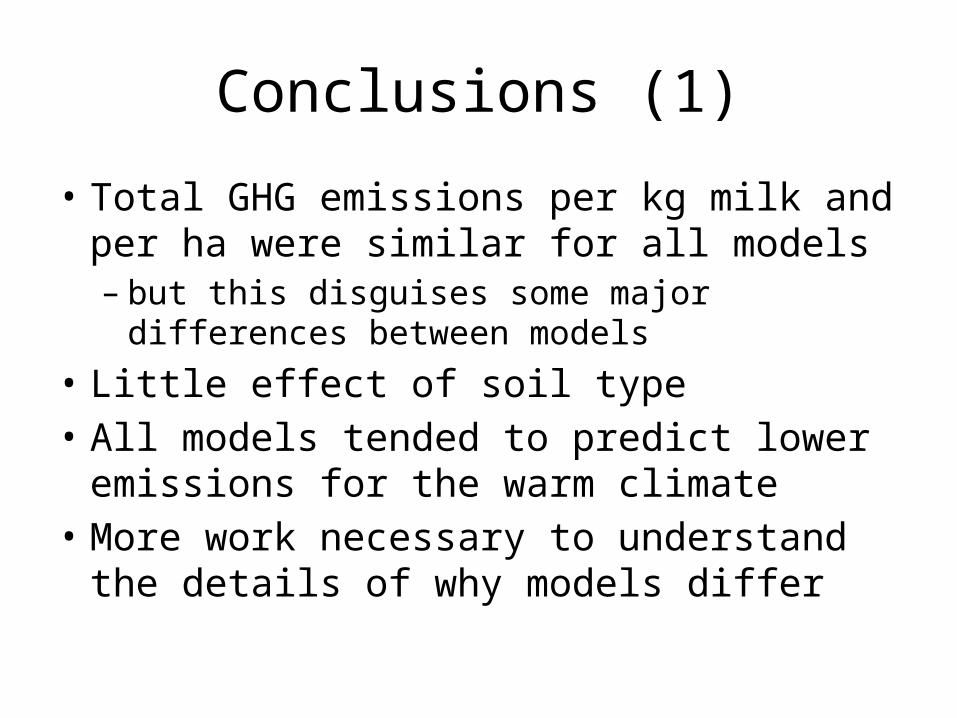
Conclusions (1)
• Total GHG emissions per kg milk and per ha were similar for all models– but this disguises some major differences between
models• Little effect of soil type• All models tended to predict lower emissions
for the warm climate• More work necessary to understand the
details of why models differ
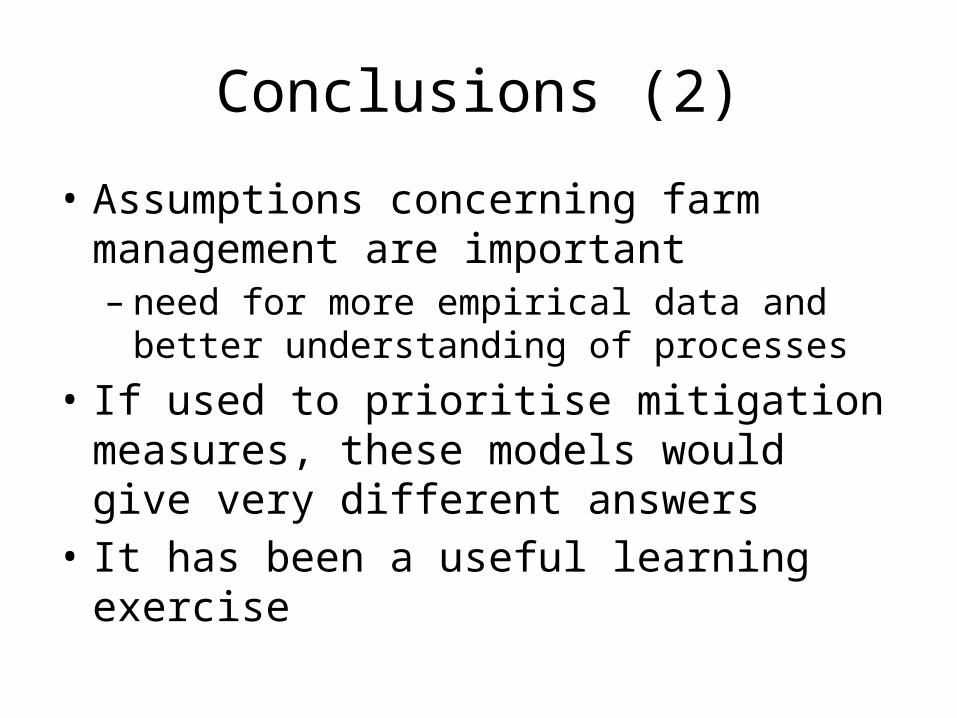
Conclusions (2)
• Assumptions concerning farm management are important– need for more empirical data and better
understanding of processes• If used to prioritise mitigation measures, these
models would give very different answers• It has been a useful learning exercise