a comparison of hierarchical compile strategies - … · snug san jose 2001 4 a comparison of...
TRANSCRIPT

A Comparison of Hierarchical Compile Strategies
Steve Golson
Trilobyte Systems33 Sunset Road
Carlisle MA 01741Phone: +1.978.369.9669
Fax: +1.978.371.9964Email: [email protected]
http://www.trilobyte.com
ABSTRACT
A wealth of new hierarchical compile strategies have become available in the last few years. Thispaper will compare area, speed, and compile time for several large designs using a variety ofhierarchical compile strategies: top-down compile, top-down simple compile, bottom-up withdefault constraints, bottom-up with hand-crafted constraints, and ACS (Automated ChipSynthesis).

1.0 Introduction
Synthesis of large hierarchical designs has traditionally been done in a bottom-up manner: leafmodules are compiled, and then glued together with no further compilation. Top-downcompilation was generally not an option due to capacity restrictions in Design Compiler.
However the capabilities of Design Compiler have grown dramatically in recent years, and severalnew synthesis techniques have become available. This paper compares these new techniques withthe old traditional compile strategies.
Some1 might argue that this doesn’t matter because soon we will all be using Physical Compiler. Isay not so fast, because:
• the features of Physical Compiler might not be needed for your (relatively) small design or foryour (comparatively) slow technology
• Physical Compiler might not be supported by your silicon vendor’s flow
• even if it is supported by your vendor, you might be required to provide a traditional netlist to
the vendor who runs Physical Compiler themselves in gates-to-gates mode2
• Physical Compiler is really only useful once you have almost all your code, and a floorplan
• Physical Compiler is expensive!3
2.0 Example design
The picoJava-II core was chosen as a good evaluation design. It’s freely available and largeenough to be interesting.
The picoJava-II core is a hardware implementation of the Java virtual machine instruction set.Designed by Sun Microsystems, the core is targeted for emerging, networked, embeddedapplications such as:
• Internet chip for network appliances
• Advanced cellular phone
• Traditional embedded products
• Global positioning systems
• Network computers
1. For example, your local Synopsys sales guy.2. Exercise for the reader: in such a DC -> PC flow, what wireload model should you use in DC?3. Or Design Compiler is cheap, depending on how you look at it.
SNUG San Jose 2001 2 A Comparison of Hierarchical Compile Strategies

The picoJava-II core consists of seven major units:
• Integer Unit (IU)
• Floating Point Unit (FPU)
• Instruction Cache Unit (ICU)
• Data Cache Unit (DCU)
• Stack Management Unit (SMU)
• Bus Interface Unit (BIU)
• Powerdown, Clock, Reset, and Scan Unit (PCSU)
The BIU is independent of the other units and was not included as part of this evaluation.
The Verilog source code, synthesis scripts, and constraint files are distributed under theSun Community Source License program as download version “picoJava-II v2.0”. For moreinformation see http://www.sun.com/microelectronics/communitysource/picojava
2.1 Modifications to the distribution
The source code as distributed by Sun expects several macrocells to be used: SRAMS toimplement the caches, ROMs for FPU microcode, and a register file. Where possible thesemacrocells were replaced with functionally-equivalent synthesizable code (ROMs and register
file) and in all other cases (SRAMs) were replaced with non-functional4 but synthesizable code.
The result is 60,000 lines of purely synthesizable Verilog code. The design has about 150k gates,7000 flops, a single clock, no latches, no gated clocks, and no multicycle paths. It is not afunctional picoJava processor, but is an ideal vehicle for EDA tool evaluation.
A top-level constraint file was generated based on Sun’s top-level constraint file.
A clock period of 5ns was used.
2.2 Library modules
The source code as distributed by Sun has a large number of library modules (e.g. flops, muxes,datapath elements) which are intended to be precompiled prior to the main chip synthesis. Sunprovides scripts to perform this compilation after which these small designs are markeddont_touch. These scripts were only used for the baseline strategy; for all other strategiesthese small modules were ungrouped prior to beginning synthesis, resulting in a synthesishierarchy identical to that intended by the Sun designers.
4. “Non-functional” means it doesn’t function as an SRAM. Each SRAM is replaced by synthesizableVerilog code that implements flops on all input ports, flops on all output ports, and XOR gates inbetween.
SNUG San Jose 2001 3 A Comparison of Hierarchical Compile Strategies
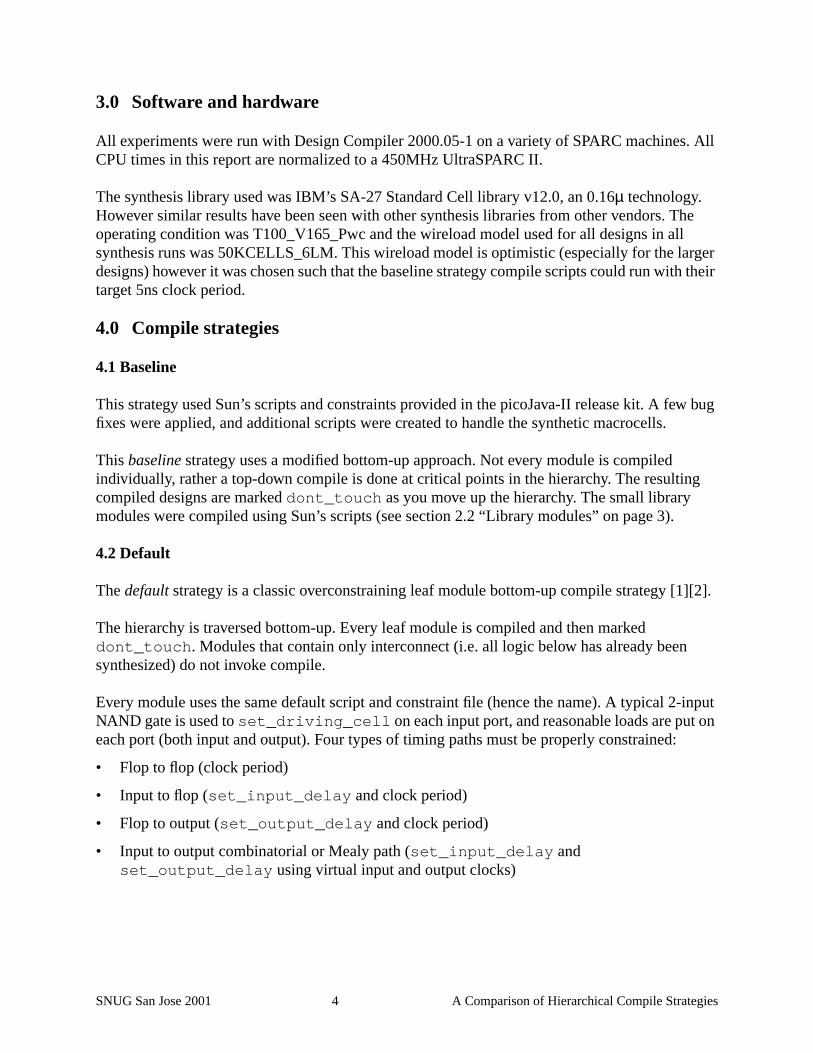
3.0 Software and hardware
All experiments were run with Design Compiler 2000.05-1 on a variety of SPARC machines. AllCPU times in this report are normalized to a 450MHz UltraSPARC II.
The synthesis library used was IBM’s SA-27 Standard Cell library v12.0, an 0.16µ technology.However similar results have been seen with other synthesis libraries from other vendors. Theoperating condition was T100_V165_Pwc and the wireload model used for all designs in allsynthesis runs was 50KCELLS_6LM. This wireload model is optimistic (especially for the largerdesigns) however it was chosen such that the baseline strategy compile scripts could run with theirtarget 5ns clock period.
4.0 Compile strategies
4.1 Baseline
This strategy used Sun’s scripts and constraints provided in the picoJava-II release kit. A few bugfixes were applied, and additional scripts were created to handle the synthetic macrocells.
This baseline strategy uses a modified bottom-up approach. Not every module is compiledindividually, rather a top-down compile is done at critical points in the hierarchy. The resultingcompiled designs are marked dont_touch as you move up the hierarchy. The small librarymodules were compiled using Sun’s scripts (see section 2.2 “Library modules” on page 3).
4.2 Default
The default strategy is a classic overconstraining leaf module bottom-up compile strategy [1][2].
The hierarchy is traversed bottom-up. Every leaf module is compiled and then markeddont_touch. Modules that contain only interconnect (i.e. all logic below has already beensynthesized) do not invoke compile.
Every module uses the same default script and constraint file (hence the name). A typical 2-inputNAND gate is used to set_driving_cell on each input port, and reasonable loads are put oneach port (both input and output). Four types of timing paths must be properly constrained:
• Flop to flop (clock period)
• Input to flop (set_input_delay and clock period)
• Flop to output (set_output_delay and clock period)
• Input to output combinatorial or Mealy path (set_input_delay andset_output_delay using virtual input and output clocks)
SNUG San Jose 2001 4 A Comparison of Hierarchical Compile Strategies

The timing budget assumes a single Mealy module in between the flops:
The Tcl timing constraints look like this:
set PERIOD 5.0
# overconstrain by 20%set default_clock_period [expr $PERIOD * 0.80]
# eighths = 1/8 of clock periodset eighths [expr $default_clock_period / 8.0]
# constrain combinational Mealy paths to 1/2 of periodcreate_clock -period $default_clock_period -name comb_virtual_clkset_input_delay [expr 1 * $eighths] -clock comb_virtual_clk [all_inputs]set_output_delay [expr 3 * $eighths] -clock comb_virtual_clk [all_outputs]
# constrain flop -> flop pathcreate_clock -period $default_clock_period clk
# constrain input -> flop path to 3/8 of periodcreate_clock -period $default_clock_period -name io_virtual_clkset_input_delay [expr 5 * $eighths] -clock io_virtual_clk -add_delay [all_inputs]
# constrain flop -> output path to 1/8 of periodset_output_delay [expr 7 * $eighths] -clock io_virtual_clk -add_delay [all_outputs]
set_false_path -from [find clock io_virtual_clk] -to [find clock io_virtual_clk]set_false_path -from [find clock comb_virtual_clk] -to [find clock clk]set_false_path -from [find clock clk] -to [find clock comb_virtual_clk]set_false_path -from [find clock io_virtual_clk] -to [find clock comb_virtual_clk]set_false_path -from [find clock comb_virtual_clk] -to [find clock io_virtual_clk]
remove_input_delay [find port "clk"]
InputSignal
Module 1
IL OL
clk
Module 2
IL OL
clk
CL
1/8 1/2 3/8
Input delay 5/8
Output delay 7/8
OL: Output forming LogicIL: Input forming LogicCL: Combinatorial Logic
SNUG San Jose 2001 5 A Comparison of Hierarchical Compile Strategies
Only designs with unmapped cells actually invoke compile:
if {[filter [find cell] "@is_mapped==false"] != {}} {compile}
A common modification to this strategy is to follow up the normal compile with anungroup -all -flatten to remove any inferred DesignWare components and then acompile -incremental to clean things up. Note that any previously compiled subdesignsare marked dont_touch and thus will not be ungrouped. Another modification would be to runcompile -top on designs which have all cells mapped.
4.3 Hierarchical
The hierarchical strategy applies top-level constraints and performs a top-level compile:
uniquify compile
4.4 Simple
The simple strategy applies top-level constraints and performs a top-level compile in simplecompile mode:
set_simple_compile_mode true -verbose compile
The simple compile mode disables certain timing-driven optimizations to enable faster runtimesduring compile. This mode is intended for designs that easily meet timing requirements.
The simple compile mode also configures the compile command to run on non-uniquified designsso that multiple instantiated designs are mapped only once. This speeds up the compile processfor a design with multiple instances by compiling only one instance of the design and using thatmapped design for the other instances. In effect a bottom-up compile is performed, withouthaving to create the dependencies manually and determine the order of compilation.
At the end of optimization, the design is automatically uniquified and an incremental compile isperformed.
4.5 ACS pass0
The pass0 strategy uses Automated Chip Synthesis (ACS). This is the typical ACS first pass withRTL sources and using RTL budgeting (top-down environment propagation) to create partitionconstraints. ACS partitions were selected based on Sun’s synthesis scripts (i.e. the partitions arethe same points in the hierarchy where the baseline scripts perform a compile). There are 19partitions.
SNUG San Jose 2001 6 A Comparison of Hierarchical Compile Strategies

4.6 ACS pass1
The pass1 strategy uses the gate-level netlist results from ACS pass0 as a starting point for theacs_refine_design command. First the design is rebudgeted to generate new partitionconstraints and then an incremental compile is performed on each partition.
acs_refine_design \ -source pass0 \ -dest pass1 \ -prepare_only cpu
4.7 ACS pass2
The pass2 strategy uses the gate-level netlist results from ACS pass0 as a starting point for theacs_recompile_design command. First the pass0 netlist is rebudgeted to generate newpartition constraints and then a full compile is performed from the original RTL sources.
acs_recompile_design \ -budget_source pass0 \ -source pass0 \ -dest pass2 \ -prepare_only cpu
Despite the name, this strategy does not depend on the results of pass1.
5.0 Results
Table 1 shows the quality of results (QoR) from report_qor using the baseline strategy.
A more in-depth analysis of timing uses the slack ratio defined for a given path as
.
Table 1: Baseline timing QoR
baseline
Levels of logic 47
Critical path length 6.44
Critical path slack (WNS) -1.76
Total negative slack (TNS) -1312.22
Number of violating paths 2324
slack ratio slackrequired delay----------------------------------=
SNUG San Jose 2001 7 A Comparison of Hierarchical Compile Strategies

The command report_timing -nosplit -path end gives all the necessaryinformation, one line per endpoint. Reference [3] gives more information on slack ratios and slackratio plots.
Plotting the cumulative number of paths that have less than a given slack ratio gives aslack ratio percentage plot. Figure 2 shows such a plot with the baseline results.
Figure 2. Baseline slack ratio percentage plot
The leftmost point on the curve shows a slack ratio of -0.35 corresponding to the worst negativeslack (WNS) of -1.76ns and a period of 5.0ns:
Total negative slack (TNS) corresponds roughly to the area under the curve and left of the axis.
Notice that about one-third of the paths do not meet timing, i.e. they have a negative slack andtherefore a negative slack ratio.
We can use this technique to compare the different compile strategies. All paths in each design arerepresented in this compact graphical format.
0%
10%
20%
30%
40%
50%
60%
70%
80%
90%
100%
-0.6 -0.4 -0.2 0 0.2 0.4 0.6 0.8 1
path
s be
low
the
give
n sl
ack
ratio
slack ratio
baseline
slack ratio slackrequired delay---------------------------------- 1.76–( )
5.0------------------ 0.35–= = =
y
SNUG San Jose 2001 8 A Comparison of Hierarchical Compile Strategies
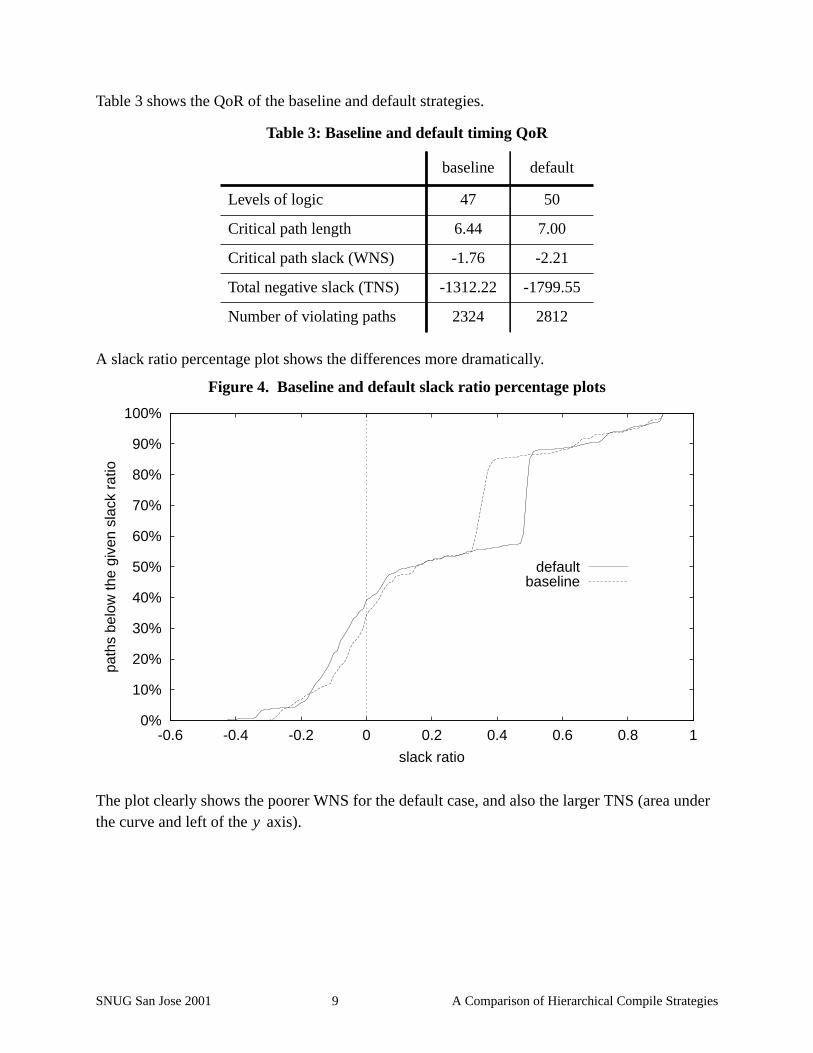
Table 3 shows the QoR of the baseline and default strategies.
A slack ratio percentage plot shows the differences more dramatically.
Figure 4. Baseline and default slack ratio percentage plots
The plot clearly shows the poorer WNS for the default case, and also the larger TNS (area underthe curve and left of the axis).
Table 3: Baseline and default timing QoR
baseline default
Levels of logic 47 50
Critical path length 6.44 7.00
Critical path slack (WNS) -1.76 -2.21
Total negative slack (TNS) -1312.22 -1799.55
Number of violating paths 2324 2812
0%
10%
20%
30%
40%
50%
60%
70%
80%
90%
100%
-0.6 -0.4 -0.2 0 0.2 0.4 0.6 0.8 1
path
s be
low
the
give
n sl
ack
ratio
slack ratio
defaultbaseline
y
SNUG San Jose 2001 9 A Comparison of Hierarchical Compile Strategies

Now consider the hierarchical strategy.
Figure 6. Baseline, default, and hierarchical slack ratio percentage plots
The much improved WNS for the hierarchical strategy is clear, as is the vastly improved TNS.
A perfect synthesis tool would have a slack ratio percentage plot that is a step function at theaxis, i.e. all paths have zero slack. Thus all paths exactly meet their required timing; any positiveslack indicates that area is being wasted to make a path faster than it needs to be.
The hierarchical strategy is closer to the ideal. In particular note that in the region of positive slackratio to the right of the axis, the baseline and especially the default curve are farther to the rightof the hierarchical curve. This indicates that these strategies are wasting effort making non-criticalpaths faster.
Table 5: Baseline, default, and hierarchical timing QoR
baseline default hierarchical
Levels of logic 47 50 36
Critical path length 6.44 7.00 5.40
Critical path slack (WNS) -1.76 -2.21 -0.68
Total negative slack (TNS) -1312.22 -1799.55 -388.76
Number of violating paths 2324 2812 1790
0%
10%
20%
30%
40%
50%
60%
70%
80%
90%
100%
-0.6 -0.4 -0.2 0 0.2 0.4 0.6 0.8 1
path
s be
low
the
give
n sl
ack
ratio
slack ratio
hierarchicaldefault
baseline
y
y
SNUG San Jose 2001 10 A Comparison of Hierarchical Compile Strategies

This wasted effort is clear from Figure 7 which compares the netlist area of each strategy.
Figure 7. Area results
The noncombinational area is similar for all three, since they all have nearly the same number offlip-flops. However the combinational area of the baseline strategy is almost twice that of thehierarchical!
area in thousands of gates
baseline default hierarchical
36
220
256
45
164
209
35
116
150
noncombinational
combinational
total
SNUG San Jose 2001 11 A Comparison of Hierarchical Compile Strategies

Now consider the simple compile strategy. Although the WNS is comparable to the baselinestrategy, the TNS is much worse.
Figure 9. Slack ratio percentage plot
Table 8: Timing QoR
baseline default hierarchical simple
Levels of logic 47 50 36 48
Critical path length 6.44 7.00 5.40 6.59
Critical path slack (WNS) -1.76 -2.21 -0.68 -1.81
Total negative slack (TNS) -1312.22 -1799.55 -388.76 -2017.98
Number of violating paths 2324 2812 1790 2875
0%
10%
20%
30%
40%
50%
60%
70%
80%
90%
100%
-0.6 -0.4 -0.2 0 0.2 0.4 0.6 0.8 1
path
s be
low
the
give
n sl
ack
ratio
slack ratio
hierarchicaldefault
baselinesimple
SNUG San Jose 2001 12 A Comparison of Hierarchical Compile Strategies

L
C
C
T
N
However the area is even smaller than hierarchical strategy:
Figure 10. Area results
Finally, here are the results from ACS.
Table 11: Timing QoR
baseline default hier. simpleACSpass0
ACSpass1
ACSpass2
evels of logic 47 50 36 48 40 37 37
ritical path length 6.44 7.00 5.40 6.59 5.59 5.59 5.57
ritical path slack (WNS) -1.76 -2.21 -0.68 -1.81 -0.75 -0.77 -0.75
otal negative slack (TNS) -1312.22 -1799.55 -388.76 -2017.98 -855.08 -381.16 -250.43
umber of violating paths 2324 2812 1790 2875 2725 1417 788
area in thousands of gates
baseline default hierarchical simple
36
220
256
45
164
209
35
116
150
36
94
130
noncombinational
combinational
total
SNUG San Jose 2001 13 A Comparison of Hierarchical Compile Strategies

The timing for all three ACS strategies is very good. Results are similar to the hierarchicalstrategy.
Figure 12. ACS pass0, pass1, pass2 slack ratio percentage plot
0%
10%
20%
30%
40%
50%
60%
70%
80%
90%
100%
-0.6 -0.4 -0.2 0 0.2 0.4 0.6 0.8 1
path
s be
low
the
give
n sl
ack
ratio
slack ratio
pass0pass1pass2
hierarchical
SNUG San Jose 2001 14 A Comparison of Hierarchical Compile Strategies

Pass1 area is even smaller than the simple strategy.
Figure 13. Area results
Now consider the CPU resources used for each strategy.
The hierarchical compile uses considerable memory. Simple compile is very quick. The defaultand baseline cases take quite a bit of time when run sequentially, but if you have sufficientlicenses and machines many of the jobs can be run in parallel for a significant reduction in wallclock time.
There are two components to each ACS run. First the setup which includes budgeting and thegeneration of scripts, constraints, and Makefile. Secondly the compile is the actual make-drivenbottom-up compilation. Like the default and baseline strategies, the ACS compile step will benefit
Table 14: CPU resources used
baseline default hier. simpleACSpass0
ACSpass1
ACSpass2
Total CPU time (hours) 12.63 8.07 8.54 3.17 11.19 5.54 7.77
Number of jobs 21 192 1 1 20 20 20
Max memory usage (Mbytes) 640 273 1087 374 783 310 456
Max swap usage (Mbytes) 663 294 1108 395 804 340 559
area in thousands of gates
baseline default hierarchical simple pass0 pass1 pass2
36
220
256
45
164
209
35
116
150
36
94
130
36
97
132
34
87
121
36
97
133
noncombinational
combinational
total
SNUG San Jose 2001 15 A Comparison of Hierarchical Compile Strategies

from parallel runs on multiple machines. However the setup is a single job and must be completedbefore compilation can begin. Table 15 shows a breakdown of CPU resources needed for the twoACS steps. The pass0 setup step is by far the most compute-intensive, both in CPU time andmemory. Apparently the pass0 RTL budgeting requires much more computation than the gate-level netlist budgeting in pass1 and pass2.
Table 15: CPU resources used for ACS strategies
ACS pass0 ACS pass1 ACS pass2
setup compile setup compile setup compile
Total CPU time (hours) 3.67 7.52 1.20 4.34 2.02 5.75
Number of jobs 1 19 1 19 1 19
Max memory usage (Mbytes) 783 370 310 259 456 371
Max swap usage (Mbytes) 804 393 340 281 559 388
SNUG San Jose 2001 16 A Comparison of Hierarchical Compile Strategies

Le
Cr
Cr
To 3
Nu
To
Le
Nu
Ne
To
Nu
M
M
Table 16 summarizes all the results for the different strategies.
Both the default and baseline strategies have some nets with design rule violations(max_capacitance, max_fanout, or max_transition). This is because neither strategy performs atop-level compile which would clean up these problems.
Table 16: Summary of results from different compile strategies
baseline default hier. simpleACSpass0
ACSpass1
ACSpass2
vels of logic 47 50 36 48 40 37 37
itical path length 6.44 7.00 5.40 6.59 5.59 5.59 5.57
itical path slack (WNS) -1.76 -2.21 -0.68 -1.81 -0.75 -0.77 -0.75
tal negative slack (TNS) -1312.22 -1799.55 -388.76 -2017.98 -855.08 -381.16 -250.4
mber of violating paths 2324 2812 1790 2875 2725 1417 788
tal area (kgates) 256 209 150 130 132 121 133
Combinational area 220 164 116 94 97 87 97
Noncombinational area 36 45 35 36 36 34 36
af cell count 139949 87606 84393 65545 77308 70537 78184
mber of nets 139973 87630 84445 65597 77332 70561 78208
ts with violations 142 9 0 0 0 0 0
tal CPU time (hours) 12.63 8.07 8.54 3.17 11.19 5.54 7.77
mber of jobs 21 192 1 1 20 20 20
ax memory usage (Mbytes) 640 273 1087 374 783 310 456
ax swap usage (Mbytes) 663 294 1108 395 804 340 559
SNUG San Jose 2001 17 A Comparison of Hierarchical Compile Strategies
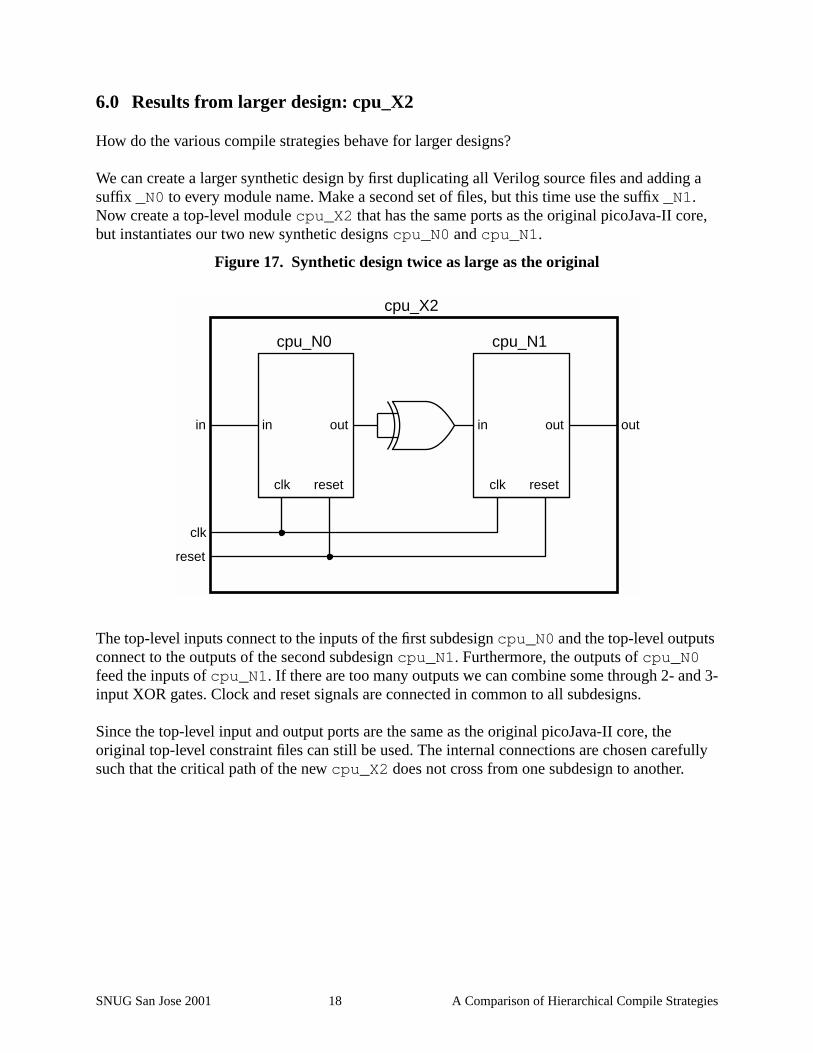
6.0 Results from larger design: cpu_X2
How do the various compile strategies behave for larger designs?
We can create a larger synthetic design by first duplicating all Verilog source files and adding asuffix _N0 to every module name. Make a second set of files, but this time use the suffix _N1.Now create a top-level module cpu_X2 that has the same ports as the original picoJava-II core,but instantiates our two new synthetic designs cpu_N0 and cpu_N1.
Figure 17. Synthetic design twice as large as the original
The top-level inputs connect to the inputs of the first subdesign cpu_N0 and the top-level outputsconnect to the outputs of the second subdesign cpu_N1. Furthermore, the outputs of cpu_N0feed the inputs of cpu_N1. If there are too many outputs we can combine some through 2- and 3-input XOR gates. Clock and reset signals are connected in common to all subdesigns.
Since the top-level input and output ports are the same as the original picoJava-II core, theoriginal top-level constraint files can still be used. The internal connections are chosen carefullysuch that the critical path of the new cpu_X2 does not cross from one subdesign to another.
in inout outin out
cpu_X2
cpu_N0 cpu_N1
clk
reset
clk reset clk reset
SNUG San Jose 2001 18 A Comparison of Hierarchical Compile Strategies

Now we have a synthetic design twice as large as the original, but which should have identicaltiming. The hand-crafted baseline scripts cannot be used, but all other compile strategies wereevaluated. Table 18 summarizes the results.
Table 18: Summary of results from different compile strategies for cpu_X2
cpu_X2 default hier. simpleACSpass0
ACSpass1
ACSpass2
Levels of logic 50 55 50 41 41 36
Critical path length 7.00 6.19 6.80 5.55 5.58 5.51
Critical path slack (WNS) -2.21 -1.37 -1.98 -0.73 -0.76 -0.69
Total negative slack (TNS) -3599.69 -1110.13 -4722.20 -1835.86 -641.06 -606.07
Number of violating paths 5589 2950 5864 5596 2009 1886
Total area (kgates) 418 303 257 265 243 265
Combinational area 329 234 186 194 176 195
Noncombinational area 90 70 71 70 67 70
Leaf cell count 175292 168767 129641 155614 142615 153322
Number of nets 175290 168767 129695 155612 142613 153320
Nets with violations 18 0 0 0 0 0
Total CPU time (hours) 15.80 16.65 5.43 22.99 20.85 16.43
Number of jobs 385 1 1 38 38 38
Max memory usage (Mbytes) 487 1981 583 1502 564 843
Max swap usage (Mbytes) 513 2002 602 1524 593 873
SNUG San Jose 2001 19 A Comparison of Hierarchical Compile Strategies

Table 19 shows a breakdown of the CPU resources for each ACS step. Again the pass0 setup withRTL budgeting requires the most memory and CPU time.
Figure 20 graphically shows the area results for the cpu_X2 design. Similar to the original results,the default strategy has much larger area compared to the others. Again, ACS pass1 is thesmallest.
Figure 20. Area results for cpu_X2
Table 19: CPU resources used for ACS strategies for cpu_X2
cpu_X2ACS pass0 ACS pass1 ACS pass2
setup compile setup compile setup compile
Total CPU time (hours) 7.81 15.18 3.05 17.80 2.62 13.81
Number of jobs 1 37 1 37 1 37
Max memory usage (Mbytes) 1502 470 564 465 843 476
Max swap usage (Mbytes) 1524 498 593 489 873 500
area in thousands of gates
defaultX2
hierarchicalX2
simpleX2
pass0X2
pass1X2
pass2X2
90
329
418
70
234
303
71
186
257
70
194
265
67
176
243
70
195
265
noncombinational
combinational
total
SNUG San Jose 2001 20 A Comparison of Hierarchical Compile Strategies

Here are slack ratio percentage plots showing the cpu_X2 results. Again we see the advantages ofthe hierarchical and ACS strategies.
Figure 21. Slack ratio percentage plot for cpu_X2
Figure 22. Slack ratio percentage plot for cpu_X2
0%
10%
20%
30%
40%
50%
60%
70%
80%
90%
100%
-0.6 -0.4 -0.2 0 0.2 0.4 0.6 0.8 1
path
s be
low
the
give
n sl
ack
ratio
slack ratio
hierarchical X2simple X2default X2pass0 X2
0%
10%
20%
30%
40%
50%
60%
70%
80%
90%
100%
-0.6 -0.4 -0.2 0 0.2 0.4 0.6 0.8 1
path
s be
low
the
give
n sl
ack
ratio
slack ratio
pass0 X2pass1 X2pass2 X2
hierarchical X2
SNUG San Jose 2001 21 A Comparison of Hierarchical Compile Strategies

7.0 Results from larger design: cpu_X5
In a similar manner even larger synthetic designs can easily be made. Table 23 shows results for asynthetic design with five copies of the picoJava-II core. Note that the hierarchical strategy couldnot be completed; it exceeded the available memory in Design Compiler.
Table 23: Summary of results from different compile strategies for cpu_X5
cpu_X5 default hier. simpleACSpass0
ACSpass1
ACSpass2
Levels of logic 50 51 42 38 38
Critical path length 7.00 6.77 5.64 5.57 5.61
Critical path slack (WNS) -2.21 -1.95 -0.84 -0.77 -0.80
Total negative slack (TNS) -8997.42 -12173.09 -5144.99 -1728.80 -1527.07
Number of violating paths 13920 14671 13978 5339 4781
Total area (kgates) 1046 638 654 600 658
Combinational area 822 461 480 434 482
Noncombinational area 224 177 174 166 176
Leaf cell count 438347 322274 387066 353575 388603
Number of nets 438261 322328 386980 353489 388517
Nets with violations 45 0 0 0 0
Total CPU time (hours) 38.67 20.39 57.62 34.30 41.03
Number of jobs 958 1 89 89 89
Max memory usage (Mbytes) 1142 >3877 1365 3294 1117 1885
Max swap usage (Mbytes) 1166 1386 3675 1357 2049
SNUG San Jose 2001 22 A Comparison of Hierarchical Compile Strategies
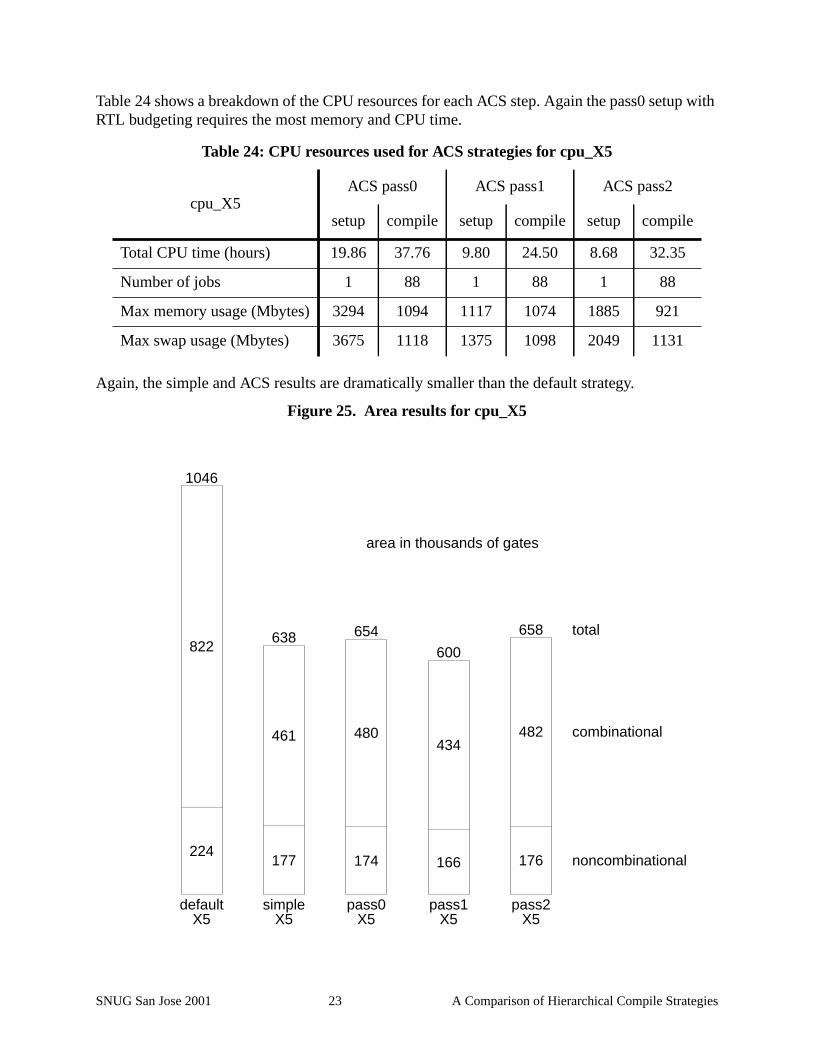
Table 24 shows a breakdown of the CPU resources for each ACS step. Again the pass0 setup withRTL budgeting requires the most memory and CPU time.
Again, the simple and ACS results are dramatically smaller than the default strategy.
Figure 25. Area results for cpu_X5
Table 24: CPU resources used for ACS strategies for cpu_X5
cpu_X5ACS pass0 ACS pass1 ACS pass2
setup compile setup compile setup compile
Total CPU time (hours) 19.86 37.76 9.80 24.50 8.68 32.35
Number of jobs 1 88 1 88 1 88
Max memory usage (Mbytes) 3294 1094 1117 1074 1885 921
Max swap usage (Mbytes) 3675 1118 1375 1098 2049 1131
area in thousands of gates
defaultX5
simpleX5
pass0X5
pass1X5
pass2X5
224
822
1046
177
461
638
174
480
654
166
434
600
176
482
658
noncombinational
combinational
total
SNUG San Jose 2001 23 A Comparison of Hierarchical Compile Strategies

However the default TNS is better than simple. The ACS strategies are the fastest in both WNSand TNS.
Figure 26. Slack ratio percentage plot for cpu_X5
Figure 27. Slack ratio percentage plot for cpu_X5
0%
10%
20%
30%
40%
50%
60%
70%
80%
90%
100%
-0.6 -0.4 -0.2 0 0.2 0.4 0.6 0.8 1
path
s be
low
the
give
n sl
ack
ratio
slack ratio
simple X5default X5pass0 X5
0%
10%
20%
30%
40%
50%
60%
70%
80%
90%
100%
-0.6 -0.4 -0.2 0 0.2 0.4 0.6 0.8 1
path
s be
low
the
give
n sl
ack
ratio
slack ratio
pass0 X5pass1 X5pass2 X5
SNUG San Jose 2001 24 A Comparison of Hierarchical Compile Strategies

8.0 Results from larger design: cpu_X10
Finally Table 28 gives results for a synthetic design comprising ten picoJava-II cores. This designhas well over one million gates. The hierarchical strategy was not attempted, since there wasinsufficient capacity even for the cpu_X5 design. ACS pass0 could not be completed; it exceededDesign Compiler’s available memory during the initial RTL budgeting step.
Table 28: Summary of results from different compile strategies for cpu_X10
cpu_X10 default simpleACSpass0
Levels of logic 50 50
Critical path length 7.00 6.90
Critical path slack (WNS) -2.21 -2.10
Total negative slack (TNS) -17993.23 -30403.93
Number of violating paths 27805 30923
Total area (kgates) 2092 1276
Combinational area 1644 918
Noncombinational area 448 358
Leaf cell count 876767 642663
Number of nets 876541 642717
Nets with violations 90 0
Total CPU time (hours) 77.29 60.97
Number of jobs 1913 1
Max memory usage (Mbytes) 1760 2747 >3877
Max swap usage (Mbytes) 1783 2775
SNUG San Jose 2001 25 A Comparison of Hierarchical Compile Strategies

The default strategy design has considerably more area, over 2 million gates compared to lessthan 1.3 million from the simple strategy.
Figure 29. Area results for cpu_X10
area in thousands of gates
defaultX10
simpleX10
448
1644
2092
358
918
1276
noncombinational
combinational
total
SNUG San Jose 2001 26 A Comparison of Hierarchical Compile Strategies

However the much larger TNS for the simple strategy is clear from Figure 30.
Figure 30. Slack ratio percentage plot for cpu_X10
0%
10%
20%
30%
40%
50%
60%
70%
80%
90%
100%
-0.6 -0.4 -0.2 0 0.2 0.4 0.6 0.8 1
path
s be
low
the
give
n sl
ack
ratio
slack ratio
simple X10default X10
SNUG San Jose 2001 27 A Comparison of Hierarchical Compile Strategies

9.0 Observations and comments on each compile strategy
9.1 Baseline
In essence the baseline strategy is a bottom-up compile with custom scripts and hand-budgetedconstraints for each design. As designs get larger this strategy becomes unwieldy. Hand-madebudgets are extremely difficult to accurately build and maintain, with the result that many non-critical paths are overconstrained while the true critical path is non-optimal.
Although using a Makefile allows quick recompiles on minor RTL changes, it is difficult tomanually keep the dependencies correct as the design hierarchy is modified. This leads touncertainty about whether the netlist corresponds to the correct sources.
9.2 Default
In addition to contrasting different strategies for a given size design, slack ratio percentage plotsare useful for comparing the results for a single strategy on different size designs. This worksbecause although the larger designs have many more paths, the percentages should stay the same.Figure 31 shows that the default strategy scales nicely as the design size increases.
Figure 31. Slack ratio percentage plots for different size designs using default strategy
0%
10%
20%
30%
40%
50%
60%
70%
80%
90%
100%
-0.6 -0.4 -0.2 0 0.2 0.4 0.6 0.8 1
path
s be
low
the
give
n sl
ack
ratio
slack ratio
defaultX2X5
X10
SNUG San Jose 2001 28 A Comparison of Hierarchical Compile Strategies

The CPU resources scale almost linearly. This is not surprising considering that the X2 designcontains two copies of each module from the X1 design, thus roughly twice as many compile jobsare needed. The memory requirements are determined by the final top-level compile step. Forexample, only one of the X10 jobs uses more than 273Mbytes of memory.
Table 32: CPU resources used by default strategy for different size designs
default strategy X1 X2 X5 X10
Total CPU time (hours) 8.07 15.80 38.67 77.29
Number of jobs 192 385 958 1913
Max memory usage (Mbytes) 273 487 1142 1760
Max swap usage (Mbytes) 294 513 1166 1783
SNUG San Jose 2001 29 A Comparison of Hierarchical Compile Strategies

Figure 33 shows the area results for all default strategy compiles. The location on the axiscorresponds to the size of the synthetic design (i.e. the number of cpu subdesigns). Notice how thearea scales almost linearly with the size.
Figure 33. Area for different size designs using default strategy
The default strategy (like all bottom-up strategies) scales very well. However it is difficult to findone set of constraints that works well for all modules in the design, especially if the design hasmultiple clocks or other complex issues. As with the custom baseline strategy, the result is thatmany non-critical paths are overconstrained while the true critical path is non-optimal. Areausually suffers.
One technique is to start with the same default script and constraint for each module, and thenmodify each by hand to “tweak” the budgets. This allows for some improvement, but often anenormous amount of manual effort is expended with little gain in quality of results.
Another possibility is to take the results of default and use that netlist as the input for automaticbudgeting (e.g. using ACS). This might avoid the capacity limitations of RTL budgeting in ACS.
x
area in thousands of gates
default defaultX2
defaultX5
defaultX10
45
164
209
90
329
418
224
822
1046
448
1644
2092
noncombinational
combinational
total
SNUG San Jose 2001 30 A Comparison of Hierarchical Compile Strategies

9.3 Hierarchical
In contrast to the default strategy, timing results for the hierarchical strategy are affected by designsize. TNS and WNS degrade as the design size is increased.
Figure 34. Slack ratio percentage plots for different size designs using hierarchical strategy
The required CPU resources appear to scale linearly as well.
The hierarchical strategy can handle a reasonably sized design, however the CPU resources areconsiderable.
Table 35: CPU resources used by hierarchical strategy for different size designs
hierarchical strategy X1 X2 X5
Total CPU time (hours) 8.54 16.65
Number of jobs 1 1
Max memory usage (Mbytes) 1087 1981 >3877
Max swap usage (Mbytes) 1108 2002
0%
10%
20%
30%
40%
50%
60%
70%
80%
90%
100%
-0.6 -0.4 -0.2 0 0.2 0.4 0.6 0.8 1
path
s be
low
the
give
n sl
ack
ratio
slack ratio
hierarchicalX2
SNUG San Jose 2001 31 A Comparison of Hierarchical Compile Strategies

9.4 Simple
Like the hierarchical strategy, the simple strategy shows timing degradation as the design sizeincreases.
Figure 36. Slack ratio percentage plots for different size designs using simple strategy
0%
10%
20%
30%
40%
50%
60%
70%
80%
90%
100%
-0.6 -0.4 -0.2 0 0.2 0.4 0.6 0.8 1
path
s be
low
the
give
n sl
ack
ratio
slack ratio
simpleX2X5
X10
SNUG San Jose 2001 32 A Comparison of Hierarchical Compile Strategies

The simple strategy also scales linearly with area.
Figure 37. Area for different size designs using simple strategy
Although the memory requirements are moderate, the CPU time required is increasingdramatically.
Table 38: CPU resources used by simple strategy for different size designs
simple strategy X1 X2 X5 X10
Total CPU time (hours) 3.17 5.43 20.39 60.97
Number of jobs 1 1 1 1
Max memory usage (Mbytes) 374 583 1365 2747
Max swap usage (Mbytes) 395 602 1386 2775
area in thousands of gates
simple simpleX2
simpleX5
simpleX10
3694
130
71
186
257
177
461
638
358
918
1276
noncombinational
combinational
total
SNUG San Jose 2001 33 A Comparison of Hierarchical Compile Strategies

Recall that the simple strategy finishes up with a top-level uniquify and incremental compile. Themajority of the overall CPU time is used during the area recovery phase of this final incrementalcompile. For example, during the X10 compile almost two-thirds of the time (39 hours) is spentdoing area recovery! During this area recovery step, the WNS reduces from 2.33 to just 2.10,while an amazing 521k gates are removed.
By running simple compile with -area_effort none the compile time would be speeded updramatically with minimal impact on timing. This might be useful for a “quick and dirty” firstcompile just to see what the timing is like.
Simple compile is a useful strategy for initial compilation of any design. More sophisticatedtechniques will certainly give you better results, but the simple compile gives you a good “firstlook” at your netlist. The CPU resources are much less than the hierarchical strategy.
Beginning with the Design Compiler 2000.11 release, simple compile mode uses RTL budgetingto generate more accurate initial constraints for submodules.
SNUG San Jose 2001 34 A Comparison of Hierarchical Compile Strategies

9.5 ACS
The ACS strategies scale very nicely as the design size is increased.
Figure 39. Slack ratio percentage plots for different size designs using ACS pass0 strategy
0%
10%
20%
30%
40%
50%
60%
70%
80%
90%
100%
-0.6 -0.4 -0.2 0 0.2 0.4 0.6 0.8 1
path
s be
low
the
give
n sl
ack
ratio
slack ratio
pass0X2X5
SNUG San Jose 2001 35 A Comparison of Hierarchical Compile Strategies

Figure 40. Slack ratio percentage plots for different size designs using ACS pass1 strategy
Figure 41. Slack ratio percentage plots for different size designs using ACS pass2 strategy
0%
10%
20%
30%
40%
50%
60%
70%
80%
90%
100%
-0.6 -0.4 -0.2 0 0.2 0.4 0.6 0.8 1
path
s be
low
the
give
n sl
ack
ratio
slack ratio
pass1X2X5
0%
10%
20%
30%
40%
50%
60%
70%
80%
90%
100%
-0.6 -0.4 -0.2 0 0.2 0.4 0.6 0.8 1
path
s be
low
the
give
n sl
ack
ratio
slack ratio
pass2X2X5
SNUG San Jose 2001 36 A Comparison of Hierarchical Compile Strategies
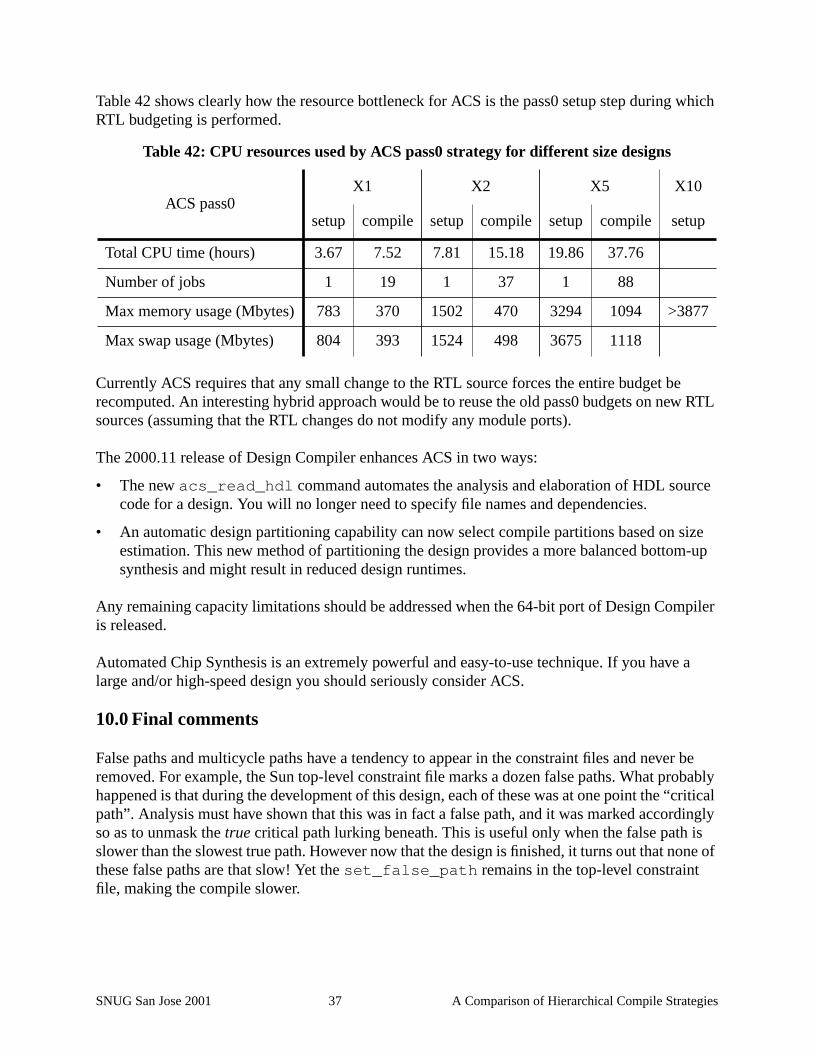
Table 42 shows clearly how the resource bottleneck for ACS is the pass0 setup step during whichRTL budgeting is performed.
Currently ACS requires that any small change to the RTL source forces the entire budget berecomputed. An interesting hybrid approach would be to reuse the old pass0 budgets on new RTLsources (assuming that the RTL changes do not modify any module ports).
The 2000.11 release of Design Compiler enhances ACS in two ways:
• The new acs_read_hdl command automates the analysis and elaboration of HDL sourcecode for a design. You will no longer need to specify file names and dependencies.
• An automatic design partitioning capability can now select compile partitions based on sizeestimation. This new method of partitioning the design provides a more balanced bottom-upsynthesis and might result in reduced design runtimes.
Any remaining capacity limitations should be addressed when the 64-bit port of Design Compileris released.
Automated Chip Synthesis is an extremely powerful and easy-to-use technique. If you have alarge and/or high-speed design you should seriously consider ACS.
10.0 Final comments
False paths and multicycle paths have a tendency to appear in the constraint files and never beremoved. For example, the Sun top-level constraint file marks a dozen false paths. What probablyhappened is that during the development of this design, each of these was at one point the “criticalpath”. Analysis must have shown that this was in fact a false path, and it was marked accordinglyso as to unmask the true critical path lurking beneath. This is useful only when the false path isslower than the slowest true path. However now that the design is finished, it turns out that none ofthese false paths are that slow! Yet the set_false_path remains in the top-level constraintfile, making the compile slower.
Table 42: CPU resources used by ACS pass0 strategy for different size designs
ACS pass0X1 X2 X5 X10
setup compile setup compile setup compile setup
Total CPU time (hours) 3.67 7.52 7.81 15.18 19.86 37.76
Number of jobs 1 19 1 37 1 88
Max memory usage (Mbytes) 783 370 1502 470 3294 1094 >3877
Max swap usage (Mbytes) 804 393 1524 498 3675 1118
SNUG San Jose 2001 37 A Comparison of Hierarchical Compile Strategies

Traditional bottom-up strategies have read in the source files using read -format verilog(or read_verilog in Tcl). This is a problem when parameterized designs are used. A top-levelelaborate avoids this problem, however now you have a problem keeping the source filedependencies correct. Also a top-level elaborate can require considerable memory. The newPRESTO HDL reader may provide some help here.
This paper reports on one design with one library and one version of Design Compiler. Similarresults were seen with other synthesis libraries and earlier versions of DC, however don’t expectto get exactly these results with your design! And don’t expect to see the same resourcelimitations either! As always, your mileage may vary.
It will be interesting to run these experimental compiles on new versions of Design Compiler,especially the forthcoming version with 64-bit addressing.
11.0 Acknowledgements
Thanks to Leah Clark of Cypress Semiconductor and Mark Sprague of Axiowave Networks fortheir careful review and comments. Many thanks to Joanne Wegener for helping with synthesislibraries and her endless supply of patience. Thanks to Sun Microsystems for putting your designout in public, warts and all.
All source files, scripts, constraint files, and Makefiles are available at http://www.trilobyte.com
12.0 References
[1] “Evolvable Makefiles and Scripts for Synthesis”, Anna Ekstrandh and Wayne Bell, SNUGSan Jose 1997.
[2] “Push-button Synthesis or, Using dc_perl to do_the_right_thing”, Kurt Baty andSteve Golson, SNUG San Jose 1998.
[3] “Resistance is Futile! Building Better Wireload Models”, Steve Golson, SNUG San Jose1999.
SNUG San Jose 2001 38 A Comparison of Hierarchical Compile Strategies