a comparison of individual versus group decision …
TRANSCRIPT

A COMPARISON OF INDIVIDUAL VERSUS GROUP DECISION
MAKING UNDER UNCERTAINTY UTILIZING A
SIMULATED MANAGEMENT GAME
by
WILLIAM FREDERICK MUHS, B.S., M.B.A.
A DISSERTATION
IN
BUSINESS ADMINISTRATION
Submitted to the Graduate Faculty of Texas Tech University in Partial Fulfillment of the Requirements for
the Degree of
DOCTOR OF BUSINESS ADMINISTRATION
Approved
. ','
August, 1976

«4^Ab.j^--«»«3C}>^
í^ i
/ n ^ ACKNOWLEDGMENTS
1 With gratitude, appreciation is expressed to a num-
ber of individuals. Special recognition should be given
to Chairman Louis D. Ponthieu, and Professors Oswald D.
Bowlin and Robert T. Justis for their valuable contribu-
tions and academic leadership. Appreciation is also ex-
pressed to faculty in the management area of the College
of Business Administration, Texas Tech University, for
their valuable insight.
I am grateful to Professor Richard F. Barton for his
invaluable contributions in formulating part of the study
and for writing a special version of the IMAGINIT MANAGE-
MENT GAME computer program specifically for this study.
Special thanks are also given to Ben Ayres for de-
veloping the individual simulation model and who, together
with Jim Ward, overcame numerous difficulties in success-
fully implementing the model. Gratitude is also expressed
to Phyllis Kinnison who typed the final copy.
Finally, I want to thank my wife, Joan, and my three
daughters for their patience, understanding, sacrifices,
and most importantly their love.
11

É lÉ 1» — U l l I
TABLE OF CONTENTS
ACKNOWLEDGMENTS ii
LIST OF TABLES VÍ
Chapter
I. INTRODUCTION 1
Background of the Study . 1
Justification of the Study 3
Purpose of the Study 5
Delimitations of the Study 6
Organizational Plan of the Study 7
II. REVIEW OF RELATED LITERATURE 8
The Risky Shift 10
Replications and Verifications . . . . 12
Explanations 13
Familiarization Theory 14
Diffusion of Responsibility . . . . 14
Leadership Theory 15
Propensity to Take Risk 16
Value Theories 18
Decision Theory 22
Non-CDQ Context Research 23
A Critique of the Literature 27
Risk Constructs 32
Simulated Environments 35
Summary 39 • • •
111
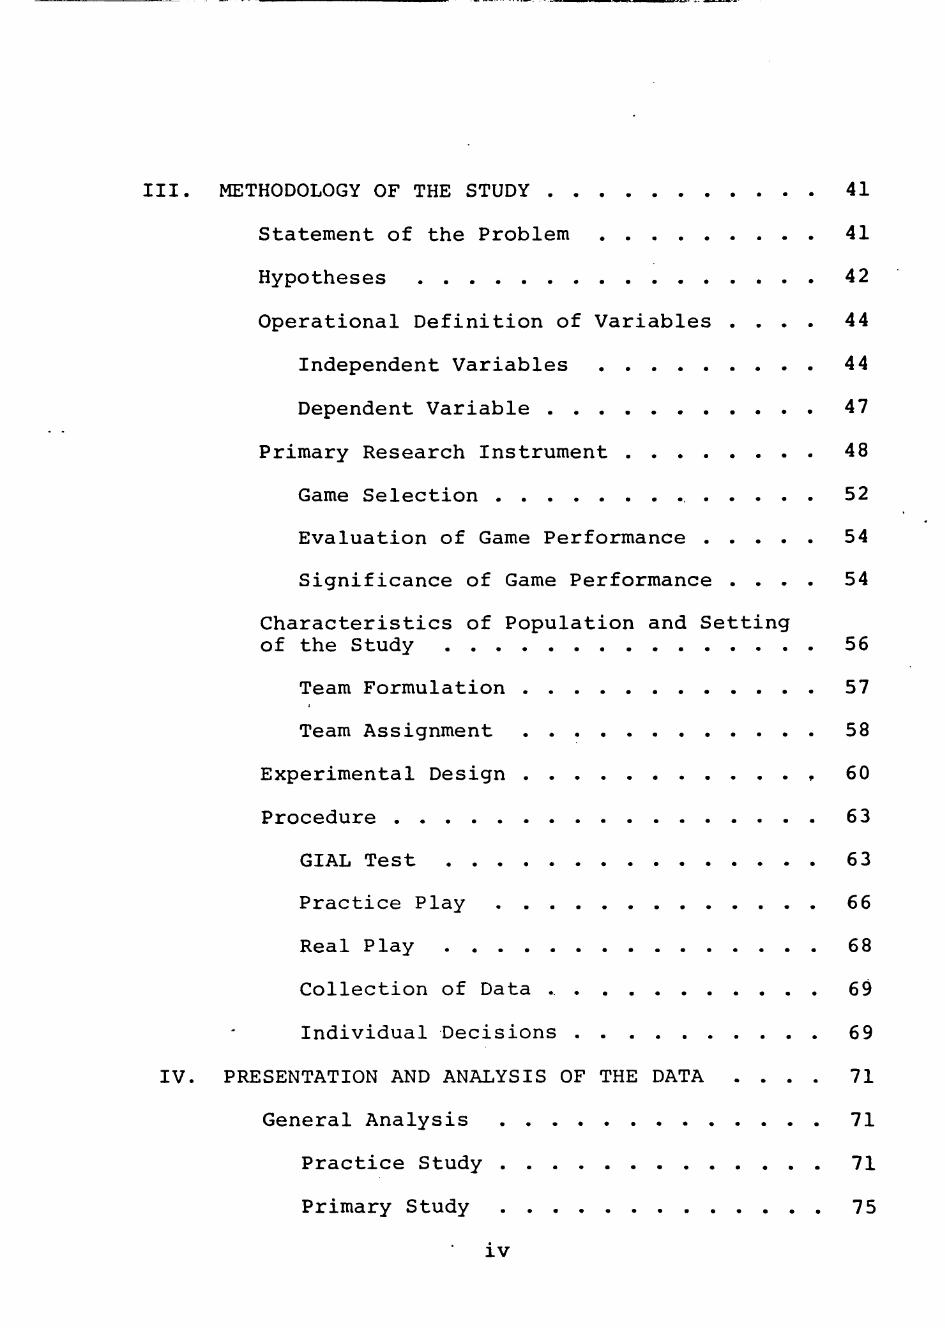
III. METHODOLOGY OF THE STUDY 41
Statement of the Problem 41
Hypotheses 42
Operational Definition of Variables . . . . 44
Independent Variables 44
Dependent Variable 47
Primary Research Instrument 48
Game Selection 52
Evaluation of Game Performance 54
Significance of Game Performance . . . . 54
Characteristics of Population and Setting
of the Study 56
Team Formulation 57
Team Assignment 58
Experimental Design , 60
Procedure 63
GIAL Test 63
Practice Play 66
Real Play 68
Collection of Data 69
Individual Decisions 69
IV. PRESENTATION AND ANALYSIS OF THE DATA . . . . 71
General Analysis 71
Practice Study 71
Primary Study 75 iv

Statistical Analysis of the Data 81
Practice Study 81
Primary study 84
Group Decisions 84
Individual Decisions 86
Comparison of Groups and Individual
Decisions 90
Correlation Analysis 95
Team Performance and GIAL 98
V. SUMMARY, CONCLUSIONS, AND RECOMMENDATIONS . . 101
Summary of the Study 101
Conclusions of the Study '. 103 Interpretation of the Findihgs . . . . . . 105
Implications 107
Limitations of the Current Study 108
Recommendations 109
LIST OF REFERENCES 111
APPENDIX 119

LIST OF TABLES
1. Differences Between High and Low GIAL Scores . . 64
2. Summary Data on GIAL Scores and Analysis of Variance 65
3. Cell Means and Standard Deviations for Group Decisions on Fringe Benefits in Practice Play . 73
4. Probability of Labor Strike for Each Team's Yearly Decisions in Practice Play 74
5. Cell Means and Standard Deviations of Indi-vidual Fringe Benefit Decisions in Practice Play 76
6. Cell Means and Standard Deviations of Group Fringe Benefit Decisions in Primary Study . . . 78
7. Cell Means and Standard Deviations of Indi-vidual Fringe Benefit Decisions in Primary Play 80
8. 4 x 3 x 2 Analysis of Variance for Group Decisions in Practice Study 82
9. 4 x 3 x 2 Analysis of Variance for Individual Decisions in Practice Study 83
10. 5 x 3 x 2 Analysis of Variance for Group Decisions in Primary Study 85
11. 5 x 3 x 2 Analysis of Variance for Individual Decisions in Primary Study 87
12. Difference Between Fringe Benefit Decisions of High and Low GIAL Individuals by Year 89
13. Wilcoxon Signed Ranks Test Between Group and Individual Mean Fringe Benefit Decisions . . . . 91
14. Wilcoxon Signed Ranks Test Between Group and Individual Fringe Benefit Decisions in Primary Study by Year 92
VI

-~3S
15. Wilcoxon Signed Ranks Test Between Group and Individual Fringe Benefit Decisions in Primary Study by GIAL 93
16. Wilcoxon Signed Ranks Test Between Group and Individual Fringe Benefit Decisions in Primary Study by Section 94
17. Simple and Partial Correlation Coefficients Between the Dependent and Independent Variables 96
18. Summary Table of Multiple Regression of Group Fringe Benefits and Independent Variables . . . 97
19. Summary Table of Multiple Regression of Indi-vidual Fringe Benefits and Independent Variables 98
20. Mean Performance of Groups Classified by GIAL . 99
21. Analysis of Variance: High and Low GIAL Team Performance 100
vii

CHAPTER I
INTRODUCTION
Background of the Study
The field of management has been increasingly concerned
with the subject of group behavior and group dynamics. This
has been due in part to the recognition that groups are an
important variable in organizational behavior and also be-
cause of the more widespread use of group decision making.
The use of groups or committees in decision making has be-
come commonplace. Tillman's (cited in Duncan, 1975) survey
found that 94 percent of the firms with more than 10,000
employees and 6 4 percent of the firms with less than 250
employees utilized formal committees in their decision mak-
ing. In addition, managerial decisions typically involve,
directly or indirectly, group processes. While a manager
may be solely responsible for a decision, he is quite
likely to seek inputs or advice from other individuals.
The behavior of groups has been studied along numerous
dimensions by specialists from many disciplines. One area
that has received considerable attention in recent years
concerns the degree of risk taking in group decision making,
especially as contrasted with individual decision making.
The major thrust of empirical research has centered upon
Stoner's (1961) conclusion that groups make more risky
decisions than do individual group members. Resulting repli-
cations of Stoner's research strongly supported his results
which became widely known as the risky shift. The risky
shift is defined as the tendency for individuals to "advo-
cate greater degrees of risk taking following participation
in a group than they had previously advocated in private"
(Clark, 1971, p. 251).
So strong did the research appear to support the exist-
ence of the risky shift, that by approximately 1965 attention
turned toward finding explanations for the phenomemon which
was becoming widely accepted as an empirical fact by many
social psychologists. There is no shortage of explanations
but they have been generally inconclusive. Although explan-
atory research of the risky shift has continued to date,
research of the last five years has also closely examined
the research methodology typically employed in obtaining
support for the risky shift phenomemon. The collective re-
sults of this research has cast very grave doubts on the
existence of the risky shift and quite possibly its rejec-
tion as a theoretical construct.
Cartwright (1973) describes the present development of
investigation as passing through a crisis state with a con-
comitant theoretical disorientation overtaking the field:
Although it is too soon to know what the long-term reactions to the demise of the risky-shift paradigm will be, two types of responses are already apparent. Some investigators have

withdrawn from the field in the belief that further work would be useless, while others have begun a vigorous search for alternative formulations of the basic problem. The ulti-mate significance of the research in this line of investigation will depend to a con-siderable degree on which of these responses become dominant. . . . There is also the possibility, however, that the search for a new conceptualization will be successful and that the better established findings will be-come an enduring part of a more comprehensive paradigm of the future. (p. 230)
Justification of the Study
A review of the literature in Chapter II has shown that
a generalizable risky shift does not exist based upon the
research conducted thus far. It is also not known what con-
tingencies may influence the occurrence or non-occurrence of
a risky shift (Cartwright, 1973). One of the major weak-
nesses of prior research is the scarcity of empirical sup-
port for the risky shift, or other relationships (i.e.,
cautious shifts), between individual and group risk taking.
Clearly, the first step must be one of determining if such
relationships do in fact exist and whether they are signif-
icant. Verification of such relationships must be made prior
to seeking explanations and prescribing managerial behavior.
Authors of contemporary management textbooks have often
accepted the validity of the risky shift or imply such a
tendency despite the lack of a definitive answer. Kast and
Rosenzweig (1974) state:

There is some evidence that groups in simi-lar situations are more risky. In part, this can be explained by the concept of spreading risk. If one individual is solely responsible for a risky venture, he may balk. If a group is in-volved in making the decision, responsibility is effectively diffused and no one individual feels that he is "under the gun." Therefore groups may, in fact, engage in more risky decision-making behavior than individuals. (p. 425)
Hampton, Summer, and Weber (1973) and also Webber (1975),
while briefly describing the risky shift, state: "Surpris-
ing, but still controversial, is the finding that groups
may be more willing to take risks than individuals" (p. 290).
Miner (1973) admits that the state of knowledge regarding
the risky shift is not complete but concludes:
The most that can be said at this point is there is a distinct possibility in any given in-stance of group decision making, that the outcome will have a higher degree of risk attached to it than many of the participants would have been willing to take on their own. (p. 193-4)
Gibson, Ivancevich, and Donnelly (1973), after briefly dis-
cussing some of the early work of Wallach, Kogan, and Bem
state:
It appears that individual decision-makers are more willing to accept risky decisions after participating in interacting groups than they had been initially. (p. 201)
Sisk (1973) briefly states that there is a tendency for
a group to select a decision representing a higher degree of
risk (p. 250). No evidence for this statement is given by
the author. Duncan (1975) points out that a criticism of

•."''l.'fl
committees is that they often assume undue risks since no
single individual is accountable (p. 191).
Research seeking relationships between group and indi-
vidual risk-taking has normative significance. For example,
should a committee decide whether to introduce a highly in-
novative but risky product into the marketplace? Will the
committee make a risky or a conservative decision? What
factors are likely to influence the riskiness. of their final
choice? The implications for management are quite evident
when one considers the fact that most managerial decisions
entail some degree of risk.
Purpose of the Study
The principal objective of this study is to test the
risky shift hypothesis in a complex, multi-variate environ-
ment more typical of managerial decision making. In addition
certain selected factors, which research has shown to be po-
tentially associated with group shifts in risk-taking, will
be examined.
Under experimental laboratory conditions, the study is
the first known attempt in this area to utilize a simulated
environment as the research instrument. The use of a simu-
lated environment will make it possible to incorporate an
identifiable risk construct—decision making under uncer-
tainty.

^^
The basic questions to be specifically investigated in
this study are:
(1) Do groups make more risky decisions than individ-
uals in a simulated environment?
(2) Do differences in the consequences of a decision
affect whether groups make more risky or conservative deci-
sions than individuals in a simulated environment?
(3) Do differences in propensity to take risk affect
whether groups make more risky or conservative decisions
than individuals in a simulated environment?
(4) Do prior experiences or outcomes affect whether
groups make more risky or conservative decisions than indi-
viduals in a simulated environment?
(5) Do differences in propensity to take risk affect
group performance in a simulated environment?
A secondary benefit of the study is the potential con-
tribution of the use of a complex simulation game in experi-
mental behavioral research.
Delimitations of the Study
A delimitation of this investigation is that the ex-
periment utilized senior business students at Texas Tech
University during the spring semester, 1976. Therefore, the
results of this study may not necessarily be inferred to other
populations in different environments or in the use of other

simulated business games. However, the basic procedures of
the study lend themselves to replication by other research-
ers.
The primary purpose of the study was to determine
whether groups made more risky decisions under different
conditions in a simulated environment. It was not con-
sidered to be within the purview of this study to test the
vast array of behavioral theories which might explain the
results obtained.
Organizational Plan of the Study
A selected review of related literature is presented in
Chapter II which includes the origin, development, and em-
pirical foundations of the risky shift together v/ith a cri-
tique on the state of the art. This is followed in Chapter
III by a statement of the problem, procedures, and research
methodology of the study. Chapter IV contains the data
analysis together with an interpretation and discussion of
the results obtained. A general summary including conclu-
sions is presented in Chapter V.

CHAPTER II
REVIEW OF RELATED LITERATURE
There are three logical possibilities of the relation-
ship between individual decisions and decisions made in a
group context (Kogan and Wallach, 1967). The group decision
may represent the average of prediscussion individual risk
taking, more conservative than, or more risky than this
average. It is this latter position which has received
considerable attention during the last decade.
Prior to this period, the belief was that group deci-
sions would be an average of individual decisions. An ex-
ample is Schachter's (1951) study which found that group
members tried to influence those individuals whose decisions
were most deviant from the group norm. Thus, a convergence
effect occurred.
The second possibility, that groups reach a more con-
servative decision, was also widely held by social psychol-
ogists. Kogan and Wallach (1967) cite numerous studies which
interpreted conservative group decisions a result of greáter
care and self-criticism. The authors also cite Whyte's
Organization Man, which expressed the view that groups will
make inferior decisions because of the conservative nature
of the group. However, research on these two positions was
seldom concerned with the question of risk (Clark, 1971).
8

The third possibility, first introduced in 1895 by Le
Bon (1960) in his book The Crowd, states that people in a
mob can engage in highly risky or dangerous forms of behav-
ior. Le Bon described the phenomena a result of feeling
anonymous and hence a diffusion of responsibility occurred
since each member of the crowd felt less responsible for his
individual actions. Kogan and Wallach (1967) discuss All-
port's explanation which he termed "impression of universal-
ity." Allport believed a member of the crowd feels that the
crowd's actions receives everyone's approval and therefore
seems the right thing to do. It is questionable whether
these two early explanations were relevant to the small
group making a decision involving risk (Kogan and Wallach,
1967).
This chapter is organized around three areas of con-
cern pertinent to this study. First, a review of the risky
shift literature is provided to establish the current state
of the art and to identify potentially important variables
for further research. The second area investigated is the
various risk constructs which can apply to research on risk
taking. Finally, the third area of review is concerned with
the primary research instrument, simulated environments,
utilized in the laboratory study of this investigation.
10
The Risky Shift
The first empirical report of increased risk-taking by
groups was made by Stoner (1961) in his master's thesis at
MIT. Stoner's results together with additional research by
several members of his thesis committee appeared the follow-
ing year (Wallach, Kogan, and Bem, 1962).
Cartwright (1971) succinctly comments:
Rarely in the history of social psychology has a single study stimulated as much research as the master's thesis by Stoner (1961) which reported the discovery of "the risky shift." Its conclusion that groups are riskier than individuals was widely in-terpreted as being contrary to the findings of pre-vious research on the effects of groups on individ-uals. It challenged conventional wisdom, and it appeared to have implications for those responsible for making important decisions involving risk. (p. 361)
Due to the significance of the study itself and the
line of investigation it stimulated, the methodology and re-
search instruments employed by these initial writers will be
examined in detail.
Stoner's (1961) study was designed to test the valid-
ity of the widely held position that groups made more con-
servative decisions. He utilized the Choice Dilemma
Questionnaire (CDQ), developed by Wallach and Kogan (1959;
1961).
The instrument contains twelve lifelike situations
each containing a basic dilemma for a central person. The
person is faced with two alternative courses of action, one

n
11
of which is more desirable but also entailing a greater risk
of failure. Following are items one and two (Kogan and
Wallach, 1967) as examples:
1. Mr. A, an electrical engineer, has the choice of staying with his present job at a modest, though adequate, salary or of moving on to another job offering more money but no long-term security.
2. Mr. B, who has developed a severe heart ail-ment, has the choice of changing many of his strongest life habits or of undergoing.a delicate medical operation which might suc-ceed or might prove fatal.
While the pattern is quite similar for all items, the re-
sponse categories and instructions for item two follow as
an illustrative example (Kogan and Wallach, 1967) .
Imagine that you are advising Mr. B. Listed be-low are several probabilities or odds that the operation will prove successful. Please check the largest probability that you would consider acceptable for the operation to be performed.
Place a check here if you think Mr. B should not have the operation, no matter what the probabilities. Scored as 10 in 10.
The chances are 9 in 10 that the operation will be a success.
The chances are 7 in 10 that the operation will be a success.
The chances are 5 in 10 that the operation will be a success.
The chances are 3 in 10 that the operation will be a success.
The chances are 1 in 10 that the operation will be a success.
12
The methods used by Stoner and others to follow, was a
basic repeated measures design. Subjects were asked to com-
plete the CDQ individually and then the subjects were formu-
lated into ad hoc groups. The groups were asked to discuss
and arrive at a unanimous decision for each of the twelve
items. A comparison of mean individual scores with the
group scores typically showed that the group scores are
lower (willingness to accept a lower probability) than in-
dividual responses—hence the risky shift. The average
shift per item, expressed as odds, is roughly from 6 in 10
to 5 in 10 (Cartwright, 1971).
Replications and Verifications
Stoner's results and those of Kogan, Wallach, and Bem
(1962), Marquis (1962), were replicated by numerous studies
that controlled for additional variables such as age, occu-
pation, sex, and nationality. Extensive reviews of these
attempts have been made (Kogan and Wallach, 19 64, 1967;
Cartwright, 1971; Pruitt, 1971; Brown, 1965; Clark, 1971).
As research continued, additional results of interest
were obtained. Upon retesting the CDQ after group discus-
sion, individuals do not appear to recidivate to lower risk-
taking. The effect of the discussion (treatment) lasts up
to six weeks (Wallach, Kogan, and Bem, 1962) . A lack of
recidivism may occur even without individual pretests

13
(Blascovich, 1972). Recently, Baron, Baron and Roper (1974)
found recidivism casting doubt that a semi-permanent cogni-
tive change in beliefs, attitudes, or dispositions occurred.
A shift towards risk appears to be dependent upon group
discussion even under different conditions and modes. It
occurs when subjects merely watch, listen, or read a group
discussion. A risky shift occurs when subjects do not re-
veal their initial choice (St. Jean, 1970) but less strong
shifts are found when choices of others are given but with-
out discussion (Bell and Jamieson, 1970; Teger and Pruitt,
1967).
As research continued, it became apparent that several
of the CDQ items showed a significant shift to caution.
Stoner (1968) and Nordhoy (1962) both created choice dilem-
mas which yielded cautious shifts.
Explanations
The vast majority of researchers in the last eight to
ten years have attempted to seek explanations for the risky
shift phenomena rather than to rigorously test its existence,
A brief discussion of the major explanations will be made
for the purpose of not only tracing the line of thought in
this field but also to provide identification of potentially
important variables.

14
Familiarization theory. One of the first explanations
was familiarization theory proposed by Bateson (1966). Sim-
ply stated, group discussion provided a more indepth analysis
and a greater study of the issues involved. This leads to a
greater reduction of uncertainty and thus a greater willing-
ness to take risks. Clark (1971) describes the familiariza-
tion hypothesis as follows:
According to this hypothesis, any procedure that will increase familiarity with an issue in-volving risk will cause persons to become more risky on that issue. Informal observation and anecdotal evidence provide some support for this hypothesis. For many animals in unfamiliar situ-ations or humans in strange circumstances (e.g., boys at a strange swimming hole) initial periods' of caution, exploration, and "feeling out" are usually foilowed by behaviors that' are much more bold and daring. (p. 252)
In general, studies have failed to confirm this explanation
(Pruitt, 1971). One of its major deficiencies is that it
cannot account for group shifts to caution.
Diffusion of responsibility. A diffusion of responsi-
bility theory was first proposed by Wallach, et. al. (1962),
although it was mentioned earlier as an explanation for mob
behavior. Basically, group discussion should reduce the
anxiety of making a riskier decision since the individual
receives support from and/or shares in the responsibility of
the decision. Kogan and Wallach (1967) state that the de-
velopment of affective support leads to the development of
emotional bonds placing the group members into equivalent

15
relationships. After an excellent review of research on
this explanation, Clark (1971) concludes:
Notwithstanding the apparent intuitive appeal of the diffusion-of-responsibility hypothesis and its usefulness in accounting for research on by-stander intervention, it shows serious shortcomings when applied to the risky shift because: (a) con-trary to the hypothesis, discussion is not neces-sary for the risky shift to occur; (b) the hypothe-sis cannot account for cautious shifts; (c) the hypothesis cannot account for the finding that initially risky items are those for which the greatest shift occurs; (d) the hypothesis is in~ consistent with the finding that the most shift occurs with those items that are perceived to have the least serious consequences; (e) the hypothesis does not specify how the creation of emotional bonds among subjects makes them less concerned about the negative consequences of risky deci-sions; (f) finally, most damaging of all, it ap-pears to be the exchange of relevant information, not the development of emotional bonds, that is necessary for the risky shift to occur. In short, it seems rather clear that some other factor in the communication among group members is respon-sible for producing the shift toward risk. (p. 414)
Leadership theory. Another explanation is leadership
theory which has several different variants. The first view
is that high risk takers are also more influential and domi-
nant in group discussion (Marquis, 1962; Collins and Guetz-
kow, 1964). Brown (1965) reported the same effect for CDQ
items which typically show a shift to caution—i.e., cautious
individuals are perceived as more influential. Very little
support can be found for this view since there is the dis-
tinct possibility that subjects rate the high risk takers as
more influential because they have shifted toward him and not
that he was more influential (Kogan and Wallach, 1967) .
1 1
16
The second leadership view is described as a leader-
confidence process which states that the risky shift occurs
due to the greater confidence and assertiveness of high risk
takers (Burnstein, 1969) . Other studies show a smaller
risky shift when only information about choices is given
(Teger and Pruitt, 1967) or just listening to a discussion
(Lamm, 1967). Thus, leadership theory may account for a
small part of the shift, perhaps that amountabove mere in-
formation exchange (Pruitt, 1971). Finally, Vidmar (1970)
formed homogeneous groups on the basis of their initial
choices on the CDQ questionnaire. His findings did not sup-
port a leadership theory since groups composed of low risk
takers (thus lacking purported influential or confident
members) showed a significant risky shift.
Propensity to take risk. Discussion of leadership
theory raises many questions concerning personality vari-
ables and individual traits. Although often rejected by
behavioral scientists, cognitive attributes may be a part
of the process, together with situational variables such
as style and structure. Indeed, leadership style depends
on an individual's personality (Fiedler, 1969).
The major question is whether individuals vary in their
propensity to take risk. Are given individuals consistently
inclined towards risk or conservatism across situations or is
risk propensity situationally and task dependent? Rim (1966)
17
states that risky subjects can be identified by various per-
sonality traits such as extraversion, need for achievement,
Machiavellianism, and tolerance of ambiguity. Slovic (1972a)
found little evidence of risk taking propensity as a gener-
alized characteristic of individuals. Slovic (1972b) stated:
The results of close to a dozen such studies indicate little correlation, from one setting to another, in a person's preferred level of risk taking. Only those tasks highly similar in structure and involving the same sorts of pay-offs (e.g., all financial, all social, etc.) have shown any generality and, as similarity decreases, these cross task consistencies rap-idly decline. Thus an individual who takes risks by guessing often on a mathematics exam (when guessing is penalized) is likely to be a high-risk taker in other exams as well, but that" does not imply that he would prefer a high-risk occupation. In sum, the majority bf evidence argues against the existence of risk-taking pro-pensity as a generalized characteristic of indi-viduals. A person's previous learning experiences in specific risk-taking settings seem much more important than his general personality character-istics. (p. 795)
Kogan and Wallach (1967) state that a generalized dis-
position to take risk was applicable to some individuals,
especially those high in motivational disturbance. If this
is the case, then group composition in terms of propensity
to take risk may influence the group decision.
Criticism can be made of this research on the grounds
of not only internal validity but also whether such studies
were representative of the multi-dimensional, complex, and
subjective environments in which managerial decisions are

18
made. Hunsaker (1971, 1973) found significant relationships
between risk taking and incongruity adaptation capability
using the self-descriptive General Incongruity Adaption
Level (GIAL) test developed by Driver and Streufert (1967).
In terms of actually coping with incongruent situations, it is clear that high and low GIAL individuals respond quite differently. If all those concerned have very similar experiences immediately prior to encountering a risk taking situation, differences in GIAL appears to influ-ence risk preferences. If the immediate experi-ences have been dissimilar, however, the effects of these personality differences may not be too important. (p. 182)
Kennedy (1971) found a significant relationship between
cognitive complexity (maturity of human information proces-
sing capability) and financial performance in a simulated
business game. Therefore, there is a possibility that in a
given situation, personality variables may influence the
degree of risk taking by an individual and should be con-
trolled in future experimentation.
Value theories. The greatest amount of research seek-
ing explanations for the risky shift phenomena fall into a
very broad category described as value theory, which was
originated by Brown (1965), and is often labeled the risk-
as-value theory.
All value theories have the basic assumption that groups
shift in a direction toward which most members are already
attracted. The literature is extensive on the subject but
by no means can it be described as parsimonious. An
19
excellent account has been made by Pruitt (1971) who classi-
fied the research into five value theories which will be
briefly described.
The first theory is social-comparison theory which has
different versions, the most popular being that of Brown's
(Pruitt, 1971):
. . . it postulates that riskiness is a culturally prescribed value or ego ideal which causes the typical American to want to be at least as risky in this behavior as other people sirailar to him. This implies a social-comparison process in which the individual tries to figure out where other people stand on the decision problem he is fac-ing, and then chcoses,as his initial decision, a level of risk that is at or above what he assumes to be the group average. Later, actual social comparison takes place in the group discussion. The theory also explains cautious shifts in terms of a "value on caution," which impels people in some problems to be equally or more cautious than the group average. (p. 346)
The second value theory that Pruitt identifies is
pluralistic-ignorance theory, which is attributed to Levin-
ger and Schneider (1969). Their study found that prior to
group discussion most subjects viewed themselves as being
at least as risky as others on the CDQ dilemmas. This leads
to a conflict during the group discussion between an ideal
level of what the individual would like to do and what he
thinks others favor (group standard). Finally, a compromise
is reached during discussion that is between the two posi-
tions accounting for the choice shift.

20
The third theory that Pruitt discusses is release theory
which he has offered. It is very similar to the pluralistic-
ignorance theory discussed above.
According to release theory, the risky shift occurs in group discussion because the discovery of a single group member (the model) who endorses high risk taking releases the more cautious group members from the assumed social constraints that are holding them back from risk taking. In other words, finding a high risk taker in their group gives them the "courage of their convictions." (Pruitt, 1971, p. 351)
The fourth theory that Pruitt discusses is the relevant-
arguments theory originated by Nordhoy (1962) and elaborated
by Brown (1965) who labeled it enhanced-salience-of-values.
Morgan and Aram (1975), who found support for this theory,
describe the process:
. . . since the value (risk or caution) in a situ-ation is culturally determined for most group mem-bers, most reasons and justifications brought out in the group discussion will favor this value. The preponderance of opinions and arguments favoring the widely held value influences group members f ur-ther in the direction of the value. Brown states, "No single member of a group is likely to possess all the information that objectively bears on the reason and so the discussipn will give each one some new reasons for moving toward the value." (p. 26)
With respect to the CDQ instrument and the typical meth-
odology employed, there seems little doubt that certain items
tend to elicit a frequency of arguments in one direction or
the other, but it is not known what causes the figher fre-
quency. Is it due to cultural value; reinforcement patterns;
simple conformity effects; or as Vinokur (1971) has suggested.
wm
n 1
a function of the alternatives examined in the CDQ procedure?
This latter suggestion is entirely plausible due to the dif-
ferences in each CDQ item. Recently, Vinokur (1971) and
Vinokur, et. al. (1975) have argued that the argumentation
hypothesis can be explained in terms of subjective expected
utility analysis (SEU). This approach is based on an indi-
vidual's subjective utility of an outcome and his subjective
estimate of the probability that the outcome will occur.
During group discussion, pervasive argumentation occurs
which causes individuals to revise their utilities and/or
the probability of outcomes.
The fifth theory Pruitt examined was commitment theory
which was proposed by Moscovici and Zavalloni (1969). The
process is described as one in which the group discussion
allows an individual to further commit himself toward the
direction of his initial decision.
Of the various value theories, the relevant-argument
hypothesis has received, and continues to receive the most
discussion. However, as pointed out previously, the risky
shift has been observed without discussion (when only infor-
mation about choices is exchanged). It has even been sug-
gested that in this case, the relevant arguments may be
imagined (Pruitt, 1971). Perhaps in an attempt to overcome
the inadequacy of any single explanation, Pruitt suggests a

22
a two-process theory: a relevant-argument aspect which ex-
plains that portion of the shift above information exchange.
Decision theory. As a discipline with its origin in
economics, decision theory has been proposed as a useful
tool of analysis in explaining the risky shift or choice
shifts. As mentioned above, Vinokur, et al., (1975) contend
that revisions in choices are entirely accounted for by
changes in subjective utilities which are influenced by
persuasive arguments which leads to an attitude change.
Commenting on Vinokur's earlier experiments, Pruitt (1971)
states:
While these two experiments demonstrate quite convincingly that utility changes accom-pany shifts in risk preferences, the fourth conclusion that utility changes cause shifts in risk preference seems unwarranted at this time. The data seem equally compatible with the alternative position that utility changes are caused by shifts in risk preference. (p. 508)
Utility theory may be quite useful as a descriptive tool
for pedogogical analysis, but it is seldom acclaimed as hav-
ing much predictive power when dealing with human beings and
social processes. Decision theorists are on strong grounds,
given an objective function or criterion, in prescribing
normative courses of action that are useful in decision mak-
ing. However, the deterministic capabilities of mathematical
models found in decision theory are often quite limited.
Individuals do not always behave rationally, i.e., choose

23
that alternative with the highest expected value. Nor are
individuals consistent in their selection of alternatives
with the same expected value (or SEU). In betting situa-
tions, such models are not much more precise than a random
generator (Kogan and Wallach, 1967). Individuals may "sat-
isfice" and not optimize, as Simon (1957) describes.
Finally, there is not much room in the models for incor-
porating skill and motivational factors.
The prior discussion does not purport decision theory
to be of little value in different contexts, but rather as
having little explanatory power for the risky shift research.
Non-CDQ Context Research
It is important to review that research which is less
hypothetical than was discussed in the prior section and to
examine research conducted in different contexts which are
relevant to the topic of this paper.
Kogan and Wallach (1967), in their review of research on
real versus imaginary incentives, found no conclusive evi-
dence about the degree of risk taking and actual versus
imaginary payoffs of individuals but state:
If forced to piece together a tentative con-clusion, the authors would have to say that real as opposed to imaginary payoff conditions seem to yield greater conservatism in decision making. This conservatism increases as the magnitude of the positive and negative incentives becomes larger. Further the rate of increase in conser-vatism as potential losses increase seems to

24
exceed the rate of increase in risk taking as potential gains increase. (p. 143)
Considerable work has been done examining risk taking
by individuals in gambling situations. Pruitt and Teger
(1969) found that groups selected bets with higher variances
than did individuals. Slovic (1967) found that this was not
the case, while Slovic and Lichtenstein (1968) suggested
that the subjects were making choices on the basis of po-
tential gains and losses and not upon variance per se.
Blascovich (1972b) has criticized their results stating that
it is doubtful the research represented realistic gambling
risks.
In a series of studies utilizing blackjack as the re-
search instrument, Blascovich (1972a) found groups to make
more risky bets. In a recent experiment, Blascovich, Gins-
berg, and Howe (1975) obtained this result when they utilized
32 trial judges using their own money in a realistic casino
setting in Nevada. They summarize:
The blackjack investigations have clearly demonstrated both an individual increase in risk taking which levels off over time and an addi-tional group effort. In addition, while out-comes, wins or losses, differentially affect the level of risk taking (amount bet), they do not affect either the size or the directions of group produced shifts. (p. 231)
There appears to be a lack of agreement concerning the
influence of prior outcomes on subsequent decisions (Kogan
and Wallach, 1967). These authors contend that there may
25
be both positive and negative recency affects at work in se-
quential decision making behavior. There may be implica-
tions for managerial decision making if prior outcomes have
a conditioning effect on current decisions involving risk.
McCauley, Stitt, Woods, and Lipton (1973) studied the
group shift at horse race tracks and found a group shift
towards caution. This is interesting since race betting
has been the subject of much research. Kogan and Wallach
(1967) cite the work of Griffith and McGlothin who in the
late 1940's and 1950's found the typical better to be a
risk taker.
There have been several studies which examined the
risky shift phenomena in situations which have more rele-
vance to managerial decision making. Deets and Hoyt (1970)
conducted a study of investment decisions and found that
groups made a more risky decision. The task involved se-
lecting a portfolio of securities first by individuals and
then in groups. The students were led to believe they were
basing their investment decisions on prices and returns from
actual current stock market, but in fact they were respond-
ing to a simulation which controlled for probabilities, pay-
offs, and the variances of choices. Groups preferred high-
risk, higher variance securities when asked to reach a
consensus.

26
In a study involving consumer products, Johnson and
Andrews (1971) found a negative relationship between amounts
of risky shift and the seriousness of negative consequences
associated with the risky choice. Johnson and Andrews used
three sets of consumer products each consisting of three
items (for example, deodorant, perfume, and nail polish
constituted one set) which were classified by their degree
of perceived risk—high, medium, and low.
Woodside (1968) , in his doctoral dissertation, found
that the risky shift may also exist in consumer product
decision making. He found a risky shift for steam iron and
camera purchases, while a conservative shift was found for
automatic washing machines. His subjects agreed on which
one they would buy and not upon what was actually bought.
Reingen (1973) studied the risky shift using different
purchasing situations invoQving industrial goods. The situ-
ations varied from high normative to low normative risk
measured in a decision theory context.
Normative risk refers to that lowest level of probability of the desired state of nature for which the expected cost of the conservative course of action exceeds the expected cost of the riskier alternative course of action. (p. 340)
Reingen found that the amount of the risky shift was
negatively related to the level of normative risk as defined
above. The medium normative risk situation showed no shift

27
at all. Reingen found a similar relationship in his doc-
toral dissertation (1974) when he studied consumer buying
situations.
A Critique of the Literature
The vast majority of the preceding research has uti-
lized the CDQ or some variant of this instrument. Two years
ago, Cartwright (1973) stated:
The topic remains quite popular and the challenge for finding quick explanations was especially appealing because the basic problem was so neatly circumscribed and of such a na-ture that a solution appeared to be attainable by means of a few well designed experiments. As time went by, however, it gradually became clear that (the findings) . . . cast serious doubt on the validity of the proposition (risky shift) itself. (pp. 224-225)
As the research unfolded, it became evident that it was
incorrect to sum across all the CDQ items. That this is mis-
leading can be seen in the fact that the risky shift is not
uniform across all the items. Items number 4, 7, and 11
tend to produce risky shifts; items 2, 5, and 12 typically
result in cautious shifts; while the remaining six items are
somewhat neutral (Cartwright, 1971). Perhaps to achieve
parsimony in their research, researchers using the CDQ often
eliminated from their questionnaire those items which typ-
ically produced a cautious shift!
Not only do different dilemmas provide different choice
shifts but the magnitude varies considerably. The overall

28
magnitude is really quite small and estimated by Pruitt and
Teger (19 67) to be approximately 7 percent. Belovicz and
Finch (1971) used a continuous scale instead of the usual
discrete choices and made more refined statistical analyses.
They found that the risky shift in the CDQ is a function of
the scale used which is biased downward (more risky). After
subjecting the data to reanalysis they found absolutely no
shift at all. They stated that the only conclusion which
can be drawn is that groups tend to be less extreme than
individuals.
Be merely altering the instructions in administering
the CDQ, one can obtain no risky shift at all (Clark and
Williams, 1969). Typically, subjects are asked to make a
recommendation to the imaginary person in the specific CDQ
item, but there is no significance, incentive, and respon-
sibility attached to the final outcome. Real world deci-
sions typically have real implications for the decision
maker. When subjects take on different roles or are advis-
ing loved ones, results are quite mixed.
Not only are the CDQ items rather trivial, but the
groups are usually ad hoc in nature. Potentially important
social system variables are thus not present which severely
limits any generalizations to real groups or committees.
The individual items on the CDQ contain considerable
ambiquity and therefore make subjective probability estimates

29
quite difficult. Mackenzie (1971) argues that there is in-
sufficient information to calculate a minimum probability
of accepting the desirable (but risky) alternative. Mac-
kenzie also has suggested the possibility of serial depen-
dencies due to the decision sequence in group discussions.
This would lead to auto-correlation and an overestimation
of the F and t statistics. This may be important when one
considers the fact that while reported differences are
statistically significant they are also small. Mackenzie
concludes:
The possibility of positive autocorrelation places the already beleaguered risky shift data in new difficulties. For example, if there are ongoing group processes which are implied by the diffusion of responsibility and value of risk hypotheses, then there should be some positive autocorrelation. If there is, the data cannot be accepted unless some means are used to remove it. However, if there are no autocorrelated disturbances, then the diffision of responsi-bility and value of risk hypotheses may be in-correct. (p. 298)
A major criticism of the risky shift literature is in
the experimental design typically utilized. The vast major-
ity of studies have used a repeated measure, within-subjects
design where both the individual and group decisions are
made by the same subjects. Several studies have used a
between-subjects design (Carlson and Davis; McCauley, Teger,
and Kogan) which are cited in Pruitt (1971b). They did not
find a statistically significant difference although groups

30
tended to take more risk. This is one indication of a fail-
ure to examine the phenomena under different conditions and
with different methodologies.
Perhaps the greatest single weakness in all of the CDQ
research is the basic assumption, beyond disposition change,
that the instrument measures risk. If this assumption is
not valid, then the line of investigation is reduced to
studies of attitude change, social comparison theory, in-
fluence theory, and conformity theory. The latter theory
cannot be ruled out as an explanation. Cartwright (1971)
did a reanalysis of Cecil's (1967) data and found that the
principles of majority, coalition, and mean rule predicted
75 percent of the group decisions.
What are the determinants of an individual's choice on
the CDQ dilemmas? Very little empirical work has been done
on the specific characteristics of the various CDQ items.
In large part, the question of what constitutes risk was
largely ignored in the choice dilemma studies (Cartwright,
1973). What do the choices measure—perceived risk, ideal
risk, or values? Cartwright (1971) states:
. . . it is clear that choices cannot be taken as a measure of the value for risk unless the values of outcomes are held constant. Since the requirement is obviously not met in the usual formulation of choice dilemmas, the conceptual meaning of choices remains ambiguous. (p. 369)
In his analysis, Mackenzie (1971) questions the major
assumption:
31
While it is not possible to categorically reject a hypothesis stating that the Wallach-Kogan decision of £ is a measure of risk for Wallach-Kogan type problems, there are addi-tional strong normative and empirical arguments against it being considered a necessary and sufficient measure of risk. (p. 291)
The handful of studies that did not use the CDQ instru-
ment have provided inconclusive results and suffer from many
of the same deficiencies and weaknesses pointed out above.
For example, they are also examining situations which had
little significance attached to the outcomes. The purchas-
ing situations of Reingen and Woodward may not be measuring
risk but rather product preference or product images. These
studies, while a welcome departure from the typical choice
dilemma situation, are not very comparable (like leisure
gambling) to managerial decision making nor are their re-
sults conclusive.
The research conducted since Stoner proposed the "risky
shift" phenomena has been extensive. Cartwright (1973) as-
sembled a bibliography of 196 items related to group deci-
sions involving risk and found that 182 of them can be
directly traced back to Stoner's study in 1961. The research
seems to rule out any generalizable risky shift and has
failed to provide an adequate explanation for the phenomena
even in the specific choice dilemma situation. What was
found was that groups can shift but not invariably in a
risky direction, which has perhaps led to the use of such

32
terms as choice shift and group shift in the titles of the
more recent research.
The basic question of whether groups make more risky or
conservative decisions has not been answered. Cartwright
(1973, p. 231) stated that "We still do not know how the
risk taking behavior of 'real-life' groups compares with
that of individuals." The current status of research in
this area appears to be one of auguring for a reformula-
tion of the problem.
Risk Constructs
From the preceding section it is eyident that one of
the major criticisms and weaknesses of the risky shift re-
search has been the construct of risk. This is both a
definitional and operational problem which was seldom, if
ever, adequately addressed by researchers nor incorporated
into the general paradigm.
Richmond (1968) classifies decisions into two basic
categories based upon the amount of information available.
The first category is decision making under certainty in
which the true state of nature (outcome) is known. The
normative course of action is to select that action which
has the highest payoff or value.
VThen one lacks complete information, he is facing un-
certainty which is usually separated into three types of

33
decisions (Richmond, 1968). First, decision making under
risk where one knows all the states of nature (outcomes) and
their probability distribution, The normative course of
action is to select that choice which maximizes expected
utility. The other extreme is decision making under ignor-
s^^ce where one does not have any knowledge about the occur-
ence of the states of nature and possibly not even the states
of nature. Mackenzie (1971) states that this definition
best describes the CDQ items used in so much of the research.
In between these two, is decision making under uncertainty
where one knows the states of nature (outcomes) but not
their probability distribution. The normative course of
action is often to assign subjective probability estimates
for the different outcomes and then select that action which
has the highest subjective expected utility.
While most business decisions are classified as deci-
sion making under uncertainty, Conrath (1967) states that
the usual definition is too constrained and restrictive.
First, the highly constrained view of uncer-tainty used in most of the decision making under uncertainty problems is unrealistic. The environ-ment that is usually structured is far more certain than the vast majority of those actually faced by most decision makers in the "real world." Much remains to be done in the way of studying decision making, both from a positive and a normative stand-point, in an environment less well structured than those usually envisaged in most decision making under uncertainty problems. Hence, it behooves us to study the problem of decision making under a variety of environmental conditions, specifically

34
those which affect the degree of certainty in the decision making situation. (p. 499)
Quite often the outcomes will also be a function of the
course of action taken by others (opponents). The type of
analysis often applied under these conditions is that asso-
ciated with game theory. Much has been written on zero-sum
games and "prisoner dilemma" situations, but one must con-
clude that few managerial decisions are so neatly circum-
scribed or closed. Streufert and Streufert (1970) have
commented:
In a unidimensional game (experiment) each decision is governed by the zero-sum rule: once a decision is made, for instance the prisoner's dilemma setting, the costs and profits for that decision are divided according to the choices of both players. In other words, cost and profit in simple environments are functions of the risk-to-payoff dimension, and certainty (of attaining the profit) is a probability associated with that di-mension (again, if, the perceiver is rational).
The zero-sum effect of a complex (multidi-mensional) environment, or on a complex game, is at least in part based on a constellation of var-ious decisions which are additive in their effect only, if the perceiver considers all potential decision-making dimensions present in that en-vironment. Consequently, cost and profit in com-plex environments for each individual decision may not be perceived as directly related (in a one to one fashion) and certainty may become to a large extent based on subjective judgment.
If these considerations are correct, then the findings about risk-taking behavior and other psycho-economic variables which have been obtained by researchers working with simple environments may, or may not, hold in more complex environ-ments. (pp. 18-19)

35
From the preceding discussion one might reasonably in-
fer that it is not possible to obtain a simple risk construct
unless one analyzes only very simple, unidimensional environ-
ments. Given the type of environments in which managerial
decisions are made, the most applicable construct is deci-
sion making under uncertainty with the further recognition
that not all variables can or should be controlled.
Simulated Environments
There have been a series of studies which have utilized
simulated decision-making environments in examining risk-
taking and other variables pertinent to this study.
In their text Management Games for Teaching and Re-
search, Babb and Eisgruber (1966) examined various psycho-
logical attributes and individual performance using the
Purdue Farm Supply Business Management Game. Of the six-
teen psychological variables which were examined, three
explained 74 percent of the variation in individual game
success as measured by final net worth of the company. The
three variables were the cautiousness scale of the Gordon
Personal Inventory which measures risk-taking behavior; the
Rotter Internal-External Inventory which measures whether
outcomes are attributed to one's own doing or to external
circumstances; and the Army Alpha-5 which measures reason-
ing ability. Although the sample was small (n=23) in this

36
study, all were experienced managers in the farm supply bus-
iness which was also the type of business simulated.
In his Ph.D. dissertation, Miller (1969) used a computer
simulation marketing game to compare risk taking and team
performance. He found no significant difference between
risk taking and performance in the marketing game. However,
as his measure of risk taking, he utilized six modified pro-
blems from Kogan and Wallach's Choice Dilemma Question-
naire.
Lewin and Weber (1969) utilized the Carnegie Tech Man-
agement Game to indirectly measure the change in CDQ scores
from the beginning of play to the end of play. They did not
relate CDQ scores directly to game variables and thus the
question was whether the teams apparently changed in their
risk preferences (on CDQ items) due to playing the game.
Teams showed a greater risk preference at the end of the
game. In reality, this is not too much different from two
treatments of the usual CDQ methodology.
In his Ph.D. dissertation, Higbee (1970) conducted a
somewhat similar study. He compared CDQ scores to actual
risk-taking behavior in the Tactical Negotiations Game
(TNG), a complex decision-making task involving a simulated
internation conflict. He found no significant difference
in CDQ scores and the riskiness of the military decisions

37
and he further concluded that the CDQ instrument may not be
an accurate indicator of actual risk in a complex task.
Kennedy (1971) used the DATA business game and compared
financial performance with scores on the Paragraph Comple-
tion Test developed by Schroder, Driver, and Streufert. The
test (a forerunner of the GIAL discussed later) is a measure
of cognitive complexity and one measure of the level of ma-
turity of human information processing capability. Teams
composed of more abstract members (those with higher scores
on the test) performed significantly better. In addition
Kennedy found some evidence that the difference increases
over time as the number of the plays of the game increases.
Hunsaker (1971) in his D.B.A. dissertation used a simu-
lated decision making environment called the LUNA I MOON
COLONY game which is largely a novel situation and more of
a basket exercise. Hunsaker found no shift in risk taking
between individual and group decisions. Further comment on
this research was described recently by Hunsaker (1975) who
states that GIAL (General Incongruity Adaption Level) theory
can be useful in predicting risk preferences and performance
in complex environments (also see Driver and Hunsaker, 1972),
Siegel (1972) in his Ph.D. dissertation compared group
composition based on risk propensity with performance re-
sults in the MISPA management simulation. He found that

38
groups higher in risk-taking propensity out-performed the
lower risk groups.
Hunger and Wheelen (1975) examined whether high per-
formance teams in an interactive, simulated management game
had certain identifiable characteristics different from low
performance teams. They did not examine propensity to take
risk but conclude that there was a significant difference
in that high performing teams perceived themselves to be
more goal oriented. The authors utilized graduating seniors
in the senior policy course as their subjects.
In some general explanatory research, Nielsen (1975)
did not find evidence that groups took more risk (perceived)
in playing The Investment Game. However, this study only
asked individuals whether they felt they did or would take
more risk and half replied affirmatively. No attempt was
made to measure the degree of risk taken. In addition,
the teams were dyads and not comparable to most studies
which used larger groups.
Ewing, in his D.B.A. dissertation (1973), examined the
relationship between risk taking and creativity to the over-
all performance in a simulated management game (IMAGINIT).
He used the Work Requirement Preferences (WRP) test to mea-
sure preferred risk levels. He found no significant dif-
ferences between high and low risk preference teams and team
performance in the play of the game. Ewing's study lacks

39
any measurement of risk taking in the simulated game and one
can question the test utilized to measure risk taking pro-
pensity in that it consists of eight questions about job
preference and no validation was given for this instrument
as a risk-taking measure.
Summary
This chapter presented a review of the development of
the risky shift literature together with a discussion of
risk constructs and simulated environments which are per-
tinent to this study. To summarize, the following points
have been brought out in this chapter:
1. Although a great deal of research has been con-
ducted, the question of whether real groups make more risky
decisions than individuals remains unanswered.
2. The conditions under which group shifts (either
cautious or risky) are observed have seldom been examined.
3. There is no general agreement on the numerous ex-
planations for the limited and questionable results obtained.
to date.
4. The vast majority of risky shift research is based
upon a single research instrument and methodology, the Choice
Dilemma Questionnaire, which has been heavily criticized on
both operational and statistical grounds.

40
5. One uniform characteristic in all of the research
is that the variables were examined in unidimensional en-
vironments with either nonexistent, very small or insig-
nificant consequences attached to the outcomes of the
decisions. Real decisions that entail some degree of risk
cannot be viewed in such a closed system perspective.
6. The research is chacterized by the lack of an
operational definition of what constitutes risk. An iden-
tifiable risk construct was seldom stated in the literature
7. Several attempts have been made to utilize simu-
lated environments to measure risk taking. However, none
of these studies represented a rigorous test of the intrin-
sic degree of risk taken by individuals and groups.
8. There does appear to be some support for group
composition as a determinant of group risk taking.
This chapter has presented a review and critique of
the literature. Chapter III presents the methodology of
the current investigation.

CHAPTER III
METHODOLOGY OF THE STUDY
The previous chapter has shown numerous weaknesses in
the risky shift literature. Most studies have used the
same research instrument, the Choice Dilemma Questionnaire,
which has been heavily criticized. Most of the research
has utilized hypothetical decision-making situations of a
unidimensional nature with little or no significance at-
tached to the possible decision outcomes.
The objective of this study was to determine if groups
made more risky decisions than individuals in a multidi-
mensional, multivariate, simulated environment more typical
of managerial decision-making. The experiment was designed
to measure and test four variables which have been fre-
quently postulated to affect risk taking.
This chapter will discuss the research questions, hy-
potheses, definition of variables, primary research instru-
ment, population of the study, experimental design, and
procedures of the study.
Statement of the Problem
The review of the literature has shown several areas
which require further investigation. These are represented
below in question form.
41

42
Question 1: Do groups make more risky decisions than
individuals in a simulated environment?
Question 2: Do differences in the consequences of a
decision affect whether groups make more risky or conserva-
tive decisions than individuals in a simulated environment?
Question 3: Do differences in propensity to take risk
affect whether groups make more risky or conservative de-
cisions than individuals in a simulated environment?
Question 4: Do prior experiences or outcomes affect
whether groups make more risky or conservative decisions
than individuals in a simulated environment?
Question 5: Do differences in propensity to take risk
affect group performance in a simulated environment?
Hypotheses
The following null hypotheses were derived from the
preceding questions and were based on the assumption that
propensity to take risk, performance, significance of out-
comes, and prior outcomes are major variables affecting the
degree of risk taking by individuals and groups in a com-
plex, multi-variate, simulated environment. Identification
and definition of variables are made in the next section.
Hypothesis 1;
(a) There is no significant difference between the
fringe benefit decisions of high propensity to take risk
individuals and low propensity to take risk individuals.

43
(b) There is no significant difference between the
fringe benefit decisions of high propensity to take risk
groups and low propensity to take risk groups.
(c) There is no significant difference between the
fringe benefit decisions of high propensity to take risk
individuals and low propensity to take risk groups.
(d) There is no significant difference between the
fringe benefit decisions of low propensity to take risk
individuals and low propensity to take risk groups.
Hypothesis 2:
(a) There is no significant difference between the
probability of a labor strike (prior outcomes) and indi-
vidual decisions on fringe benefits.
(b) There is no significant difference between the
probability of a labor strike (prior outcomes) and group
decisions on fringe benefits.
(c) There is no significant difference between indi-
vidual and group fringe benefit decisions as the probabil-
ity of a labor strike increases.
Hypothesis 3:
(a) There is no significant difference between the
length of a labor strike (significance of outcomes) and
group decisions on fringe benefits.
(b) There is no significant difference between the
length of a labor strike (significance of outcomes) and
group decisions on fringe benefits.
44
(c) There is no significant difference between indi-
vidual and group fringe benefit decisions as the length of
a potential labor strike increases.
Hypothesis 4:
(a) There is no significant association between per-
formance and individual fringe benefit decisions.
(b) There is no significant association between per-
formance and group fringe benefit decisions.
Hypothesis 5: There is no significant difference in
the performance of high propensity to take risk groups and
low propensity to take risk groups.
Operational Definition of Variables
Independent Variables
The first independent variable is propensity to take
risk which research has shown to be potentially important
in risk-taking behavior. The difficulty lies in actually
measuring the general propensity to take risk of an indi-
vidual. Indeed, there are very few instruments which have
been designed to achieve this prupose. Two instruments
which have been used are the Rokeach Value Scale and the
Gordon Personal Inventory's Cautiousness Scale. Both of
these instruments are quite unidimensional in nature and
therefore less appropriate for complex, multidimensional
environments.

45
Driver and Streufert (1967) have developed an instru-
ment based upon incongruity adaptation theory. The instru-
ment is the General Incongruity Adaption Level (GIAL)
self-description test which purports to measure the ex-
posure to, expectation for, and liking for incongruity by
the subject in his past experiences. The GIAL test is a
paper and pencil test consisting of 19 incomplete questions,
each having four to eight responses for a total of 100 re-
sponses (Appendix A). Subjects rate each response on a
five point scale from very infrequently to very frequently.
The GIAL test has been found useful in predicting risk
preferences and performance in complex environments (Hun-
saker, 1975; Driver and Hunsaker, 1972). Hunsaker comments:
Assuming that risk taking is one way of in-creasing incongruous cognitions, (Emerson, 1968) the preceding formulation also indicates that, ceteris paribus, individuals with high GIALs will desire more risk in their environment and will engage in more risk-taking behavior than will individuals with low GIALs. This positive, lin-ear relationship between risk taking and GIAL is hypothesized to remain at all but the most extreme levels of environmental incongruity (i.e., high GIAL individuals will engage in more risk-taking behavior than will low GIAL individuals). (p. 175)'
The GIAL test was selected to measure propensity to
take risk due to its multidimensional nature and also be-
cause it relates more closely to the incongruency one finds
in an uncertain environment. Professor Driver reported in
a telephone conversation to this investigator that in á

46
recent testing, n = 4,000, the reliability between pre-
tests and post-tests was approximately .8. There is no
information available on the validity of the GIAL test.
Its primary advantage is in its recent successful use in
discriminating among risk preference levels of individuals
and its use in related behavioral research. In this study,
propensity to take risk is defined as the GIAL level of
individuals.
The second independent variable is based upon the
proposition that prior decision outcomes or experiences
can influence succeeding decisions. In this study specifi-
cally, decisions on the dependent variable, fringe benefits,
may be affected by the probability of a strike which is a
function of the previous decisions on fringe benefits. In
the IMAGINIT MANAGEMENT GAME, described later, the model
compares the hourly fringe benefit amounts for all the
firms in a given industry and then calculates response in-
dices which in turn determine the probability of a labor
strike. In this study, prior outcomes are defined as the
result, probability of a labor strike, of the previous
year's fringe benefit decision. All experimental groups
faced the same, although increasing, probability of a labor
strike.
The third independent variable is the significance of
outcomes or the stakes involved in making a decision on the

47
dependent variable, fringe benefits. This is defined in
this study by varying the length of a labor strike across
the various sections.
The fourth independent variable is group performance.
This is based upon the premise that how well a group is
performing may influence the degree of perceived risk. If
a group's firm for example is very successful or unsuccess-
ful, then this may temper decisions on the dependent vari-
able. Performance is also treated as a dependent variable
in testing whether high or low propensity to take risk
groups perform better. As discussed previously, perfor-
mance is defined in this study as the market price of each
firm's common stock.
Dependent Variable
A unique feature of the IMAGINIT MANAGEMENT GAME (Bar-
ton, 1973) is the ability to identify a single, quantifi-
able measure of risk in an uncertain environment. The
dependent variable is the dollar amount per hour spent on
fringe benefits which determines the probability of a labor
strike. The decision of how much to spend must be made by
each team for each period. As are so many variables in the
"real" world, this single variable decision is made in a
multivariate context. A given team may decide to spend more
on fringe benefits in hopes of decreasing the likelihood of

48
a strike but concomitantly will be increasing costs and re-
ducing their operating margins. Thus, this decision can be
made in light of not only costs and profits, but perhaps in
relation to other game variables in allocating scarce re-
sources.
Each firm or team starts with the same fringe benefits
rate and a .05 strike probability. Future probabilities of
a strike are a function of what a firm decides to spend on
fringe benefits versus what the other firms in that indus-
try spend on fringe benefits. The exact probability is
determined by a sub-routine (Barton, 1967) which calculates
an average industry response index from which each firra's
response index is corapared to determine the firras' proba-
bility of a strike. This probability is included on each
firm's policy statement after each play (Appendix B). A
given firm knows only their own probability and not that of
the other firms and can only surraise what is happening to
the other firras. Thus, for each decision, every firra is
uncertain of the outcome of a fringe benefit decision.
Primary Research Instrument
However desirable field experiraentation might be from
an external validity standpoint, it has practical liraita-
tions for the current study. With respect to measuring
risk taking by groups in real organizations, the researcher

49
would have to control independent variables such as commit-
tee or group selection, consequences of outcomes, and the
types of decisions to be made and by whom. In short, few
if any organizations would allow manipulation of their
financial and human resources in their decision making.
Field research is further limited by the constraints of
time, cost, and environmental heteorgeneity across organi-
zations.
The use of business garaes as an educational tool has
received considerable attention since the introduction of
the AMA Top Manageraent Decision Siraulation Garae in 1956
(Rowland and Gardner, 1973). The question of simulated
business games as an educational device is not within the
purview of this study, but their use as a research setting
requires exaraination.
Shubik (1968) defines a business garae:
A business game is an exercise designed to siraulate the relevant features of an organization and its environment. During the play of the game the businessman, manager, or other decision-maker is required to make decisions in the space of a few hours or days which, in general, would be made over several years. The gaming model portrays:
1. The organization, which is a description of the internal features of the firm to be con-sidered.
2. The environment, which may include the market structure, the state of the economy, cus-tomers, and so forth.
3. The decision set, which may include pricing, advertising, production policy, hiring,
TEXASTECH LIBRARY

50
firing, and so forth. They are the features over which the decision-makers exert some direct con-trol.
4. The set of outcoraes, which are determined by the decisions selected and the state of the environment. In a business garae the outcomes may include raeasures such as sales volurae, share of industry, profits, and so forth. (p. 632)
The use of business garaes for laboratory experiraenta-
tion has increased in recent years. However, one raust al-
ways face the constraints on inferences to real world
settings based upon results obtained in a siraulated environ-
ment. Coplin (1970) describes this situation:
If reliability constraints on the use of raan-coraputer siraulations as experiraental devices are not as great as they are on the use of man-coraputer siraulations as operating theory, external validity continues to be an unresolved if not unresolvable problera. By explicitly stating that the simulated environment is not a theoretical model of the re-ferent systera but only a siraulated representation of that systera the question of the external valid-ity of the findings rests squarely on whether or not the simulated environment is similar enough to allow the results to be generalizable from the ex-periment to the referent system. Because one can-not construct experimental controls over the re-ferent system raakes the findings in the experiraental setting always open to question—the sarae conditions which exist for all types of small group research obtain for the use of man-computer simulation as an experimental device. (p. 399)
This dilemraa is not exclusive to siraulated garaes but
holds for laboratory reserach in general, as Weick (1967)
describes:
It is unlikely . . . that any experiraent will fully satisfy the investigator who values fidelity between laboratory and natural events. Fidelity

51
typically must be compromised to gain clarity and control. If a person wishes to use experiments, he probably will have to choose among the several characteristics of organizations that he regards as important. To gain control, simple tasks in simple settings are often required. Selectivity need not be detrimental, it raay corapel the in-vestigator to be raore explicit. (p. 4)
Recognizing this liraitation, Coplin (1970) concludes:
No raatter what the statistical significance of the findings, then conclusions reached about huraan behavior in a raan-computer simulation are not automatically generalizable to the ref.erent system. The scholar is still forced to speculate when he undertakes to relate his findings in the reference systera as for example Robinson (1969) does when he seeks to apply the findings of his study with Burgess to contemporary Araerican foreign policy toward NATO. The raain benefit frora the use of raan-computer simulations as ex-periraental devices in coraplex environments, then, appears to be as a vehicle to produce curaulative findings to support theoretical constructs which raay or raay not be generalizable to the referent systera. (p. 408)
Moskowitz (1973) believes that siraulated garaes used
jointly for training and experiraentation can be an effective
research laboratory.
Such garaes perrait systematic investigation of behavioral phenomena under controlled condi-tions, thereby facilitating the drawing of general inferences, virtually impossible in "environment-rich" situations. (p. 686)
Sims and Hand (1975) believe that in simulation games,
teams develop and stabilize which is more realistic than ad
hoc group situations. They feel another advantage is that
group processes are integrated with the total decision
system.
52
We believe that complex longitudinal simula-tion gaming can elicit a quasi-real environment that bears a reasonable isoraorphisra with a "real-world" raanagerial group decision-making environ-ment. (p. 42)
Rowland and Gardner (1973) after their review of behavioral
science research with business games conclude that they
hold promise as a research tool, perhaps more so in this
respect than as an educational tool.
The main advantage of using a simulated game as the
research instrument in this study lies in the fact that it
represents the closest approximation to the risk construct
most relevant to business, i.e., decision making under un-
certainty, and at the same time allowing for the manipula-
tion of pertinent variables.
Game Selection
While there are numerous siraulated business games be-
ing utilized, THE IMAGINIT MANAGEMENT GAME (Barton, 1973)
was selected for this study because it is a complex, inter-
active, total enterprise game. IMAGINIT is used at numer-
ous collegiate schools of business both at the graduate and
undergraduate levels. II-IAGINIT has been described as the
granddaddy of manageraent simulation games (Couger, 19 76).
Another iraportant reason is the investigator's experience
in administrating the game from 1974 to 1976. The game has
considerable flexibility and a high degree of uncertainty

53
with respect to winning strategies. It is not a simple nu-
merical game but requires strategic skill in the decision-
making process.
Typically, players are organized into teams of any
size which represent different firms in a given industry,
usually best described as oligopolistic in nature. The
firms compete against each other in an interactive fashion,
all from the same identical starting position.
The simulated period can be years, quarters, or months
with changes permitted as the play progresses. Each team
makes one decision per week during a semester system. Up
to 28 decisions are made by each team for each period of
play. For each industry, a maximum of three products may
be sold in two markets. For each product the decisions are:
1. Price 2. Materials input per unit 3. Salesmen expenditures 4. Advertising expenditures 5. Product R + D expenditures 6. Materials to be ordered in dollars 7. Number of units to be ordered.
The following decisions are for the firm as a whole:
1. Employee fringe benefits per hour 2. Dividends per share to be paid 3. Operations research expenditues 4. Short-term loans and repayments 5. Bonds to be issued or redeemed 6. Shares of comraon stock to be sold 7. Dollars of factory capacity to be purchased or
sold.

54
Evaluation of Game Performance
While there are raany alternate ways in which to judge
play of the garae, the ranking of team performance was made
on the basis of each firm's average common stock price.
For the IMAGINIT MANAGEMENT GAME, the market price of a
firm's comraon stock is a function of:
1. Current cash dividends and dividend history. Low or missed dividends have a negative impact on stock quote.
2. Current profits and history of past profits.
3. Current book value of coraraon stock plus history of book values.
Selection of stock price as the perfoinnance criterion can
be justified in that it is directly or indirectly affected
by alraost every aspect of the firm's operations. In addi-
tion there are sufficient controls in the IMAGINIT MANAGE-
MENT GAME, for example not allowing dividends to be paid
from zero or negative retained earnings, to prevent attempts
at maxiraizing one variable at the expense of another. The
use of a single, quantitative criterion also elirainated the
problem of subjective interpretations by this investigator.
Significance of Garae Perforraance
A major reason a simulated manageraent garae was chosen
as the priraary research vehicle is that considerable sig-
nificance can be attached to decision outcoraes. One of the

55
major criticisms of risky shift research to date has been
the lack of significance for both individual and group de-
cisions.
In this experiraent, real stakes were introduced into
the decision-raaking process since two-thirds of a student's
final course grade was determined by performance in the
IMAGINIT MANAGEMENT GAME. Each team received an overall
grade based upon their play of the IMAGINIT MANAGEMENT GAME
during the semester. This grade represented one-third of
the final course grade.
An additional third of the student's final grade was
determined by their team grade on case analyses. The two
team grades, from the IMAGINIT MANAGEMENT GAME and case
analysis, was increased or decreased a letter grade for
each individual if his peer evaluations warranted a change.
Therefore, some students received a grade of B for the
IMAGINIT MANAGEMENT GAME portion even though his team grade
was a C.
The final third of the student's individual grade was
deterrained on the basis of his individual decisions. For
each of the first five years play of the IMAGINIT MANAGE-
MENT GAME, each individual's decision was substituted for
his teara's decision, everything else held constant, and the
period was resimulated. If on the average, his individual
decision resulted in a higher market quote for the period

56
then he received a one letter grade increase over histeam's
grade in the IMAGINIT MANAGEMENT GAME. A student received
the same grade as his team received if his individual
market quotes were approximately the same as those of his
team. Finally, if the student did considerably poorer than
his team, his grade was reduced one letter grade from the
team grade.
The latter procedure was utilized not only for peda-
gogical reasons, but also to give equal weights to both the
individual and group decisions. Only if this were the case
could the researcher assume that the risk levels would be
perceived to be equal for group and individual decisions.
Characteristics of Population and Setting of the Study
The subjects in this experiment were 108 senior busi-
ness students at Texas Tech University, Lubbock, Texas,
enrolled in the four sections of the Administrative Policy
course (Business Administration 4 380) taught by the inves-
tigator during the spring semester of 1976.
The Administrative Policy course is required for all
undergraduate business students at Texas Tech University
and is taken during the student's senior year. Enrollment
in the course is tightly controlled to insure that all
students have the required course prerequisites. This
includes coursework in Management, Accounting, Marketing,

57
Finance, Economics, Statistics, and Computer Programming.
These requirements are necessary due to the capstone nature
of the Administrative Policy course.
Team Forraulation
The size of tearas raay be an iraportant factor at the
margin—for teams with only two merabers or tearas with a
large number of members. Thomas and Fink (1963) reviewed
the research on effects of group size and concluded that
it can affect some aspects of group and individual perfor-
mance, but they temper any broad generalizations. With
respect to group conformity and consensus, the authors
point out such effect may be greatest at the extremes of
group size resulting in a curvilinear relationship but it
may also be situationally dependent. Bennett, et. al.,
(1973) found no conclusive evidence on group size and the
risky shift. Kennedy (1971) found no significant differ-
ence in team size and financial performance in a simulated
business game.
Besides this inconclusive evidence, group size was not
used as an independent variable for two other raajor rea-
sons. First, raost of the prior research has utilized groups
consisting of three to seven raerabers, a not uncommon size
for many managerial decisions. Second, it was not possible

58
a priori, to control precisely the number of students in
each section of the course.
Although desirable for experimental design considera-
tions, it was not possible to have precisely the same
number of students on each team. This was due to lower
than expected course enrollments which resulted in an un-
even distribution of students in the various sections. As
a result, the three experiraental sections contained a mix-
ture of three and four meraber tearas with the latter repre-
senting 16 of the 24 experiraental tearas. The control
section had five raerabers on each of the four tearas.
All class raerabers reraained on the same team for both
the IMAGINIT MANAGEMENT GAME and other course activities
which included case analyses. By not changing team as-
signments during the seraester it was believed that this
would lend strength to the realisra of such groups—a factor
often absent in prior research.
Teara Assignraent
The assignraent of students to their respective teams
was accomplished by means of stratified sampling. All the
students in each section were divided into the following
strata:
1. GIAL Test Score 2. Overall grade point average at Texas Tech Univer-
s i ty

59
3 . Major area of study in bus iness
4. P r i o r siraulated garae exper ience .
Each team was then coraposed by randomly selecting students
from these strata (Appendix C). Since the strata were not
all of equal size, it was necessary to have some priority
in selection. The strata are listed above in their rela-
tive priority. GIAL was foremost since it was one of the
independent variables used in the study.
Stratified sampling was utilized since grade point,
major, and prior simulated game experience could become
confounding variables and thus needed to be balanced across
the experimental units. The fourth factor refers to the
fact that approxiraately 39 per cent of the students did
have very limited IMAGINIT MANAGEMENT GAME experience as
freshmen while enrolled in the Introduction to Business
course at Texas Tech University. This factor was not well
balanced across teams but this was not felt to be a serious
limitation. First, the student's prior game experience was
a very limited version, both in terms of content and tirae,
corapared to the present play of the garae. Second, there
was no grade raotivation in the play of the garae. Finally,
this experience occurred at the beginning of a student's
business education when presumably he knew very little
about business subjects.

60
Experimental Design
The investigation consisted of two studies. The first
study replicates conditions of ignorance since the students
played a practice versicn, rhree decisicr.s cr years, cf tr.e
IMAGINIT MANAGEMENT GAME. This represented a training ses-
sion whereby students learned the mechanics of the game
with no real stakes involved since their performance was
not evaluated nor part of their course grade. This play of
the IMAGINIT MANAGEMENT GAME utilized the cereal industry
version in which the play was normal—no manipulations of
length of strike or probability of strike were present.
The first study was made to both analyze differences be-
tween group and individual decisions and also to serve as
a contrast study for the second study.
The second or priraary study consisted of the auto-
mobile industry version of the IMAGINIT MANAGEMENT GAME
which was played over a nine-week period during the semes-
ter. The first five years of this play represented the
major experiment in which the independent variables were
raanipulated.
The experimental design for the primary study of this
investigation required a simultaneous test of the differ-
ences among two treatraent effects, length of strike and
probability of strike, and one blocking variable, propensity
to take risk. Analysis of variance (ANOVA) was used to

61
test hypotheses la, Ib, 2a, 2b, 3a and 3b. Two 5 x 3 x 2
factorial designs were required—one for individual fringe
benefit decisions and one for group fringe benefit deci-
sions. This was necessary since it was not possible to
include in each cell the difference between an average for
individuals and a single value for the group decision.
Figure 1 illustrates and describes the factorial design
which was the sarae for groups and individuals. In addi-
tion, one section played the game in normal fashion and
served as a control group for this experiment.
In order to test the null hypotheses lc, Id, 2c, and
3c, nonparametric tests of significance were raade between
the individual raeans in the first ANOVA table with the
group means in the second ANOVA table.
In atterapting to disprove hypotheses 4a and 4b, par-
tial and raultiple correlation and regression analysis was
utilized. This was necessary since perforraance was ex post
in nature and because the other independent variables were
also hypothesized to affect the dependent variable. Final-
ly, in attempting to disprove hypothesis 5, analysis of
variance (ANOVA) was utilized.

62
Experimental Sections
Probability of Strike at End of Year
0 = .05
1 = .08
2 = .11
3 = .14
4 = .17
Section 1 Length of Strike
1 Month
LOW HIGH GIAL GIAL
n- =15 n=16
2 . n = 4 n= 4
II II
II II
II II
II II
Section 2 Length of Strike
6 Months
LOW HIGH GIAL GIAL
n=14 n=13
n= 4 n= 4
II II
II II
II II
II II
Section 3 Length of Strike
12 Months
LOW HIGH GIAL GIAL
n=15 n=15
n= 4 n= 4
II 11
II 11
II II
II II
Control Section
Probability of Strike is Model Determined Over the Five Years
0 1 2 3 4
Section 4 Length of Strike
2 Months
LOW HIGH GIAL GIAL
n=10 n=10
n= 2 n= 2
• n=number of individuals in all cells
n=number of groups in all cells
Figure 1. Illustration of 5x3x2 factorial design for analysis of variance of group and individual decisions.

63
Procedure
Four sections of BA 4380, Administrative Policy, were
involved in this study with a total enrollment of 108 stu-
dents. Each experimental section consisted of eight groups
or firms with three to four merabers in each group. Each
experimental section was divided into two separate, non-
interactive industries for the IMAGINIT MANAGEMENT GAME.
The first industry consisted of groups with low GIAL mem-
bers and the second with high GIAL merabers. The control
section consisted of one industry with two low GIAL groups
and two high GIAL groups with five students in each of the
four groups. Therefore, there were a total of seven sepa-
rate industries playing identical versions of the IMAGINIT
MANAGEMENT GAME except for different pararaeters on the
length of a labor strike.
GIAL Test
Division of students into high and low propensity to
take risk categories was based on a median split of the
scores on the GIAL test which was administered at the be-
ginning of the semester. Appendix D includes a stateraent
of purpose which was read to all students prior to coraplet-
ing the GIAL test.
Although not norraal statistical procedure, the use of
a median split of GIAL scores was justified on several

64
grounds. First, further breakdown of the scores into quar-
tiles for example would have resulted in an insufficient
cell size (n=2) for the experimental design. Second, a
statistical test of the difference between high and low
GIAL scores was performed. Table 1 presents the results of
these tests which show a significant difference in all four
sections.
TABLE 1
DIFFERENCES BETWEEN HIGH AND LOW GIAL SCORES
Section
1
2
3
4
n
16
10
14
15
High M
49.1
52.9
50.4
49.9
SD
3.11
7.7
4.5
4.5
n
14
10
14
15
Low M
38.2
38.5
35.9
36.1
SD
4.5
3.1
4.6
5.2
t
7.52*
5.19*
8.10*
7.46*
*£< .001
The GIAL test was given to every student enrolled in
the ten sections of BA 4380 during the spring semester to
check for representativeness of the four sections used in
this study. Table 2 presents the summary data of the GIAL
scores for the 249 students tested and also a one-way analy-
sis of variance of the mean scores for all ten sections.
The analysis of variance shows no significant difference

65
CN
w u
H
o w H W
2:
H i-q
H
W
s o u cn
o
(d -P 0
•)c O
<J\
o •H -P U (U W
00
VÛ
i n
ro
CM
(N •
(»
ro '«1'
r-«
vo
o ro
ro CN
<N i H
m CNl
i n cvi
00 CN)
o C«J
o ro
vo CNJ
r^j ro
cl
o
43.
cs •
C J ' r
00 •
CN
o •
vo ^*
H •
** •^
O •
ro «5r
vo
45.
o •
^ • « ^
o •
o ^
CVJ •
•^ •>*
X\
u-» •
0 0
• ^
t
00
OJ •
00
CNJ •
00
ro •
00
i n
•
ro •
r •
VO
i n •
00
vo é
vo
Q l c/ l
00
2,16
ro CM wo
H
r^ o 00
r-^ * i n
H
CNJ CN r
*> H
r-
2,52
o
1,73
t ^ 'sr m
^ H
00 (^ 00
H
'sr o ro
H
C0| c/3|
EL.1
C/3|
sl
æl w l
M- l |
c 0
•H +J (d
ari
>
m 0
(0 (U o j ^ íJ 0 C/3
• * CM
•
r» in •^ o
. • ^ o ro r
cs ro • ^
310
16,7
a\ <j\ cn CNJ
(0 C æ 0 C
•H 0 -P •H O -P (U u cn (U
co (u c: <U • H 5 x: -p -p (U •H cQ :s
00
C«J
H (d -p 0 EH
,
(n c o
• H
ect
(fl
H (d 4-> tí (U Ê •H U
Expe
•lc
O •
H
V
nce F
• H Ul
ions
-p u (U (0
(U
•p
tween
(U
ence b
j- i (U
H-l
m •H
-p c (d u
•H M-l • H C tJ^ •H (n
0 • •
66
between the mean GIAL scores. Therefore, the four experi-
mental sections are representative of total population of
249 senior students enrolled in BA 4380, Administrative
Policy.
Immediately following the administration of the GIAL,
the tests were air-freighted to the University of Southern
California where Professor Driver, co-author of the instru-
ment, scored the tests.
Practice Play
In the normal play of the IMAGINIT MANAGEMENT GAME
during a semester, students play a practice, no penalty,
version of some industry in order to learn the mechanics of
the garae and to gain a basic knowledge set prior to cora-
mencing "real play" which is a part of their course evalu-
ation. Several modifications to the normal practice pro-
cedures were necessary for this study.
First, it was felt essential that all students must
have the same level of understanding of the dependent vari-
able, fringe benefits, so that differences in knowledge
would not contaminate the results. Accordingly, all stu-
dents were tested and retested until they achieved a score
of at least 90 percent on a specially designed quiz on
fringe benefits. The quiz included questions on basic sta-
tistical probability concepts with respect to labor strike

67
probabilities in addition to the model's mechanics on
fringe benefits. These quizzes were given within a series
of six quizzes covering the essential aspects of the IMAGI-
NIT MANAGEMENT GAME. The purpose of the quizzes was to
increase uniformity of understanding on the game's mechan-
ics.
A second major consideration was the potential con-
ditioning effect on perceived risk if a team actually
received a strike during the practice decisions. This
normally can, and often does, occur during a practice play.
To prevent this potential confounding effect on perceived
risk, the labor strike generator was "turned off" during
the practice play. This fact was not known by the stu-
dents. In order to show what can happen if a team or firm
received a labor strike, all students were shown examples
of two firms in another industry which received strikes
during the practice play. In actuality, these reports
were specially prepared from team decisions made in prior
seraesters.
The practice play consisted of three decisions raade on
a weekly basis while the students were also taking the
quizzes and learning the game. All firms faced the sarae
garae pararaeters during the practice play. Individual and
group decisions frora this practice play became the basis of
the first study in this investigation.

68
Real Play
As described in the experimental design, one indepen-
dent variable is the probability of a labor strike result-
ing from a prior decision on fringe benefits. This is a
major treatment effect which required that every group,
firm, receive the same probability of a strike regardless
of fringe benefit decision araounts. To accoraplish this a
special version of the IMAGINIT MANAGEMENT GAME prograra was
written which generated the same strike probability for all
firras no raatter what they spent on fringe benefits. Since
strike probabilities were raanipulated upward to .17 (Fig-
ure 1), the labor strike generator was turned off during
the entire play thus reraoving any confounding effects
should a teara receive a strike. This fact reraained un-
known to the students until after the garae was completed.
Although the game lasted nine weeks or yearly deci-
sions, comparative data was gathered from the first five
decisions or years. After the fifth year, students were
inforraed that a new wage-rate settleraent had been made in-
creasing the hourly rate by 10 percent. Concomitantly, the
norraal IMAGINIT MANAGEMENT GAME program was used which al-
lowed strike probabilities to be determined in the normal
fashion. This procedure was done to simulate labor's dis-
satisfaction for higher fringe benefits versus increased
pay and to keep face validity of the game for the remain-
ing decisions.
69
Collection of Data
For each of the three practice and five real deci-
sions, every student was required to turn in an individual
decision sheet for every year or decision priod. The in-
dividual decision was made in the context of the outcome of
the prior year's group decision. Two days later, each group
submitted their consensus decision. At the beginning of the
next week, results of the group's decision in the form of
company and industry reports were disseminated and the pro-
cess repeated for eight weeks or years. For each individual
and group, the decision araount on fringe benefits wás col-
lected frora these decision sheets.
Individual Decisions
As described previously, an equal grading weight was
given to individual and group decision results. This was
necessary to equalize the perceived risk-return tradeoff
between individual and group decisions. Although not a
basis for specific analysis in this study, the individual
decisions were in fact evaluated for grading purposes. This
required that each individual decision be substituted for
his group's decision and the entire year resiraulated. The
results in terras of differences in perforraance were then
corapared. This procedure required numerous special com-
puter programs, data sets, and data interfaces in order to

70
obtain the results. Informed consent was obtained from all
students who participated in the research project (Appendix
E). In addition, students were informed of their individ-
ual results after completion of the entire game at the end
of the semester.
This Chapter has examined the basic research ques-
tions, experimental design, and the procedures of the study
Chapter IV will include the presentation and statistical
analysis of the data.

CHAPTER IV
PRESENTATION AND ANALYSIS OF THE DATA
The data which were obtained from the methodology des-
cribed in Chapter III will be presented and analyzed in
this chapter. The first part of the chapter is devoted to
the presentation of mean values of the dependent variable
for both studies. Following this general analysis of the
data are the sections devoted to statistical analysis of
the hypotheses presented in Chapter III.
General Analysis
Practice Study
The practice study was designed to attest the differ-
ences between group and individual decisions on the depen-
dent variable which is the amount spent on fringe benefits
each year. In a given year, higher fringe benefit amounts
were known by all players, via the testing procedure des-
cribed in the previous chapter, to lower the probability
of a labor strike. Therefore under uncertainty, ceteris
paribus, higher decision araounts on fringe benefits repre-
sents a raore conservative decision. Conversely, lower
decision araounts represent a raore risky decision since the
probability of a labor strike would increase. This is true
71

72
whether a teara lowers its fringe benefits or pays an amount
lower than the industry average.
The mean values and standard deviations of group de-
cisions in the practice study are presented in Table 3.
The beginning, or year zero of the garae, value for fringe
benefits was the sarae for all firras—fifty cents per labor
hour. There is very little variation in the data with two
exceptions. Teara nuraber 32, which is in the low GIAL in-
dustry of section three,increased their fringe benefits to
$1.00 in the third year. The other exception is team 25 in
the high GIAL industry of section two, which cut its fringe
benefits to $.35 in the third year. Both of these devia-
tions from the mean probably represented experimentations
during the final practice decision. Table 4 presents the
probability of labor strikes for the teams as a result of
their three practice decisions. These data shov/ little
variation except in the two industries, nurabers 4 and 5, in
which teams 25 and 32 participated. These industries are
composed of teams 25 through 28 and 31 through 34, respec-
tively. Therefore, over the three practice decisions al-
most all teams experienced similar strike probabilities
due to the homogeneous nature of their fringe benefit de-
cisions. This can be seen in the extremely small standard
deviations of the various cells in Table 3.

73
ro
W
CQ <
C/3
O H CO H O w Q ÎH
D O oî
u « H O E W CJ
fi< cn
o H 2 tH H H cn > EH w û
û
w
2 w
cn H
w Q
2: o
i^ w u
o •H •p u (U c/)
ro
C O
•H -P u (U cn
CN
c o
• H - P U (U
C/5
O • H - P U (U cn
tj\< •H H ffi O
. T H C!)
•H H
w o
o '^ • o
•H H
o < H ^
45 1-
•H H
o
H
o
O O O O
• • o o in
o o H O in
in vo r* cr»
• • o in
o o in o
• • O H in
in vo • *
o in
o H o ^*
• • H H in
in vo r- CNJ
• • H H in
in o r- in
in
'co
O H in r o in
o o • •
H O in
o in o H
in
o o in o
• • O H in
o o in o
in
in vo r- rsj
• • H H in
O H o **
• • CN H m
in o t^ in
in
'cn
CM
O H in r^
• • o in
o o
H O in
o H in a\
• • H H in
in in CN 00
• • ro ro VO CN
in CN CN CN
• • r* 00
O CN in in
• • rvj r>j in
O CNJ O 00
• • ro in
in o r>- in
in
S cn
ro
u (d 0 ÍH
n nS (U X
JH (d <u ><

74
TABLE 4
PROBABILITY OF LABOR STRIKE FOR EACH TEAM'S YEARLY DECISIONS IN PRACTICE PLAY
Team Industry Year 1 Year 2 Year 3
1 1 2 1 3 1 4 1
5 2 6 2 7 2 8 2
21 3 22 3 23 3 24 3
25 4 26 4 27 4 28 4
31 5 32 5 33 5 34 5
35 6 36 6 37 6 38 6
41 7 42 7 43 7 44 7
05 05 05 06
07 05 04 05
06 06 03 05
04 05 06 06
05 05 05 04
05 ,06 ,04 ,06
.05
.05
.05
.05
.05
.05
.05
.06
.08
.05
.03
.04
.07
.05
.03
.05
.04
.04
.05
.07
.06
.06
.06
.03
.04
.06
.03
.06
.04
.04
.06
.05
.05
.05
.05
.06
.07
.05
.04
.04
.08
.05
.01
.05
.18
.00
.00
.03
.14
.00
.12
.13
.02
.07
.04
.07
.05
.05
.06
.05

75
The mean values and standard deviations of individual
decisions in the practice study are presented in Table 5.
As with groups, there is very little variation in the in-
dividual decisions. The strike probabilities in Table 4
also applied to these individual decisions. On the surface
there appears to be slightly more variation in the individ-
ual decisions.
The experimental design for the practice study in-
cluded only one blocking variable, GIAL, and three trials,
years. No manipulation of the other independent variables
were present. The differences between high and low GIAL
decision amounts of both groups and individuals do not
appear large. These differences will be tested in a later
section.
Priraary Study
The experimental design in the primary study consisted
of three experimental factors previously discussed--length
of a strike, probability of a strike, and propensity to
take risk as measured by GIAL level. The three experi-
raental sections each had a different length of a potential
labor strike. Each section was segraented into two indus-
tries, one composed of low GIAL teams and the other com-
posed of high GIAL teams. GIAL was therefore a blocking
variable. Finally, each year represented a treatment

76
in
fQ <
W O Z H
w
Q H > H C/3 Q
>H Q
W CJ H EH U
04
H
W
o co
o H :2 EH H < H Cfl > ^: w o Q H
æ Q H Pí u
< w Q Q < EH EH H C/3 W
W Q :2 z w < m m §
W U
G O
•H -P U (U C/3
ro
O •H -P U (U co
O •H -P U (U cn
o •H
u (U cn
Í : hq
•H H K Ci)
5 o
< H Ci)
Æ i-í
•H H
• j . H
^<
o
Æ i-U CPí<
•H H o
l-q Q
Æ l-í
•H H
o
• o
o rsi 00 vo
• • O H in
o cr» 00 r^
• • o in
o ^ 00 a\
• • o in
r^ CN 00 ^
• • H \0 in
CN VO vo in
• • O H in
H o r» o
• • O H in
ro o \o o
• • (N CN in
ro a\ r^ ro
• • O H in
Sl c/)l
o in ro * *
• • O CN in
o r^ H in
m
O 00 o «o • •
H H in
o r-
in
ro r*-
in
O "^ in r-
in
ro o vo in
• • rsi H in
ro ^ H »JD
• • CS4
in
^ ' c n
CN
o <y» cTt r-
• • 00 H
o r^ H in
in
ro 00 ro vo
in
o o CN r«
in
r- CN r- in
• • o ro in
H H • •
CN CN in
O H o •«*
• • ro H in
r« cr> 00 cr>
• • H in
'C/3
ro
VJ (d (U ÎH
M (d (U ><
Ví (0 (U >H
77
factor with the probability of a labor strike increasing
linearly over the five years. Thus the basic design was a
5 x 3 x 2 factorial analysis of variance with a total of
30 treatments. The questions of this study are concerned
with the effects of these factors upon the difference in
fringe benefit decisions of groups and individuals.
The group cell raeans and standard deviations in the
primary study are presented in Table 6. Included are the
data from section four which served as a control group.
There is relatively little difference in the values for
the first year. This is not surprising since the initial
probability of a strike was .05 which was the same as the
initial level in the practice study. In addition, the
actual strike probabilities observed during the practice
decisions were seldom much higher than this level. In the
second year, there is a bit more variation especially in
Section 1 which had the shortest length of a potential
labor strike—one month. As the probability of a strike
increases in years three to five, there is more variation .
in the data.
The control group, Section 4, shows little change in
fringe benefit decisions for all five years. They did not
receive the strike probability treatment and the length of
a potential labor strike was two months—the normal para-
meter for the game. Examination of the standard deviations
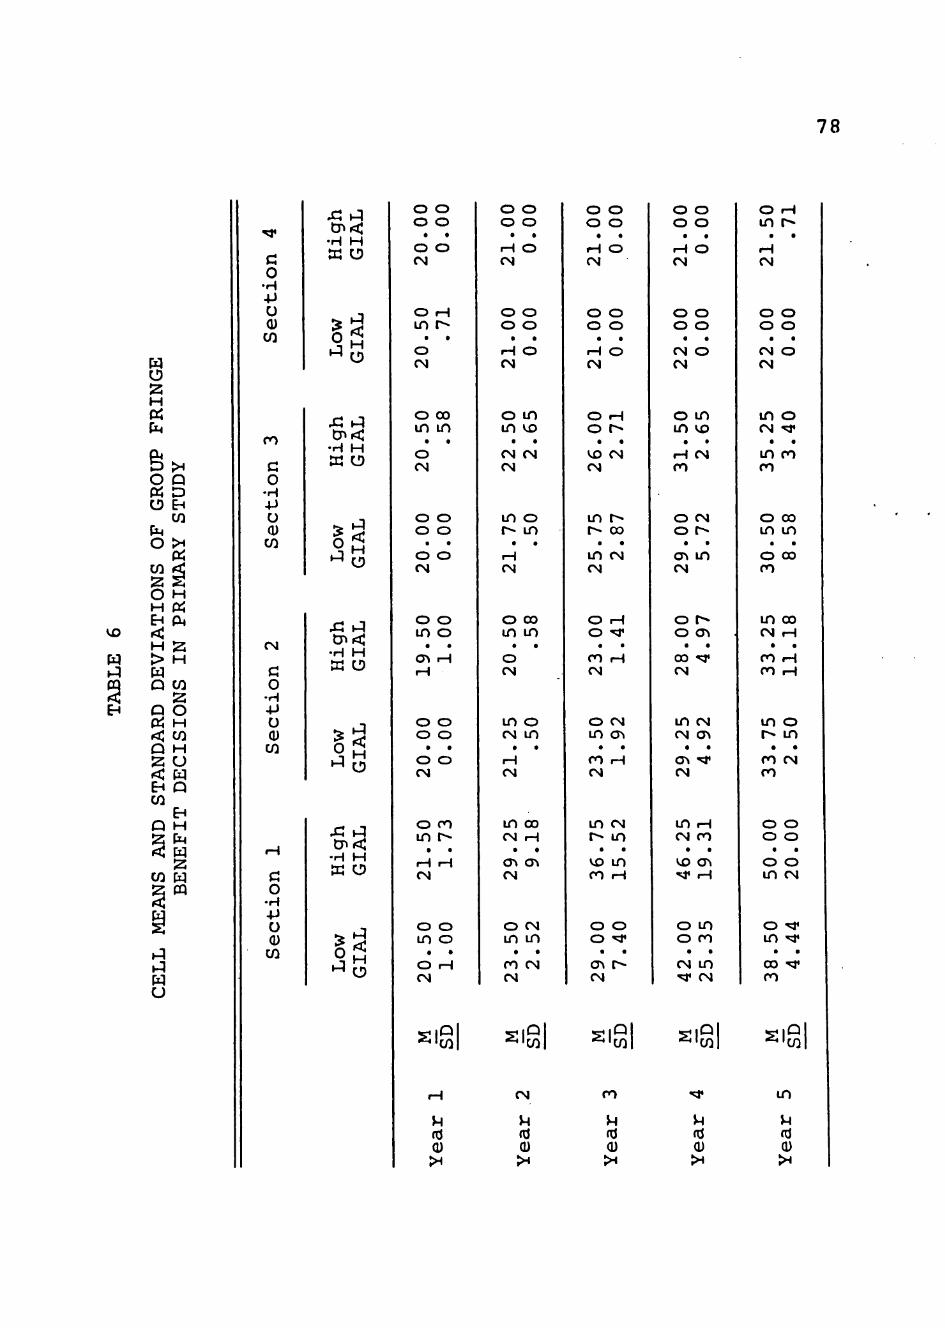
78
w o 2: H « w
g ÎH O Q « O
W
D EH co
o > C/) :2
«
â O H H PH t^ (lí
VO rtj H
W > i-:j W
2: H
m Q co
< z EH Q Pí
O H
< C/3 Q H 2 U < W E Q cn
Q
§ co
EH H W W 2 W CQ
»-1
W U
C O
•H -P U (U CO
ro
C O
•H -P O (U cn
CM
O •H -P U (U C/3
o •H -p u (U
c/i
•H H
w o
H
o
JC I-
•H H
w o
H
o
Æ l-q cn<
•H H w o
•> l-í
0 < H u
•H H K O
^ i^
O ' ^
o o o o
• • o o CN
O H in r-
• • o CN
O 00 i n i n
• • O CN
O O O O
• • o o rvj
o o in o
• • a\ H H
o o o o
• • o o 04
O ro in r*
• • H H CN
O O in o
• • O H CN
^ ' C / î |
O O o o
• • H O CN
O O O O
• • H O f>J
o in i n ^
• • CN CN CN
in o r^ in
• • H CN
O 00 i n i n
• • o CN
in o rsi i n
• • H Cvj
i n 00 CN H
• • <yv a\ CN
O CN i n i n
• • r o CNj rvj
^ ' c / l l
o o o o
• • H O CNJ
o o o o
• • H O rsj
O H o r-
• • VO CM CNJ
in r^ r - 00
• • i n CN CN
O H o r r
• • ro H CM
O CN in a\
• • ro H rsj
i n CN r* in
• • vo in ro H
o O o * *
• • a\ r> CM
sig|
O O o o
• • H O rsj
o o o o
• • rsj o CN
o in in «x)
• • H CN ro
O CN o r»
• • a\ in CN
o r^ o a\
• • 00 ^ fS
i n CM CM a\
• • C3 ^ rM
i n H CN ro
• • VO CTv ' * H
o in o ro
• • CN i n •^ rsi
Sl'^l ^ 'w l
O H in r-
• • H rg
o o o o
• • CM O CM
i n o rsj - ^
• • in ro ro
O 00 i n i n
• • O 00 ro
i n 00 CM H
• • ro H ro H
in o r* in
• • ro CN ro
o o o o
• • o o i n CN
o •^ i n * *
• • æ ^
1 ro
S l ° ^ ' c / ]
CN ro ' * in
u (CJ (U >^
M (d (U x
M (d (U ><
u (d (U H
u (d (U ÍH
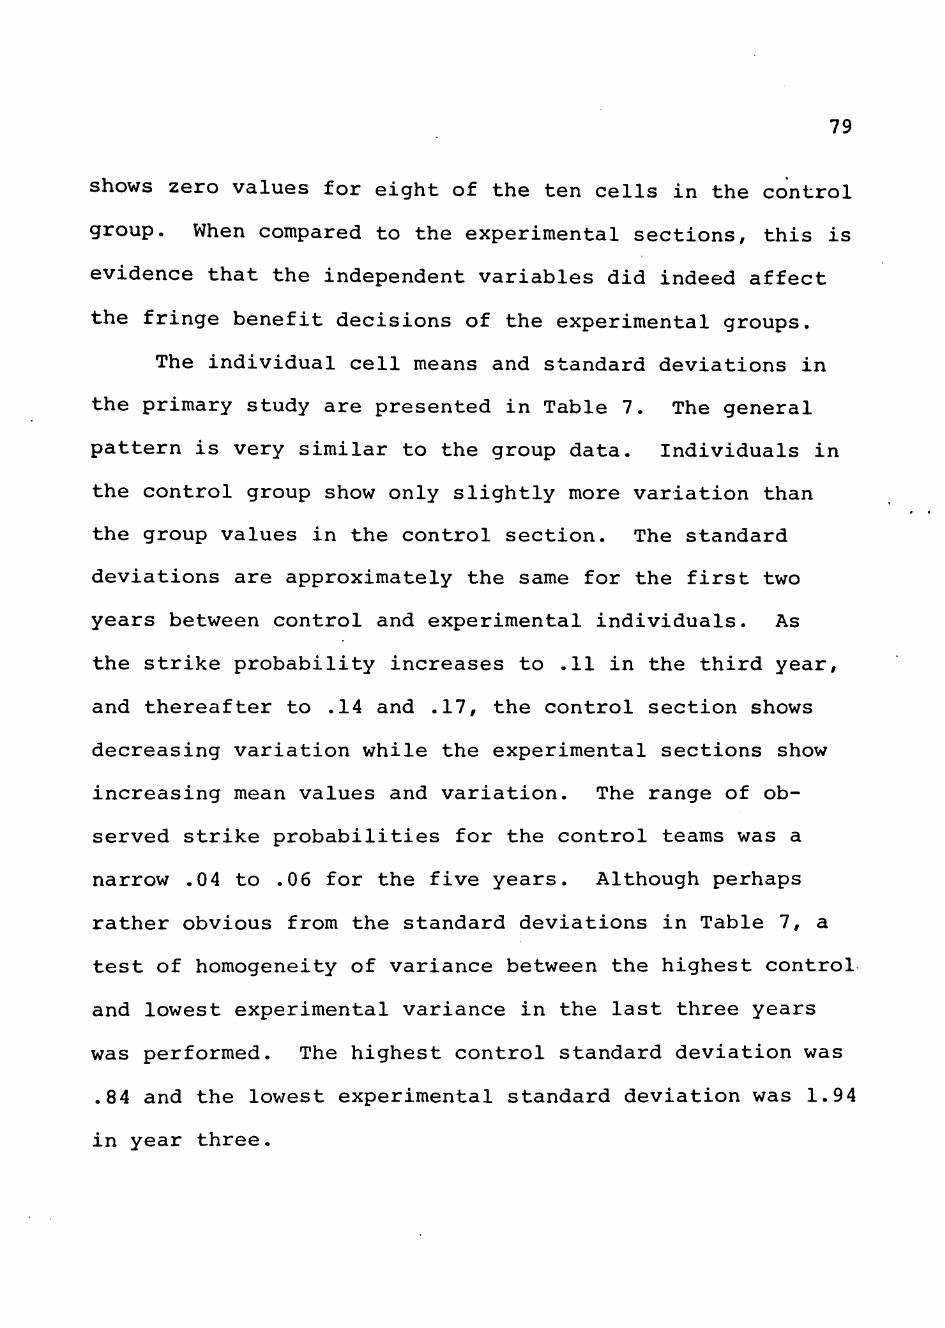
79
shows zero values for eight of the ten cells in the control
group. When compared to the experimental sections, this is
evidence that the independent variables did indeed affect
the fringe benefit decisions of the experimental groups.
The individual cell means and standard deviations in
the primary study are presented in Table 7. The general
pattern is very sirailar to the group data. Individuals in
the control group show only slightly raore variation than
the group values in the control section. The standard
deviations are approxiraately the sarae for the first two
years between control and experiraental individuals. As
the strike probability increases to .11 in the third year,
and thereafter to .14 and .17, the control section shows
decreasing variation while the experimental sections show
increasing mean values and variation. The range of ob-
served strike probabilities for the control tearas was a
narrow .04 to .06 for the five years. Although perhaps
rather obvious frora the standard deviations in Table 7, a
test of horaogeneity of variance between the highest control
and lowest experiraental variance in the last three years
was performed. The highest control standard deviation was
.84 and the lowest experimental standard deviation was 1.94
in year three.

80
w
w o H
w l-q < D Q H > H Q Z H
W Oí
Q D EH CO
cn
O H EH H > W Q
Q
EH
cn
Q
ã cn
H
cn 2:
o H cn H U w Q W W w CQ
i-q
W U
G O •H -P U (U cn
ro
C! O •H -P U (U cn
04
c o •H -P U (U cn
o •H -P U (U cn
Æ i-q
•H H
m o
> H
o^ T H o
CPS •H H
æ o
^ i ^
o< ^ o
Æ i-:i Cr>< •H H
a o
o- l^ O
x: i-í
•H H W O
• o
O 00 vo in • •
O H Csl
O 00
• • o CN
r a\ 00 a\ • •
o CN
ro in H ro • •
o CM
O CM O H • •
O CM CM
vo ro • •
O H CM
H CM 00 in • •
H H CM
o r-CM in • •
H H CM
o vo ro o
CM
'wl
CM
o o o o • •
H O CM
O 00 00 o
CM CN
O H CM in • •
CM CM CM
vo in '«í< H • •
H CM fM
vo r* 00 r** • •
O CM
ro o H in « •
in CN CN
Sl°l
CM
O •^ ^ 00
CM
o ro in in
CM
o o CM ^* • •
in CM CM
r« ro ^ 00 • •
VO 00 CM
in 'í' 00 ro • •
ro CM CM
r- "^ o a\ • • ro H CM
o vo in vo • •
in ro ro H
ro o r- H • •
CM H CM
r^ ^ 00 vo • •
in CM CM
Sl°l
ro
o r« H in • •
H CM
O 00
r^ r
CM
ro in cn CM • • o vo ro
ro CM a\ o • •
00 vo CM
'C/3
o o vo r-
CM
O CM
a\ ro
CN
r^ TT CM r« • •
in in ro
ro 00 in 00 • •
<J vo CN
H a\ ro cr> • •
00 in CM
r ^ o in • •
r^ in CM
vo r^ in rr . •
^* 00 'd' H
r^ 00 ^ ro • •
o in ro
r- * r» ^ • •
H a\ ro
ro 00 'cr ro • • o ^ ro
00 00 00 CM • • o a\ in H
O CN CM H • •
00 ro ro H
'C/3
in
V4 (d (U H
u (d (U H
V4 (d (U ÍH
} (d (U H
M (d (U ><

81
o^ = 1.94
^2 = -^4
F , = ^l^ = (1.94)2 ^ 3-7^4 obs
^2^ ( .84)^ .706
^obs = 5.331
The test F value exceeds 4.96, the F value at the .01 sig-
nificance level for 15 and 9 degrees of freedora, and
therefore the two variances are not equal. The infer-
ence here is that the two samples did not come from the
same population and that the independent variables did
affect the fringe benefit decisions of individuals in the
experimental sections, at least in the last three years.
Statistical Analysis of the Data
In this section the results of the experiment will be
analyzed. The first section will be devoted to an analysis
of the practice study. The second section will address the
research questions together with the specific hypotheses
in the priraary study.
Practice Study
The main purpose of the practice study was to serve as
a comparison of the primary study. In order to accomplish
this purpose, both the group and individual decisions were
analyzed.

82
Table 8 presents a 4 x 3 x 2 analysis of variance for
the group decisions. The analysis of variance shows no
significant differences between any of the factors nor is
there significant interaction. Therefore, none of the in-
dependent variables, singly or jointly, influenced the
fringe benefit decisions of groups.
TABLE 8
4x3x2 ANALYSIS OF VARIANCE FOR GROUP DECISIONS IN PRACTICE STUDY"
Source of Variation Sum of Mean
df Squares Square
Between Subjects Section GIAL Section X GIAL Error
Within Subjects Years Years x Section Years x GIAL Years x Section X GIAL Error
3 1 3
20
2 6 2 6
40
-'
70.24 39.67 55.24
649.58
39.65 197.67 66.35
135.17 1,335.16
23.41 39.67 18.41 32.48
19.82 32.94 33.17 22.53 33.38
.72 1.22 .57
.59
.99
.99
A 4 X 3 X 2 analysis of variance for individual prac-
tice decisions is presented in Table 9. The analysis re-
veals that there was a significant difference between the
four sections. Since the game parameters in the practice
study were the same for all four sections, this result is
not readily explained. Such a difference would randomly

83
occur less than one percent of the time. Examination of
the mean individual values in Table 5 reveals no obvious
source of this difference although Section 1 is typically
higher than the other three sections.
TABLE 9
4x3x2 ANALYSIS OF VARIANCE FOR INDIVIDUAL DECISIONS IN PRACTICE STUDY
Sum of Mean Source of Variation df Squares Square
Between Subjects Section GIAL Section X GIAL Error
Within Subjects Years Years x Section Years x GIAL Years x Section x GIAL Error
3 1 3
100
2 6 2 6
200
90.73 .12
44.49 702.03
7.26 13.74 3.56
26.32 666.78
30.24 .12
14.83 7.02
3.63 2.29 1.78 4.39
4.31* .02
2.11
1.09 .69 .53
1.32
*p< .007
Except as mentioned above, the results of the practice
study collectively show very little difference in either
group or individual decisions on fringe benefits.

84
Priraary Study
The order of analysis will be to first separately ana-
lyze the group and individual decisions. This will include
testing of those hypotheses which relate to either groups
or individuals. These results will then be utilized in a
joint fashion to answer those hypotheses specific to the
research questions of this investigation.
Group decisions. Table 10 presents a 5 x 3 x 2 analy-
sis of variance for the group decisions. There is a sig-
nificant difference between the three experimental sections
which had different lengths of potential labor strikes.
There is no significant difference between the decisions of
high and low GIAL teams nor is there significant interaction
between GIAL level and sections. There is a significant
difference over the years. Therefore, there is a signifi-
cant change in group decisions as the probability of a
strike increases. The interaction of years (probability
of a strike) and sections (length of a strike) is signifi-
cant at the .05 level. This indicates the joint effects of
these two variables on group fringe benefit decisions.
Therefore, groups would spend more on fringe benefits as
the probability of a strike increases and when the length
of a potential strike is longer. Examination of Table 6
clearly shows a strong trend over years of increasing means
in all sections. However, Section 3, which consistently

85
averaged higher raean fringe benefits, is the section which
had the lowest potential length of strike. It is possible
that the treatraent effect of the length of strike was not
differentially preceived across sections. That is, a
strike was "harmful" regardless of how long it would last.
TABLE 10
5x3x2 ANALYSIS OF VARIANCE FOR GROUP DECISIONS IN PRIMARY STUDY
Sum of Mean Source of Variation df Squares Square
Between Subjects Section GIAL Section X GIAL Error
Within Subjects Years Years x Section Years x GIAL Years x Section x GIAL Error
*p< .033 **p< .001
***p< .05
2 1 2
18
4 8 4 8
72
1,724.42 168.03 233.52
3,756.77
4,825.51 626.29 77.72 74.73
862.21 168.04 116.76 208.71
1,206.38 78.29 19.43 9.34
4.13* .81 156
31.87** 2.07*** .51 .25
The following statements forraally accept or reject
those hypotheses relevant to the group decisions in the
priraary study.

86
Ib. The hypothesis that there is no significant dif-
ference between the fringe benefit decisions of high pro-
pensity to take risk groups and low propensity to take
risk groups is accepted.
2b. The hypothesis that there is no significant dif-
ference between the probability of a labor strike, prior
outcoraes, and group decisions on fringe benefits is re-
jected. There was a very significant difference between
the probability of a strike in the prior year and the cur-
rent year's fringe benefits.
3b. The hypothesis that there is no significant dif-
ference between the length of a labor strike, significance
of outcoraes, and group decisions on fringe benefits is re-
jected. Although there was a statistically significant
difference, it was not in the predicted direction.
Individual decisions. Table 11 presents a 5 x 3 x 2
analysis of variance for the individual decisions. There
is a significant difference between all three independent
variables and the dependent variable. In addition, all the
interactions are significant. This is evidence that all
the treatraent combinations jointly influenced the level of
individual fringe benefit decisions.
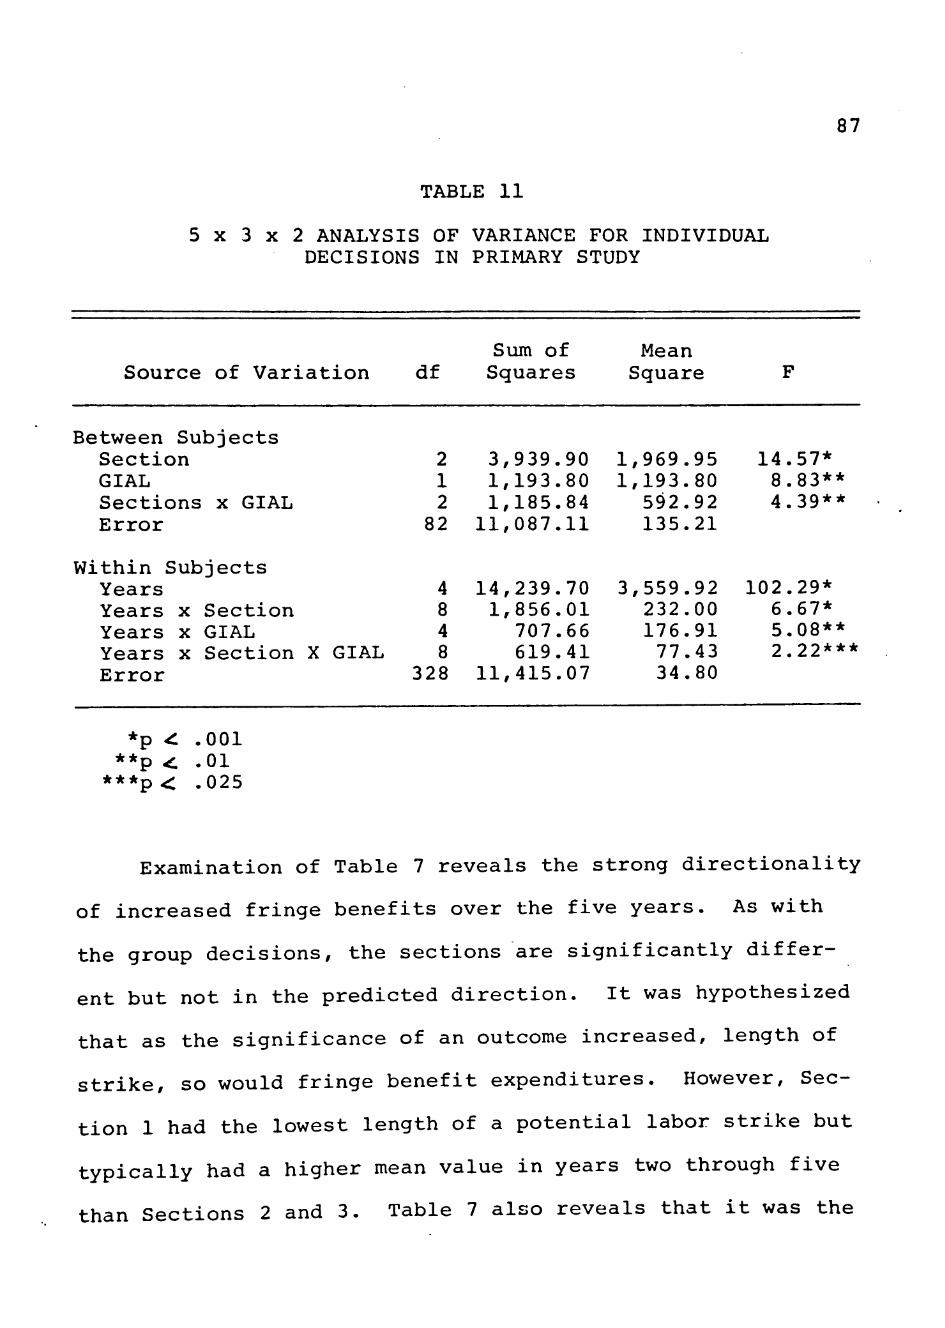
87
TABLE 11
5 x 3 x 2 ANALYSIS OF VARIANCE FOR INDIVIDUAL DECISIONS IN PRIMARY STUDY
Source of Variation Sum of
df Squares Mean Square
Between Subjects Section GIAL Sections x GIAL Error
Within Subjects Years Years x Section Years x GIAL Years x Section X GIAL Error
2 3,939.90 1,969.95 1 1,193.80 1,193.80 2 1,185.84 592.92
82 11,087.11 135.21
*p ^ .001 **p < .01 ***p< .025
14.57* 8.83** 4.39**
4 14,239.70 3,559.92 102.29* 8 1,856.01 232.00 6.67* 4 707.66 176.91 5.08** 8 619.41 77.43 2.22***
328 11,415.07 34.80
Exaraination of Table 7 reveals the strong directionality
of increased fringe benefits over the five years. As with
the group decisions, the sections are significantly differ-
ent but not in the predicted direction. It was hypothesized
that as the significance of an outcome increased, length of
strike, so would fringe benefit expenditures. However, Sec-
tion 1 had the lowest length of a potential labor strike but
typically had a higher mean value in years two through five
than Sections 2 and 3. Table 7 also reveals that it was the

88
high propensity to take risk, GIAL, individuals who typi-
cally spent more on fringe benefits. Following the analy-
sis of variance, a series of year-by-year comparisons,
including the practice years, was made between the decisions
of âll high GIAL and all low GIAL individuals. Table 12
presents the means, standard deviations, and T-statistics
for the eight T-tests which were performed. The T-values
are significant for years two through five. They were not
significant for the three practice years and year one of
the priraary study. With real stakes involved in the pri-
mary study, high propensity to take risk individuals. spent
more on fringe benefits than did low propensity to take
risk individuals as the probability of a labor strike in-
creased.
The following statements formally accept or reject
those hypothesis relevant to individual decisions in the
primary study.
la. The hypothesis that there is no significant dif-
ference between the fringe benefit decisions of high pro-
pensity to take risk individuals and low propensity to take
risk individuals is rejected. On a yearly basis the hypo-
thesis is accepted for year one but not years two through
f ive.
2a. The hypothesis that there is no significant dif-
ference between the probability of a labor strike, prior

89
TABLE 12
DIFFERENCE BETWEEN FRINGE BENEFIT DECISIONS OF HIGH AND LOW GIAL INDIVIDUALS BY YEAR
Year GIAL Sample Size Mean
Standard Deviation Statistic
Signif i-cance Level
Practice
1
2
3
Primary
1
2
3
4
5
Low
High
Low
High
Low
High
Low
High
Low
High
Low
High
Low
High
Low
High
44
44
44
44
44
44
44
44
44
44
44
44
44
44
44
44
51.11
51.41
51.57
51.91
51.73
51.77
20.66
20.96
21.96
22.91
25.18
28.55
28.87
35.11
32.77
39.91
3.83
1.80
1.52
1.70
1.68
2.45
1.26
1.71
1.80
2.79
5.57
9.85
5.70
13.97
9.64
15.42
.46
.99
.10
.92
1.91
1.97
2.75
2.60
.644
.323
.919
.359
.060
.052
.007
.011

90
outcomes, and individual decisions on fringe benefits is
rejected.
3a. The hypothesis that there is no significant dif-
ference between the length of a labor strike, significance
of outcomes, and individual decisions on fringe benefit is
rejected. As with groups, there was a statistically sig-
nificant difference although it was not in the predicted
direction.
Coraparison of Groups and Individual Decisions
This section examines the relationship between group
and individual decisions in attempting to answer the pri-
mary research questions of this study. The analysis re-
quires a comparison of the group means and individual
means from Tables 6 and 7.
Since the mean values cannot be considered indepen-
dent, they are in fact related saraples, a non-pararaetric
test of the differences was utilized. The non-pararaetric
statistical test chosen was the Wilcoxon matched-pairs
signed-ranks test (Siegel, 1956). This test not only con-
siders the direction of differences but also the relative
magnitude of those differences.
Table 13 presents the Wilcoxon T-values for the dif-
ference between group and individual mean values for both
the practice arid primary studies. In the practice study

91
there was no significant difference between group and in-
dividual fringe benefit decisions. Groups spent neither
more nor less than individuals. In the primary study,
groups did spend a significantly different amount on fringe
benefits. The raean tendency was for groups to spend raore
on fringe benefits.
TABLE 13
WILCOXON SIGNED RANKS TEST BETWEEN GROUP AND INDIVIDUAL MEAN FRINGE BENEFIT DECISIONS
Practice Primary Study Study
N 24 30
N of Non-zero Differences 23 30
Smaller Sum of Like-signed Ranks (T) 126.0 146.0
Significance Level of T* .3576 .0376
*One-tailed test
Table 14 presents Wilcoxon T-values for each year in
the primary study. In these tests each individual decision
was paired with that meraber's group decision. For all
years, there is a significant difference between group and
individual fringe benefit decisions. Equally iraportant is
the question of who spent raore, groups or individuals? In

92
year one, groups spent less than did their individual mem-
bers. In years two through five, groups spent more than did
their individual members.
TABLE 14
WILCOXON SIGNED RANKS TEST BETWEEN GROUP AND INDIVIDUAL FRINGE BENEFIT DECISIONS
IN PRIMARY STUDY BY YEAR
Year 1 Year 2 Year 3 Year 4 Year 5
N 88 88 88 88 88
N of Non-Zero Differences 31 55 54 62 57
Smaller Sum of Like-signed Ranks (T) 76.0 5 2 6 . 5 4 3 5 . 5 4 9 5 . 0 4 7 4 . 0
Significance Level of T* .004 .0207 .0041 .0004 .0025
*One-tailed test
Table 15 presents V7ilcoxon T-values for differences
between groups and individuals according to GIAL classifi-
cation. There is no significant difference between the
decision of high GIAL groups and high GIAL individuals.
The comparison of low GIAL groups and low GIAL individuals
is significantly different at the .056 level, with low GIAL
groups spending more.
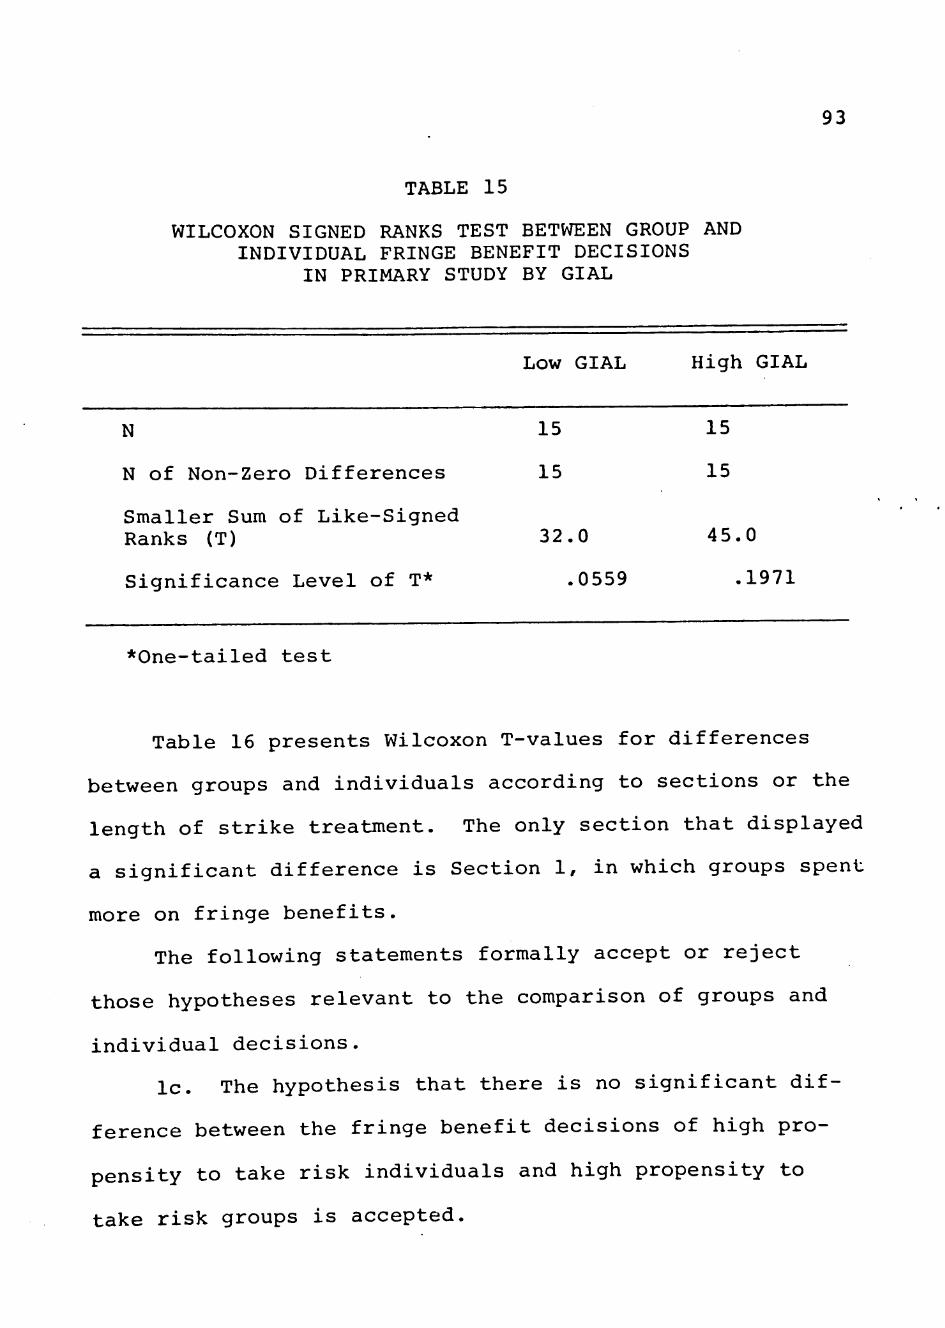
93
TABLE 15
WILCOXON SIGNED RANKS TEST BETWEEN GROUP AND INDIVIDUAL FRINGE BENEFIT DECISIONS
IN PRIMARY STUDY BY GIAL
Low GIAL High GIAL
N 15 15
N of Non-Zero Differences 15 15
Smaller Sum of Like-Signed Ranks (T) 32.0 45.0
Significance Level of T* .0559 .1971
*One-tailed test
Table 16 presents Wilcoxon T-values for differences
between groups and individuals according to sections or the
length of strike treatment. The only section that displayed
a significant difference is Section 1, in which groups spent
more on fringe benefits.
The following statements formally accept or reject
those hypotheses relevant to the comparison of groups and
individual decisions.
lc. The hypothesis that there is no significant dif-
ference between the fringe benefit decisions of high pro-
pensity to take risk individuals and high propensity to
take risk groups is accepted.

94
TABLE 16
WILCOXON SIGNED RANKS TEST BETWEEN GROUP AND INDIVIDUAL FRINGE BENEFIT DECISIONS
IN PRIMARY STUDY BY SECTION
Section Section Section 1 2 3
N 10 10 10
N of Non-Zero Differences 10 10 10
Smaller Sum of Like-Signed Ranks (T) 10.0 23.0 21.0
Significance Level of T* .0372 .3232 .2538
*One-tailed test
Id. The hypothesis that there is no significant dif-
ference between the fringe benefit decisions of low pro-
pensity to take risk individuals and low propensity to take
risk groups is marginally accepted at slightly over the .05
level of significance.
2c. The hypothesis that there is no significant dif-
ference between individual and group fringe benefit deci-
sions as the probability of a labor strike increases, prior
outcomes, is rejected.
3c. The hypothesis that there is no significant dif-
ference between individual and group fringe benefit deci-
sions as the length of a potential labor strike increases

95
is accepted. There was a significant difference in only
one section—Section 1.
Correlation Analysis
This section analyzes the association, as measured by
simple and partial correlation, between the dependent vari-
able and the independent variables. The primary purpose is
to test the effect of performance, which was measured ex
post, upon the dependent variable for both groups and in-
dividuals. A secondary purpose is to examine the relative
strength of the independent variables thus providing raore
inforraation than was obtained via analysis of variance.
Table 17 presents the simple and partial correlation
coefficients between the dependent variable, fringe bene-
fits, and the four independent variables. For groups, the
partial correlation coefficient of performance, holding the
other three independent variables constant, shows some
association with fringe benefits but it is not signifi-
cantly different from zero. The partial correlation coef-
ficient for years, probability of strike, shows a high
degree of association which is statistically significant.
The partial correlation coefficient for sections shows no
significant association with fringe benefits.
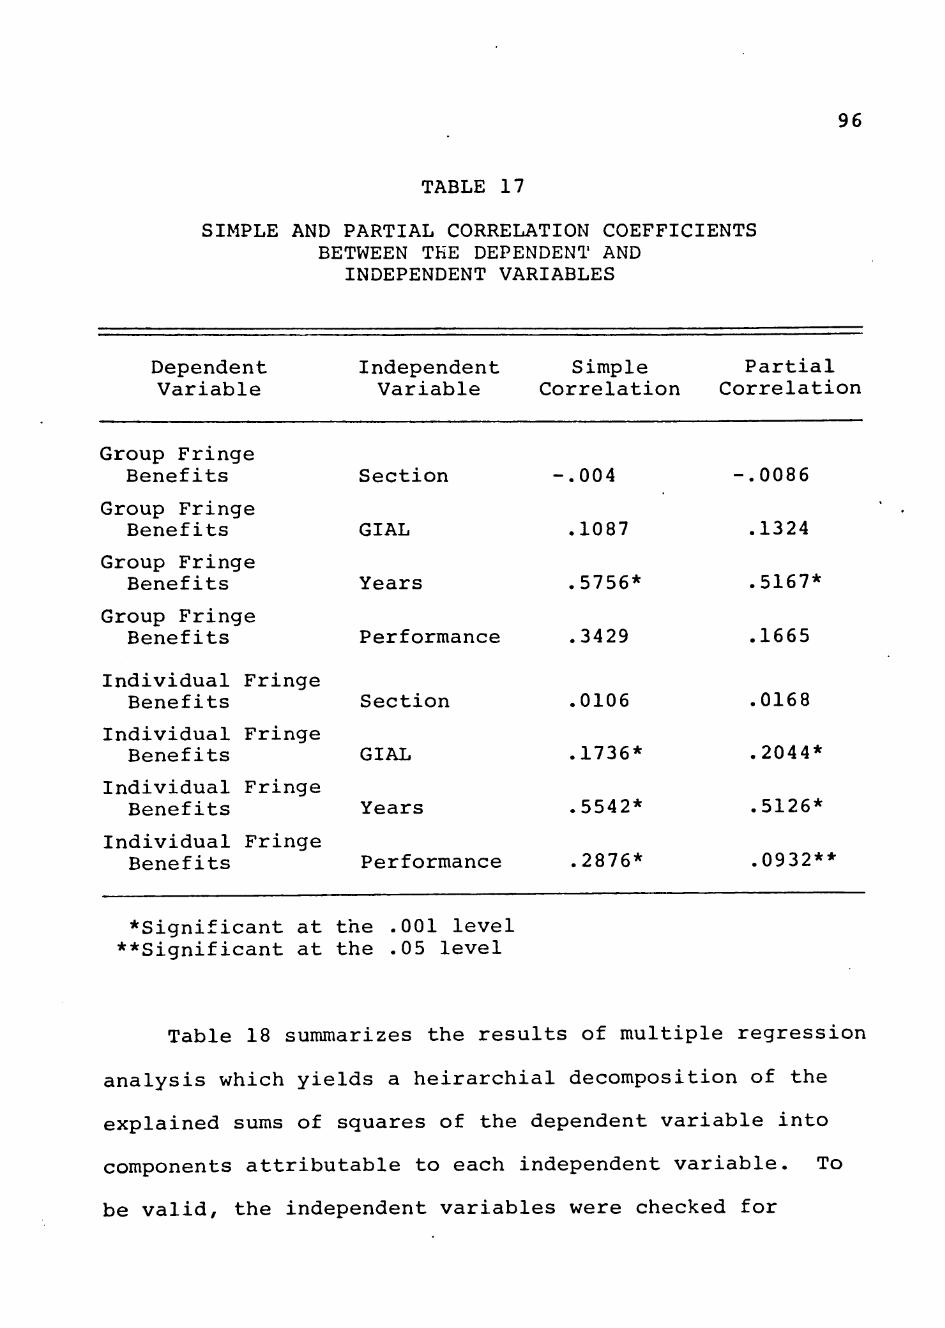
96
TABLE 17
SIMPLE AND PARTIAL CORRELATION COEFFICIENTS BETWEEN THE DEPENDENT AND INDEPENDENT VARIABLES
Dependent Variable
Independent Simple Partial Variable Correlation Correlation
Group Fringe Benefits
Group Fringe Benefits
Group Fringe Benefits
Group Fringe Benefits
Individual Fringe Benefits
Individual Fringe Benefits
Individual Fringe Benefits
Individual Fringe Benefits
Section
GIAL
Years
Performance
Section
GIAL
Years
Perforraance
-.004
.1087
.5756*
.3429
.0106
.1736*
.5542*
.2876*
-.0086
.1324
.5167*
.1665
.0168
.2044*
.5126*
.0932**
*Significant at the .001 level **Significant at the .05 level
Table 18 suramarizes the results of multiple regression
analysis which yields a heirarchial decomposition of the
explained sums of squares of the dependent variable into
components attributable to each independent variable. To
be valid, the independent variables were checked for

97
multicollinearity and none were found to be extremely inter-
correlated ( > .8). The results show that the independent
variable years, probability of a strike, explains the vast
2 majority of the explained variance, change in R , of group fringe benefit decisions.
TABLE 18
SUÍ4MARY TABLE OF MULTIPLE PÆGRESSION OF GROUP FRINGE BENEFITS AND
INDEPENDENT VARIABLES
Independent Variable Multiple R R Change
Year
Performance
Section
GIAL
.57556
.59148
.59152
.60108
.33127
.34985
.34989
.36130
.33127
.01858
.00005
.01140
The hypothesis 4b, that there is no significant associ-
ation between performance and group fringe benefit decisions,
is accepted. There is some degree of association, but not
significantly different from zero at the .05 level.
The individual partial correlation coefficients shown
in Table 17 are signficant for performance, years, and GIAL.
The partial for sections is not significant. Table 19

98
summarizes the multiple regression analysis which shows
that years and GIAL account for almost all of the explained
variation in individaul fringe benefit decisions. As with
groups, there was no extreme ( > .8) intercorrelations be-
tween the independent variables. The hypothesis 4a, that
there is no significant association between performance and
individual fringe benefit decisions, is rejected. While
this association is not high, it is significantly different
from zero at the .05 level.
TABLE 19
SUMMARY TABLE OF MULTIPLE REGRESSION OF INDIVIDUAL FRINGE BENEPITS AND
INDEPENDENT VARIABLES
Independent Variable
Year
Perforraance
Section
GIAL
Multiple R
.55415
.56049
.56073
.58571
R2
.30808
.31415
.31441
.34306
2 R Change
.30708
.00707
.00026
.02864
Team Performance and GIAL
The final analysis deals with the relationship between
perforraance in the IMAGINIT MANAGEMENT GAME and propensity

99
to take risk. Table 20 presents the raean raarket quotes,
performance, for all 28 teams which played the automobile
version for a nine-year period, There were 14 teams com-
posed of low GIAL members and 14 tearas composed of high
GIAL members.
TABLE 20
MEAN PERFORMANCE OF GROUPS CLASSIFIED BY GIAL
Low GIAL High GIAL
103
91
99
111
106
97
88
74
95
74
81
34
78
92
102
44
94
110
95
75
57
81
80
82
103
71
82
89
X = 87.36 X = 83.21

100
The coraputed F ratio of .349 shown in Table 21 is be-
low one. Therefore, there is no significant difference in
the perforraance of high and low GIAL tearas. As a result,
hypothesis 5, which stated that there is no significant
difference in the perforraance of high propensity to take
risk groups and low propensity to take risk groups, is
accepted.
TABLE 21
ANALYSIS OF VARIANCE: HIGH AND LOW GIAL TEAM PERFORMANCE
GIAL
Error
Total
Degrees of Freedora
1
26
27
Sums of Squares
121.07
9,016.60
9,137.67
Mean Square
121.07
346.79
.349
The data have been presented and analyzed in Chapter
IV. A sumraary of the study, conclusions, and recommenda-
tions appear in Chapter V.

CHAPTER V
SUMMARY, CONCLUSIONS, AND RECOMMENDATIONS
Summary of the Study
The principal problem of this research was to deter-
mine what relationships exist between individual and group
risk taking in a simulated raanagement game. It was ex-
pected that the research would answer these basic questions:
(1) Do groups make more risky decisions than individuals in
a simulated management game? (2) Does the propensity to
take risk, prior outcomes, performance, and consequences
of a decision affect whether groups make more risky deci-
sions than individuals in a simulated raanagement game?
(3) Do differences in propensity to take risk affect group
performance in a simulated management game?
It is anticipated that the conclusions of this study
might make a significant contribution to research in the
degree of risk taking of group decisions as contrasted with
individual decisions. The erapirical base of prior risky
shift research was described in Chapter II as being ex-
tremely limited in the methodologies utilized and the sub-
ject of extensive criticism. However, it is important for
both manageraent and raanageraent educators to know under what
kind of conditions groups make more risky or conservative
101

102
decisions than individuals. This study was not expected
to provide universalistic answers to such a complex ques-
tion. This investigation was based upon the preraise that
a systemic orientation was necessary, recognizing that not
all variables could be simultaneously exarained. Accord-
ingly, this study atterapted to exaraine those variables
which prior research has frequently postulated to affect
the degree of risk taking. The study is the first known
attempt to explicitly test the risky shift in a simulated
managerial environment.
During the spring semester, 1976, a total of 1,088
group and individual decisions were obtained from students
enrolled in the Administrative Policy course (BA 4380) at
Texas Tech University. These decisions were a result of
a siraulated manageraent garae, IMAGINIT MANAGEMENT GAME
(Barton, 1973), which was played by the students over the
entire seraester. The dependent variable, fringe benefit
araounts, was collected from the overall decision sheet for
each siraulated period. Additionally, raeasures of propensity
to take risk, perforraance, prior outcomes, and significance
of outcomes were obtained.
The analysis of the data included computing analysis
of variance, parametric and non-parametric tests of signifi-
cance, simple and partial correlation, and multiple corre-
lation and regression analysis.

103
Conclusions of the Study
The analysis presented in Chapter IV was the basis for
the following conclusions.
1. The practice study, which perhaps approximated
conditions of ignorance with no real stakes involved, re-
vealed no difference between group and individual decisions.
That is, the group concensus decisions were neither more
risky nor conservative than the individual decisions. There-
fore, a group shift in either direction did not occur dur-
ing any of the three practice years.
2. The primary study, which closely approximated
decision making under uncertainty, revealed a significant
difference between group and individual decisions for all
five years. For the first year, groups spent less on
fringe benefits, hence the group decisions were more risky.
However, when the probability of a strike increased, groups
consistently spent more than individuals. Therefore, for
the last four years groups made more conservative deci-
sions. The last four years represented increasing proba-
bilities of a labor strike which accounted for the majority
of explained variation in both group and individual deci-
sions. Therefore, prior outcomes, probability of a strike,
was significantly related to directional differences be-
tween group and individual decisions.
104
3. The consequences of a decision, as measured by the
length of a labor strike, did not influence either group or
individual decisions in the predicted direction. The de-
cisions in the section with the longest potential labor
strike were not significantly different from the other two
sections. The length of a strike did not generally influ-
ence whether groups raade raore risky or conservative deci-
sions than individuals.
4. Propensity to take risk, as raeasured by GIAL
level, did affect the fringe benefit decisions of individ-
uals in the primary study. High propensity to take risk
individuals spent significantly more on fringe benefits
than low propensity to take risk individuals. GIAL level
did not affect the group decisions nor did it affect whether
groups raade more risky or conservative decisions.
5. The performance of a team was significantly asso-
ciated with individual decisions but not with group deci-
sions. While this association was significantly different
from zero, performance accounted for less than 3 percent
of the explained variance of individual decisions.
6. Teams composed of high propensity to take risk
members, as measured by GIAL level, did not perforra signif-
icantly better than tearas coraposed of low propensity to
take risk raerabers. This conclusion is liraited by the fact

105
that high and low GIAL tearas did not corapete against each
other.
Interpretation of the Findings
Prior to making recomraendations, it is pertinent to
interpret the findings of this investigation. These find-
ings apply only to the population studied and no atterapt is
made to apply them to other contexts or populations.
The study resulted in the observance of all three
possible outcoraes with respect to group decisions. During
the practice study, group shifts were not observed. In the
priraary study, with real stakes involved, groups raade more
risky decisions in the first year. As the probability of
a labor strike increased in the last four years, groups
made more conservative decisions than individuals.
The only variable associated with the differences in
the primary study was the prior outcomes of fringe benefit
decisions as measured by the probability of a labor strike.
As the probability of an undesirable outcome in the form of
a labor strike increased, groups made raore conservative
decisions in the simulated manageraent garae. The length of
a potential labor strike was not associated with group
shifts. One might expect differences as the negative con-
sequences of a labor strike are increased but this was not
observed. Students may have perceived a labor strike to be
106
equally bad, regardless of how long it lasted. Differences
in performance were not found to be associated with group
decisions but were associated with individual decisions
although to a very small degree. This may have been due
to the fact that during the first five years of the primary
study, there was not a great deal of variation in team per-
formance in most industries. This was unusual in that con-
siderable variation typically occurs early in a simulated
play. Variation in performance did increase in later simu-
lated periods, during years six through nine.
An interesting finding is the fact that high propen-
sity to take risk individuals typically spent more on fringe
benefits, a more conservative decision, than low propensity
to take risk individuals in the last four years of the pri-
mary study. It was expected that the opposite would have
occurred, i.e. high propensity to take risk individuals
would be willing to spend less on fringe benefits. There
are two possible explanations for this finding. First, it
is possible that high GIAL individuals perceived the situa-
tion to be more incongruent than low GIAL individuals. The
second explanation is adapted from Hunsaker (1975):
High GIAL individuals also appear to react more rationally in response to variations in en-vironment incongruity by compensating for these changes via more or less risky decision strate-gies. (p. 182)
107
There was a significant difference in the decisions
of high and low GIAL individuals but not high and low GIAL
groups. Quite possibly a convergence effect occurred dur-
ing the group discussions to bring high and low GIAL groups
closer in their decision amounts.
Finally, the fact that performance did not have a
large influence upon group or individual decisions might
be due to the experimental design. The design prevented
interactive competition between high and low GIAL tearas.
Iraplications
The findings of this study suggest that the observance
of group shifts toward risk raay be a function of several
factors. It is possible that a risky shift is more likely
to occur when the decision stakes are nominal or insignifi-
cant as was the case with the numerous studies utilizing
the Choice Dilemraa Questionnaire.
Second, it is possible that a risky shift is a func-
tion of the risk construct utilized. The present study
utilized a risk construct best described as decision raaking
under uncertainty. Where identifiable, prior research has
utilized risk constructs best described as decision raaking
under ignorance in the case of the Choice Dilemma Question-
naire research or decision making under risk in the case of
gambling research.

108
Third, it is possible that the complexity of decision
or the degree of incongruency might affect the level of
perceived risk. The current study utilized a multivariate,
raultidimensional environment rather high in environmental
incongruency. This perhaps accounts for the finding that
the individuals with high incongruity adaption levels,
GIAL, made more conservative decisions when real stakes
were present.
An additional implication of the current study is that
the decisions were repetitive in nature although in a dif-
ferent context each year. It is possible that the experi-
ences of prior decisions may be a significant factor which
may become more clearly identified during group discus-
sions. This raises the question concerning the relation-
ships which might be observed when decisions are being made
for the first time by individuals and groups. In the pre-
sent study, groups made a more risky decision in the first
year but then more conservative decisions in the four re-
maining years of the primary study.
Limitations of the Current Study
The principal limitation of this investigation is that
the population of the study was liraited to students enrolled
at Texas Tech University. The findings apply only to that
population and not necessarily to other subject populations.

109
A second liraitation is that the results apply to the
IMAGINIT MANAGEMENT GAME and may not be replicated in other
simulation games.
Another limitation is that it was not possible to
certify that the individual decisions were raade prior to
group raeetings. Individuals were required to submit their
decisions two days prior to the group decision, but it is
possible that some individuals were influenced by group
meetings held prior to the individual decision deadline.
However, on the average, this may not have been a serious
factor since significant differences were found between the
group and individual decisions.
A fourth limitation is that the experimental design
prevented an interactive comparison between the performance
levels of high propensity to take risk and low propensity to
take risk groups.
Recomraendations
1. The findings of this study are quite possibly idio-
syncratic to the population studied. The raean GIAL was
lower than the national average. Replications of this
study using students frora different regions of the country
raay provide different results. Other studies utilizing
different siraulation garaes and/or practicing raanagers
should be undertaken.

110
2. Further studies should attempt to utilize addi-
tional dependent variables as a measure of risk taking.
In addition, variables not studied in the current research
should be exarained for possible association with group
shifts toward risk.
3. Future studies should utilize an interactive
format between high and low GIAL propensity to take risk
groups.
4. Additional measures of the consequences of a de-
cision should be developed and operationalized in future
research.
5. Further research may benefit frora exaraining dif-
ferent decision raaking environraents including perhaps
action research within various organizations.
This study has not proved that groups will necessarily
make more conservative decisions as the degree of risk or
uncertainty increases. The findings of this study suggest
this to be the case within the context of a specific simu-
lated management game. The findings raay or may not be dup-
licated in other decision-making environments. Finally,
the results of this study deraonstrate the need for further
examination of the conditions in which group shifts might
be observed. Hopefully, a body of empirical facts will
evolve with sufficient depth and breadth for theoretical
formulation. Then and only then can normative statements
be made concerning the risk-taking behavior of groups.

LIST OF REFERENCES
Babb, E. M., and Eisgruber, L. M. Management Garaes for Teaching and Research. Chicago: Educational Methods, I n c , 1966.
Baron, P. H., Baron, R. S., and Roper, G. External valid-ity and the risky shift: erapirical limits and theo-retical implications. Journal of Personality and Social Psychology and Suppleraent, 1974, 1, 95-103.
Barton, R. F. A generalized responsiveness (elasticity) function for siraulations. Behavioral Science, 1967, 4, 337-343. '•
Barton, R. F. The Iraaginit Manageraent Garae. Lubbock: Active Learning, 1973.
Bateson, N. Familiarization, group discussion, and risk taking. Journal of Experimental Social Psychology, 1966, 2, 119-129.
Bell, P. R., and Jamieson, B. D. Publicity of initial de-cisions and the risky shift phenomenon. Journal of Experimental Social Psychology, 1970, 6, 334-345.
Belovicz, M. W., and Finch, F. E. A critical analysis of the "risky shift" phenomenon. Organizational Behavior and Human Perforraance, 1971, 6, 151-168.
Bennett, C , Lindskol, S., Bennett, R. Effects of group on size and discussion time on risky shift. Journal of Social Psychology, 1973, 1, 137-147.
Blascovich, J. Group factors on risk taking: a conceptual analysis and experimental manipulation. Unpublished doctoral dissertation, University of Nevada, Reno, 1972. (a)
Blascovich, J. Sequence effects on choice shifts involving risk. Journal of Experimental Social Psychology, 1972, 8, 260-265. (b)
Blascovich, J., Ginsburg, G., and Howe, R. Blackjack and the risky shift, II: monetary stakes. Journal of Ex-periraental Social Psychology, 1975, 3, 224-232.
111

112
Brown, R. Social Psychology. New York: Free Press of Glencoe, 1965.
Burnstein, E. An analysis of group decisions involving risk ("the risky shift"). Huraan Relations, 1969, 22, 381-395.
Cartwright, D. Risk taking by individuals and groups: an assessraent of research eraploying choice dileramas. Journal of Personality and Social Psychology, 1971, 3, 361-378.
Cartwright, D. Determinants of scientific progress—the case of research on the risky shift. American Psy-chologist, 1973, 3, 222-231.
Cecil, E. A. The effect of group composition on the level of risk in group decisions. Unpublished doctoral dissertation, Indiana University, Graduate School of Business, 1967.
Clark, R. D., III and Willems, E. P. Where is the risky shift? Dependence on instructions. Journal of Per-sonality and Social Psychology, 1969, 13, 215-221.
Clark, R. D., III. Group-induced shift toward risk. A criticai appraisal. Psychological Bulletin, 1971, 76, 251-270.
Collins, B. E. and Guetzkow, H. A. A Social Psychology of Group Processes for Decisions Making. New York: Wiley, 1964.
Conrath, D. W. Organizational decision raaking behavior under varying conditions of uncertainty. Manageraent Science, 1967, 8, B-487-B-499.
Coplin, W. D. Approaches to the social sciences through raan-coraputer siraulations. Siraulation and Games, 1970, 12, 396-408.
Couger, J. D. (Ed.). Computing Newsletter. College of Business Adrainistration, University of Colorado, Colorado Springs, 1976, 9, p. 5.
Deets, M. K. and Hoyt, G. C. Variance preferences and variance shifts in group investment decisions. Or-qanizational Behavior and Human Perforraance, 1970, 5, 378-386.

113
Dion, K. L., Baron, R. S., and Miller, N. Why do groups make riskier decisions than individuals? In L. Berko-witz (Ed.), Advances in Experimental Social Psychology Vol. 5. New York: Academic Press, 1970.
Driver, M. J., and Streufert, S. The "General Incongruity Adaptation Level, (GIAL) Hypothesis" An Analysis and Integration of Cognitive Approaches to Motivation, Paper 114, Purdue University Institute for Research in the Behavioral, Economic and Management Sciences, West Lafayette, Indiana, 1965.
Driver, M. J., And Streufert, S. Purdue-Rutgers Prior Ex-perience Inventory II (GIAL SELF DESCRIPTION TEST). Unpublished manuscript, Purdue University Library, 1967.
Duncan, W. J. Essentials of Manageraent. Hinsdale: The Dryden Press, 1975.
Ewing, S. Selected effects of creativity and risk taking on business garae behavior: an experimental investi-gation. Unpublished doctoral dissertation, Texas Tech University, 1973.
Fiedler, F. E. Style or circumstance: the leadership enigma. Psychology Today, 1969, 3, 38-43.
Gibson, J. L., Ivancevich, J. M., and Donnelly, J. H. Organizations: Structure, Processes, Behavior. Dallas: Business Publications, Inc, 1973.
Hampton, D. R., Sumraer, C. E., and Webber, R. A. Organi-zational Behavior and the Practice of Manageraent. Glenview: Scott, Foresraan, and Co., 1973.
Hunger, J. D. and Wheelen, T. L. The relationship between group dynaraics and teara performance in business sirau-lation garaes. Proceedings, Acaderay of Manageraent, 1975, August, 43-45.
Hunsaker, P. L. Sorae cognitive and environmental deter-minants of risk-taking behavior in individual and group-decision making. Unpublished D.B.A. disserta-tion, University of Southern California, 1971.
Hunsaker, P. L. Incongruity adaption capability and ac-complishraent in leadership for turbulent environments. Academy of Manageraent Proceedings, 33rd Annual Meet-ing, 1973, August, 225-229.
114
Hunsaker, P. L. Incongruity adaption capability and risk preference in turbulent decision-raaking environments. Organizational Behavior and Human Perforraance, 1975, 2, 173-185. ~~
Johnson, D. L., and Andrews, I. R. Risky-shift phenomenon tested with consumer products as stirauli. Journal of Personality and Social Psychology, 1971, 3, 361-378.
Kast, F. E., and Rosensweig, J. E. Organization and Man-ageraent: A Systeras Approach. New York: McGraw-Hill Book Co., 1974.
Kennedy, J. L. The system approach: a preliminary explan-atory study of the relation between teara composition and financial performance in business games. Journal of Applied Psychology, 1971, 1, 46-49.
Kogan, N., and Wallach, M. A. Risk-taking: A Study in Cognition and Personality. New York: Holt, Rinehart & Winston, 1964.
Kogan, N., and Wallach, M. A. Risk taking as a function of the situation, the person, and the group. New Directions in Psychology. Vol. III. New York: Holt, Rinehart & Winston, 1967.
Lamm, H. Will an isolated individual advise higher risk taking after hearing a discussion of the decision pro-blem? Journal of Personality and Social Psychology, 1967, 6, 467-471.
LeBon, G. The Crowd. New York: Viking, 1960.
Levinger, G., and Schneider, D. J. A test of the risk is a value hypothesis. Journal of Personality and Social Psychology, 1969, II, 165-69.
Lewin, A. Y., and Weber, W. L. Management game teams in education and organization research: an experiment on risk taking. Academy of Management Journal, 1969, 3, 49-58.
Mackenzie, K. D. The effects of status upon group risk taking. Organizational Behavior and Human Perform-ance, 1970, 5, 517-541.
Mackenzie, K. D. An analysis of risky shift experiments. Organizational Behavior and Human Performance, 1971, 6, 283-3'03.
115
Marquis, D. G. Individual responsibility and group deci-sions involving risk. Industrial Management Review, 1962, 3, 8-23.
McCauley, C. R., Teger, A. I., and Kogan, N. Effect of the pretest in the risky shift paradigm. Journal of Per-sonality and Social Psychology, 1971, 20, 379-381.
McCauley, C , Stitt, C L., Woods, K., and Lipton, D. Group shift to caution at the race track. Journal of Experimental Social Psychology, 1973, 9, 80-86.
Miller, S. H. A study of risk taking in a coraputer sirau-lation raarketing garae. Unpublished doctoral disser-tation, Purdue University, 1969.
Miner, J. B. The Manageraent Process; Theory, Research, and Practice. New York: The Macmillan Company, 19 73.
Morgan, C P., and Aram, J. D. The preponderance of argu-ments in the risky shift phenomenon. Journal of Ex-periraental Social Psychology, 1975, II, 25-34.
Moscovici, S., and Zavolloni, M. The group as a polarizer of attitudes. Journal of Personality and Social Psychology, 1969, 12, 112-135.
Moskowitz, H, H. An experiraental investigation of decision making in a simulated research and development en-vironment. Management Science, 1973, 6, 676-687.
Nielsen, C C Ex post perceptions of risk-taking by play-ers of the investment game. Paper presented at the Fourteenth Annual Conference of the North American Simulation and Gaming Association, Los Angeles, Cali-fornia, October 23-25, 1975.
Nordhoy, F. Group interaction in decision-raaking under risk. Unpublished master's thesis, Massachusetts Institute of Technology, Sloan School of Management, 1962.
Pruitt, D. G. Choice shifts in group discussion: an in-troductory review. Journal of Personality and Social Psychology, 1971, 3, 339-360. (a)
Pruitt, D. G. Conclusions: toward an understanding of choice shifts in group discussion. Journal of Per-sonality and Social Psychology, 1971, 3, 495-510. (b)
116
Pruitt, D. G., and Teger, A. I. The risky shift in group betting. Journal of Experimental Social Psychology, 1969, 5, 115-126.
Reingen, P. H. Risk taking by individuals and informal groups with the use of industrial product purchasing situations as stimuli. Journal of Psychology, 1973, 9, 339-345.
Reingen, P. H. Choice shifts along a diraension of risk tested with consumer-related stimuli. Unpublished doctoral dissertaion, University of Cincinnati, 1974.
Richmond, S. B. Operations Research for Management Deci-sions. New York: Ronald Press, 1968.
Rim, Y. Machiavellianism and decisions involving risk. British Journal of Social and Clinical Psychology, 1966, 5, 30-35.
Rowland, K. M., and Gardner, D. M. The uses of business gaming in education and laboratory research. beci-sion Sciences, 1973, 2, 268-283. ..
St. Jean, R. Reformulation of the value hypothesis in group risk taking. Proceedings of the 78th Annual Convention of the American Psychological Association, 1970, 5, 339-340. (Summary)
Schachter, S. Deviátion, rejection, and comraunication. Journal of Abnorraal and Social Psychology, 1951, 46, 190-207.
Shubik, M. Gaming: costs and facilities. Management Science, 1968, 11, 629-660.
Siegel, S. Non-parametric Statistics: For the Behavioral Sciences. New York: McGraw-Hill Book Co., 1956.
Siegel, S. R. Subjective risk within the group decision raaking process. Unpublished doctoral dissertation, Drexel University, 1972.
Simon, H. A. Administrative Behavior: A Study of Decision-Making Processes in Administrative Organization (2nd ed.). New York: The Macmillan Company, 1957.
Sims, H. P., and Hand, H. H. Simulation gaming: the con-fluence of quantitative and behavioral theory. Pro-ceedings, Acaderay of Manageraent, 1975, August, 40-43.

117
Sisk, H. L. Manageraent and Organization. Cincinnati: South Western Publishing Co., 1973.
Slovic, P. The relative influence of probabilities and payoffs upon perceived risk of a garable. Psychonoraic Science, 1967, 9, 223-224.
Slovic, P. Information processing, situation specificity, and the generality of risk-taking behavior. Journal of Personality and Social Psychology, 1972, 1, 128-134. (a)
Slovic, P. Psychological study of human judgment: irapli-cations for investraent decision making. Journal of Finance, 1972, 4, 779-799. (b)
Slovic, P., and Lichtenstein, S. Relative importance of probabilities and payoffs in risk taking. Journal of Experimental Psychology--Monograph Supplement, 1968, 78 (No. 3, Pt. 2) .
Streufert, S., and Streufert, S. Effects of failure in a complex decision-making task and perceptions of cost, profit, and certainty. Organizational Behavior and Human Performance, 1970, 5, 15-32.
Stoner, J. A. F. A coraparison of individual and group de-cisions involving risk. Unpublished master's thesis, Massachusetts Institute of Technology, Sloan School of Management, 19 61.
Stoner, J. A. F. Risky and cautious shifts in group de-cisions: the influence of widely held values. Journal of Experiraental Social Psychology, 1968, 4, 442-459.
Teger, A. I., and Pruitt, D. G. Components of group risk taking. Journal of Experimental Social Psychology, 1967, 3, 189-205.
Vidmar, N. Group composition and the risky shift. Journal of Experimental Psychology, 1970, 6, 153-66.
Vinokur, A. Review and theoretical analysis of the effects of group processes upon individual and group decisions involving risk. Psychological Bulletin, 1971, 76, 231-250.
118
Vinokur, A., Trope, Y., and Burnstein, E. A decision-making analysis of persuasive argumentation and the choice-shift effect. Journal of Experiraental Social Psychology, 1975, 2, 127-248.
Wallach, M., and Kogan, N. Sex differences and judgment processes. Journal of Personality, 1959, 27, 555-564.
Wallach, M., and Kogan, N. Aspects of judgment and decision-making: interrelationships and changes with age. Behavioral Science, 1961, 6, 23-36.
Wallach, M. A., Kogan, N., and Bem, D. J. Group influence on individual risk taking. Journal of Abnormal and Social Psychology, 1962, 65, 75-80.
Webber, R. A. Manageraent: Basic Eleraents of Managing Organizations. Homewood: Richard D. Irwin, Inc, 1975.
Weick, K. E. Organizations in the laboratory. In V. H. Vroom (ed.), Methods of Organizations Research. Pittsburg: University of Pittsburg Press, 1967.
Woodside, A. G. Group influence and consumer risk taking. Unpublished doctoral dissertaion, The Pennsylvania State University, 1968.
APPENDIX
A. GIAL-SD QUESTIONNAIRE 120
B. SAMPLE FIRM REPORT 127
C TEAM COMPOSITION 128
D. STATEMENT MADE PRIOR TO ADMINISTERING THE GIAL-SD DURING THE WEEK OF JANUARY 26, 19 76 . . . . 131
E. INFORMED CONSENT STATEMENT 132
119

120
APPENDIX A
GIAL—SD QUESTIONNAIRE
The following questions are designed to assess some of your important past experiences. Each question consists of an introductory stem which is lettered and some possible responses, which are numbered. You are to react to each response. Do not skip any. On the accompanying answer sheet you will find five point rating scales. Each scale is to be used to rate how frequently the response to a stera has occurred in your past experience. If a response was very frequently true to your experience, rate it by marking the 5 column on the answer sheet in the row with the sarae number as the response. If the response has been only somewhat frequent for you, rate it 4. A 3 rating is given to a response which has occurred only about 50 percent of the time. A somewhat infrequent response is marked 2, while a very infrequent response should get a 1. In all, there are 100 responses which are to be rated. For exara-ple, consider this stera and response:
A. In riding through the park
1. I often got dizzy 2. I saw many people 3. I found some lost money 4. I had interesting thoughts
You would rate each response on the answer sheet in the ap-propriate space. For instance, if you never got dizzy riding in the park you would mark a 1 in row 1 on the an-swer sheet. If half the time you had interesting thoughts the 3 position would be marked in row 4 of the answer sheet.
If there are any questions, please raise your hand.
A. In general, in reviewing your past experience would you say that you usually like to
1. avoid problems in general 2. solve little problems but avoid larger ones 3. solve major lengthy probleras 4. find new probleras to solve
Copyright, Michael J. Driver and Siegfried Streufert. 20 Aoril, 1967.

121
B. Generally I have found that
5. slight frustration gets rae quite upset 6. rainor frustration doesn't bother rae but when a raajor
plan fails I ara greatly disturbed 7. I can laugh at rainor frustrations as long as major
plans are working out. 8. As long as I have some major plan v:orking out, I
don't get too bothered by other important things going wrong
9. I don't worry about failures too much.
C If you had your way, would you like to know
10. exactly what lay in store in the future 11. pretty much what to expect in the years ahead 12. just a general idea of future developments 13. nothing for certain, only some hints as to future
possibilities 14. nothing of the future.
D. How would you describe your recent taste in movies, TV or reading
15. I have often sought extremely unusual, novel forms ^ of entertainment such as science fiction or fantasy
16. I have often sought moderately novel entertainment such as accounts of events in remote places
17. I have often sought material which is somewhat novel and also somewhat familiar such as mysteries and biographical or documentary pieces
18. I have often sought material which is mostly farail-iar to rae such as Westerns
19. I have often sought raaterial which is extreraely familiar such as present-day romances or situation comedies.
E. Do you watch TV prograras that eraphasize
20. weird and bizarre huraor 21. satirical and unconventional huraor 22. stand-up coraics 23. slapstick huraor 24. traditional, "down-horae" humor.
F. If you had a choice of games, would you select one which had
25. a 100% chance of winning 26. a 80% chance of winning

122
27. a 60% chance of winning 28. a 40% change of winning 29. a 20% chance of winning.
G. When I loose at a game such as cards or a team sport which I had expected to win, I am usually
30. pretty cheerful 31. not at all bothered 32. slightly bothered 33. moderately annoyed at least at first 34. extreraely angry alghough I usually get over it
quickly enough.
H. I am very hopeful that in my life time I can
35. rapidly attain an erainent position and then sit back and enjoy it
36. continuously strive with total success for increas ingly more important positions
37. continuously strive with at least some success or a variety of important jobs
38. find a good stable position with guaranteed ad-vancement
39. find a corapatible job that I enjoy regardless of its "iraportance."
I. On the average how satisfied were you with your high school grades
40. extreraely satisfied 41. quite satisfied 42. about as satisfied at sorae tiraes as I'm dissatis-
fied at 43. quite dissatisfied 44. very dissatisfied.
J. When someone has disagreed with me in a discussion I have usually felt
45. a strong negative reaction no matter who it is 46. considerable hostility unless it was a friend or
soraeone I respected 47. dislike, unless it was a raatter of little concern
to rae 48. raild interest if it was not too iraportant 49. great interest if it was not too critical 50. considerable interest no raatter what the impor-
tance of the topic

123
K. Generally speaking, when I have come into a situation where I have not had any clear idea what would happen or how I should act, I have been
51. extremely disturbed 52. somewhat upset 53. slightly upset 54. unperturbed 55. slightly interested, but not upset 56. quite fascinated.
L. With regard to my daily activities
57. I have rarely changed my daily routine in the last few years
58. I have changed some minor aspects from tirae to time 59. I change some aspects rather frequently 60. I raake major revisions from time to time 61. I have sought to vary my routine as much as possible 62. I would have had no fixed routine if at all possible.
M. When you have thoughts about life at present, which of the following views have you most often taken
63. I'd rather have lived in the raore exciting and un-predictable days of old
64. I'd rather return to the more predictable days of old
65. I've been pretty satisfied with things as they are today--mostly predictable but not too rauch so
66. Things are pretty unpredictable now and I'd like thera to stay that way
67. I'd rather see the world becorae a bit raore exciting and unpredictable, even though it's fairly unpre-dictable now
68. I'd like to move out into new and intensely uncer-tain world although everything is very unpredicta-ble as it is
69. I'd like to see a new and raore predictable world corae about.
N. In your day drearaing, to what sorts of places would you have travelled
70. To the reraotest regions including other planets 71. To the reraotest and most unfamiliar regions of the
planet 72. To unusual places like South America or Japan but
not "far out" places like Africa

124
73. To moderately unusual places like Spain or Mexico 74. To places somewhat different yet familiar like
Bermuda or the British Isles 75. To raoderately farailiar places such as distant parts
of the USA or Canada 76. To very farailiar places near by.
0. In discussions with others, I have
77. Defended ray point of view and have particularly dis-liked those who switch positions for no reason
78. Defended ray point of view and have felt somewhat uneasy when others have changed their positions with little reason
79. Defended my point of view and have not cared whether others changed or not
80. Enjoyed defending my point of view against others who have changed their positions frequently
81. Sometiraes taken an opposite point of view to ray own in order to show what was wrong with it
82. Enjoyed taking on a variety of different points of view to explore their iraplications
83. I have enjoyed defending raany points of view which I don't particularly agree with partly to excite discussion and partly to soraewhat "shake up" cer-tain other people.
P. How close have you usually corae to attain your goals
84. I usually set my goals so as to attain them 85. I always put out as rauch effort as is needed to
attain ray goals 86. I attain sorae goals, while missing some others 87. When I find I can't attain my goals, I usually try
to find easier goals, if I can 88. I haven't had much luck so far but I keep trying
since I think I have reasonable goals 89. I tend to set rather unreasonably high goals which
naturally I haven't attained yet 90. I find that as soon as I get close to attaining a
goal, I set a higher standard for myself.
Q. When someone has pointed out to you that you have just said something inconsistent with sorae previous reraark, how have you normally felt
91. quite embarrassed 92. somewhat erabarrassed 93. slightly erabarrassed

125
94. unaffected 95. interested in explaining why the statements were
not in conflict 96. interested in exploring the situation more 97. quite pleased, since consistency is the "hobgoblin
of little min( s" 98. somewhat pleased, since at times I rather enjoy
appearing inconsistent to some people.
Questions 99 and 100 have special scoring directions.
1. Count the number of types of magazines (number 99) or television programs (nuraber 100) which you frequently look at.
2. Mark the appropriate response on the answer sheet, using the following keys:
If the total is Mark the nuraber
0 3 6 9 12
2 5 8 11 14
1 2 3 4 5
99. How raany of the following types of magazines do you read frequently (at least once a month)?
a b c d e f g h i j k 1 ra n o P q r s t u V
Decorating/Gardening Fashion Fore ign raagazines/Newspapers H i s t o r i c a l Horaeraaker o r i e n t e d Huraor Literary/Intellectual Mechanical (auto, horae repair) Men' s Movie and TV guide Mystery News Parents Pictorial Professional/Trade Journals, your field Professional/Trade Journals, other Psychological Science fiction Scientific Sports Travel Woraen's

126
100. How raany of the following types of television pro-grams do you watch frequently (at least once a week)?
a. "Big Star" specials b. Cartoons c Children's shows d. Coraical spy stories e. Coraical war stories f. Conversation prograras g. Crime shows h. Domestic raovies i. Educational j. Fantasies or science fiction k. Foreign raovies 1. News programs m. "Proglem" documentaries n. Quiz/panel shows o. Serials p. Situation comedies q. Spy stories (serious) r. Travel documentaries s. Variety prograras t. War stories (serious)

127
APPENDIX B
SAMPLE FIRM REPORT
THE IHAGINIT MANAGEME^IT GAHE THE IHAGINIT BREAKFAST CEREALS INOUSTRY
COHPANY REPORT FOR FIRN 53 INC ME STATEHENT
SHIPMENTS IN UNITS OF PRODUCT NET SALES REVENUE
COST OF GOOOS SOLO DIRECT LABOR (d DIRECT MATERIALS STORAGE FACTORY OEPRECIATION OTHER FACTORY OVERHEAD
COST TQ HANUFACTURE CHANGE IN FINISHED GOODS N HANO ($)
COST OF GOOOS SOLO GROSS PROFIT ON SALES
SALESHEN (t) AOVERTISING RESEARCH AND DEVELOPMENT EHPLOYEE FRINGE BENEFITS OPERATIONS RESEARCH ADHINISTRATIVE OVERHEAD INTEREST
PROFIT BEFORE INCOME TAX IKCOKE TAX NET EARNINGS
OIVIOENDS PER SHARE 0.0 SHARES SOLO 0.
CHANGE IN STOCKHQLOERS EQUITY
YEAR 0 CEREALS
QUARTER 0 SNACKS
HONTH
A-l
2500000. 2^000000.
A375000. 7800000.
IGOOOOO. 1000000.
0. 625000.
TOTAL PAYOUT PR CEEOS
A-2
0. 0.
0. 0.
0. 0. 0. 0.
B-1 TOTALS
0. 2^000000.
0. 0.
0. 0.
0.
0. 0. 0. 0.
4375000. 7800000. 1065600. 650COO. 1650000.
15540600. 0.
155A0600. 8459400. 1000000. 1000000.
0. 625000.
0. 1550000.
0. 4284400. 2056512. 2227888.
2227888.
BALAMCE SHEET CASH ACCOUNTS RECEIVABLE HATERIALS FINISHcO GOOOS NET PLANT TOTAL ASSETS
COHHON SHARES
1140888. 2640000. 1960000. 1024000.
13000000. 1 9 7 6 4 8 8 8 .
4 0 0 0 0 0 . HARKET QUOTE
ACCOUNTS PAYABLE SHORT-IERH LOANS BONOS P A I D - I N CAPITAL RETAINEO EARNINGS TOTAL EQUITIES
BOOK VALUE
1463000. 0. 0.
16000000. 2301888.
19764888. 45 .75
8 8 . 4 4
CURRENT POLICY AND ENVIRONHENT AVERAGE INOUSTRY PRICES THIS PERIOD CURRENT TOTAL HARKET DEHANO (UNITS)
SHARE OF HARKET THIS PERIOO POTENTIAL SHIPHENTS NEXT PERIOD PRICES HATERIALS HATERI ALS HATERIALS
I I I INPUTS PER UNIT ON HANO ( $ ) ON ORDER ( t )
H NTHS UNTIL HATERIALS ARRIVE PROOUCTION LEVELS ( U N I T S ) NUHBER OF F IN ISHED UNITS ON HAND OISTRIBUTION CHANNEL INVEMTORIES PURCHASE OR SALE OF FACTORY CAPACITY LOANS HAOE OR REPAIO 0 . QUARTERS DIVIOENDS TOO LOW 0 . F IRH LABOR RATE ' ' 5 0 FRINGE BENEFITS PER HOUR 0 . 5 0 CllRRENT NUHBER OF LABOR SHIFTS 1 .
9 . 6 0 75 0 0 0 0 0 .
— A - l — — A - 2 — 0 .333
2625000. 9 .60 3.12
1960000. 0 .
0 .0 2500000.
200000. 200000.
0 .0 0 .
0 .0 0 .0
0 . 0 .
0 .0 0 . 0 . 0 .
B 0 . 0
0 . — B - l ~
0 .0 0 .
0 .0 0 . 0
0. 0 .
0 .0 0. 0. 0.
BUNDS ISSUEO OR REDEEMEO TOTAL OIVIOENOS TO OATE ACTUAL LABOR HOURS PROOABILITY OF A STRIKE PERSONS AVAILABLE PER SHIFT
1 9 6 0 0 0 0 .
6 5 0 0 0 0 . 0 . 0 .
1250000. 0 .05 6 5 0 .

128
APPENDIX C
TEAM COMPOSITION
Student Prior Garae Team Number GIAL GPA* Major** Experience
1 1 42 2.38 GBU No 1 2 33 2.69 ACC No 1 3 31 3.09 FIN No 1 4 43 4.00 MGT No 2 5 40 2.86 ACC No 2 6 40 2.90 MKT No 2 7 44 3.88 MGT Yes 3 8 42 2.39 ACC No 3 9 33 2.92 ACC No 3 10 44 3.40 MGT No 3 11 36 3.87 GBU No 4 12 36 3.49 MGT No 4 13 38 3.43 ACC No 4 14 43 2.73 MGT No 4 15 32 1.78 MKT Yes 5 16 48 2.25 ACC No 5 17 51 2.87 FIN No 5 18 57 3.42 MGT Yes 5 19 46 3.86 ACC Yes 6 20 45 2.34 FIN No 6 21 46 2.85 MKT Yes 6 22 49 3.31 MGT No 6 23 48 3.94 ACC Yes 7 24 7 25 7 26
8 28 8 29 8 30 8 31
21 32 21 33 21 34 22 35 22 36 22 37 23 38 23 39 23 40 23 41
42 33 31 43 40 40 44 42 33 44 36 36 38 43 32 48 51 57 46 45 46 49 48 47 51 54 49 49 50 45 50 36 34 40 29 36 31 42 36 . 38 43
2.38 2.69 3.09 4.00 2.86 2.90 3.88 2.39 2.92 3.40 3.87 3.49 3.43 2.73 1.78 2.25 2.87 3.42 3.86 2.34 2.85 3.31 3.94 2.44 2.75 2.98 3.52 2.66 2.70 3.00 3.44 2.77 3.13 3.40 2.42 2.65 3.52 2.04 2.40 2.54 3.63
GBU ACC FIN MGT ACC MKT MGT ACC ACC MGT GBU MGT ACC MGT MKT ACC FIN MGT ACC FIN MKT MGT ACC ACC MGT FIN GBU GBU FIN GBU ACC ACC GBU MGT MKT MKT ACC MKT MGT ACC ACC
Yes Yes No
7 27 49 3.52 GBU Yes Yes Yes No Yes No Yes No No No Yes Yes No No No

129
Team
24 24 24 24 25 25 25 25 26 26 26 27 27 27 28 28 28 31 31 31 31 32 32 32 32 33 33 33 34 34 34 34 35 35 35 35 36 36 36 36 37 37 37 37
Student Number
42 43 44 45 46 47 48 49 50 51 52 53 54 55 56 57 58 59 60 61 62 63 64 65 66 67 68 69 70 71 72 73 74 75 76 77 78 79 80 81 82 83 84 85
APPENDIX
GIAL
27 41 33 37 54 52 45 49 56 53 46 50 57 44 58 52 45 37 40 24 41 27 40 39 40 39 37 35 39 33 29 41 48 48 48 56 48 52 44 54 51 52 45 . 60
C (Continued)
GPA
2.28 2.64 2.92 3.91 1.89 2.75 2.96 3.28 3.76 3.27 2.38 2.66 3.73 2.96 2.47 3.07 2.73 1.70 2.46 2.89 3.57 2.13 3.36 3.60 2.70 3.30 2.11 3.10 2.18 2.49 2.88 3.03 3.00 3.00 1.82 2.03 3.24 2.65 2.81 3.35 1.82 2.57 3.06 3.90
Major
MGT MKT ACC ACC MGT MGT MKT ACC GBU • ACC MGT MGT ACC GBU ACC MGT MKT MGT FIN MGT ACC MGT FIN ACC MGT ACC GBU MGT MGT ACC MGT FIN FIN ACC MKT MGT FIN GBU MGT ACC MGT ACC MKT ACC
Prior Game Experience
Yes No No No No Yes Yes No No Yes No Yes Yes No No No
Yes No No Yes No No No
Yes Yes Yes Yes Yes No Yes Yes No No Yes No No No No Yes No No No No Yes

130
APPENDIX C (Continued)
Team
38 38 38 41 41 41 41 41 42 42 42 42 42 43 43 43 43 43 44 44 44 44 44
Student Number
86 87 88 89 90 91 92 93 94 95 96 97 98 99
100 101 102 103 104 105 106 107 108
GIAL
45 53 44 36 40 36 35 36 43 41 40 43 35 52 47 60 46 47 67 46 47 65 52
GPA
2.79 3.06 3.70 2.67 2.23 2.73 3.14 3.10 2.42 2.59 2.56 3.49 3.01 1.88 2.37 2.50 2.86 2.91 2.67 2.63 2.71 1.84 3.11
Major
MGT ACC FIN GBU MGT MGT FIN ACC MGT MKT GBU FIN ACC ACC MGT MKT FIN ACC ACC FIN MGT MGT ACC
Prior Game Experience
Yes No No No
Yes No No No No No No Yes Yes No No
Yes Yes Yes No Yes Yes No No
*Grade Point Average is based on a four point systera,
**The following abbreviations are used for raajors in the College of Business Administration:
GBU = General Business ACC = Accounting FIN = Finance MGT = Management MKT = Marketing

131
APPENDIX D
STATEMENT MADE PRIOR TO ADMINISTERING THE GIAL-SD DURING THE WEEK
OF JANUARY 26, 1976
All students enrolled in BA 4380, Administrative
Policy, this semester are being asked to participate in a
research project. As a part of this research, we are
asking students to complete a short questionnaire today.
The instrument is known as the GIAL-SD, which is in
general a past experience inventory. Your responses will
be confidential, and, as Dr. will attest, has
no relationship to your classroom performance.
Later in the semester, your answer sheet will be re-
turned to you with your score. At that time, you will be
inforraed of what the test tells about you along with your
relative standing to many others like you who have taken
the questionnaire. Thank you for your time and coopera-
tion.

132
APPENDIX E
INFORMED CONSENT STATEMENT
As an integral part of the normal course activities
you will be submitting both individual and group decisions
in the play of the IMAGINIT MANAGEMENT GAME.
I would like to obtain your permission to use this
data as part of a significant research project which I am
presently directing. The research is concerned with
decision making under uncertainty and would involve a
coraparison of the decision data with various dimensions
of the simulated garae v/hich you are playing. The results
of the research may make an important contribution to our
knowledge of decision making. If you are interested in
the findings of the study, please contact rae after the
end of the semester.
Analysis of the data will be in group form and will
not prejudice evaluation of your performance in this class.
Furthermore, these data will not be disclosed by name nor
will such identification be possible in any report of the
research. You do have the right to refuse participation
or to withdraw your consent at any time during the semester
