a comparison of methods to enhance protein detection …homepages.uc.edu/~davidswm/method...
TRANSCRIPT

A Comparison of Methods To Enhance Protein Detectionof Lipoproteins by Mass SpectrometryAnna Heink, MS,† W. Sean Davidson, PhD,§ Debi K Swertfeger,‡ L. Jason Lu,‡
and Amy S Shah, MD MS*,†
†Department of Pediatrics and ‡Division of Biomedical Informatics, Cincinnati Children’s Hospital Research Foundation,3333 Burnet Avenue, Cincinnati, Ohio 45229-3039, United States§Center for Lipid and Arteriosclerosis Science, Department of Pathology and Laboratory Medicine, University of Cincinnati,2120 East Galbraith Road, Cincinnati, Ohio 45237-0507, United States
*S Supporting Information
ABSTRACT: We sought to develop a new method to moreefficiently analyze lipid-bound proteins by mass spectrometryusing a combination of a lipid removal agent (LRA) thatselectively targets lipid-bound proteins and a mass spectrometrycompatible detergent, anionic acid labile surfactant (AALS), thatis capable of eluting proteins off the LRA. This method wascompared to established methods that use the lipid removalagent alone and straight proteomic analysis of human plasmaafter organic solvent delipidation (OSD). Plasma from healthyindividuals was separated by gel filtration chromatography andprepared for mass spectrometry analysis by each of the describedmethods. The addition of AALS to LRA increased the overallnumber of proteins detected in both the high and low densitylipoprotein size range, the number of peptide counts for eachprotein, and the overall sequence coverage. Organic solventdelipidation detected the most proteins, though with somedecrease in overall protein detection and sequence coveragedue to the presence of nonlipid-bound proteins. The use ofLRA allows for selection and analysis of lipid-bound proteins.The addition of a mass spectrometry compatible detergentimproved detection of lipid-bound proteins from human plasmausing LRA.
KEYWORDS: lipoproteins, mass spectrometry, detergents, lipids, surfactant
■ INTRODUCTION
Plasma lipoproteins, such as low- and high-density lipoproteins(LDL and HDL), play important roles in lipid transport andmetabolism. The roles of these lipoproteins are largely mediatedby the sequence and structure of their associated apolipoproteins(apo), apoB for LDL and apoA-I for HDL. Prior to 2000, bothLDL and HDL were thought to contain <15 different proteins.1
However, with the development and application of modern massspectrometry (MS) techniques, our understanding of theproteomic diversity of both LDL and HDL has dramaticallyincreased. Recent MS studies have identified proteins that pointto novel roles for HDL including complement activation, anti-inflammation,2 hemostasis, vitamin transport, and even glucosemetabolism.3,4 Similarly, LDL may also have a role incomplement activation and hemostasis.5,6
While modern MS technology has increased the ability toidentify proteins, there is concern that some of the proteins may
not be truly lipoprotein associated. For example, upward of 200proteins have been described to associate with HDL, but givenHDL size, it is not possible for all of these proteins to beassociated with HDL. In fact, only about 90 or so have beendescribed in ≥ 3 or more studies by independent laboratories,probably representing the best estimate of the HDL proteome.4
The other 115+ proteins include intracellular and cell surfaceproteins, antibodies, immunoglobulins, and even skin keratin.These findings suggest that improvedMSmethods are needed todetect proteins truly associated with lipoproteins.Historically defined by density, lipoproteins are most
commonly isolated by density-gradient ultracentrifugation intothree major classes, VLDL, LDL, and HDL.7 Our laboratory haselected to analyze lipoproteins by size through gel-filtration
Received: March 28, 2015
Article
pubs.acs.org/jpr
© XXXX American Chemical Society A DOI: 10.1021/acs.jproteome.5b00270J. Proteome Res. XXXX, XXX, XXX−XXX

chromatography because we and others have noted feweralterations in the particle proteome compared with ultra-centrifugation.8,9 This gel filtration chromatography method incombination with a calcium silicate hydrate resin (trade namelipid removal agent (LRA)) was originally developed toselectively target lipid associated proteins for proteomic analysisdirectly in plasma. Previously, the most common way to analyzelipoprotein proteomes was to first isolate lipid containingparticles by density ultracentrifugation separation prior to theMS analysis. The LRA method opened up the possibility ofstudying plasma lipoproteins separated by a host of non-centrifugal methods including gel filtration, anion exchange, andisoelectric focusing.9,10 One potential drawback of the LRAmethod is the fact that phospholipids bind nearly irreversibly tothe resin. Ideally, the resulting peptides are released from thelipoproteins using trypsin, eluted from the resin, and analyzed.However, there are several issues that could result in overall poorpeptide yield by this method. First, only the most polar andexposed regions of lipid-bound proteins are likely accessed bytrypsin. As a result, some peptides may be either buried in lipid orremain associated with it even when proteolyzed. Thus, theremay be a selection bias in the analysis. Second, steric issuescaused by the interaction between trypsin and the resin may limitthe extent of proteolysis. Third, even if liberated, some peptidesmay nonspecifically associate with the resin and therefore escapedetection. Thus, we have expended considerable effort todevelop ways to elute LRA bound lipoproteins in their nativeform by altering pH, ionic strength, competition, and mildorganic solvents. Unfortunately, none of these approaches hasbeen successful to date. In fact, the only way we have found thatreliably removes LRA bound proteins is by sodium dodecylsulfate (SDS) detergent solubilization, a method that isincompatible with MS.For the current study, we had two goals in mind. First, we
sought to develop ways to more efficiently (if possible) elute andanalyze LRA retained peptides. Since SDS is not MS compatible,we focused on one of the several hydrolyzable detergents thathave recently been developed for MS. Anionic acid labilesurfactant (AALS) is an anionic detergent with similar solubilityproperties to SDS, but upon exposure to acidic conditions,hydrolyzes into small, noninterfering organic molecules that arecompatible with subsequent reverse-phase separations and MSionization. We reasoned that AALS would result in (i) a morecomplete solubilization and elution of LRA bound proteins, and(ii) subsequent denaturation of proteins by the AALS couldresult in significant improvements in the number of proteinsdetected and the overall sequence coverage of each protein byMS. Second, we sought to compare both LRA and LRA+AALS toa straight proteomic analysis of gel filtration fractions fromhuman plasma prepared by organic solvent delipidation (OSD)that had not been exposed to LRA.
■ MATERIALS AND METHODS
Participants
Three healthy, nonsmoking, normolipidemic (plasma cholester-ol <190 mg/dl and plasma triglycerides <150 mg/dl) males witha mean age of 26 years were recruited. Fasting blood lipids levelswere confirmed. A second aliquot of blood was collected in BDVacutainer (BD Biosciences) tubes using citrate as anticoagulantand spun at ∼1590g for 15 min at room temperature (25 °C) toisolate plasma. Plasma was stored at 4 °C and was never frozen.This study was reviewed and approved by the institutional review
board at Cincinnati Children’s Hospital Medical Center, and allparticipants provided informed consent.
Plasma Separation by Gel Filtration Chromatography
Within 4 h of collection, 370 μL of plasma was separated via threeSuperdex 200 columns arranged in series (GE Healthcare) aspreviously described.10 Eluate was collected as 47 fractions in1.5 mL volumes maintained at 4 °C. Fractions 13−30 containdetectable phospholipid that corresponds to plasma lipoproteinsLDL/HDL. To relate gel filtration results to traditional density-centric definitions, we use the presence of apoB, the coreconstituent of LDL, as the key distinguisher. Therefore, theVLDL/LDL range is defined as fractions 13−19 due to thepresence of apoB. We assigned the remaining fractions 20−30 asthe HDL range because their diameters are consistent withmeasurements for density-isolated HDL and because of theabundance of the major HDL protein, apoA-I. SupplementFigure 1 of the Supporting Information shows the cholinecontaining phospholipid (PL) content (Wako) of our gelfiltration plasma fractions compared to LDL and HDL isolatedby ultracentrifugation.
■ MS SAMPLE PREPARATION
Calcium Silicate Hydrate (LRA)
A commercially available synthetic calcium silicate hydrate, LRA(Supelco) was used to bind and isolate lipoprotein particles fromeach of the gel filtration fractions.10 In a 96-well 0.45 μm filterplate (Millipore), 15 μL of LRA [100 mg/mL stock solution in50 mM ammonium bicarbonate (AB buffer)] was added to300 μL of each gel filtration fraction. The plate was mixed for30 min at RT. The supernatant containing lipid-free plasmaproteins was then removed from the plate using a vacuummanifold and later assayed for PL to ensure that thephospholipid-containing particles were fully bound to theLRA.10 The LRA resin in the filter plate was washed threetimes with 150 μL of 50 mM AB buffer. One microgram ofsequencing grade trypsin in a volume of 32.5 μL of AB buffer wasthen added to each well. The plate was sealed with parafilm toprevent evaporation and incubated at 37 °C overnight on ashaker plate. To ensure the complete digestion of proteins fromthe LRA resin, an additional 1 μg of trypsin was added to eachsample in a volume of 16.3 μL of AB buffer, and the samples wereincubated on a shaker plate for 2 h at 37 °C. Following digestionwith trypsin, samples were eluted by vacuum manifold from thefilter plate into a clean 96-well plate. The LRA resin was washedand eluted twice more with 50 μL of AB buffer. Peptides werereduced with dithiothreitol (10 mM concentration for 30 min at37 °C) and then carbamidomethylated with iodoacetamide(40 mM concentration for 30 min at room temperature in thedark). Ninety-four microliters of each sample was transferredto a rinsed microfuge tube, lyophilized to dryness, and storedat −20 °C until analyzed by MS.
Calcium Silicate Hydrate + Anionic Acid Labile SurfactantI (LRA+AALS)
After the gel filtration fractions were incubated with LRA asabove and the LRA resin was washed three times with 150 μL ofAB buffer, each fraction was then resuspended in 1 μg of trypsinand 3.25 μL of 0.1% anionic acid labile surfactant I (AALS I,CMC 7.7 mM, Progenta) in a total volume of 32.5 μL of ABbuffer. The sample plate was wrapped and incubated overnight at37 °C. The trypsin digest and remainder of the protocol wascontinued the proceeding day in the same manner as above.
Journal of Proteome Research Article
DOI: 10.1021/acs.jproteome.5b00270J. Proteome Res. XXXX, XXX, XXX−XXX
B
Organic Solvent Delipidation (OSD, no LRA)
In this method, 300 μL of each gel filtration fraction was dialyzedinto 50 mMAB buffer, transferred to glass tubes, and lyophilized.Powdered samples were resolubilized in 1 mL of ice-coldchloroform:methanol (2:1 v/v), vortexed, and incubated on icefor 30 min. One milliliter of ice-cold methanol was then added toeach sample, and the tubes were centrifuged at 4000g for 30 minat 4 °C. The pellet was resuspended in 2mL of ice-cold methanoland spun as before. The pellet was resuspended in 90 μL of 20%methanol/80% AB buffer. Samples were briefly sonicated to aidin solubilization. Samples were reduced by adding dithiothreitolto a final concentration of 10 mM and incubating for 30 min at42 °C, and carbamidomethylated by adding iodoacetamide to afinal concentration of 40 mM and incubating at room tem-perature in the dark for 30 min. Twenty microliters of eachsample was then added to a rinsed microfuge tube and digestedwith 1 μg of sequencing grade trypsin at 37 °C overnight. Thefollowing day, an additional 1 μg of trypsin was added to eachsample and incubated again at 37 °C for at least 1 h. Samples werethen lyophilized to dryness and stored at −20 °C until MSanalysis.
Nanoliquid Chromatography Coupled ElectrosprayTandem Mass Spectrometry (nLC−ESI−MS/MS)
Prior to MS analysis, lyophilized fractions containing AALS wereresuspended in 5 μL of a 1% trifluoroacetic acid (TFA) solu-tion to cleave the AALS detergent into small, noninterferingorganic molecules. After 20 min, 10 μL of high-performanceliquid chromatography (HPLC)-grade water was added toadjust the sample to a 0.3% TFA concentration. LRA-preparedsamples not containing AALS were resuspended in 15 μL of a0.3% TFA solution. Samples that had been resuspended inequal volumes of TFA were then lyophilized to dryness oncemore.All samples from each method were reconstituted in 50 μL of
0.1% formic acid and centrifuged at 10 000g for 10 min. Then2 μL of the supernantant was diluted to a volume of 10 μL with0.1% formic acid. nLC−ESI−MS/MS analyses were performedon a TripleTOF 5600+ (ABSciex, Toronto, On, Canada)attached to an Eksigent (Dublin, CA) nanoLC.ultra nanoflowsystem. Five microliters of the 0.1% formic acid solution wasloaded (via an Eksigent nanoLC.as-2 autosampler) onto anIntegraFrit Trap Column (outer diameter of 360 μm, innerdiameter of 100 μm, and 25 μm packed bed) from NewObjective, Inc. (Woburn, MA) at 2 μL/min in formic acid/H2O0.1/99.9 (v/v) for 15 min to desalt and concentrate the samples.For the chromatographic separation of peptides, the trap-columnwas switched to align with the analytical column, AcclaimPepMap100 (inner diameter of 75 μm, length of 15 cm, C18particle sizes of 3 μm, and pore sizes of 100 Å) from Dionex-Thermo Fisher Scientific (Sunnyvale, CA). The peptides wereeluted using a variable mobile phase (MP) gradient from 95%phase A (formic acid/H2O 0.1/99.9, v/v) to 40% phase B(formic acid/acetonitrile 0.1/99.9, v/v) for 35 min, from 40%phase B to 85% phase B for 5 min, and then keeping the samemobile phase composition for 5 more minutes at 300 nL/min.The nLC effluent was ionized and sprayed into the MS usingNANOSpray III Source (AB Sciex, Toronto, On, Canada). Ionsource gas 1 (GS1), ion source gas 2 (GS2), and curtain gas(CUR) were, respectively, kept at 15, 0, and 30 vendor specifiedarbitrary units. Interface heater temperature and ion spray voltagewere kept at 150 C and at 2.5 kV, respectively. MS method wasoperated in positive ion mode set to go through 3993 cycles
for 65 min, where each cycle performing one time-of-flight(TOF)-MS scan type (0.25 s accumulation time, in a 350−1800m/zwindow) followed by 30 information-dependent acquisition(IDA)-mode MS/MS-scans on the most intense candidate ionshaving a minimum 250 counts. Each product ion scan wasoperated under vender specified high-sensitivity mode with anaccumulation time of 0.075 s and a mass tolerance of 50 mDa.Former MS/MS-analyzed candidate ions were excluded for 15 safter its first occurrence, and data were recorded using Analyst-TF (v.1.6) software.Mass Spectrometry Data Analysis
Acquired mass spectra were scanned against the UniProtKB/Swiss-Prot Protein Knowledgebase (release 2011, 533 657sequences) for Homo sapiens (20 323 sequences) using Mascot(version 2.2.07) and X! Tandem (version 2010.12.01.1) searchengines. Search criteria assumed digestion with the enzymetrypsin and included carbamidomethylation and Met oxidationas variable modifications, peptide tolerance set to ±35 ppm,MS/MS tolerance set to ±0.6 Da, and up to three maximummissed trypsin cleavage sites allowed. Validation of MS/MS-based peptide and protein identification using an X! Tandemsubset search was performed within Scaffold (version 4.3.4,Proteome Software Inc., Portland, OR). Only peptides andproteins with >90% identification probability via both Mascotand X!Tandem, along with the Peptide Prophet algorithm11 andProtein Prophet algorithm,12 were considered in analysis.Protein identifications were accepted if they contained at leasttwo identified peptides. Since equal starting volumes of samplewere used in all three methods, the abundance of protein in agiven fraction should be relative to the number of spectral counts(i.e., the number of MS/MS spectra assigned to a particularprotein) in that fraction.13 Raw spectral counts are presented,and no data normalization was performed.
■ RESULTS
Selection of the Anionic Acid Labile Surfactant (AALS)
Initial experiments were conducted to optimize the MS-compatible detergent needed to elute proteins from the LRA.Two MS-compatible detergents were chosen, each with adifferent critical micelle concentration (CMC), which influencessolubility: AALS I (CMC 7.7mM, Progenta) and AALS II (CMC1.9 mM, Progenta). Comparisons were made to the non-MScompatible detergent SDS, which reliably elutes LRA boundproteins, and Triton X-100.Compared to SDS, Triton X-100 (at 0.05% and 0.1%) and
AALS I at 0.05% showed less protein recovery from the LRA bySDS-polyacrylamide gel electrophoresis (PAGE) gel. AALS I at0.1% and AALS II at 0.1% and 0.05% were comparable to SDS(Supplement Figure 2, Supporting Information).A determination of the PL loss from LRA in the presence of a
detergent is important because lipid contamination in proteomicsamples can damage the HPLC column and obscure MS results.We found that AALS I at both 0.1% and 0.05% eluted less PLfrom the LRA compared to both concentrations of AALS II. Thiswas also less than with the use of SDS (Supplement Figure 3,Supporting Information). Increasing the amount of LRA resinused in this experiment showed no improvement in minimizingPL elution (data not shown).To finalize the optimization of AALS, two samples were
prepared for MS analysis using AALS I (0.1%) and AALS II(0.05%), which were conditions where we saw the greatestprotein recovery and least PL coelution off the LRA.
Journal of Proteome Research Article
DOI: 10.1021/acs.jproteome.5b00270J. Proteome Res. XXXX, XXX, XXX−XXX
C
Approximately 20% higher unweighted spectral counts wereobserved for apoA-I and apo A-II using AALS I (0.1%) versusAALS II (0.05%).
Results from the aforementioned experiments led us to useAALS I at a 0.1% concentration for subsequent MS preparationsdue to its compatibility with the MS, maximal protein recoverywith minimimal PL contamination in the delipidated sample, andincreased number of spectral counts detected by MS.
Comparisons of the Three MS Methods
Gel filtration fractions were prepared for MS analysis using eachof the three different methods (LRA, LRA+AALS, OSD) in theHDL size range (fractions 20−30) and LDL size range (fraction13−19).First, we sought to determine whichmethod detected themost
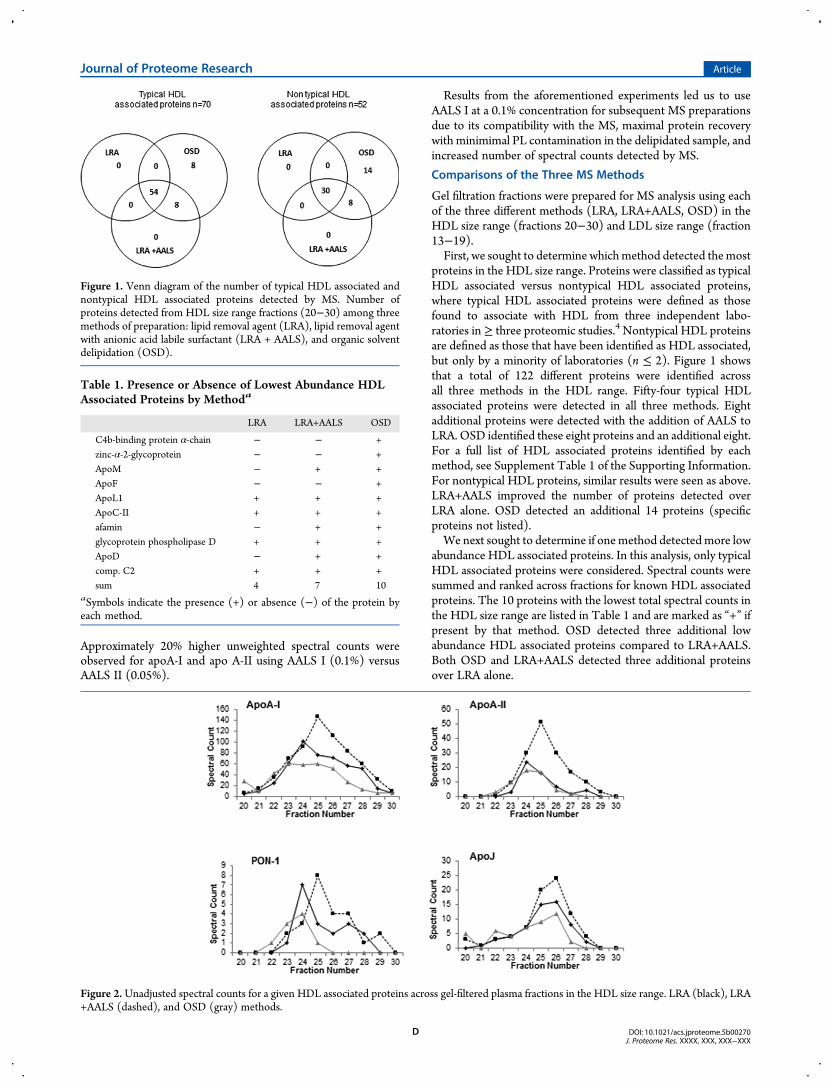
proteins in the HDL size range. Proteins were classified as typicalHDL associated versus nontypical HDL associated proteins,where typical HDL associated proteins were defined as thosefound to associate with HDL from three independent labo-ratories in≥ three proteomic studies.4 Nontypical HDL proteinsare defined as those that have been identified as HDL associated,but only by a minority of laboratories (n ≤ 2). Figure 1 showsthat a total of 122 different proteins were identified acrossall three methods in the HDL range. Fifty-four typical HDLassociated proteins were detected in all three methods. Eightadditional proteins were detected with the addition of AALS toLRA. OSD identified these eight proteins and an additional eight.For a full list of HDL associated proteins identified by eachmethod, see Supplement Table 1 of the Supporting Information.For nontypical HDL proteins, similar results were seen as above.LRA+AALS improved the number of proteins detected overLRA alone. OSD detected an additional 14 proteins (specificproteins not listed).We next sought to determine if onemethod detectedmore low
abundance HDL associated proteins. In this analysis, only typicalHDL associated proteins were considered. Spectral counts weresummed and ranked across fractions for known HDL associatedproteins. The 10 proteins with the lowest total spectral counts inthe HDL size range are listed in Table 1 and are marked as “+” ifpresent by that method. OSD detected three additional lowabundance HDL associated proteins compared to LRA+AALS.Both OSD and LRA+AALS detected three additional proteinsover LRA alone.
Figure 2.Unadjusted spectral counts for a given HDL associated proteins across gel-filtered plasma fractions in the HDL size range. LRA (black), LRA+AALS (dashed), and OSD (gray) methods.
Table 1. Presence or Absence of Lowest Abundance HDLAssociated Proteins by Methoda
LRA LRA+AALS OSD
C4b-binding protein α-chain − − +zinc-α-2-glycoprotein − − +ApoM − + +ApoF − − +ApoL1 + + +ApoC-II + + +afamin − + +glycoprotein phospholipase D + + +ApoD − + +comp. C2 + + +sum 4 7 10
aSymbols indicate the presence (+) or absence (−) of the protein byeach method.
Figure 1. Venn diagram of the number of typical HDL associated andnontypical HDL associated proteins detected by MS. Number ofproteins detected from HDL size range fractions (20−30) among threemethods of preparation: lipid removal agent (LRA), lipid removal agentwith anionic acid labile surfactant (LRA + AALS), and organic solventdelipidation (OSD).
Journal of Proteome Research Article
DOI: 10.1021/acs.jproteome.5b00270J. Proteome Res. XXXX, XXX, XXX−XXX
D

We next determined if one method improved spectral countsacross the HDL lipoprotein range. All proteins were analyzed,and in general, all three methods located a given protein in similarregions of the elution profile as expected. However, we did notesome key differences, with examples shown in Figure 2. ForHDLs two most well recognized proteins, apoA-I and apoA-II,LRA+AALS improved spectral counts across the HDL size rangecompared to OSD and LRA alone. In other words, the additionof AALS to LRA produced taller peak profiles for these proteins.For PON-1 and apoJ (clusterin), less abundant but well-knownHDL associated proteins, similar results were seen. The OSDmethod resulted in a blunted smaller peak with overall decreasedspectral counts, whereas the LRA methods, particularly the LRA+AALS, resulted in a taller, more featured peak. In fact, the OSDmethodmissed a peak shoulder (fractions 26−28) of PON-1 thatis clearly apparent with both LRA methods. Table 2 shows the
percent sequence coverage of some of HDL most recognizedproteins. Addition of AALS to LRA improved the sequencecoverage of almost all proteins.Finally, we ranked the top 10most abundant HDL proteins (as
judged by overall spectral counts) detected by each method(Figure 3). ApoA-I was the top protein detected using the LRA+AALS method. Albumin was also the top protein for the LRAmethod, but with spectral counts comparable to ApoA-I. The topprotein detected by OSD, with >1400 spectral counts, wasalbumin. ApoA-I was the fourth most abundant protein by OSD.Similar analyses were conducted to evaluate proteins in the
LDL size range. Proteins were classified as typical LDL associatedversus nontypical LDL associated proteins, where typical LDLassociated proteins were defined as those found to associate with
Figure 3. Top 10 HDL associated proteins by total spectral counts across the HDL size range detected by MS using LRA, LRA+AALS, and OSD.
Figure 4. Venn diagram of the number of typical LDL associated andnontypical LDL associated proteins. Proteins detected byMS from LDLsize range fractions (13−19) by LRA, LRA+AALS, and OSD.
Table 2. Percent (%) Sequence Coverage of Common HDLAssociated Proteinsa
LRA LRA+AALS OSD
ApoA-I 55.8 62.6 44.9ApoA-II 69.0 69.0 53.0ApoA-IV 7.56 20.7 18.2PON-1 8.5 22.0 3.9ApoC-II 23.8 8.9ApoC-III 16.2 27.3 27.3ApoJ 19.6 23.8 19.4
aPercent sequence coverage of a given protein in fraction 25. Thesedata were generated using Scaffold (version 4.3.4, Proteome SoftwareInc., Portland, OR).
Journal of Proteome Research Article
DOI: 10.1021/acs.jproteome.5b00270J. Proteome Res. XXXX, XXX, XXX−XXX
E
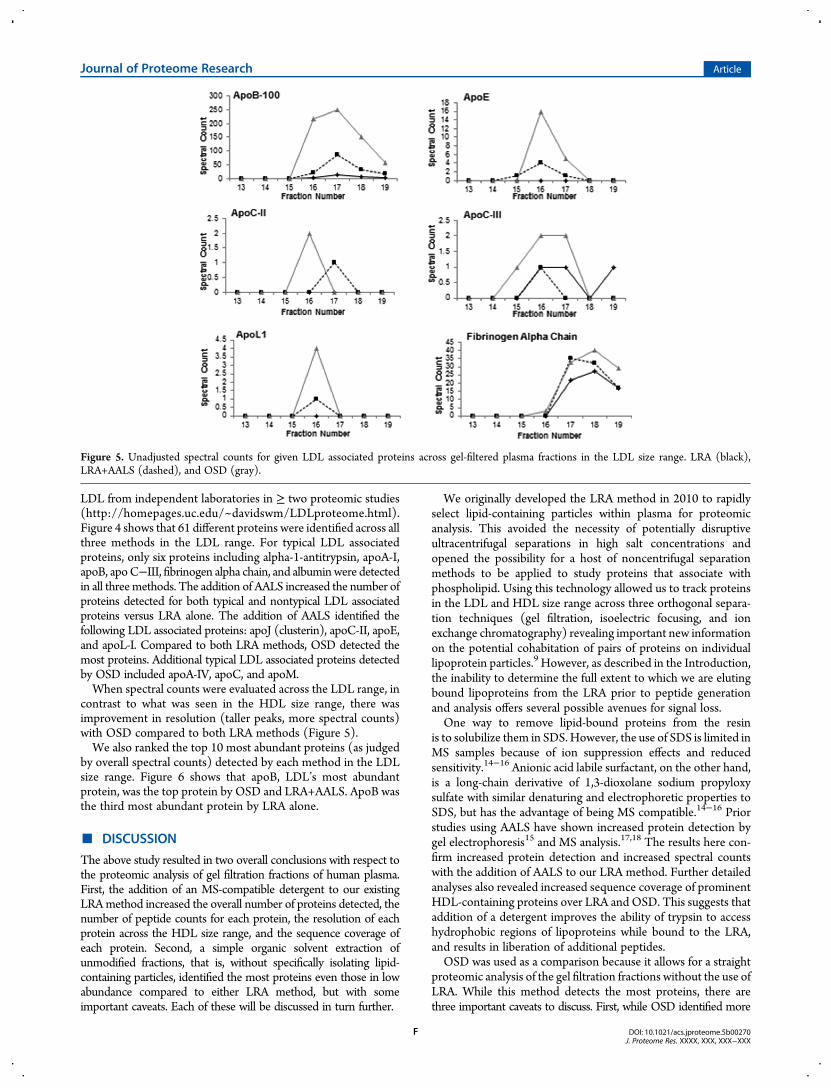
LDL from independent laboratories in ≥ two proteomic studies(http://homepages.uc.edu/~davidswm/LDLproteome.html).Figure 4 shows that 61 different proteins were identified across allthree methods in the LDL range. For typical LDL associatedproteins, only six proteins including alpha-1-antitrypsin, apoA-I,apoB, apoC−III, fibrinogen alpha chain, and albuminwere detectedin all threemethods. The addition of AALS increased the number ofproteins detected for both typical and nontypical LDL associatedproteins versus LRA alone. The addition of AALS identified thefollowing LDL associated proteins: apoJ (clusterin), apoC-II, apoE,and apoL-I. Compared to both LRA methods, OSD detected themost proteins. Additional typical LDL associated proteins detectedby OSD included apoA-IV, apoC, and apoM.When spectral counts were evaluated across the LDL range, in
contrast to what was seen in the HDL size range, there wasimprovement in resolution (taller peaks, more spectral counts)with OSD compared to both LRA methods (Figure 5).We also ranked the top 10 most abundant proteins (as judged
by overall spectral counts) detected by each method in the LDLsize range. Figure 6 shows that apoB, LDL’s most abundantprotein, was the top protein by OSD and LRA+AALS. ApoB wasthe third most abundant protein by LRA alone.
■ DISCUSSION
The above study resulted in two overall conclusions with respect tothe proteomic analysis of gel filtration fractions of human plasma.First, the addition of an MS-compatible detergent to our existingLRAmethod increased the overall number of proteins detected, thenumber of peptide counts for each protein, the resolution of eachprotein across the HDL size range, and the sequence coverage ofeach protein. Second, a simple organic solvent extraction ofunmodified fractions, that is, without specifically isolating lipid-containing particles, identified the most proteins even those in lowabundance compared to either LRA method, but with someimportant caveats. Each of these will be discussed in turn further.
We originally developed the LRA method in 2010 to rapidlyselect lipid-containing particles within plasma for proteomicanalysis. This avoided the necessity of potentially disruptiveultracentrifugal separations in high salt concentrations andopened the possibility for a host of noncentrifugal separationmethods to be applied to study proteins that associate withphospholipid. Using this technology allowed us to track proteinsin the LDL and HDL size range across three orthogonal separa-tion techniques (gel filtration, isoelectric focusing, and ionexchange chromatography) revealing important new informationon the potential cohabitation of pairs of proteins on individuallipoprotein particles.9 However, as described in the Introduction,the inability to determine the full extent to which we are elutingbound lipoproteins from the LRA prior to peptide generationand analysis offers several possible avenues for signal loss.One way to remove lipid-bound proteins from the resin
is to solubilize them in SDS. However, the use of SDS is limited inMS samples because of ion suppression effects and reducedsensitivity.14−16 Anionic acid labile surfactant, on the other hand,is a long-chain derivative of 1,3-dioxolane sodium propyloxysulfate with similar denaturing and electrophoretic properties toSDS, but has the advantage of being MS compatible.14−16 Priorstudies using AALS have shown increased protein detection bygel electrophoresis15 and MS analysis.17,18 The results here con-firm increased protein detection and increased spectral countswith the addition of AALS to our LRA method. Further detailedanalyses also revealed increased sequence coverage of prominentHDL-containing proteins over LRA and OSD. This suggests thataddition of a detergent improves the ability of trypsin to accesshydrophobic regions of lipoproteins while bound to the LRA,and results in liberation of additional peptides.OSD was used as a comparison because it allows for a straight
proteomic analysis of the gel filtration fractions without the use ofLRA. While this method detects the most proteins, there arethree important caveats to discuss. First, while OSD identified more
Figure 5. Unadjusted spectral counts for given LDL associated proteins across gel-filtered plasma fractions in the LDL size range. LRA (black),LRA+AALS (dashed), and OSD (gray).
Journal of Proteome Research Article
DOI: 10.1021/acs.jproteome.5b00270J. Proteome Res. XXXX, XXX, XXX−XXX
F

proteins in general in both the HDL and LDL size range, some ofthese proteinsmay not necessarily be lipid bound and could representfree proteins found in plasma. This is reflected in the 14 additionalnonconsensus HDL proteins and 24 nonconsensus LDL proteinsdetected by OSD, most of which were immunoglobulins. Thus, ifone is focused on the proteome of lipoproteins, an additionalmethod is required to establish whether identified proteins arebound to lipid. Second, for proteins in the HDL range, there was adecrease in detection and sequence coverage in the HDL sizerange by OSD. It is unclear why this occurred but may be due tothe presence of high abundance nonlipid associated proteins (i.e.,albumin >1400 counts) thatmonopolize the duty cycle of themassspectrometer resulting in a lower mass spectrometer signalintensity and loss of protein detection. This idea is furthersupported by the improved protein detection in the LDL sizerange, where there were less proteins in general. Third, while notdirectly a MS data processing or analysis issue, it should be alsonoted from a work flow standpoint, OSD is a longer and moretechnically difficult process, which requires desalting by dialysis,solubilization of a protein pellet, and an organic layer extraction.This was one reason we developed the LRA method initially.However, given the ability to detect more proteins in both the
HDL and LDL size range, OSDdoes offer some advantages andmaybe ideal for identifying candidate proteins in biological samples.Additionally, OSD may offer improved detection in the LDL sizerangemaking it useful to study the LDLproteome; however, spectralcounts were too low to definitively conclude this. The advantagesand limitations of each method are outlined in Table 3.It should be noted that although 70 typical HDL associated
proteins were identified by at least one method, some of HDLswell-known proteins including cholesteryl ester transfer protein,
phospholipid transfer protein, and lecithin:cholesterol acyltrans-ferase were not detected by any method. Lack of detection islikely because these proteins are lower in abundance and fallbelow our limit of detection. Similar results have been reportedby others.19−23 Thus, the methods presented here are not idealfor quantitation of these low abundance proteins.
■ CONCLUSIONSIn conclusion, we found that the addition of an MS-compatibledetergent improves protein detection of lipid-bound proteinsseparated fromhuman plasma by gel filtrationwhen a lipid bindingresin was used.While a straight analysis of the fractions without the
Table 3. Advantages and Limitations of Three MethodsTo Analyze Lipid Associated Proteins
method advantages limitations
LRA can be prepared in a 96-well plate
fewer proteins compared to OSD
no dialysis or desaltingneeded
selects for lipid-boundproteins
LRA+AALS can be prepared in a 96-well plate
fewer proteins compared to OSD
no dialysis or desaltingneeded
added cost and steps of AALS
selects for lipid-boundproteins
AALS requires complete lysis priorto MS.
improved sequencecoverage
OSD greater number ofproteins detected
detects non lipid-bound proteins
dialysis and solubilization required
Figure 6. Top 10 LDL associated proteins by total spectral counts across the LDL size range detected by MS using LRA, LRA+AALS, and OSD.
Journal of Proteome Research Article
DOI: 10.1021/acs.jproteome.5b00270J. Proteome Res. XXXX, XXX, XXX−XXX
G

use of a phospholipid binding agent detected more proteins, theinability to confidently determine the lipidation status of theidentified proteins was viewed as a clear disadvantage.
■ ASSOCIATED CONTENT*S Supporting Information
Phospholipid content in fractions separated by gel filtration ofplasma versus HDL and LDL separated by ultracentrifugation froma single subject. Comparisons of protein elutions from the LRAwith various detergents. Relative determination of phospholipidcoeluting with proteins off of the LRA. HDL-associated proteins bythe method identified. Data for all proteins identified and theirpeptide count distributions across each fraction. The SupportingInformation is available free of charge on the ACS Publicationswebsite at DOI: 10.1021/acs.jproteome.5b00270.
■ AUTHOR INFORMATIONCorresponding Author
*E-mail: [email protected]. Phone: 513-636-4744. Fax:513-696-7486.Notes
The authors declare no competing financial interest.
■ ACKNOWLEDGMENTSThis work was supported by National Institutes of Health HeartLung and Blood Institute, K23HL118132 to A.S.S., R01HL67093and R01HL104136 to W.S.D., and R01HL111829 to L.J.L. Massspectrometry data were collected in the UC Proteomics Labo-ratory on the 5600 +TripleTof system funded in part through anNIHshared instrumentation grant (S10 RR027015-01; KD Greis-PI).
■ ABBREVIATIONS:LRA, lipid removal agent; AALS, anionic acid labile surfactant;OSD, organic solvent delipidation; RT, room temperature; AB,ammonium bicarbonate
■ REFERENCES(1) James, R. W.; Hochstrasser, D.; Tissot, J. D.; Funk, M.; Appel, R.;Barja, F.; Pellegrini, C.; Muller, A. F.; Pometta, D. Protein heterogeneityof lipoprotein particles containing apolipoprotein A-I withoutapolipoprotein A-II and apolipoprotein A-I with apolipoprotein A-IIisolated from human plasma. J. Lipid Res. 1988, 29, 1557−1571.(2) Vaisar, T.; Pennathur, S.; Green, P. S.; Gharib, S. A.; Hoofnagle, A.N.; Cheung, M. C.; Byun, J.; Vuletic, S.; Kassim, S.; Singh, P.; Chea, H.;Knopp, R. H.; Brunzell, J.; Geary, R.; Chait, A.; Zhao, X. Q.; Elkon, K.;Marcovina, S.; Ridker, P.; Oram, J. F.; Heinecke, J. W. Shotgunproteomics implicates protease inhibition and complement activation inthe antiinflammatory properties of HDL. J. Clin. Invest. 2007, 117, 746−756.(3) Heinecke, J. W. The HDL proteome: A markerand perhapsmediatorof coronary artery disease. J. Lipid Res. 2009, 50 (Suppl.),S167−S171.(4) Shah, A. S.; Tan, L.; Long, J. L.; Davidson, W. S. Proteomicdiversity of high density lipoproteins: Our emerging understanding of itsimportance in lipid transport and beyond. J. Lipid Res. 2013, 54, 2575−2585.(5) Bancells, C.; Canals, F.; Benitez, S.; Colome, N.; Julve, J.; Ordonez-Llanos, J.; Sanchez-Quesada, J. L. Proteomic analysis of electronegativelow-density lipoprotein. J. Lipid Res. 2010, 51, 3508−3515.(6) Dashty, M.;Motazacker, M.M.; Levels, J.; de Vries, M.;Mahmoudi,M.; Peppelenbosch, M. P.; Rezaee, F. Proteome of human plasma verylow-density lipoprotein and low-density lipoprotein exhibits a link withcoagulation and lipid metabolism. Thromb. Haemostasis 2014, 111,518−530.
(7) Lindgren, F. T.; Elliott, H. A.; Gofman, J. W. The ultracentrifugalcharacterization and isolation of human blood lipids and lipoproteins,with applications to the study of atherosclerosis. J. Phys. Colloid Chem.1951, 55, 80−93.(8) Gordon, S.; Durairaj, A.; Lu, J.L.; Davidson, W.S. High-densitylipoprotein proteomics: Identifying new drug targets and biomarkers byunderstanding functionality. Curr. Cardiovasc. Risk Rep. 2010, 4 (1), 1−8.(9) Gordon, S. M.; Deng, J.; Tomann, A. B.; Shah, A. S.; Lu, L. J.;Davidson, W. S. Multidimensional coseparation analysis revealsprotein−protein interactions defining plasma lipoprotein subspecies.Mol. Cell. Proteomics 2013, 12, 3123−3134.(10) Gordon, S. M.; Deng, J.; Lu, L. J.; Davidson, W. S. Proteomiccharacterization of human plasma high density lipoprotein fractionatedby gel filtration chromatography. J. Proteome Res. 2010, 9, 5239−5249.(11) Keller, A.; Nesvizhskii, A. I.; Kolker, E.; Aebersold, R. Empiricalstatistical model to estimate the accuracy of peptide identifications madeby MS/MS and database search. Anal. Chem. 2002, 74, 5383−5392.(12) Nesvizhskii, A. I.; Keller, A.; Kolker, E.; Aebersold, R. A statisticalmodel for identifying proteins by tandem mass spectrometry. Anal.Chem. 2003, 75, 4646−4658.(13) Davidson, W. S.; Silva, R. A.; Chantepie, S.; Lagor, W. R.;Chapman, M. J.; Kontush, A. Proteomic analysis of defined HDLsubpopulations reveals particle-specific protein clusters: Relevance toantioxidative function. Arterioscler., Thromb., Vasc. Biol. 2009, 29, 870−876.(14) Meng, F.; Cargile, B. J.; Patrie, S. M.; Johnson, J. R.; McLoughlin,S. M.; Kelleher, N. L. Processing complex mixtures of intact proteins fordirect analysis by mass spectrometry. Anal. Chem. 2002, 74, 2923−2929.(15) Ross, A. R.; Lee, P. J.; Smith, D. L.; Langridge, J. I.; Whetton, A.D.; Gaskell, S. J. Identification of proteins from two-dimensionalpolyacrylamide gels using a novel acid-labile surfactant. Proteomics 2002,2, 928−936.(16) Zeller, M.; Brown, E. K.; Bouvier, E. S.; Konig, S. Use of an acid-labile surfactant as an SDS substitute for gel electrophoresis andproteomic analysis. J. Biomol. Tech. 2002, 13, 1−4.(17) Konig, S.; Schmidt, O.; Rose, K.; Thanos, S.; Besselmann, M.;Zeller, M. Sodium dodecyl sulfate versus acid-labile surfactant gelelectrophoresis: Comparative proteomic studies on rat retina andmousebrain. Electrophoresis 2003, 24, 751−756.(18) Nomura, E.; Katsuta, K.; Ueda, T.; Toriyama, M.; Mori, T.;Inagaki, N. Acid-labile surfactant improves in-sodium dodecyl sulfatepolyacrylamide gel protein digestion for matrix-assisted laserdesorption/ionization mass spectrometric peptide mapping. J. MassSpectrom. 2004, 39, 202−207.(19) Heller, M.; Stalder, D.; Schlappritzi, E.; Hayn, G.; Matter, U.;Haeberli, A. Mass spectrometry-based analytical tools for the molecularprotein characterization of human plasma lipoproteins. Proteomics 2005,5, 2619−2630.(20) Holzer, M.; Birner-Gruenberger, R.; Stojakovic, T.; El-Gamal, D.;Binder, V.; Wadsack, C.; Heinemann, A.; Marsche, G. Uremia altersHDL composition and function. J. Am. Soc. Nephrol. 2011, 22, 1631−1641.(21) Holzer, M.; Wolf, P.; Curcic, S.; Birner-Gruenberger, R.; Weger,W.; Inzinger, M.; El-Gamal, D.; Wadsack, C.; Heinemann, A.; Marsche,G. Psoriasis alters HDL composition and cholesterol efflux capacity. J.Lipid Res. 2012, 53, 1618−1624.(22) Karlsson, H.; Leanderson, P.; Tagesson, C.; Lindahl, M.Lipoproteomics II: Mapping of proteins in high-density lipoproteinusing two-dimensional gel electrophoresis and mass spectrometry.Proteomics 2005, 5, 1431−1445.(23) Watanabe, J.; Charles-Schoeman, C.; Miao, Y.; Elashoff, D.; Lee,Y. Y.; Katselis, G.; Lee, T. D.; Reddy, S. T. Proteomic profiling followingimmunoaffinity capture of high-density lipoprotein: Association ofacute-phase proteins and complement factors with proinflammatoryhigh-density lipoprotein in rheumatoid arthritis. Arthritis Rheum. 2012,64, 1828−1837.
Journal of Proteome Research Article
DOI: 10.1021/acs.jproteome.5b00270J. Proteome Res. XXXX, XXX, XXX−XXX
H