a comparison of the texture of computed tomography and...
TRANSCRIPT

Medical Engineering & Physics 23 (2001) 313–321www.elsevier.com/locate/medengphy
A comparison of the texture of computed tomography andprojection radiography images of vertebral trabecular bone using
fractal signature and lacunarity
Geoffrey Dougherty *
Faculty of Allied Health Sciences, P.O. Box 31470, Kuwait University, Sulaibikhat 90805, Kuwait
Received 8 December 2000; received in revised form 24 March 2001; accepted 26 April 2001
Abstract
The structural integrity of trabecular bone is an important factor characterizing the biomechanical strength of the vertebra, andis determined by the connectivity of the bone network and the trabeculation pattern. These can be assessed using texture measuressuch as the fractal signature and lacunarity from a high resolution projection radiograph. Using central sections of lumbar vertebraewe compared the results obtained from high-resolution transverse projection images with those obtained from spatially registeredlow-resolution images from a conventional clinical CT scanner to determine whether clinical CT data can provide useful structuralinformation. Provided the power spectra of the CT images are corrected for image system blurring, the resulting fractal signatureis similar for both modalities. Although the CT images are blurred relative to the projection images, with a consequent reductionin lacunarity, the estimated trabecular separation obtained from the lacunarity plots is similar for both modalities. This suggeststhat these texture measures contain essential information on trabecular microarchitecture, which is present even in low resolutionCT images. Such quantitative texture measurements from CT or MRI images are potentially useful in monitoring bone strengthand predicting future fracture risk. 2001 IPEM. Published by Elsevier Science Ltd. All rights reserved.
Keywords: Texture; Trabecular bone architecture; Fractal signature; Lacunarity; Osteoporosis
1. Introduction
It has been increasingly realized that bone architectureis an important factor in determining bone strength and,consequently, fracture risk [1,2] and the spine is a usefulsite for predicting osteoporotic failures [3]. Although therelative contributions of trabecular and cortical bone tooverall bone strength are unclear [4], most studies haveconcentrated on the trabecular component since it is themetabolically more active as evidenced by remodellingdata [5]. Architectural information can be obtained non-invasively and conveniently from computed tomography(CT) images of thin (�1 mm) vertebral slices, althoughit is degraded by the poor spatial resolution of conven-tional CT scanners. The degree of blurring can beassessed by the point spread function (PSF) of the imag-ing system (or its Fourier transform, the modulation
* Fax: +965-4833662.E-mail address: [email protected] (G. Dougherty).
1350-4533/01/$20.00 2001 IPEM. Published by Elsevier Science Ltd. All rights reserved.PII: S1350- 45 33 (01)00 04 8- 0
transfer function (MTF)) for the field of view (FOV) andreconstruction filter used, and its effect compensated forif the power spectrum algorithm is used to determinefractal dimension as an index of texture [6]. Sharperimages can be obtained with high-resolution CT [3,7–9], but individual trabeculae (typically 0.10–0.15 mmthick) are still not resolved, and such scanners are notwidely available. Microcomputed tomography [10,11]can generate 3-D images of trabecular bone specimensat resolutions of around 15 µm, but can only be usedfor small tissue samples at peripheral skeletal sites.
There have been a number of studies [12,13] that haveused conventional (lateral) projection radiographs andtraditional histomorphometric techniques to assess tra-becular structure. However, projection radiographs arenecessarily degraded by superimposition of cortical boneon the trabecular structure: and although the lateral pro-jection can be obtained in vivo, it is not as informative asthe transverse projection [14] especially if the vertebralendplates are removed. It is not clear how much texturalinformation obtained from a high resolution image such

314 G. Dougherty / Medical Engineering & Physics 23 (2001) 313–321
as a projection radiograph taken using a mammographyunit (with an in-plane spatial resolution of about 50 µm)survives in a low resolution image such as a conven-tional CT image (with a spatial resolution of about 0.4mm).
In this study transverse projection radiographs of cen-tral slices from five cadaver L3 vertebrae were obtainedusing a mammography unit, and compared with corre-sponding spatially registered images taken at differentslice thicknesses using a conventional CT scanner. Theprojection radiographs were taken as the “gold standard”and texture values obtained from them were comparedwith those obtained from the CT images. A plethora ofhistomorphometric indices has been associated with themeasurement of texture [7,14–16], but fractal signatureand lacunarity (see Section 2.5) were considered to besuperior because they are not predicated on the parallelplate model [17], which does not adequately describevertebral trabecular bone [18,19], and are independentof scaling differences between images [20]. Both fractaldimension and lacunarity are second order statisticalmeasures which quantify the relationships betweenneighbouring pixels, and are thus inherently more ableto characterize the trabeculation pattern than first ordermeasures [4] such as trabecular separation (Tb.Sp), inter-cept trabecular thickness (I.TH) or intercept trabecularseparation (I.SP). Recent studies have confirmed thatfractal analysis is able to characterize bone microarchi-tecture [21,22]: and the fractal dimension of cubes ofvertebral trabecular bone has been shown to be highlycorrelated (r=0.84) with their elastic modulus [23]. Theaim of this study was to investigate whether textureinformation measured from high-resolution projectionimages survives in spatially-registered low-resolutionimages from a conventional clinical CT scanner.
2. Materials and methods
2.1. Vertebral section
The L3 lumbar vertebrae were collected at autopsyfrom five male donors with a mean age of 48±3 years.All had died suddenly in accidents or from acute dis-eases. None had a history of metabolic bone disease orbone fractures. The mean bone mineral density (BMD)of the vertebrae was 225±15 mg cm�3, assessed by com-paring CT scans at a slice thickness of 10 mm with astandard mineral-equivalent bone QCT phantom (ImageAnalysis Inc., Irvine, CA).
A central transverse section, about 7 mm in width,was sawn from each of the vertebrae using a fast oscillat-ing saw after removing the spinous processes. Two smallholes drilled axially through each vertebral section about1.6 cm apart were used as fiducial markers.
2.2. Projection images
Radiographs of each vertebral section were takenusing a dedicated mammography unit (SenographeDMR, General Electric), with a Kodak min-R mediumfilm/screen cassette. A focal spot size of 0.1 mm, afocus-to-film distance of 60 cm and an exposure of 20mAs at 28 kVp were used. The vertebral slices wereplaced about 27 cm from the plane of the focal spot andproduced images with a magnification of 2.13. The lowkVp ensured a large optical density between regionscomprising primarily bone and those primarily marrow.The films were processed in a Kodak RP X-OMAT pro-cessor (model M6B) at 35°C using a standard 90 sdeveloping cycle.
The radiographs were digitized with a Vidar VX-12digitizer (Vidar Systems, Herndon, VA) at 400 dpi(corresponding to a sampling distance of 63.5 µm on themagnified radiograph, or 30 µm in the actual vertebra)and 8-bit pixel quantization, to produce images of700×700 pixels covering regions similar to thoseextracted from the corresponding CT images. An effortwas made to orient the vertebrae prior to scanning toroughly match their appearance in the CT scans. Theimages were then scaled down to the same size as thefinal CT images (viz. 350×350 pixels), with a pixel sizeequivalent to 60 µm in the bone.
2.3. CT images
Axial scans were taken through the middle of each ofthe vertebral sections using a CT scanner (Sytec 3000,General Electric) at 120 kVp and 100–130 mA, withslice thicknesses of 1, 3 and 5 mm. The scan time was3 s per view and the scan field of view (FOV) was 25cm. The images were retrospectively reconstructed to aFOV of 6 cm using the supplied bone kernel, conditionswhich optimize the spatial resolution of this scanner[24]. Each of the images was available as 512×512 pix-els (each of size 120 µm) with 12-bit quantization.
Direct digital output of the CT images from the scan-ner was not available. Instead, the grey-scale videoimages from the CT monitor, displayed with windowvalues (WL=450, WW=750) chosen to avoid clipping,were transferred via an Autosync Video Convertor(Folsom Research, Rancho Cordova, CA) to a frameg-rabber board (Kontron Electronik GmbH, Eching,Germany) in an IBM Pentium microcomputer. The videoconvertor automatically converts the non-standard GEvideo signal to a composite PAL video signal, adjustingthe scan rate as necessary. The combined effect of videoconversion and framegrabbing essentially degraded theintensity quantization from 12-bits to 8-bits per pixel.The convertor allows the user to vary the horizontal andvertical scaling of the output image: a circle of 400 pix-els diameter was drawn on the CT image, surrounding
315G. Dougherty / Medical Engineering & Physics 23 (2001) 313–321
the vertebra, and the scaling adjusted to ensure a circle ofthe same diameter on the grabbed image. The resultingdigitized image (768×512 pixels) included the vertebralcross-section and extraneous annotation from the CTscanner. A region of 175×175 pixels was extracted fromeach of the three images, to include the two fiducial mar-kers and extend to the cortical rim on the anterior surfaceof the vertebra. These images were scaled using a bilin-ear transform within Scion Image for Windows (ScionCorporation, Frederick, MD), a port of the publicdomain image processing and analysis program NIHImage, to produce images of 350×350 pixels with a pixelsize equivalent to 60 µm in the bone, matching those ofthe projection images. The images were then histogramequalized to improve their contrast.
2.4. Registration and skeletonization of the images
Scion Image conveniently allows 2-D images to bespatially registered to each other, by translating and rot-ating them into alignment based on (a minimum of three)fiducial points in each image. An interactive interfacerequires the user to click on visible landmarks in a refer-ence image, and then click on corresponding points inthe other images. The projection image was used as thereference image, and four fiducial markers (the centresof the two drilled holes, and the centres of two smalldark regions which could be unambiguously located inall the images) were used. After registration, an identicalregion of interest (ROI) of 256×256 pixels was extractedfrom each image located midway between the drilledholes (but not including them) and extending close tothe anterior cortical rim (but not including it).
Thresholding the images to produce binary images isnecessary prior to skeletonization, but the position of thefinal skeleton is significantly affected by minor changesin the shape of the binarized features as a result of thechoice of thresholding algorithm and the threshold cri-terion adopted. In addition, the images had a non-uni-form background level. This effect was removed by sub-tracting a background image (obtained by convolvingeach image with a 63×63 mask, whose elements wereall unity) from each image. For subsequent thresholdingan optimal thresholding technique based on discriminantanalysis, which maximizes the separability of the result-ant classes [25], was adopted. The binarized images wereskeletonized by repeated erosion based on eight-connec-tedness to erode features down to a single-pixel thickskeleton. The skeletonized images were then invertedand logically ANDed with the original grey scale imagesto superimpose the skeletons on the original images.
2.5. Texture measurements
2.5.1. Fractal signatureThe radial power spectrum of an image was generated
by averaging pixel values from its 2-D Fourier power
spectrum over increasingly larger annuli. Imaging sys-tem blurring was deconvolved from the measured CTpower spectrum by dividing by the square of the (1-D)MTF [6]: deconvolution of the scanner blurring reducesthe slope of the power spectrum and results in higherestimates of the fractal dimension, which are inde-pendent of the scanner used. No correction for systemnoise was made since this has been shown to be minimalin CT images of diagnostic quality [6]. No deconvol-ution was performed on the projection images since blur-ring was minimal.
Since trabecular bone has limited fractalness, the localfractal dimension was obtained as a function of spatialfrequency to produce a fractal signature of the imagewhich is more useful in classifying different texturesthan the global fractal dimension [13]. The local fractaldimension is given by
D�4�b/2 (1)
where b is the local slope of the corrected radial powerspectrum, and was calculated using overlapping win-dows of spatial frequency (terms 1–15, 9–23, 17–31 etc.)up to the Nyquist frequency.
2.5.2. LacunarityLacunarity refers to the distribution of gap sizes in
data: the greater the range in gap size distribution, themore lacunar the data [26]. It was originally developedto describe a property of fractals, but is not predicatedon self-similarity (i.e. fractalness). An efficient algorithmfor estimating lacunarity analyses deviations of animage’s intensity distribution from translational invari-ance using gliding-box sampling [27]. Lacunarity can bedefined in terms of the local first and second moments,measured for different neighbourhood sizes, about everypixel in the image, i.e.
L(r)�1�var(r)/mean2(r) (2)
where mean(r) and var(r) are the mean and variance ofthe pixel values, respectively, for a neighbourhood sizer, using all neighbourhoods of that size within the image(viz. exhaustive sampling). The lacunarity was measuredfrom the binarized images as is common practice [28].A plot of lacunarity against neighbourhood size showsthe scale dependency of spatial nonstationarity in theimage. In order to concentrate on the shape of the plot,the normalized lacunarity, NL(r), was calculated bycombining the lacunarity of an image, L(r), with thelacunarity of its complemented image cL(r), i.e.
NL(r)�2�(1/L(r)�1/cL(r)) (3)
Lacunarity plots are robust to the presence of noiseand blurring within an imaging system so that correc-tions for these effects need not be considered.
316 G. Dougherty / Medical Engineering & Physics 23 (2001) 313–321
3. Results
The projection images are visibly superior to the CTimages due to their better spatial resolution in the axialplane, even though their out-of-plane resolution(corresponding to the vertebral thickness of about 7 mm)is worse than the out-of-plane resolution (equivalent tothe slice thickness) of the CT images. As expected, theprojection images are also superior to the high-resolutionCT images of excised bone presented in the literature[9].
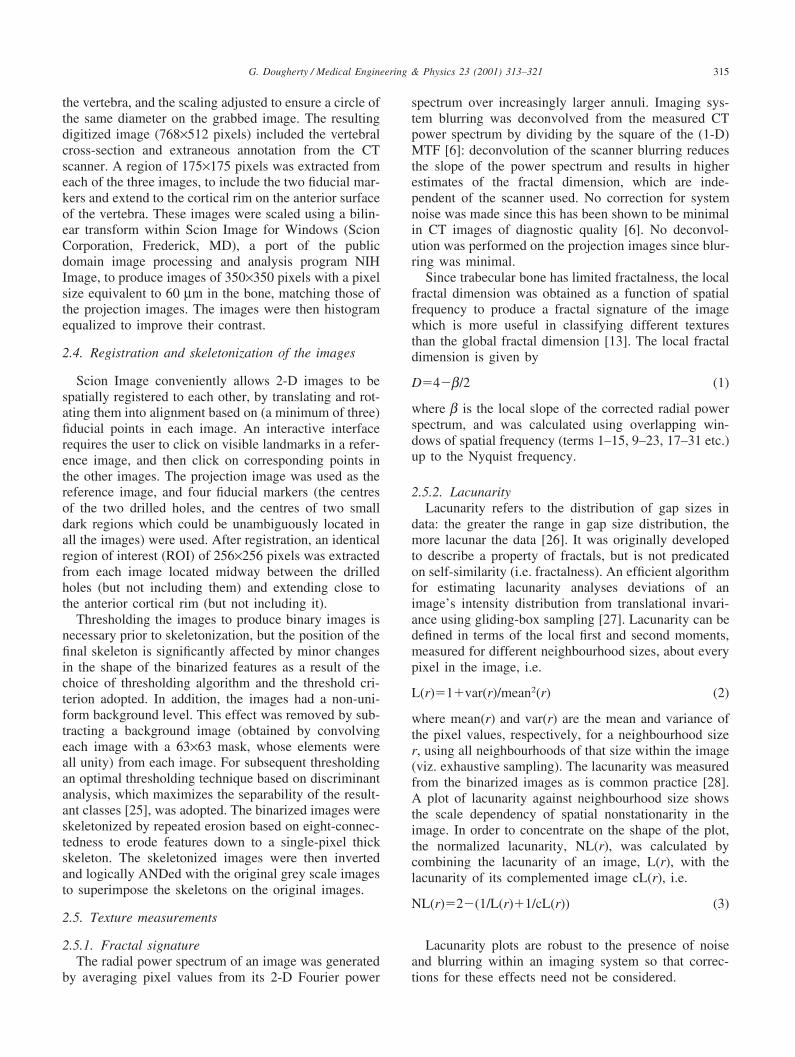
Fig. 1 shows the result of skeletonization superim-posed on the original grey-scale image for a typical pro-jection image, and Fig. 2 shows the results for the corre-sponding CT images. Our protocol resulted in plausibleskeletons in all the images, despite the known sensitivityof the skeletonization technique to thresholding levels[29]. Some features can appear less bright in an imagedue to partial volume averaging. They may then fallbelow the chosen threshold for binarization, and not con-tribute to the skeleton. These features could be includedif a lower threshold was chosen, but then the resultingskeleton would change position: lowering the thresholdarbitrarily to include less bright features resulted in aless successful visible match to the features in the orig-inal grey-scale image. We found that Otsu thresholdingwas simple and quick to implement and produced skel-etons similar to those using a segmentation algorithmbased on local directional derivatives [9]. It was signifi-cantly more robust than using the mode [30] or localmean [31]. Subtraction of the variable background prior
Fig. 1. A projection image of a typical excised vertebral sectionobtained using a mammography unit, after digitizing to obtain a pixelsize of 60 µm. The skeleton is shown superimposed on the image.
to thresholding obviated the need to use adaptive thres-holding [8,14] which can be adversely affected byimage noise.
Amongst the registered CT images, it is possible toidentify regions that correspond with features in the cor-responding projection image even though the CT imagesare much more blurred. A visual comparison of Figs. 1and 2 illustrates a general topological correspondence.Convolving the projection images with the PSF of theCT scanner should produce images resembling the CTimages. Initially, a 2-D radially symmetric PSF with aGaussian profile and a full width at half maximum(FWHM) of 0.97 mm [24] was used: but this did notproduce a convolved image that matched the features inthe CT images closely (Fig. 3 (a)), and using a Lorentz-ian PSF was even more unsuccessful (not shown). How-ever, using the circularly symmetrized experimental PSF(obtained by scanning thin tungsten wires [24]) produceda closer match (Fig. 3(b)) to the CT images (Fig. 2).(The number of nodes in Fig. 3(a) and (b), after skel-etonization, was 16 and 22 respectively). This demon-strates that the subtle shape of the PSF is cruciallyimportant.
Fig. 4 shows the fractal signatures of a typical projec-tion image and the corresponding CT images. The localfractal dimension of the images is not constant, indicat-ing that they have limited fractalness, and tends to fallwith increased spatial frequency. Deconvolution of thescanner blurring resulted in local fractal dimension esti-mates within the theoretically allowed range of 2.0–3.0,except for the lowest and highest spatial frequencies.The low frequency estimates include the first few termsof the power spectral density which are notoriously dif-ficult to fit [32,33], and the high frequency estimates maybe subject to aliasing errors. The fractal signature of thehigh-resolution projection image is slightly higher thanthe CT images indicating that the latter may not havebeen corrected sufficiently using the scanner MTF. Itshows a similar variation with spatial frequency, butthere is less variability indicating greater precision in thevalues of local fractal dimension: this is presumably aconsequence of the superior spatial resolution of theimage. The average fractal dimension over the mid-rangeof frequencies (33–95 cycles/image) is similar for theCT images and the corresponding projection images(Table 1). Indeed, using paired t-tests there is no statisti-cal difference (at the P=0.05 level) between the fractalsignatures of the three CT images and the correspondingprojection image for any of the vertebral sections.
The normalized lacunarity plots of the same imagesare non-linear, confirming their limited fractalness (Fig.5). The lacunarity of the three CT images is similar, dif-fering only in the mid-range of spatial frequencies.Within this range, the lacunarity is less for larger slicethickness: this is the expected consequence of increasedblurring due to an increase in partial volume averaging

317G. Dougherty / Medical Engineering & Physics 23 (2001) 313–321
Fig. 2. CT images of a typical excised vertebral section, scaled and spatially registered with the projection image of Fig. 1: the slice thicknessesare (a) 1 mm, (b) 3 mm, and (c) 5 mm. The skeletons are shown superimposed on the images.
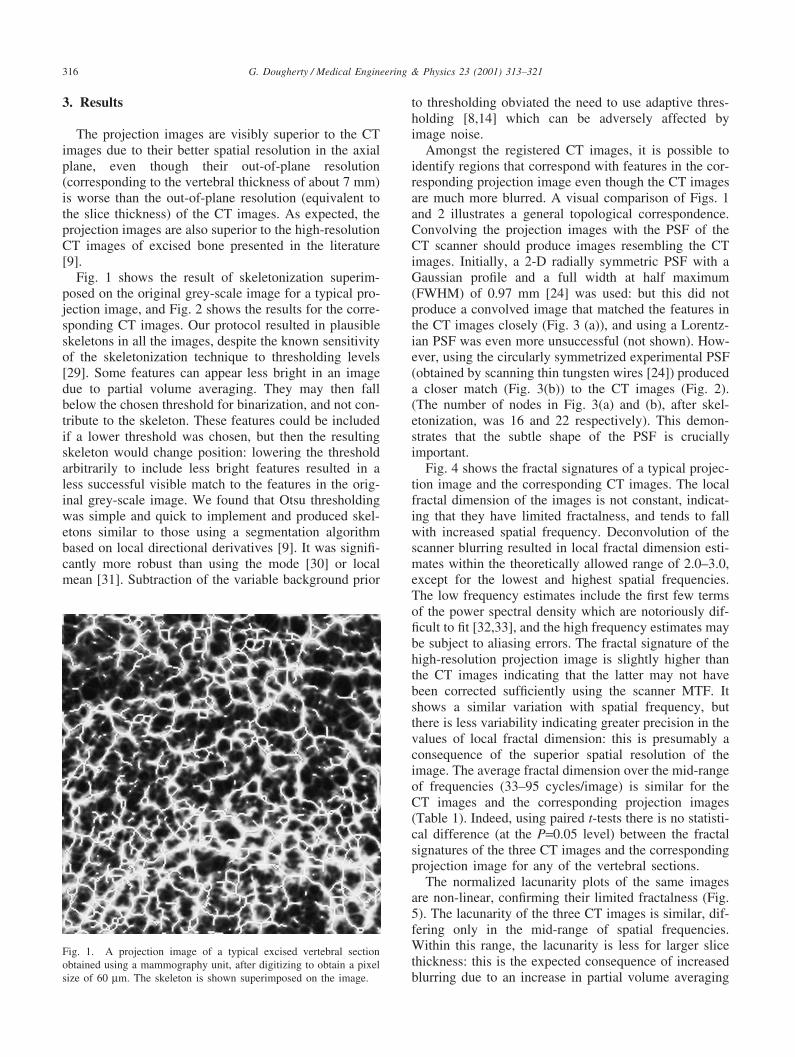
in the z-direction with larger slice thickness. Thelacunarity decay is characteristic of an image comprisinga distribution of features of similar size: the lacunarityfalls relatively slowly until the size of the sampling win-dow exceeds the size of these features and is rapid there-after. The lacunarity plot for the projection image is sig-nificantly different from those for the CT images,showing a more pronounced difference in decay ratesbetween small and large sampling windows. The tran-sition between these two regions gives the characteristicrepeat size within the pattern. It can be obtained withmore reliability than with the CT images due to the morepronounced “hump” in the decay: nevertheless it is clearthat there is a distribution of sizes in the image. A plotof the deviation of the lacunarity plots from linearity(viz. a self-similar fractal) emphasizes subtle featuresthat may not be conspicuous in the lacunarity plots them-selves: and a maximum in the deviation plot will indicatethe characteristic size of the trabeculation pattern in theimage. The average values for the images from the five
vertebral sections are shown in Table 1: they are similarfor all the images, with the value for the projectionimages being determined more precisely. The averagerepeat for the projection images is 8.5±0.5 pixels, corre-sponding to a repeat distance (or trabecular separation)of 0.51±0.03 mm. This is within the range of values forthe histomorphometric index Tb.Sp (viz. 0.44–0.81 mm)derived from histological sections of the trabecular boneof a cadaver radius [9]. It is larger than the repeat value(viz. I.TH+I.SP) of 0.34±0.03 mm derived from contactradiographs of vertebral bodies [14], although this maybe an underestimate due to partial volume effects [34].
4. Discussion
During ageing, periods of rapid bone loss reduce thestrength of the bones to a greater extent than thereduction in the amount of bone (i.e. BMD) by itselfwould suggest [35]. Thus strength depends not only on

318 G. Dougherty / Medical Engineering & Physics 23 (2001) 313–321
Fig. 3. A typical projection image convolved with (a) a GaussianPSF, and (b) the symmetrized experimental PSF of the CT scanner.Both PSFs have a FWHM of 0.97 mm. The skeletons are shown super-imposed on the images.
bone mass, but also on the continuity of the trabecularlattice [36]. The trabecular network in human vertebraeloses continuity through a preferential thinning and lossof horizontal trabeculae, although changes to the verticaltrabeculae may also occur [37,38]. Such patterns of boneloss can be characterized by the connectivity of the bonenetwork and the trabeculation pattern, an indication ofwhich can be obtained from the fractal signature andlacunarity respectively.
Fig. 4. Fractal signatures of a typical series of CT images (× (1 mm),� (3 mm), + (5 mm)) and the corresponding projection image (�).
The connectivity of the horizontal trabeculae can bestbe seen in transaxial slices of the vertebra, which is whywe prefer them to the longitudinal projections used in anumber of previous studies [31,39]. The thickness of thehorizontal trabeculae of the lumbar vertebrae has beenreported to decrease in thickness from about 180 µm inthe very young to about 90 µm in the elderly, and thevertical trabeculae are about 200 µm thick [38]. For anaccurate assessment of trabecular thickness, and henceconnectivity, a spatial resolution of around 20 µm wouldbe required. Clearly, since radiation dose is inverselyproportional to the fourth power of the spatial resolution,CT scanners offering such a resolution would beunrealistic for patient examinations. Considerable tra-becular structure can be seen in high resolution trans-verse projection images (such as Fig. 1), but such imagescould not be obtained in vivo.
Connectivity is a 3-D concept, and requires a 3-Dreconstruction of the trabecular bone such as could beobtained from a series of thin 2-D slices. Estimates froma single 2-D slice will always be in error since thereis no information on the out-of-plane curvature of thetrabeculae. Although attempts have been made to definea 2-D connectivity index suitable for quantifying struc-tural integrity [8,40] the inability to properly identifynodes (viz. junctions with three or more branches) fromthe skeleton of a 2-D projection is a fundamental limi-tation. Connectivity has been shown [41] to be stronglycorrelated with 3-D nodal density (r�0.83–0.89), but lesswell correlated with 2-D nodal density (r�0.56): clearly,connections that exist in 3-D can be easily missed in 2-Dhistomorphometry. 2-D skeletons provide, at best, only aqualitative comparison of connectivity amongst imagesacquired using a similar technique: any attempt atextracting a quantitative connectivity index from themwould be misguided. Notwithstanding these caveats, itis interesting that the number of nodes in the skel-etonized CT images follows a general trend: amongst theCT images the sharpest images (t=1 mm) exhibit the
319G. Dougherty / Medical Engineering & Physics 23 (2001) 313–321
Table 1Parameters characterizing vertebral bone strength: each estimate is given as the mean (±SD) of values from five vertebral bone sections
Parameter CT images Projection image
t=1 mm 3 mm 5 mm
Number of nodes 35 (±1) 30 (±1) 25 (±1) 390 (±10)Average fractal dimension 2.79 (±0.07) 2.72 (±0.08) 2.67 (±0.10) 2.81 (±0.03)Repeat distancea (pixels) 8.6 (±0.7) 8.4 (±0.7) 8.2 (±0.7) 8.5 (±0.5)
a Equivalent to trabecular separation.
Fig. 5. Normalized lacunarity plots of a typical series of CT images(× (1 mm), � (3 mm), + (5 mm)) and the corresponding projectionimage (�).
largest number of nodes after skeletonization, with thenumber of nodes in the projection images much higherstill (Table 1).
The CT images contain essentially the same infor-mation on spatial pattern as the projection images as evi-denced by their similar fractal signatures after correctionfor the MTF of the CT scanner: although the lower spa-tial resolution of the CT images results in less preciseestimates of the fractal signatures. The lacunarity plotswere calculated from the raw CT images, with noattempt to deconvolve them with the MTF. (Indeed, thesuccess of deconvolution is limited by the noise contentof the images [42]: it is easier to correct the radial powerdensity spectra). An advantage of lacunarity is that it isnot predicated on fractalness, and is therefore useful fornatural images that may show at most only limited frac-talness: however, the effect of imaging system MTF onlacunarity has not been fully addressed in studies to date.
Clearly it is not possible to obtain information of thesame precision with a conventional CT system (with aspatial resolution of �0.4 mm) as with projection radi-ography using a mammographic system (with a spatialresolution of �50 µm). Others have compared histomor-phometric measurements obtained from high-resolutionCT of peripheral sites with data from histologic sections
[9], and demonstrated reasonable correspondence. How-ever, they had to invoke an arbitrary scaling factor whencomparing bone perimeters to compensate for the limitedresolution of the CT measurements. Such scaling is aconsequence of the fractal nature of the images: comput-ing fractal parameters, such as fractal dimension andlacunarity, rather than distances, areas or volumesaddresses the phenomenon directly and avoids the needfor such arbitrary scaling.
Although the data set is limited to five specimens fromsimilar donors, this study suggests that the structure ofvertebral trabecular bone can be studied from in vivoCT images using a conventional clinical scanner. Furtherspecimens are being examined to confirm whether thefindings are applicable to a range of bone conditions. Ofcourse there are details of the bone microstructure whichare lost in the CT images because of the reduced spatialresolution and consequent partial volume effects. How-ever, essential topological details seem to survive. Themechanical integrity of trabecular bone depends on itsconnectivity and the trabecular separation. These struc-tural determinants (described in terms of fractal signa-ture and lacunarity) are similar to those measured at highresolution from projection radiographs, although they areless precise. It is interesting that other studies [43,44]have suggested that some, but not all, histomorpoho-metric indices are largely independent of image resol-ution.
The correlation between fractal dimension and bonestrength has been demonstrated for cubes of vertebralbone excised from human cadaver spines [23]. Fractalsignature and lacunarity may be useful in patient studiesto provide an indication of bone strength, which is inad-equately characterized by BMD measurements. Theymay be useful alongside BMD measurements to betterdistinguish healthy subjects from those with bone dis-ease [40]: and may help to improve prediction of futurefracture risk in longitudinal studies. Future work will bedirected at investigating CT and MRI images from alarge patient group to establish the degree of diagnosticvalue of fractal signature and lacunarity.
320 G. Dougherty / Medical Engineering & Physics 23 (2001) 313–321
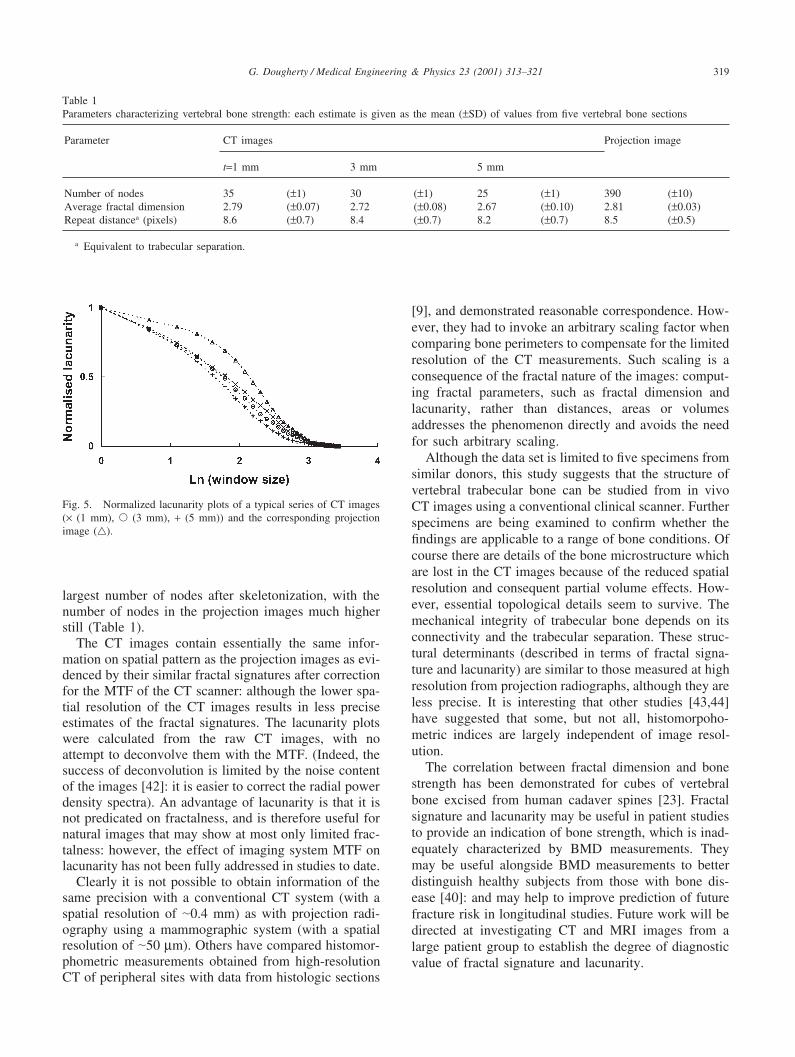
References
[1] McCubbrey DA, Goldstein SA, Cody DD, Goulet RW, Kuhn JL.The regional density, architectural, and tissue properties of ver-tebral trabecular bone and their relation to whole bone fractureproperties. Adv Bioeng 1991;20:575–81.
[2] Veenland JF, Link TM, Konermann W, Mirer N, Grashuis JL,Gelsema ES. Unraveling the role of structure and density indetermining vertebral bone strength. Calcif Tissue Int1997;61:474–9.
[3] Link TM, Majumdar S, Lin JC, Augat P, Gould RG, Newitt D,Ouyang X, Lang TF, Mathur A, Genant HK. Assessment of tra-becular structure using high resolution CT images and textureanalysis. J Comput Assist Tomog 1999;22:15–24.
[4] Vesterby A, Mosekilde L, Gundersen HJ, Melsen F, MosekildeL, Holme K, Sorensen S. Biologically meaningful determinantsof the in vitro strength of lumbar vertebrae. Bone1991;12:219–24.
[5] Cann CE. Quantitative CT for determination of bone mineral den-sity: a review. Radiology 1988;166:509–22.
[6] Chen J, Zheng B, Chang Y-H, Shaw SS, Towers JD, Gur D.Fractal analysis of trabecular patterns in projection radiographs:an assessment. Invest Radiol 1994;29:624–9.
[7] Durand EP, Ruegsegger P. High-contrast resolution of CT imagesfor bone structure analysis. Med Phys 1992;19:569–73.
[8] Chevalier F, Laval-Jeantet M, Bergot C. CT image analysis ofthe vertebral trabecular network in vivo. Calcif Tissue Int1992;51:8–13.
[9] Muller R, Hahn M, Vogel M, Delling G, Ruegsegger P. Morpho-metric analysis of noninvasively assessed bone biopsies: compari-son of high-resolution computed tomography and histologic sec-tions. Bone 1996;18:215–20.
[10] Ruegsegger P, Koller B, Muller R. A microtomographic systemfor the nondestructive evaluation of bone architecture. CalcifTissue Int 1996;58:24–9.
[11] Laib A, Ruegsegger P. Comparison of structure extractionmethods for in vivo trabecular bone measurements. Comput MedImag Graph 1999;23:69–74.
[12] Caligiuri P, Giger ML, Favus M. Multifractal radiographic analy-sis of osteoporosis. Med Phys 1994;21:503–8.
[13] Buckland-Wright JC, Lynch JA, Rymer J, Fogelman I. Fractalsignal analysis of macroradiographs measures trabecular organi-zation in lumbar vertebrae of postmenopausal women. CalcifTissue Int 1994;54:106–12.
[14] Ouyang X, Majumdar S, Link TM, Lu Y, Augat P, Lin J, NewettD, Genant HK. Morphometric texture analysis of spinal trabecu-lar bone structure assessed using orthogonal radiographic projec-tions. Med Phys 1998;25:2037–45.
[15] Feldkamp LA, Goldstein SA, Parfitt AM, Jesion G, KleerekoperM. The direct examination of three-dimensional bone architecturein vitro by computed tomography. J Bone Miner Res1989;4:3–11.
[16] Laib A, Hildebrand T, Hauselmann HJ, Ruegsegger P. Ridgenumber density: a new parameter for in vivo bone structure analy-sis. Bone 1997;21:541–6.
[17] Parfitt AM, Mathews CHE, Villaneuva A, Kleerekoper M, FrameB, Rao DS. Relationships between surface, volume, and thicknessof iliac trabecular bone in aging and in osteoporosis. CalcifTissue Int 1983;72:1396–409.
[18] Muller R, Van Campenhout H, Van Damme B, Van der Perre G,Dequeker J, Hildebrand T, Ruegsegger P. Morphometric analysisof human bone biopsies: a quantitative structural comparison ofhistological sections and micro-computed tomography. Bone1998;23:59–66.
[19] Day JS, Ding M, Odgaard A, Summer DR, Hrid I, Weinans H.Parallel plate model for trabecular bone exhibits volume fraction-dependent bias. Bone 2000;27:715–20.
[20] Veenland JF, Grashuis, Van Der Meer F, Beckers ALD, GelsemaES. Estimation of fractal dimension in radiographs. Med Phys1996;4:585–94.
[21] Fazzalari NL, Parkinson IH. Fractal properties of cancellous boneof the iliac crest in vertebral crush fracture. Bone 1998;23:53–7.
[22] Jiang C, Pitt RE, Bertram JEA, Aneshausley DJ. Fractal-basedimage texture analysis of trabecular bone architecture. Med BiolEng Comput 1999;37:413–8.
[23] Millard J, Augat P, Link T, Kothari M, Newitt D, Genant H,Majumdar S. Power spectral analysis of trabecular bone structurefrom radiographs: correlation with bone mineral density andbiomechanics. Calcif Tissue Int 1998;63:482–9.
[24] Dougherty G, Newman D. The measurement of thickness anddensity of thin strutures by computed tomography: simulationstudy. Med Phys 1999;26:1341–8.
[25] Otsu N. Threshold selection method from grey-level histograms.IEEE Trans Systems Man Cyber 1979;9:62–6.
[26] Mandelbrot BB. The fractal geometry of nature. New York: Free-man, 1983.
[27] Allain C, Cloitre M. Characterizing the lacunarity of random anddeterministic fractal sets. Phys Rev Lett 1991;A44:3552–8.
[28] Plotnick R, Gardner R, Hargrove W, Perlmutter M, PrestegaardK. Lacunarity analysis: a general technique for the analysis ofspatial patterns. Phys Rev 1996;E53:5461–8.
[29] Link TM, Majumdar S, Konermann W, Meier N, Lin JC, NewittD, Ouyang X, Peters PE, Genant HK. Texture analysis of directmagnification radiographs of vertebral specimens: correlationwith bone mineral density and biomechanical properties. AcadRadiol 1997;4:167–76.
[30] Geraets WGM, Van Der Stelt PF. Analysis of the radiographictrabecular pattern. Pattern Recog Lett 1991;12:575–81.
[31] Geraets WGM, Van der Stelt PF, Elders PJM. The radiographictrabecular bone pattern during menopause. Bone 1993;14:859–64.
[32] Katsuragawa S, Doi K, Nakamori N, McMahon H. Image featureanalysis and computer-aided diagnosis in digital radiography:effect of digital parameters on the accuracy of computerizedanalysis of interstitial disease in digital chest radiographs. MedPhys 1990;17:72–8.
[33] Jiang CF, Avolio AP. Characterization of structural changes inthe arterial elastic matrix by a new fractal feature: the directionalfractal curve. Med Biol Eng Comput 1997;35:246–52.
[34] Link TM, Majumdar S, Grampp S, Guglielnii G, Van Kuijk C,Imhof H, Glueer C, Adams JE. Imaging of trabecular bone struc-ture in osteoporosis. Eur Radiol 1999;9:1781–8.
[35] Parfitt AM. Age related structural changes in trabecular andcortical bone. Cellular mechanisms and biomechanical conse-quences. Calcif Tissue Int 1984;36:S123.
[36] Mosekilde L, Mosekilde L, Danielsen CC. Biomechanical com-petence of vertebral trabecular bone in relation to ash density andage in normal individuals. Bone 1987;8:79–85.
[37] Bergot C, Laval-Jeantet AM, Preteux F, Meunier A. Measure-ment of anisotropic vertebral trabecular bone loss during agingby quantitative image analysis. Calcif Tissue Int 1988;43:143–9.
[38] Mosekilde L. Age-related changes in vertebral trabecular bonearchitecture — assessed by a new method. Bone 1988;9:247–50.
[39] Korstgens CM, Mosekilde L, Spruijt RJ, Geraets WGM, Van derStelt PF. Relations between radiographic trabecular pattern andbiomechanical characteristics of human vertebrae. Acta Radiol1996;37:618–24.
[40] Gordon CL, Webber CE, Christoforou N, Nahmias C. In vivoassessment of trabecular bone structure at the distal radius fromhigh-resolution magnetic resonance images. Med Phys1997;24:585–93.
[41] Wessels M, Mason RP, Antich PP, Zerwekh JE, Pak CYC. Con-nectivity in human cancellous bone by three-dimensional mag-netic resonance spectroscopy. Med Phys 1997;24:1409–20.

321G. Dougherty / Medical Engineering & Physics 23 (2001) 313–321
[42] Kawaf Z, Dougherty G. The point spread function revisited:image restoration using 2-D convolution Radiography 2001; inpress.
[43] Kothari M, Keaveny TM, Lin JC, Newitt DC, Genant HK,Majumdar S. Impact of spatial resolution on the prediction oftrabecular architecture parameters. Bone 1998;22:437–43.
[44] Laib A, Ruegsegger P. Calibration of trabecular bone structuremeasurements of in vivo three-dimensional peripheral quantitat-ive computed tomography with 28 µm resolution microcomputedtomography. Bone 1999;24:35–9.