a comparison of treatment impacts between invisalign and...
TRANSCRIPT
A COMPARISON OF TREATMENT IMPACTS BETWEEN INVISALIGN AND
FIXED APPLIANCE THERAPY DURING THE FIRST SEVEN DAYS OF TREATMENT
By
KEVIN BLAINE MILLER
A THESIS PRESENTED TO THE GRADUATE SCHOOL OF THE UNIVERSITY OF FLORIDA IN PARTIAL FULFILLMENT
OF THE REQUIREMENTS FOR THE DEGREE OF MASTER OF SCIENCE
UNIVERSITY OF FLORIDA
2005

Copyright 2005
by
Kevin Blaine Miller
ACKNOWLEDGMENTS
I would like to thank my wife Emily for her unconditional support throughout my
years of education. To my mother and father I am grateful for always opening doors for
me to pursue my goals.
I would like to thank Drs. Randy Womack, Jay Gibson, and Juan Carlos Quintero
for their support in recruiting and educating subjects for this study. Finally, I would like
to thank Drs. Timothy Wheeler, Calogero Dolce, Sue McGorray, and Teresa Dolan for
their advice and direction on this study.
iii

TABLE OF CONTENTS page
ACKNOWLEDGMENTS ................................................................................................. iii
LIST OF TABLES...............................................................................................................v
LIST OF FIGURES ........................................................................................................... vi
ABSTRACT...................................................................................................................... vii
INTRODUCTION ...............................................................................................................1
MATERIALS AND METHODS.........................................................................................3
STATISTICAL ANALYSIS ...............................................................................................6
RESULTS ............................................................................................................................8
Sample Characteristics..................................................................................................8 Overall Impact Scores...................................................................................................8 Subcomponent Impact Scores.......................................................................................9 Visual Analog Scale Pain Reports..............................................................................10 Pain Medication ..........................................................................................................11 Influence of Covariates...............................................................................................11 Archwire Size .............................................................................................................11
DISCUSSION....................................................................................................................17
CONCLUSIONS................................................................................................................22
APPENDIX: EXAMPLE OF DAILY DIARY SURVEY................................................23
LIST OF REFERENCES...................................................................................................25
BIOGRAPHICAL SKETCH .............................................................................................28
iv

LIST OF TABLES
Table page 1. Pretreatment PAR Scores................................................................................................8
2. Demographic Data ........................................................................................................13
v
LIST OF FIGURES
Figure page 1. Mean overall impact scores ..........................................................................................14
2. Mean functional subcomponent impact scores .............................................................14
3. Mean psychosocial subcomponent impact scores.........................................................15
4. Mean pain-related subcomponent impact scores ..........................................................15
5. Mean pain scores as recorded on a visual analog scale ................................................16
6. Percentage of patients in Invisalign and fixed appliance groups who took pain medication ................................................................................................................16
vi

Abstract of Thesis Presented to the Graduate School of the University of Florida in Partial Fulfillment of the
Requirements for the Degree of Master of Science
A COMPARISON OF TREATMENT IMPACTS BETWEEN INVISALIGN AND FIXED APPLIANCE THERAPY DURING THE FIRST SEVEN DAYS OF
TREATMENT
By
Kevin Blaine Miller
May 2005
Chair: Timothy Wheeler Major Department: Orthodontics
The aim of this study was to evaluate the differences in quality of life impacts
between patients treated with Invisalign® and with fixed appliances during the first seven
days of orthodontic treatment. A prospective, longitudinal study involving 60 adult
orthodontic patients was completed using a daily diary to measure treatment impacts
including functional, psychosocial, and pain-related outcomes. Thirty-three patients were
treated with Invisalign and 27 with fixed appliances. Subjects were recruited from the
University of Florida Orthodontic Clinics and four private practices located in Florida,
Arizona, Kentucky, and Texas. Both overall and category-specific quality of life impacts
were measured using 23 items with Likert response sets. Pain experience was assessed
using a visual analog scale. A baseline survey was completed prior to the initiation of
treatment; diary entries were made for seven consecutive days in order to measure
various impacts of the patients’ orthodontic treatment over time. The baseline and diary
vii

data were then analyzed for differences between treatment modalities in terms of the
patients’ reported impacts from their orthodontic treatment. The baseline data revealed
that there were no differences between groups for baseline pain reports (p=0.42) or for
overall quality of life measures (p=0.59). From day one through day seven the Invisalign
group reported fewer negative impacts on their overall quality of life (p<0.001). The
Invisalign group also recorded less impact in each quality of life category evaluated
(functional, psycho-social, and pain-related) with p<0.0002. The visual analog scale
pain reports revealed that the Invisalign group experienced less pain from day one
through day seven (p<0.001). The fixed appliance group took more pain medication than
the Invisalign group at days 2 and 3 (p<0.006). Adult patients treated with Invisalign
experienced less pain and less negative impact on their lives during the first week of
treatment.
viii

INTRODUCTION
The body of literature addressing the orthodontic patients’ experience during
treatment is relatively small. Most of the studies in this area have focused on delineating
the pain experience of the orthodontic patient throughout treatment. Pain resulting from
orthodontic treatment has been shown to be very significant. Jones 1 found that the pain
experienced after initial archwire insertion is much greater than pain after extractions.
The pain progression after initial archwire insertion is well established in the literature.
The level of pain increases four hours after insertion of the initial archwire, peaks at 24
hours, and decreases to almost baseline levels at seven days.1,2,3,4 Stewart et al5 found
that the first four to seven days after initial wire placement are the most critical for the
patient in terms of general discomfort. Sergl et al6 found that patients adapt to new
appliances within seven days after appliance insertion. From these studies it can be
concluded that the first seven days after archwire insertion is a crucial time for the
patient’s adaptation to appliances and the period in which most orthodontic pain is
experienced.
Past studies have examined the differences in the pain response between different
modalities of treatment. Stewart et al5 observed that subjects with fixed appliances had
more problems with comfort, tension, pressure, tightness, pain and sensitivity than did
subjects with removable appliances. He found that the functional appliances disturbed
speech and swallowing more than fixed appliances. Sergl et al7,8 corroborated these
results in two separate studies. He found that patients treated with fixed appliances
1

2
reported more pain and discomfort than did patients wearing removable plates, while
patients treated with functional or removable appliances reported more problems with
impaired speech, swallowing, and feeling of oral constraint than patients treated with
fixed appliances. These studies suggest that fixed appliances have more of an impact on
the patient’s pain response during the initial stages of treatment than do removable
appliances, while removable appliances have more of an effect on functional response
variables such as speech and swallowing.
Over the past decade Invisalign® has emerged as a popular new treatment
modality. The technology and fabrication process have been described elsewhere.9
While the impact-related effects for fixed appliances have been studied, no studies have
evaluated the effect of Invisalign treatment on the patient. Patients who elect to be
treated with Invisalign are seeking an appliance that is less obtrusive in their everyday
lives. These patients often incur a greater treatment fee in hopes that the appliance will
have less negative impact on their quality of life. In order for the patient and clinician to
make more informed decisions regarding treatment modality, studies are needed to
evaluate the differences between Invisalign and fixed appliance therapy in their impacts
on patients’ quality of life.
To that end, the objective of this study was to evaluate the relationship between
modality of treatment, Invisalign or fixed appliances, and the various quality of life
effects experienced during the first seven days of orthodontic treatment.
MATERIALS AND METHODS
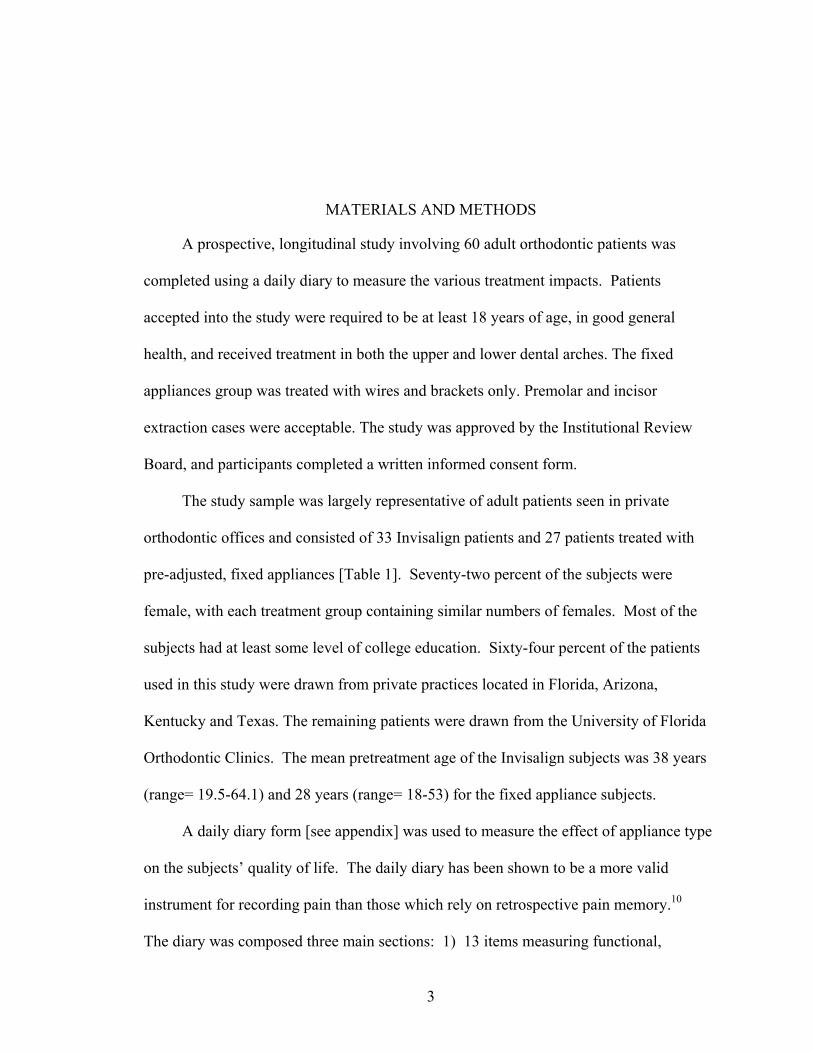
A prospective, longitudinal study involving 60 adult orthodontic patients was
completed using a daily diary to measure the various treatment impacts. Patients
accepted into the study were required to be at least 18 years of age, in good general
health, and received treatment in both the upper and lower dental arches. The fixed
appliances group was treated with wires and brackets only. Premolar and incisor
extraction cases were acceptable. The study was approved by the Institutional Review
Board, and participants completed a written informed consent form.
The study sample was largely representative of adult patients seen in private
orthodontic offices and consisted of 33 Invisalign patients and 27 patients treated with
pre-adjusted, fixed appliances [Table 1]. Seventy-two percent of the subjects were
female, with each treatment group containing similar numbers of females. Most of the
subjects had at least some level of college education. Sixty-four percent of the patients
used in this study were drawn from private practices located in Florida, Arizona,
Kentucky and Texas. The remaining patients were drawn from the University of Florida
Orthodontic Clinics. The mean pretreatment age of the Invisalign subjects was 38 years
(range= 19.5-64.1) and 28 years (range= 18-53) for the fixed appliance subjects.
A daily diary form [see appendix] was used to measure the effect of appliance type
on the subjects’ quality of life. The daily diary has been shown to be a more valid
instrument for recording pain than those which rely on retrospective pain memory.10
The diary was composed three main sections: 1) 13 items measuring functional,
3

4
psychosocial, and pain-related treatment impacts using a five-point Likert scale; 2) one
pain item using a visual analog scale; 3) one item asking what (if any) pain medications
were taken. Data about subjects’ sociodemographic characteristics were also collected.
The first diary section described above was adapted from the well-validated
Geriatric Oral Health Assessment Index (GOHAI)11 which was originally designed to
measure patient-reported oral function problems involving physical function,
psychosocial function, pain and discomfort. The questions were modified to address
impacts relevant to orthodontic treatment. The responses to the first 13 questions were
combined in order to give an overall impact score for each patient at each time point.
The impact score is a reflection of the patient’s overall reported quality of life. A higher
impact score signifies fewer reported impacts while a low score signifies a negative
response. These first 13 questions were also broken down into three sub-categories for
analysis: 1) functional impacts (questions a, b, c, d); 2) pain-related impacts (questions e,
h, l, m); and 3) psycho-social impacts (questions f, g, i, j, k). The visual analog scale
was used as an additional measure of pain experience. The visual analog scale has been
shown to be a valid instrument for measuring orthodontic pain.12 Pain medication
information was recorded in order to test for any possible interactions with the
orthodontic treatment effect.
Subjects completed a baseline, pretreatment diary form immediately before initial
fixed appliances were placed or aligners were delivered. Pretreatment models and
demographic data were collected at this appointment. Treatment related information such
as archwire size and type (for the fixed group), whether extractions were done, and which
teeth were extracted was recorded at this appointment. The patient was then sent home

5
with a study packet which included instructions to complete identical diary forms for
seven consecutive days. At the end of the seven day period the study packet was mailed
back to the principal investigator in a pre-addressed envelope.

STATISTICAL ANALYSIS
Repeated measure mixed models were used to evaluate differences due to treatment
group, day in treatment, baseline outcome measures, and treatment group by day
interaction. The following variables were evaluated for their effect on the above
mentioned models: sex, age, previous treatment, income, education and use of pain
medication. The primary outcome measures evaluated in the models were overall and
category-impact scores, and pain scores as recorded on a visual analog scale. Baseline
demographic differences were evaluated using chi-square and Wilcoxon rank sum tests.
Significance level was set at p<0.05. Standard error is illustrated in each figure.
Pretreatment models were scored by the same investigator using the PAR
index.13,14 Pretreatment models were collected in order to compare the initial severity of
malocclusion between the Invisalign and fixed appliance groups. One investigator was
calibrated to a gold-standard for the PAR index using ten separate stone models. Once
this investigator was calibrated to stone models, he then was trained in using the PAR
index on Orthocad® (digital) and Invisalign Clincheck ® (digital) models. All Invisalign
patients’ models were in Clincheck format, while all fixed appliance patients’ were in
stone or Orthocad format. In order to test for measurement reproducibility between
formats, one investigator scored three sets of 10 identical models. One set of models was
stone, one OrthoCad ®, and one Invisalign Clincheck®. The reliability estimates between
each format were all ≥ 0.95. These findings are in agreement with those of
6

7
Quimby et al15 who found the accuracy of measurements between two anatomical points
on digital models to be equal to that made on stone models.

RESULTS
Sample Characteristics
Pretreatment models were obtained in order to compare the groups for the severity
of their initial malocclusion. As table 1 illustrates, both the Invisalign and the fixed
appliance groups had a similar severity of malocclusion as rated by the PAR Index.
Table 1: Pretreatment PAR Scores PAR Score Significance *
Invisalign 20.04 ±9.56 NS Fixed Appliances 20.46 ±7.67
________________________________________________________________________ * α= .05
There was no significant difference between groups in gender composition, racial
composition, level of education, self-reported health status or reports of prior orthodontic
treatment (Table 2). Although not reaching statistical significance at p=0.06, more
Invisalign patients reported seeking treatment ‘to improve my appearance,’ while more
fixed appliance patients reported seeing treatment ‘because my dentist referred me.’ The
Invisalign group was significantly older and had higher incomes than the fixed appliance
group.
Overall Impact Scores
Figure 1 illustrates the overall impact scores for the two groups during the first
week of treatment. The overall pattern of impact for both groups is an initial decrease in
8
9
quality of life followed by a return to baseline levels. The overall impact scores of the
Invisalign and fixed appliance groups were not significantly different at baseline. The
groups differed in their reported impact scores beginning on day 1 and continuing
through day seven. At each of these time points, the fixed appliance group reported
significantly lower impact scores with p<0.0001. In addition, the impact scores at each
time point, independent of treatment group, are each statistically different from each
other at p<0.0001.
The overall impact score progression from baseline levels for each group was
different. The Invisalign group reported a negative overall impact on their daily lives
from day 1-3, but from days 4-7 reported an increase in quality of life compared with
baseline levels. The fixed appliance group reported a drastic initial drop in quality of life
at day 1. From days 2-7 the overall quality of life scores for the fixed group improved
but never reached baseline levels indicating an overall negative impact for all seven days.
Subcomponent Impact Scores
Figure 2, Figure 3, and Figure 4 illustrate the impact scores for the two groups
when the survey questions were subcategorized into functional, psycho-social, and pain-
related subcomponents. For all three subcomponents, beginning at day one and
extending through day seven, the Invisalign treatment group reported less negative
impact than the fixed group at each time point with p<0.002. Also, the impact scores at
each time point, independent of treatment group, were statistically different from each
other.
For the functional subcomponent (Figure 2), both groups reported a negative effect
on function at day one with the fixed appliance group reporting a much more drastic drop
in function. By day seven in the Invisalign group’s functional impact scores had

10
returned almost back to baseline levels, whereas the fixed appliance group’s function was
well below baseline levels. Analysis of the functional subcomponent questions also
showed that patients’ baseline impact scores has an effect on their impact scores from
days one through seven at a significance level of p=0.047.
For the psycho-social subcomponent (Figure 3), the fixed appliance group reported
a drop in psycho-social well-being on days one through three compared with baseline
levels, while the Invisalign group reported an increase beginning at day one and
continuing through day seven. The fixed group’s psycho-social impact scores returned to
baseline levels at day five and showed a slight increase at day seven.
For the pain-related subcomponent (Figure 4), the fixed group reported a sharp
increase in discomfort at day one and a gradual decline in discomfort from days two
through seven. The fixed group’s pain reports never improved to baseline levels,
indicating an overall negative impact of pain for all seven days. The Invisalign group
reported an increase in discomfort at days one and two, returned to baseline level at day
three, and reported an improvement over baseline levels from days four through seven.
Visual Analog Scale Pain Reports
Figure 5 illustrates the pain reports of the two groups during the first week of
treatment as recorded on a visual analog scale. At baseline there was no difference in
pain reports between the groups. From days one through seven the fixed appliance
patients reported significantly more pain than the Invisalign patients with p<0.0001.
Independent of treatment group, the pain reports at each time point were significantly
different from each other with p<0.0001. The overall pain progression is an initial
increase in pain at day one followed by a gradual return to near baseline levels over days
two through seven. The Invisalign group’s pain level returned to baseline at day five,

11
and decreased slightly below baseline levels at days six and seven. The fixed appliance
group’s pain reports do not return to baseline levels by day seven, indicating an overall
negative pain experience during the first week of treatment.
Pain Medication
Figure 6 illustrates how the groups differed in their pain medication intake during
the study period. Patients reported using only over-the-counter pain medications.
Examples of medications taken were Advil, Tylenol, Ibuprofen, Motrin, and Aleve. At
baseline there was no difference between the groups in pain medications reports. At day
one, the difference between groups approached significance with the fixed appliance
group taking more pain medication. On days two and three the fixed appliance group
took more pain medication with p<0.006. From days four through seven there was no
difference between the groups.
Influence of Covariates
The influence of the following variables were evaluated for their impact on the
outcome measures: gender, age, income, education, intake of pain medication and
previous orthodontic treatment. Sex, age, income and the intake of pain medication
during treatment were shown to effect the overall impact score over the study period at a
significance level of p<0.03. The results showed that the following characteristics were
associated with lower quality of life scores during the study period: female gender,
younger age, lower income and pain medication intake during the study period.
Archwire Size
For the fixed appliance group, the effect of the archwire size on patients’ overall
impact scores and pain reports on the visual analog scale was evaluated. The .012”
archwires were grouped with the .014” wires, and the .016” wires were grouped with the

12
.018” wires. Forty-four percent of the archwires were .014”, and 37 percent of the
archwires were .016”. Archwire size with material type was not evaluated since there
were too many combinations of size and type for analysis. Archwire material type was
not evaluated since the sample sizes of the two groups were not balanced. Sixty-seven
percent of the archwires were nickel titanium, and 33 percent were copper nickel
titanium.
Statistics for the influence of archwire size are not shown here. These results are
observational as this study was not designed to test for archwire size. The patients with
smaller archwires reported less overall impact on their quality of lives beginning at day
one and continuing through day seven. The shape of the curves for each group mirror
each other through the entire week, with the larger archwire group reporting a lower
quality of life. The pain reports as recorded on a visual analog revealed that patients with
larger archwires reported higher levels of pain from day one through day five.

13
Table 2. Demographic Data Invisalign
n (%) Fixed Appliances n (%)
Significance*
Gender NS Male 11 (33%) 6 (22%) Female 22 (67%) 21(78%) Age (years) p=0.002 Mean ± SD 38.03±12.40 28.18±9.00 Race White 24 (73%) 13 (48%) Black 1 (3%) 5 (18%) Asian 2 (6%) 1 (4%) Hispanic 5 (15%) 7 (26%) Other 1 (3%) 1 (4%) Education NS <HS Graduate 0 (0%) 1 (4%) HS Graduate 2 (6%) 2 (7%) Some College 8 (24%) 10 (37%) College Graduate 23 (70%) 14 (52%) Income p=0.015 Under $10,000 2 (6%) 5 (19%) 10,000-25,000 3 (9%) 4 (15%) 25,000-50,000 5 (15%) 6 (22%) 50,000-75,000 7 (21%) 6 (22%) 75,000-100,000 3 (9%) 3 (11%) 100,000+ 13 (40%) 3 (11%) Health Status NS Excellent 21 (64%) 13 (48%) Very Good 11 (33%) 11 (41%) Good 1 (3%) 3 (11%) Fair 0 (0%) 0 (0%) Poor 0 (0%) 0 (0%) Reason Seeking Treatment NS** To improve appearance 28 (85%) 18 (67%) Difficulty eating 0 (0%) 0 (0%) Dental or facial pain 3 (9%) 2 (7%) Dentist referral 1 (3%) 7 (26%) Other 1 (3%) 0 (0%) Previous Treatment NS Yes 16 (48%) 9 (33%) No 17 (52%) 18 (67%) * α= .05 ** Approached significance, p=0.06

14
35
40
45
50
55
60
65
Baseline Day 1 Day2 Day 3 Day 4 Day 5 Day 6 Day 7
Impa
ct S
core
s (H
ighe
r Val
ues=
Bet
ter)
InvisalignFixed
*
* *
* *
* *
Figure 1. Mean overall impact scores for Invisalign and fixed appliance groups. Higher impact scores on the y-axis indicate a more positive quality of life. (* p<0.05)
6
8
10
12
14
16
18
20
22
24
Baseline Day 1 Day2 Day 3 Day 4 Day 5 Day 6 Day 7
Impa
ct S
core
(hig
her v
alue
s=be
tter
)
Invisalign
Fixed
*
* * *
* * *
Figure 2. Mean functional subcomponent impact scores for Invisalign and fixed appliance groups. (* p<0.05)

15
6
8
10
12
14
16
18
20
22
24
Baseline Day 1 Day2 Day 3 Day 4 Day 5 Day 6 Day 7
Impa
ct S
core
(hig
her v
alue
s=be
tter
)
Invisalign
Fixed
* * * * * * *
Figure 3. Mean psychosocial subcomponent impact scores for Invisalign and fixed appliance groups. (* p<0.05)
6
8
10
12
14
16
18
20
22
24
Baseline Day 1 Day2 Day 3 Day 4 Day 5 Day 6 Day 7
Impa
ct S
core
(hig
her v
alue
s=be
tter)
Invisalign
Fixed
* * *
* * *
*
Figure 4. Mean pain-related subcomponent impact scores for Invisalign and fixed appliance groups. (* p<0.05)

16
0
10
20
30
40
50
60
Baseline Day 1 Day2 Day 3 Day 4 Day 5 Day 6 Day 7
Pain
Rat
ing
(hig
her v
alue
s= m
ore
pain
)
Invisalign
Fixed
* *
*
*
*
*
*
Figure 5. Mean pain scores as recorded on a visual analog scale for Invisalign and fixed appliance groups. Higher values on the y-axis indicate more pain was experienced. (* p<0.05)
0
10
20
30
40
50
60
70
80
Baseline Day 1 Day 2 Day3 Day 4 Day 5 Day 6 Day 7
Perc
enta
ge o
f Pat
ient
s Ta
king
Pai
n M
eds
Invisalign
Fixed
** *
*
Figure 6. Percentage of patients in Invisalign and fixed appliance groups who took pain medication. (** p=0.06, * p<0.05)

DISCUSSION
This study’s objective was to evaluate how appliance type, Invisalign or fixed
appliances, can impact the patient’s quality of life during the first seven days of
orthodontic treatment. A seven day diary was used to record the impact the appliance
had on the patient. The patient recorded the impact of the appliance as the impact was
being experienced. This daily record of impact assessment is seen as a more valid and
reliable measure when compared to retrospective response data which relies on patient
recall.16 Pretreatment models were scored using the PAR index in order to compare the
initial severity of malocclusion between the groups. The results revealed no significant
difference between the groups in their initial malocclusion as scored using the PAR index
(Table 2).
An impact score was derived from the responses to the first section of the diary
form. This impact score is an indication of overall quality of life. The fixed appliance
group reported a significantly poorer quality of life than the Invisalign group beginning at
day one and continuing through day seven. A separate measure of pain experience was
recorded using a visual analog scale. The fixed appliance patients reported significantly
more pain than the Invisalign group beginning at day one and continuing through day
seven.
Since Invisalign is a new appliance type, no studies have evaluated its impact on
patients. Prior studies have looked at the impact of fixed appliances compared with
removable plates. Sergl et all6 and Steward et al19 found that fixed appliances caused
17

18
more discomfort for the patient than removable appliances. Sergl and Zentner20 also
found that appliances which take up minimal space in the mouth are the most readily
accepted by patients. These studies are consistent with the findings of this study. The
fact that Invisalign is removable likely adds substantially to the quality of life of the
patient. The patient is able to remove the appliance for eating and hygiene. The small
size of the Invisalign aligners and lack of sharp edges also likely adds substantially to the
quality of life of the patient compared with fixed appliances.
This study also found a significant time effect on the outcome measures. Patients
in both groups reported a peak in impact/pain at day one followed by a decrease to near
baseline levels at day seven (see Figures 1 and 5). This pain progression following the
initiation of treatment is well validated in the literature for fixed appliances.21,22,23,24 The
impact/pain progression of Invisalign treatment is similar to that which has been already
demonstrated for fixed appliances. From days one to seven the impact/pain progression
for the Invisalign and fixed appliances were similar in that pain levels peaked at 24 hours
and decreased to near baseline levels by day seven. The key difference is that at each
time point the fixed appliance patients experience a more intense decrease in quality of
life and a more intense increase in pain. In support of these findings, as Figure 6 shows,
both groups’ pain medication intake peaked at day one and decreased to near baseline
levels by day seven. As would be expected, pain medication intake correlated with pain
report levels throughout the week. The curves in Figure 6 mirror the curves illustrated in
Figure 5. Both groups took more pain medication during the first three days of treatment
(when pain levels are highest), and the fixed appliance group (whose pain levels are
higher) took more pain medication than the Invisalign group during the first three days.

19
From days four through seven as both groups pain reports decreased, so did their pain
medication intake. Both groups’ medication intake returned to near baseline levels by
day seven. These findings are in agreement with Erdinc and Dincer25 who also found a
correlation between pain intensity scores and consumption of pain medication during
orthodontic treatment.
In addition to looking at the overall quality of life impact, the functional, psycho-
social and pain-related impact of the two appliances were also evaluated (Figures 2-4).
For each of these quality of life categories, from day one through day seven, the fixed
appliance group reported more negative impact than the Invisalign group. These findings
are agreement with prior studies. Scheurer et al23 found that for fixed appliance patients
eating is the greatest challenge to quality of daily life. Oliver and Knapman26 found that
patients report pain caused by and the appearance of fixed appliances to be the major
discouraging factors during treatment. The esthetics, removability and small size of the
Invisalign appliance likely account for the functional and psycho-social differences
between the appliances. The pain-related category impact scores are in agreement with
the pain scores recorded on the visual analog scale. The two separate outcome measures
showed that the Invisalign group experienced less pain from days one through seven.
The two separate measures also illustrated a similar pain progression with pain peaking at
day one and gradually returning to baseline at day seven.
The statistical models also suggested that the patient’s baseline reports in the
functional category could affect future reports. A patient’s pretreatment functional ability
could be a predictor of functional ability during treatment. Future studies using larger
sample sizes could better evaluate the direction of effect the patient’s baseline functional

20
reports have on future reports. In this study there was no statistical difference between
the groups’ baseline functional impact reports, therefore any baseline effect should be
equally distributed between the groups.
For the fixed appliance patients, the effect of initial archwire size was also
evaluated. There was a trend towards patients starting treatment with larger archwires
reporting more negative impact on quality of life and more pain experienced. These
results conflict with those of prior studies that found no correlation between initial
archwire size and pain experience.1,25 Since this study was not designed to evaluate
archwire size effects, various combinations of archwire size and material were used on
the fixed appliance patients. The inability to standardize which archwire size and
material each subject received may explain why this study’s findings conflict with the
literature.
The treatment groups in this study were not balanced for all demographic
components. The treatment groups in the study differed in that the Invisalign group was
older and had higher incomes than the fixed appliance group (Table 1). In addition, the
statistical models used in this study suggest that female patients, younger patients and
lower income patients tend to report a poorer quality of life during treatment. The weight
that should be given to these covariate effects is questionable due to the small sample
sizes that were used to break down the data into the various covariate groups for analysis.
A larger study designed to test gender, age and income effects is needed to better evaluate
these factors.
No prior studies have related income to discomfort during orthodontic treatment.
With respect to age, Brown and Moerenhout17 found that adolescents, preadolescents and

21
adults varied in their pain reports during orthodontic treatment. The literature is
inconclusive as to how gender relates to orthodontic pain reports.2,4,18 The two treatment
groups in this study were well-balanced with respect to gender (Table 1). If age and/or
income do play a role in the impact outcome measures, the results of this study could
have been strengthened by more evenly distributing these variables between the groups.
The difficulty in balancing the groups for income is exacerbated by the fact that the
Invisalign treatment fee is often more expensive for patients due to a substantial lab fee
incurred by the doctor. This higher treatment fee may explain why the Invisalign group
had higher incomes and were older than the fixed appliance group. In addition, 78
percent of the Invisalign patients were drawn from a private practice setting, while only
44 percent of the fixed appliance patients came from a private practice. The remainder of
the patients were drawn from a university clinic setting. The heavier weighting of private
practice patients in the Invisalign group could account for the income differential
between the groups.
The groups also differed in their stated reason for seeking treatment. More
Invisalign patients reported seeking treatment to “improve my appearance,” while more
of the fixed appliance patients reported seeking treatment “because my doctor referred
me.” Different motivations for treatment between the groups could influence perceived
pain during treatment. If Invisalign patients are more motivated for treatment than the
fixed appliance group, they may perceive the negative impacts of treatment to be small
compared to the expected improvement in appearance. Sergl et al6 found that patients
with a higher internal locus of control and concern about their malocclusion perceived
lower levels of pain during orthodontic treatment.

CONCLUSIONS
The results of this study demonstrated a significant difference between Invisalign
and fixed appliance therapy in how they impact the patient during the first week of
treatment. The Invisalign patients’ overall quality of life was much better than the fixed
appliance patients during this time period. Numerous factors influence the selection of an
appropriate orthodontic appliance for each patient. Both Invisalign and fixed appliances
have specific indications and contraindications for use. The results of this study supply
the practitioner as well as the patient with additional information that can be used when
choosing appliance type. This information could also be helpful in educating patients for
what to expect during their first week of treatment.
The following conclusions can be made:
1. Both Invisalign and fixed appliance groups reported a decrease in quality of
life after initiation of treatment. This decrease in quality of life peaked at
day one and returned to near baseline levels by day seven.
2. The fixed appliance group reported a more intense decrease in overall
quality of life and more a more intense increase in pain beginning at day
one and extending through day seven.
3. The fixed appliance group reported a more intense decrease in functional,
psycho-social and pain-related aspects of their daily lives.
4. Fixed appliance patients took more pain medication during the first three
days of treatment
22

APPENDIX. EXAMPLE OF DAILY DIARY SURVEY
Instructions: Please complete the following survey about how your teeth or orthodontic appliances (braces or aligners) have affected your life since you started treatment. Answer only what you feel and have experienced, not what you think is the right answer. There are no right or wrong answers to these questions. 1. Please circle one response for each of the following questions.
In the past 24 hours, how often: Always Often Some-
times Seldom Never
a. did you limit the kinds or amounts of food you eat because of problems with your mouth, teeth, or orthodontic appliances?
1
2
3
4
5
b. did you have trouble biting or chewing any kinds of food, such as firm meat or apples?
1
2
3
4
5
c. were you able to swallow comfortably? 1 2 3 4 5 d. did your teeth or orthodontic appliances
prevent you from speaking the way you wanted?
1
2
3
4
5
e. were you able to eat anything without feeling discomfort?
1 2 3 4 5
f. did you limit contact with people because of the condition of your teeth or orthodontic appliances?
1
2
3
4
5
g. were you pleased or happy with the looks of your teeth or orthodontic appliances?
1 2 3 4 5
h. did you use medication to relieve pain or discomfort from around your mouth?
1
2
3
4
5
i. were you worried or concerned about the problems with your teeth or orthodontic appliances?
1
2
3
4
5
j. did you feel nervous or self-conscious because of problems with your teeth or orthodontic appliances?
1
2
3
4
5
k. did you feel uncomfortable eating in front of people because of problems with your teeth or orthodontic appliances?
1
2
3
4
5
l. were your teeth sensitive to hot, cold, or sweets?
1
2
3
4
5
m. did your orthodontic appliances cause discomfort to your cheeks, lips, or tongue
1
2
3
4
5
23

24
2. Please mark an “X” on the line below to indicate how severe your discomfort has been within the last 24 hours:
_____________________________________________________ No pain Severe Pain
3. Please indicate what time of the day you are filling out this survey: _____:_____ AM/PM hh mm
4. A) Have you taken any medications today? Y/N (please circle)
B) If so, please write in which medications you took today: ______________________________________________________
5. Are you having any other problems or concerns about your teeth or orthodontic appliances since your last orthodontic visit? If so, please describe.
__________________________________________________________________ __________________________________________________________________

LIST OF REFERENCES
1. Jones M, Chan C. The pain and discomfort experienced during orthodontic treatment: a randomized controlled clinical trial of two initial aligning arch wires. American Journal of Orthodontics 1992; 102: 373-381.
2. Ngan P, Kess B, Wilson S. Perception of discomfort by patients undergoing orthodontic treatment. American Journal of Orthodontics 1989; 96: 47-53.
3. Wilson S, Ngan P, Kess B. Time course of discomfort in young patients undergoing orthodontic treatment. Pediatric Dentistry 1989; 11(2):107-110.
4. Scheurer P, Firestone A, Burgin W. Perception of pain as a result of orthodontic treatment with fixed appliances. European Journal of Orthodontics 1996; 18:349-357.
5. Stewart FN, Kerr JW, Taylor P. Appliance wear: the patient’s point of view. European Journal of Orthodontics 1997; 19: 377-382.
6. Sergl HG, Klages U, Zenter A. Pain and discomfort during orthodontic treatment: causative factors and effects on compliance. American Journal of Orthodontics 1998; 114:684-690.
7. Sergl HG, Zentner A. A comparative assessment of acceptance of different types of functional appliances. European Journal of Orthodontics 1998; 20:517-524.
8. Sergl HG, Klages U, Zentner A. Functional and social discomfort during orthodontic treatment-effects on compliance and prediction of patient’s adaption by personality variables. European Journal of Orthodontics 2000; 22:307-315.
9. Wong B. Invisalign A to Z. American Journal of Orthodontics and Dentofacial Orthopedics 2002; 121(5):540-541.
10. Carp F, Carp A. The validity, reliability, and generalizability of diary data. Experimental Aging Research 1981; 7(3):281-295.
11. Atchinson K, Dolan TA. Development of the geriatric oral health assessment index. Journal of Dental Education 1990; 54: 680-687.
25

26
12. Wilson S, Ngan P, Kess B. Time course of discomfort in young patients undergoing orthodontic treatment. Pediatric Dentistry 1989; 11(2):107-110.
13. Buchanan IB. The evaluation and initial testing of an index to assess orthodontic treatment standards: the PAR index. MSc Thesis, University of Manchester 1991.
14. Richmond S, Shaw WC, O’Brien KD, Buchanon IB, Jones R, Stephens CD, Roberts CT, Andrews M. The development of the PAR index (Peer Assessment Rating): reliability and validity. European Journal of Orthodontics 1992; 14: 125-139.
15. Quimby M, Vig K, Rashid R, Firestone A. The accuracy and reliability of measurements made on computer-based digital models. Angle Orthodontist 2004; 74(3): 298-303.
16. Carp F, Carp A. The validity, reliability, and generalizability of diary data. Experimental Aging Research 1981; 7(3):281-295.
17. Brown FB, Moerenhout RG. The pain experience and psychological adjustment
to orthodontic treatment of preadolescents, adolescents, and adults. American Journal of Orthodontics 1991; 100:349-355.
18. Jones ML. An investigation into the initial discomfort caused by placement of an
archwire. European Journal of Orthodontics 1984; 6:48-54.
19. Stewart FN, Kerr JW, Taylor P. Appliance wear: the patient’s point of view. European Journal of Orthodontics 1997; 19: 377-382.
20. Sergl HG, Zentner A. A comparative assessment of acceptance of different types
of functional appliances. European Journal of Orthodontics 1998; 20:517-524. 21. Ngan P, Kess B, Wilson S. Perception of discomfort by patients undergoing
orthodontic treatment. American Journal of Orthodontics 1989; 96: 47-53.
22. Leavitt AH, King GJ, Ramsay DS, Jackson DL: A longitudinal evaluation of pulpal pain during orthodontic tooth movement. Orthodontics and Craniofacial Research 2002; 5: 29-37.
23. Scheurer P, Firestone A, Burgin W. Perception of pain as a result of orthodontic
treatment with fixed appliances. European Journal of Orthodontics 1996; 18:349-357.
24. Jones M, Chan C. The pain and discomfort experienced during orthodontic
treatment: a randomized controlled clinical trial of two initial aligning arch wires. American Journal of Orthodontics 1992; 102: 373-381.

27
25. Erdinc A, Dincer B. Perception of pain during orthodontic treatment with fixed appliances. European Journal of Orthodontics 2004; 26(1): 79-85.
26. Oliver RG, Knapman YM. Attitudes to orthodontic treatment. British Journal of
Orthodontics 1985; 12:179-18.

BIOGRAPHICAL SKETCH
Kevin Blaine Miller was born in Louisville, Kentucky, and was raised in
Spartanburg, South Carolina. In 1998, he received his Bachelor of Arts degree in
psychology with a minor in chemistry from Vanderbilt University in Nashville,
Tennessee. He was awarded membership into Phi Beta Kappa during his final year at
Vanderbilt. In 2002, he received his Doctor of Dental Medicine degree from the
University of Kentucky. Dr. Miller continued his education at the University of Florida
receiving his Master of Science degree with a certificate in orthodontics.
28