a comparison of zoning analyses to inform the planning of a marine protected area network in raja...
TRANSCRIPT
8/21/2019 A Comparison of Zoning Analyses to Inform the Planning of a Marine Protected Area Network in Raja Ampat, Indo…
http://slidepdf.com/reader/full/a-comparison-of-zoning-analyses-to-inform-the-planning-of-a-marine-protected 1/11
A comparison of zoning analyses to inform the planning of a marineprotected area network in Raja Ampat, Indonesia
Hedley S. Grantham a,b,n, Vera N. Agostini c, Joanne Wilson d, Sangeeta Mangubhai d, Nur Hidayat e,Andreas Muljadi d, Muhajir d, Chris Rotinsulu f , Meity Mongdong f , Michael W. Beck g,Hugh P. Possingham a
a The University of Queensland, Centre for Applied Environmental Decision and Analysis, St Lucia, Queensland 4072, Australiab Conservation International, 2011 Crystal Drive, Suite 500, Arlington, VA 22202, USAc The Nature Conservancy, Global Marine Team, 255 Alhambra Circle, Miami, FL 33134, USAd The Nature Conservancy, Indonesia Marine Program, Jl. Pengembak 2, Sanur 80228, Bali, Indonesiae Conservation International, Jl. Kedondong, Puncak Vihara, Klademak, Sorong 98414, Papua Barat, Indonesiaf
Conservation International, Jl Dr. Muwardi 17, Renon, Denpasar, Bali, Indonesiag The Nature Conservancy, 100 Shaffer Road, University of California, Santa Cruz, CA 95062, USA
a r t i c l e i n f o
Article history:
Received 23 February 2012
Received in revised form
29 May 2012
Accepted 29 May 2012Available online 23 July 2012
Keywords:
Fisheries
Decision support tool
Marxan
Coral Triangle
a b s t r a c t
Marine protected areas (MPAs) are often managed using several management zones, each of which
allows different human-uses. Decision support tools can be applied to provide advice on potential
zoning configurations. However, few studies used decision support tools to systematically determine
good locations for different types of zones that accommodate multiple and often conflicting objectives.
Previous studies have mostly used scores to integrate multiple objectives and identify different zoning
configurations or explored priority areas for each zone separately. Neither of these approaches ensure
that solutions meet both biodiversity and human-use objectives. Nor do they deal with the fact that in
zoning plans the whole is not the same as the sum of the parts, the importance of a site depends on how
the rest of the sites are managed. The aim of this study was to identify different zoning configurations
for the Raja Ampat MPA network in Eastern Indonesia that address biodiversity, sustainable fisheriesand community resource access objectives. Identifying zoning configurations is particularly difficult
here given the importance of protecting high biodiversity reefs and other conservation values, and the
high reliance of local communities on their marine resources. Potential areas for no-take zones were
identified that have a small and equitable impact across the fishing grounds of different fishing
communities whilst ensuring each community has access to a ‘sustainable fishing zone’. Access to
fishing grounds for each community is complicated due to marine tenure restricting where individuals
can fish and reliance on traditional types of fishing vessels that restrict long distance travel. This
approach for zoning was compared to three others. The first focused on identifying areas only for the
no-take zone, a traditional systematic planning approach, and the second on both zones without
explicitly accounting for the issue of resource access for each community. The solutions unfairly
impacted particular communities. Finally, it is demonstrated how a pre-existing zoning proposal,
driven by negotiation can be integrated into systematic planning.
& 2012 Elsevier Ltd. All rights reserved.
1. Introduction
Marine ecosystems are facing mounting pressures worldwide
and conflict between and among user groups characterize a great
portion of the world’s oceans [1]. Marine protected areas (MPAs)
are helping address these pressures by providing effective area
based protection necessary to maintain ecosystem health and
productivity, while safeguarding social and economic develop-
ment [2]. Many MPAs are often managed through the establish-
ment of different zones that regulate human activities in different
ways. Given how complex it is to decide which zone to place
where, having access to tools that can support the decision-
making processes (decision support tools) by providing potential
zoning configurations that accommodate competing objectives is
useful, and can be a starting point for a negotiation. An analysis of
the trade-offs between multiple and often conflicting objectives
can help minimize potential conflicts between stakeholders and/
or resources users [2,3].
Contents lists available at SciVerse ScienceDirect
journal homepage: www.elsevier.com/locate/marpol
Marine Policy
0308-597X/$- see front matter & 2012 Elsevier Ltd. All rights reserved.
http://dx.doi.org/10.1016/j.marpol.2012.05.035
n Corresponding author at: Conservation International, 2011 Crystal Drive, Suite
500, Arlington, VA 22202, USA. Tel.: þ 1 7033412430.
E-mail address: [email protected] (H.S. Grantham).
Marine Policy 38 (2013) 184–194
8/21/2019 A Comparison of Zoning Analyses to Inform the Planning of a Marine Protected Area Network in Raja Ampat, Indo…
http://slidepdf.com/reader/full/a-comparison-of-zoning-analyses-to-inform-the-planning-of-a-marine-protected 2/11
Previous approaches to zoning analysis have mostly used
multi-criteria decision analysis frameworks e.g. [4,5]. Multi-cri-
teria decision analysis can be used to explore a number of zoning
scenarios by combining information from several different criteria
to form a single index of evaluation for each site. Values for each
criterion are given a score. For example, Brown et al. [3]
individually scored water quality, productivity, coral reef health
and mangrove habitat as ecological criteria, then combined these
scores to evaluate management options for an MPA in Tobago.Scoring methods however, do not usually solve a well defined
problem in conservation planning and cannot accommodate the
notion of complementarity [6]. For example, scoring methods are
mostly ineffective at identifying representative areas of different
biodiversity [7], which is often an important objective in MPA
planning [8]. Also, scoring methods value sites individually rather
than collectively and thus do not account for the relationships
between sites [6,9].
‘Spatial conservation prioritization’ is a field of conservation
science that focuses on identifying locations that are either
representative of biodiversity for minimum socio-economic cost,
or maximize benefits to biodiversity given socio-economic con-
straints [6]. Socio-economic costs can vary and can include
economic costs (e.g. fisheries effort and catch data), preferences
away or toward particular human-uses and threats (e.g. aqua-
culture sites), and social preferences (e.g. willingness of people to
be involved in a protected area) [10]. For example, to help inform
the rezoning process of the Great Barrier Reef Marine Park in
Australia, the conservation planning software Marxan was used to
help prioritize locations for no-take zones that would achieve
equitable representation of different types of ecosystems while
minimizing a number of social and economic costs [8]. This type
of decision support tool has not been widely applied for multi-
objective zoning as, until recently, readily available conservation
planning software could only identify locations for a single zone.
Recent advances in the software Marxan (Marxan with Zones)
allow the user to identify locations for multiple zones simulta-
neously and address multiple objectives [11]. For example, Klein
et al. [12] identified areas for multiple types of fishing andconservation zones in California using Marxan with Zones.
When planning MPAs, there are usually many different stake-
holders and their interests need to be taken into consideration.
Current conservation planning frameworks identify the need to
set targets for different conservation features and avoid socio-
economic costs where possible but often fail to discuss the need
to set targets for different stakeholder groups e.g. [13,14]. Typi-
cally, to avoid different socioeconomic costs, important areas are
summarized by combining information into a single cost layer or
metric e.g. [15]. How information is aggregated will impact the
location of areas being avoided, and aggregating information into
a cost metric does not guarantee that stakeholder objectives and
targets are accounted for in the zoning solutions [16]. One way to
address this issue in zoning analysis is to set targets for differentstakeholders [12]. For example, Weeks et al. [16] identified
locations for MPAs in the Philippines and ensured that a sig-
nificant amount of each community tenure was not within the
MPA network by setting targets for each tenure explicitly. For
multi-objective problems that have competing objectives and
targets, there is a need to explore the trade-offs between
objectives as there are rarely win–win situations [12].
Here a critical problem faced when zoning MPAs is assessed,
and one that has received little attention in the literature:
identifying configurations of zones that achieve multiple
objectives and allow specific stakeholder group’s interests to be
explicitly addressed. The Raja Ampat region is used to
illustrate the approach. The aim of this study was to facilitate
consideration of biodiversity conservation and fisheries needs for
all communities in the Raja Ampat MPA network. While informa-
tion was collected that will help address other objectives (e.g.
tourism) in the zoning process, it was not explicitly addressed in
this analysis because it was biodiversity and fisheries which
posed the greatest challenges to the zoning process. The tools
and approaches developed here are designed to help decision
makers in Raja Ampat with their MPA network zoning efforts, as
well as serve as a template for other areas engaging in multi-
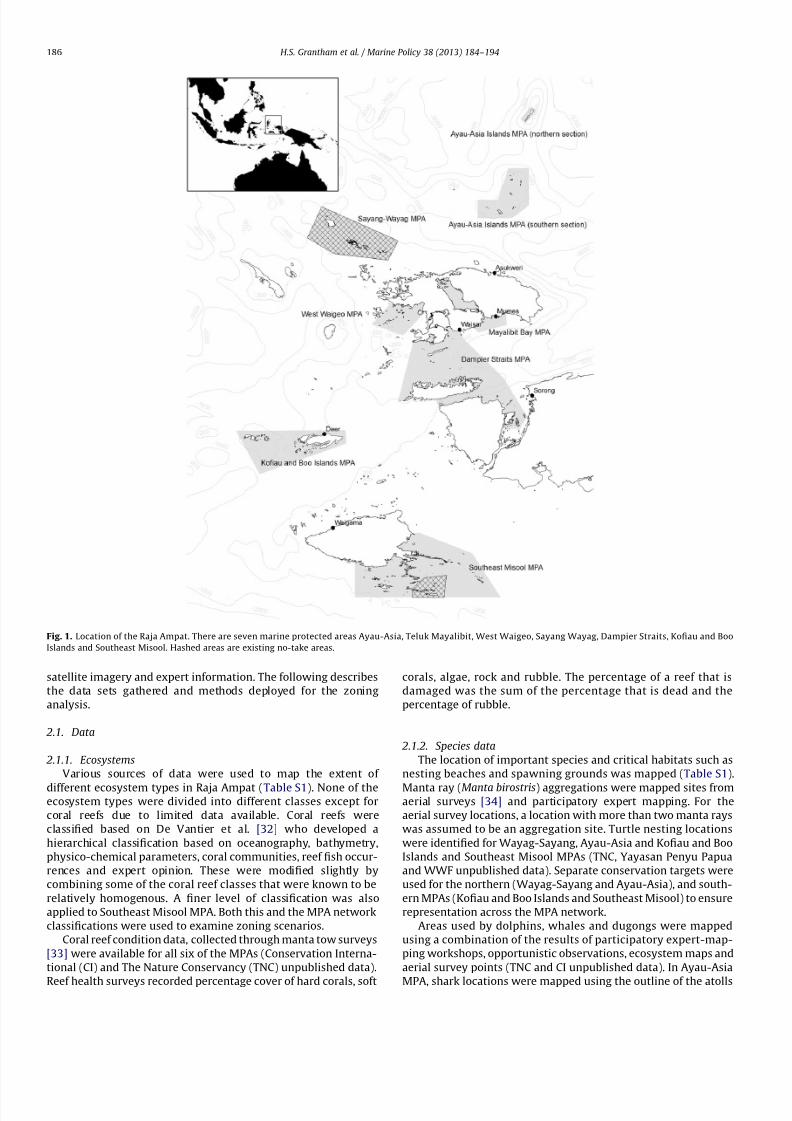
objective zoning efforts.Located on the north-western tip of Papua, eastern Indonesia,
Raja Ampat consists of nearly 1500 islands and encompasses an
area of over 4.5 million hectares (Fig. 1). Sitting in the epicenter of
the Coral Triangle, Raja Ampat contains the world’s most biodi-
verse coral reefs [17] and is a global priority for conservation [18].
Ecological surveys in the Raja Ampat archipelago have recorded
1320 species of coral reef fish [19] and 553 species of scleracti-
nian corals which is around 75% of the world’s total [20]. The
region is also important for many species of marine megafauna
including 16 species of cetacean, dugong, and three species of
turtles [21].
Raja Ampat has a rich and diverse cultural heritage that ranges
from indigenous Melanesians to settlers from as far as the Middle
East that arrived during the spice trade era [22,23]. A more recent
trend is government-initiated transmigration of people, particu-
larly from Java [24]. Raja Ampat’s rich marine resources make it a
target for economic development including commercial fisheries,
tourism, mariculture, oil and gas, mineral, mining and logging [25].
Fish stocks are generally in decline [26] and there are issues with
illegal, unreported and unregulated fisheries [27]. With a growing
economy that relies on healthy ecosystems for fishing, tourism and
mariculture, and globally significant biodiversity, there is a need
for ecosystem-based management for the coastal and marine
resources in Raja Ampat. In response, the Raja Ampat regency
government has declared a network of six multiple use MPAs, in
addition to the existing MPA to create a network of seven MPAs
that cover 1,185,940 ha.
In addition to the national, provincial and district governance
systems, there is a traditional and complex customary system,which include land and marine tenure and traditional natural
resource management, such as, prohibitions on harvesting species
during particular times and locations, called sasi [28].
Many people in Raja Ampat rely on small-scale commercial and
subsistence fishing for their livelihoods [29]. The location of
community fishing grounds is spatially constrained by a marine
tenure system and the fact that most communities are using
traditional types of fishing vessels that can only travel so far
[30,31]. The zoning of the Raja Ampat MPA network must account
for the fishing grounds of numerous communities when identify-
ing potential no-take zones.
The following describes several approaches for considering
multiple objectives within an integrated zoning analysis across a
network of MPAs and compare them. Two types of zones wereconsidered that contribute to meeting these biodiversity and
fisheries objectives, a no-take zone and a sustainable fishing zone
respectively. There will be other types of zones in the manage-
ment of the Raja Ampat MPA network but it is these two types of
zones that will form the foundation of the zoning plan, will cover
the greatest area and are the most complicated to identify.
2. Methods
A database was compiled on the distribution of ecosystems,
species, human-uses and threats to underpin the zoning process
and to enable us to apply decision support tools. A range of data
sources were used (Table S1). This included field observations,
H.S. Grantham et al. / Marine Policy 38 (2013) 184–194 185
8/21/2019 A Comparison of Zoning Analyses to Inform the Planning of a Marine Protected Area Network in Raja Ampat, Indo…
http://slidepdf.com/reader/full/a-comparison-of-zoning-analyses-to-inform-the-planning-of-a-marine-protected 3/11
satellite imagery and expert information. The following describes
the data sets gathered and methods deployed for the zoning
analysis.
2.1. Data
2.1.1. Ecosystems
Various sources of data were used to map the extent of
different ecosystem types in Raja Ampat (Table S1). None of theecosystem types were divided into different classes except for
coral reefs due to limited data available. Coral reefs were
classified based on De Vantier et al. [32] who developed a
hierarchical classification based on oceanography, bathymetry,
physico-chemical parameters, coral communities, reef fish occur-
rences and expert opinion. These were modified slightly by
combining some of the coral reef classes that were known to be
relatively homogenous. A finer level of classification was also
applied to Southeast Misool MPA. Both this and the MPA network
classifications were used to examine zoning scenarios.
Coral reef condition data, collected through manta tow surveys
[33] were available for all six of the MPAs (Conservation Interna-
tional (CI) and The Nature Conservancy (TNC) unpublished data).
Reef health surveys recorded percentage cover of hard corals, soft
corals, algae, rock and rubble. The percentage of a reef that is
damaged was the sum of the percentage that is dead and the
percentage of rubble.
2.1.2. Species data
The location of important species and critical habitats such as
nesting beaches and spawning grounds was mapped (Table S1).
Manta ray (Manta birostris) aggregations were mapped sites fromaerial surveys [34] and participatory expert mapping. For the
aerial survey locations, a location with more than two manta rays
was assumed to be an aggregation site. Turtle nesting locations
were identified for Wayag-Sayang, Ayau-Asia and Kofiau and Boo
Islands and Southeast Misool MPAs (TNC, Yayasan Penyu Papua
and WWF unpublished data). Separate conservation targets were
used for the northern (Wayag-Sayang and Ayau-Asia), and south-
ern MPAs (Kofiau and Boo Islands and Southeast Misool) to ensure
representation across the MPA network.
Areas used by dolphins, whales and dugongs were mapped
using a combination of the results of participatory expert-map-
ping workshops, opportunistic observations, ecosystem maps and
aerial survey points (TNC and CI unpublished data). In Ayau-Asia
MPA, shark locations were mapped using the outline of the atolls
Fig. 1. Location of the Raja Ampat. There are seven marine protected areas Ayau-Asia, Teluk Mayalibit, West Waigeo, Sayang Wayag, Dampier Straits, Kofiau and Boo
Islands and Southeast Misool. Hashed areas are existing no-take areas.
H.S. Grantham et al. / Marine Policy 38 (2013) 184–194186
8/21/2019 A Comparison of Zoning Analyses to Inform the Planning of a Marine Protected Area Network in Raja Ampat, Indo…
http://slidepdf.com/reader/full/a-comparison-of-zoning-analyses-to-inform-the-planning-of-a-marine-protected 4/11
reefs where there were many shark records from the aerial
survey. In addition a 1 km buffer around other shark observations
was included as shark habitat.
2.1.3. Fisheries and mariculture data
In Southeast Misool and Kofiau and Boo Islands MPAs, local
communities or karamba (fish cage) owners have identified
potential or historical fish spawning aggregations (TNC unpub-
lished data), but none of the monitoring to date have confirmedthese to be active sites. Regardless, these potential or historical
spawning aggregation sites were included as an important feature
that may recover if adequate protection was in place. Important
fish spawning aggregations were identified at an expert mapping
workshop. Targets were set separately in Kofiau and Boo Islands
and Southeast Misool MPAs to ensure historic fish spawning
aggregations were represented within both of the MPAs.
Access to community fishing grounds is important to local
communities and these were digitized spatially the locations of
126 community fishing grounds, from a range of information
sources including community and expert interviews, resource use
monitoring programs across the network (this included inter-
viewing fishers on the water, to obtain information on their
fishing activities, including type of boat, gear and compositionof catch) and monitoring surveys. For Ayau-Asia, West Waigeo,
Mayalibit Bay and Dampier Straits MPAs fishing grounds were
mapped by a combination of point data from surveys (resource
use and aerial surveys that identify locations for either canoes or
traditional boats with small motors (ketinting )) and data derived
from experts. For Kofiau and Boo Islands and Southeast Misool
MPAs participatory community mapping was done to identify the
key commercial species that local communities harvested
(including Trochus, grouper, green snail, sea-cucumbers, lobsters,)
as well as key fishing grounds (Table S1; TNC unpublished data).
Data generated via community mapping efforts were verified
against resource use data collected in the MPA as Kofiau and Boo
Island and Southeast Misool MPAs. For Ayau-Asia, West Waigeo
and Dampier Straits MPAs fishing grounds were identified for themajority of communities (Table S1). For Mayalibit Bay, Kofiau and
Boo Islands and Southeast Misool MPAs, fishing grounds for
specific species were also identified (Table S1). GPS coordinates
for mariculture sites were obtained directly from commercial
operators, or from data collected during resource use monitoring.
The main mariculture in Raja Ampat is pearl farming, which is
foreign-owned but with a large percentage of employees hired
locally from communities.
2.1.4. Threats data
Potential sediment plumes were identified by assuming that if
any significant clearing had occurred, or is occurring within a
catchment this would likely lead to a sediment plume at the river
mouth. To identify areas of significant clearing expert mappingdata was used on the location of mineral, and oil and gas mining,
data on road development in south West Waigeo (CI unpublished
data), and visual interpretation of a landsat image. Catchments
were based on rivers using data from the Raja Ampat Atlas [35].
For any catchment with significant clearing a 2 km radius plume
from the river outlet was mapped based on advice from a local
expert on the typical extent of sediment plumes.
2.2. Analysis
For each zoning analysis ‘Marxan with zones’ spatial planning
software was used. Marxan with Zones allows the user to identify
solutions for the location of multiple and different types of zones
simultaneously that minimize the cost of the entire system
subject to the constraints that zone-specific targets are achieved
[11]. The software uses an algorithm, simulated annealing, to
identify zoning configurations. This algorithm has a randomiza-
tion component and therefore usually generates a different
solution during each run. Marxan with Zones was run to produce
100 solutions that attempt to satisfy the objectives and constraints
of each scenario. The results of the 100 runs are typically
presented as either the best solution across these runs, and the
‘‘selection frequency’’, which represents the frequency a particularplanning unit was selected for a zone across the 100 runs. Some
areas were not allocated to a zone and these areas were identified
as a third zone called ‘unallocated’. A new method of classifying a
planning unit on the frequency it was selected for each zone was
developed. The classification was the following: ‘mostly unallo-
cated’ (selection frequency¼80–100% for unallocated zone), ‘most
frequently no-take’ (selection frequency¼80–100% for no-take
zone), ‘frequently no-take’ (selection frequency¼60–79% for no-
take zone), ‘most frequently sustainable fishing’ (selection
frequency¼80–100% for sustainable fishing zone), ‘frequently
sustainable fishing’ (selection frequency¼60–79% for sustainable
fishing zone) and ‘flexible’ (the rest of the planning units selected).
The details of how targets were set are in Grantham and
Possingham [36]. A target of 30% was used for each habitat type
across the MPA network, as it is specified in the design criteria
developed for the Raja Ampat MPA network (TNC unpublished
data). All areas important for species life history stages and
specific important locations had a 75% target given their impor-
tance for species persistence and their small distributions. Known
functional reef fish spawning aggregations were given a target of
100% due to their rarity and importance [34]. For areas with
inactive coral reef fish spawning a 50% target was used. For most
species distributions a target of 30% was used as the data source
was participatory expert mapping which made them less reliable
observations due to likely errors in mapping compared to field
observations. The exceptions to this were crocodiles, white
dolphin, sharks and the dugong hotspots, which had a 50% target
due their importance in the region. A 75% target was used for each
community fishing ground to be represented in the sustainablefishing zone to ensure that communities would have access to
their primary fishing grounds by including a substantial propor-
tion of each fishing ground in the fishing zone.
A cost layer was developed for each zone (except for the
planning units designated as ‘unallocated’) that considered the
relative socio-economic costs of implementing that zone in each
planning unit. This determines the relative preference for where
targets should be achieved. For example, all else being equal,
Marxan with Zones will try to avoid placing any planning unit in
the higher cost zone. Each planning unit has a cost for being
assigned to each of the zones. All values in each planning unit was
standardized first for each cost feature by dividing the value in
the planning unit by the total across all planning units for each
feature of interest (e.g. reef condition, distance to community).This ensures the relative abundance or intensity of each feature is
maintained. This was done for both continuous values and for
presence/absence of a feature. The cost of placing a planning unit
in a no-take zone, Cnt, is
Cnt¼ r þmþ f þc þsþ100 ð1Þ
where r is a measure of reef condition, m is the occurrence of
mariculture (seaweed farmingþpearl farming/2), f is the occur-
rence of fishing structures (FADsþfishing cagesþfishing shel-
tersþsero traps/4), c is a measure of the cost of a site in terms of
its use for community fishing grounds (sum of all fishing grounds/
127 (which is the number of total fishing grounds)) and s is the
occurrence of a sediment plume.
H.S. Grantham et al. / Marine Policy 38 (2013) 184–194 187
8/21/2019 A Comparison of Zoning Analyses to Inform the Planning of a Marine Protected Area Network in Raja Ampat, Indo…
http://slidepdf.com/reader/full/a-comparison-of-zoning-analyses-to-inform-the-planning-of-a-marine-protected 5/11
The sustainable fishing zone cost value for each planning unit
was the distance from that planning unit to the nearest community
with planning units closer to a community cheaper than those
further away. This was chosen because fishing grounds closer to
communities are easier for that community to access. The cost of
placing a planning unit in the sustainable fishing zone, Csf, is
Csf ¼ d ð2Þ
where d is the distance to the nearest community.Planning units are discrete areas used as potential candidate
areas for a no-take or sustainable fishing zone. In addition to
achieving targets and minimizing the total cost, Marxan with
Zones also tries to cluster planning units assigned to the same
zone for ease of practical implementation. To do this, the user
indicates the relative importance reducing fragmentation by
minimizing the boundary of the selected areas within a zone
relative to their planning unit cost by adjusting a parameter called
the zone boundary cost. This was explored by varying the
weighting to determine an appropriate value that ensured solu-
tions were clustered.
To explore trade-offs between no-take zone and sustainable
fishing zone targets, a weighting value is specified for each target
for each zone to control its importance relative to other targets.
When a solution cannot be found that achieves all targets, this
weighting will determine which targets are more important. This
weighting was varied until all the sustainable fishing zone targets
were achieved in preference to the no-take zone targets given this
will result in a solution that local communities are more likely to
implement.
The study area includes 11,480 planning units in total: 1119 in
Ayau-Asia, 3416 in Dampier Straits, 1816 in Kofiau and Boo
Islands, 3786 in Southeast Misool, 677 in Mayalibit Bay and 665
in West Waigeo MPA. The planning units were mostly marine
areas but also included some areas on land that contain man-
groves and turtle nesting beaches. The distribution/abundance of
each feature and each cost layer measured for each planning unit.
Two areas were already zoned and thus were assigned to a
pre-determined status. The first was the entire Sayang-WayagMPA where there is already an agreement with the custodians of
this region for the entire MPA to be a special no-take zone. The
other area is a no-take zone already implemented in Southeast
Misool MPA, where there is a 25-year marine conservation
agreement with custodians of the area and Misool Ecoresort.
There are other areas that are being negotiated with communities
for zoning and others types of existing management (e.g. sasi
areas which are temporal closures, usually for invertebrates) but
were not included in the analysis as the information was not
available at the time of this study and it was not known the
extent to which they were enforced.
2.3. Comparison of scenarios
A number of scenarios were run to reflect different zoning
analysis (Table 1). Scenario one was the baseline scenario that
identified locations for both the no-take and the sustainable
fishing zones. This was compared to scenario two, which only
identified areas only for the no-take zone to investigate what
happens when areas are not also selected for the sustainable
fishing zone and how this affects access to community fishing
grounds. If a large proportion of a community fishing grounds is
selected for the no-take zone, this would reduce access for that
community. The impact of the two scenarios on each community
fishing ground was measured by calculating the proportionselected as no-take based on the ‘‘best solution’’ for each scenario.
The ‘‘selection frequency’’, between these scenarios was also
compared. This was because the selection frequency is often used
to guide spatial planning as it enables a consideration of several
options for planning. To compare selection frequencies a spear-
man rank correlation coefficient was applied to compare the
relative ranks of selection frequencies for each planning unit
and tested the significance of correlations with randomization.
The second comparison was between scenarios one and three
(Table 1). Scenario one was the baseline and scenario three was
similar to this, except for how Southeast Misool MPA was treated.
At that site for this scenario, fishing grounds in the sustainable
fishing zone were defined only based on each fisheries species
and did not include information on which community fished
there. Targets were set to include 75% of each fishery extent into
the sustainable fishing zone (e.g. 75% of where grouper are
caught). This was to measure the impact on each community’s
access to fisheries of the areas identified for the no-take zone in
the analysis when information on each community is not
included. To compare these two scenarios the amount of each
community fishing ground (as defined in scenario one) was
measured in Southeast Misool MPA inside the sustainable fishing
zone ‘‘best solution’’.
The final comparison was between scenario ones and four
(Table 1). For scenario four a new approach to identify potential
zoning configurations is introduced that integrates information
from an expert derived zoning proposal. This proposal was
generated by asking practitioners at a workshop to identify areas
where they thought no-take zones would be most appropriatebased on their knowledge of zoning issues and through working
with communities likely to be impacted by the design of the
zoning plan. Workshop participants included some government
representatives and non-governmental organizations. At the
workshop the results from initial Marxan with Zones analyses
was showed to participants, and it was asked for them to modify
the results given their knowledge of the area and an under-
standing of the needs of local communities. For the expert derived
no-take proposal the representation of each ecosystem and
amount of each community fishing ground inside the no-take
zone proposal was measured. The expert derived zoning proposal
was then used as a target for the no-take zone, varying the target
between 0% and 100%. A target of zero was the same as scenario
one (i.e. ignored the proposal), a target of 100% meant that all of the expert proposed no-take areas had to be included in the no-
take zone. Targeting different proportions of the expert derived
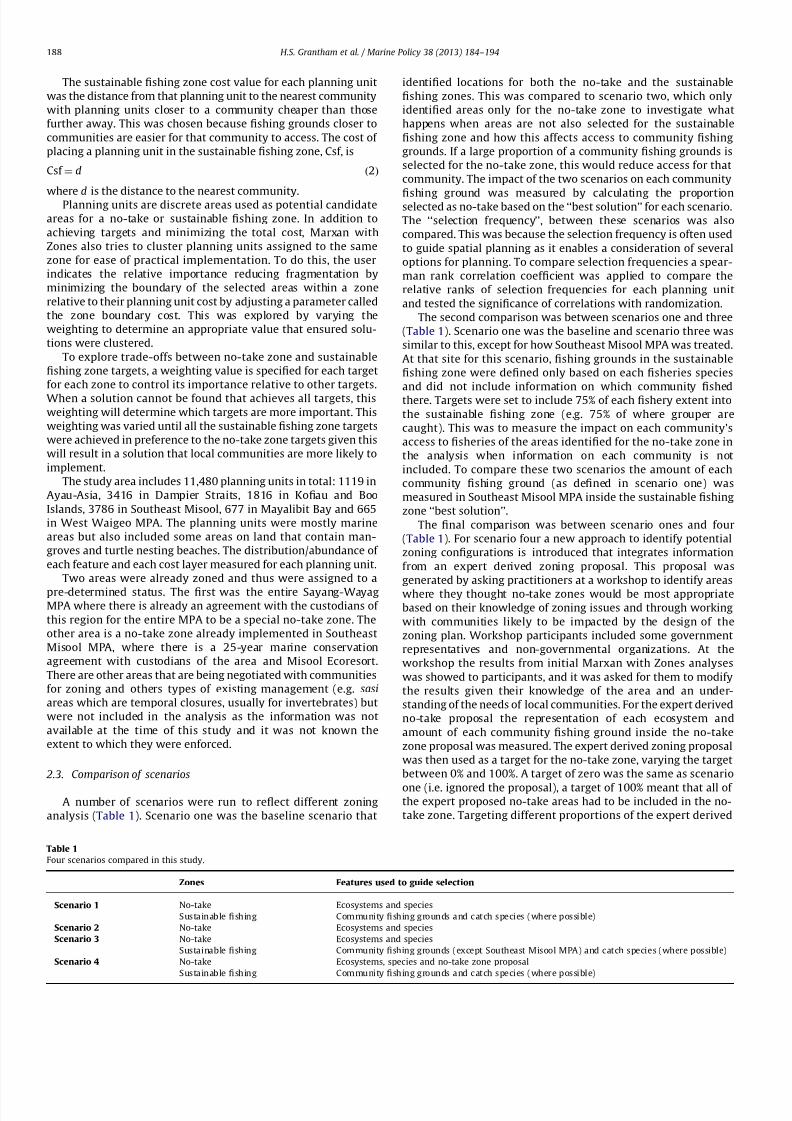
Table 1
Four scenarios compared in this study.
Zones Features used to guide selection
Scenario 1 No-take Ecosystems and species
Sustainable fishing Community fishing grounds and catch species (where possible)
Scenario 2 No-take Ecosystems and species
Scenario 3 No-take Ecosystems and species
Sustainable fishing Community fishing grounds (except Southeast Misool MPA) and catch species (where possible)
Scenario 4 No-take Ecosystems, species and no-take zone proposal
Sustainable fishing Community fishing grounds and catch species (where possible)
H.S. Grantham et al. / Marine Policy 38 (2013) 184–194188
8/21/2019 A Comparison of Zoning Analyses to Inform the Planning of a Marine Protected Area Network in Raja Ampat, Indo…
http://slidepdf.com/reader/full/a-comparison-of-zoning-analyses-to-inform-the-planning-of-a-marine-protected 6/11
zoning proposal in the zoning analysis was explored in two ways.
First the proportion of the no-take zone cost metric that was
inside the best solution for the no-take zone was measured. Then
the number of community fishing grounds that did not achieve
their target was measured.
3. Results
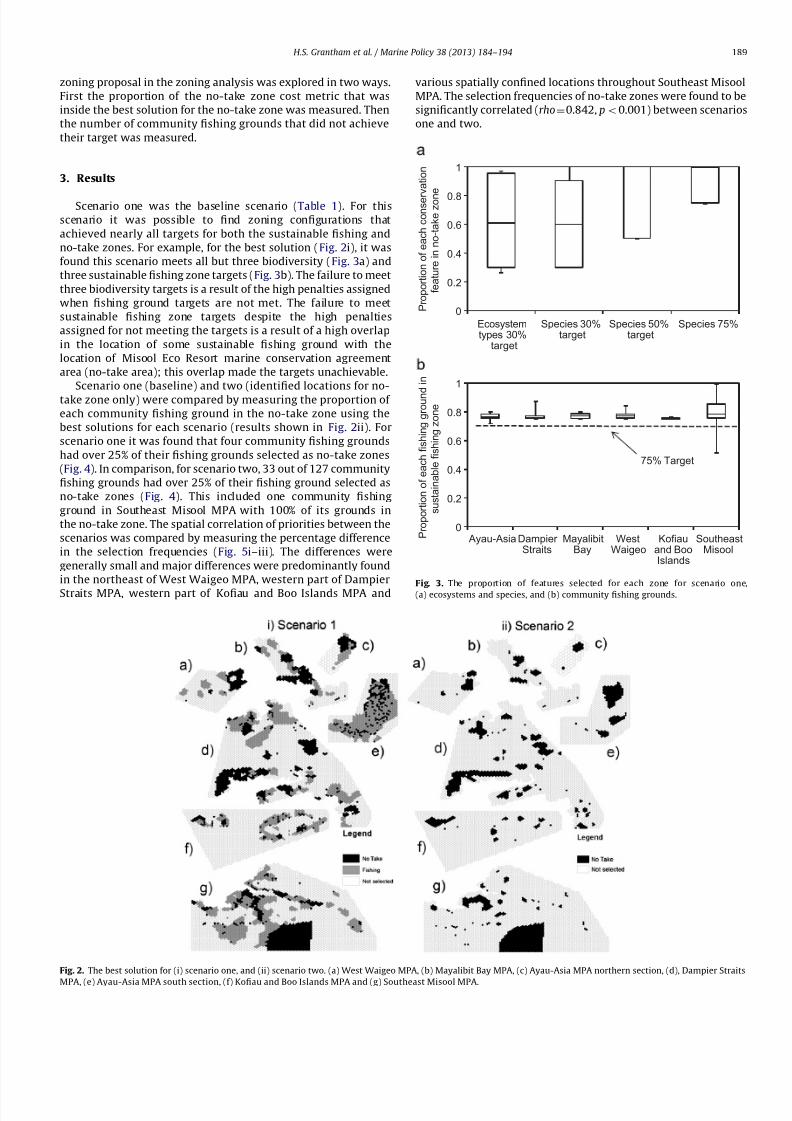
Scenario one was the baseline scenario (Table 1). For this
scenario it was possible to find zoning configurations that
achieved nearly all targets for both the sustainable fishing and
no-take zones. For example, for the best solution (Fig. 2i), it was
found this scenario meets all but three biodiversity (Fig. 3a) and
three sustainable fishing zone targets (Fig. 3b). The failure to meet
three biodiversity targets is a result of the high penalties assigned
when fishing ground targets are not met. The failure to meet
sustainable fishing zone targets despite the high penalties
assigned for not meeting the targets is a result of a high overlap
in the location of some sustainable fishing ground with the
location of Misool Eco Resort marine conservation agreement
area (no-take area); this overlap made the targets unachievable.
Scenario one (baseline) and two (identified locations for no-
take zone only) were compared by measuring the proportion of
each community fishing ground in the no-take zone using the
best solutions for each scenario (results shown in Fig. 2ii). For
scenario one it was found that four community fishing grounds
had over 25% of their fishing grounds selected as no-take zones
(Fig. 4). In comparison, for scenario two, 33 out of 127 community
fishing grounds had over 25% of their fishing ground selected as
no-take zones (Fig. 4). This included one community fishing
ground in Southeast Misool MPA with 100% of its grounds in
the no-take zone. The spatial correlation of priorities between the
scenarios was compared by measuring the percentage difference
in the selection frequencies (Fig. 5i–iii). The differences were
generally small and major differences were predominantly found
in the northeast of West Waigeo MPA, western part of Dampier
Straits MPA, western part of Kofiau and Boo Islands MPA and
various spatially confined locations throughout Southeast Misool
MPA. The selection frequencies of no-take zones were found to be
significantly correlated (rho¼0.842, po0.001) between scenarios
one and two.
Fig. 2. The best solution for (i) scenario one, and (ii) scenario two. (a) West Waigeo MPA, (b) Mayalibit Bay MPA, (c) Ayau-Asia MPA northern section, (d), Dampier Straits
MPA, (e) Ayau-Asia MPA south section, (f) Kofiau and Boo Islands MPA and (g) Southeast Misool MPA.
0
0.2
0.4
0.6
0.8
1
Ecosystemtypes 30%
target
Species 30%target
Species 50%target
Species 75%
P r o p o r t i o n
o f e a c h
c o n s e r
v a t i o n
f e a t u r e
i n
n o - t a k e
z o n
e
0
0.2
0.4
0.6
0.8
1
Ayau-Asia DampierStraits
MayalibitBay
WestWaigeo
Kofiauand BooIslands
SoutheastMisool
P r o p o r t i o n
o f e a c h
f i s h i n g
g r o u n d
i n
s u s t a i n a b l e
f i s h i n g
z o n e
75% Target
Fig. 3. The proportion of features selected for each zone for scenario one,
(a) ecosystems and species, and (b) community fishing grounds.
H.S. Grantham et al. / Marine Policy 38 (2013) 184–194 189

8/21/2019 A Comparison of Zoning Analyses to Inform the Planning of a Marine Protected Area Network in Raja Ampat, Indo…
http://slidepdf.com/reader/full/a-comparison-of-zoning-analyses-to-inform-the-planning-of-a-marine-protected 7/11
Results from scenario one (baseline) and three (Southeast
Misool MPA fishing grounds defined only by species and not
community) were compared, and there were differences in the
proportion of each community fishing grounds contained in the
sustainable fishing zone for the two scenarios (Fig. 6). For scenario
one, all but 4 community fishing grounds had reached its target of
75% of their grounds in the sustainable fishing zone because targets
were set for them. Those that had less were due to a significant
overlap with Misool Eco Resort making the targets unachievable.For scenario three many community fishing grounds did not
achieved their target. There were 18 community fishing grounds
below the 75% target level, and the proportion of a communities
fishing area for each species varied from 10% to 100%.
For the expert derived zoning proposal developed by work-
shop participants for the no-take zone (shown in Fig. 7i), ecosys-
tems were unevenly represented, ranging from 0% to 100%, with
most having around 20% of their distribution within the proposal
(Fig. 8a). For the community fishing grounds, there was variability
in the proportion within the proposal, with some community
fishing grounds largely covered by no-take zones (Fig. 8b). There
was variation between the MPAs.
Targeting different proportions of the expert derived no-take
zone proposal in the zoning analysis influenced the results and
the trade-offs were measured in two ways. The first was measur-
ing the proportion of no-take zone cost metric selected by thebest solution. The total cost of the best solution was unaffected by
the proportion of expert derived no-take zone proposal included
in the no-take zone proposal when that proportion is less than
40% (Fig. 9a). Once more than 40% of the expert derived no-take
zone proposal must be in the result, the cost increases. The second
method of measuring the trade-off was based on the number of
community fishing grounds targets not met. There was little
change in the measurement until 80% of the expert derived no-
take zone proposal was targeted (Fig. 9b). The results of this
0
0.2
0.4
0.6
0.8
1
0
S c e n a r i o
2
Scenario 1
Village fishing ground
0.2 0.4 0.6 0.8 1
Fig. 4. Proportion of fishing ground in the no-take zone comparing scenarios one
and two. Hashed line represents the maximum proportion a fishing ground should
be in the no-take zone to ensure sustainable fishing zone targets could be
achieved.
Fig. 5. Selection frequency for no-take zone for (i) scenario one, (ii) scenario two, and (iii) percentage difference for no-take zone selection frequencies between scenarios
one and two. (a) West Waigeo MPA, (b) Mayalibit Bay MPA, (c) Ayau-Asia MPA northern section, (d), Dampier Straits MPA, (e) Ayau-Asia MPA south section, (f) Kofiau and
Book Islands MPA and (g) Southeast Misool MPA.
0
0.25
0.5
0.75
1
0
S c e n a r i o
3
Scenario 1
Village Fishing Ground
0.25 0.5 0.75 1
Fig. 6. Proportion of each community fishing grounds in the sustainable fishing
zone for each fishing grounds in Southeast Misool MPA comparing scenarios one
and three.
H.S. Grantham et al. / Marine Policy 38 (2013) 184–194190

8/21/2019 A Comparison of Zoning Analyses to Inform the Planning of a Marine Protected Area Network in Raja Ampat, Indo…
http://slidepdf.com/reader/full/a-comparison-of-zoning-analyses-to-inform-the-planning-of-a-marine-protected 8/11
scenario with a 60% target of the expert derived no-take zone
proposal were compared with scenario one, based on classifying
each planning on how frequently it was selected for either zone
(Fig. 7iii). It was found that there were some differences between
the two scenarios spatially.
4. Discussion
The ability to balance access to fisheries, biodiversity conser-
vation and other human demands is important in many regions
globally. A major advance in providing support to multi-objective
MPA zoning is the ability to satisfy the interests of multiple
stakeholders [11]. This study shows that Marxan with Zones can
be a powerful decision support tool to help with this process. This
type of analysis is especially important for planning in Raja Ampat
as zoning needs to ensure that all of the numerous communities
have access to marine resources for subsistence within their
traditional marine tenure systems [29,37,38].
This study focused on two types of objectives: biodiversity(representation of ecosystems and protection of species of con-
servation concern) and fisheries (sustainability and access to
fisheries). Despite the competing uses that conservation and
fishing activities represent, zoning configurations that achieved
nearly all the targets considered were found. The occasional
inability to achieve all objectives was mainly a result of conflict
between different objectives, as well as the need to include past
decisions (for example, established areas such as the Misool Eco
Resort).
Locations important for conservation zones are often planned
without simultaneously planning for other types of zones and
considering trade-offs that between alternative management
scenarios. Taking this route can lead to inequitable impact for
particular communities (25% in this case) as demonstrated by
Fig. 7. Comparing scenarios one and four. (i) Expert derived no-take zone proposal resulting from participants at a workshop. (ii) and (iii) show classified solutions for
scenarios one and four. The selection frequency was used to classify each planning unit into ‘mostly no-take’ (selection frequency ¼60–100% for no-take zone), ‘mostly
sustainable fishing’ (selection frequency¼60–100% for sustainable fishing zone), ‘mostly unallocated’ (selection frequency¼60–100% for unallocated zone), and ‘flexible’
(the rest of the planning units selected). (a) West Waigeo MPA, (b) Mayalibit Bay MPA, (c) Ayau-Asia MPA northern section, (d), Dampier Straits MPA, (e) Ayau-Asia MPA
south section, (f) Kofiau and Boo Islands MPA and (g) Southeast Misool MPA.
0
0.2
0.4
0.6
0.8
1
Ecosystem
types
Species 30%
target
Species 50%
target
Species 75%
P r o p o r t i o n o f e a c h c o
n s e r v a t i o n
f e a t u r e i n n o - t a k e z o n
e p r o p o s a l
0
0.2
0.4
0.6
0.8
1
Ayau-Asia Dampier
Straits
Mayalibit
Bay
West
Waigeo
Kofiau
and Boo
Islands
Southeast
Misool
P r o p o r t i o n o f e a c h f i s h i n g g
r o u n d i n
t h e n o - t a k e z o n e p r o p o s a l
Fig. 8. The proportion of each feature with a no-take zone proposal in scenario
four showing (a) ecosystems and species, and (b) community fishing grounds. The
boxplot shows the range, upper and lower quartiles and median values.
H.S. Grantham et al. / Marine Policy 38 (2013) 184–194 191

8/21/2019 A Comparison of Zoning Analyses to Inform the Planning of a Marine Protected Area Network in Raja Ampat, Indo…
http://slidepdf.com/reader/full/a-comparison-of-zoning-analyses-to-inform-the-planning-of-a-marine-protected 9/11
scenario two. A similar finding was made by Weeks et al. [16] and
Klein [12] but for the boundaries of MPAs rather than zone
boundaries within an MPA network. In addition, when solely
focusing on distribution of catch species and not community
fishing grounds, this also generated inequitable impacts on
communities (scenario 3). These results point to the importance
of setting targets to represent stakeholders’ needs in multi-
objective zoning. Too often targets are solely based on ecologicaldata, potentially leading to inequitable impacts on communities
and low support for the MPA and compliance with its regulations.
A limitation of any zoning approach is the existence of relatively
even data to comprehensively represent each planning objective. If
one competing objective or region (e.g. an MPA) has more
comprehensive data than another, it might skew the identification
of zones. To try and overcome this issue participatory expert
mapping was needed to fill in key knowledge gaps. The experts
interviewed were a combination of staff from organizations work-
ing in the region, community groups and government representa-
tives. This method was used to help map ecosystems, specific
locations important for species, and to improve the knowledge of
the locations where communities fish. This was a rapid and cost-
effective method of developing spatial data. There are however,
likely prejudice toward particular types of information and spatial
biases in participants knowledge [39] and where possible these
were crossed checked with field observations.
This analysis could be improved with more data on biodiver-
sity. Seagrass and mangroves distributions were fairly coarsely
mapped and could be improved through remote sensing and field
sampling techniques [40]. It would also be useful to classify both
of these ecosystems into different types based on differences in
their species composition, so the variation could be captured inplanning no-take zones. Many ecosystems were not mapped due
to time constraints and further mapping could focus on other
types of ecosystems such as offshore benthic habitat mapping and
identification of pelagic ecosystems [41] that might allow for
taking a stronger ecosystem approach to management.
The fishing information also presented some limitations.
Attributes were not identified like which areas within the fishing
grounds were the most productive or otherwise important to the
community, which reefs were currently being fished versus those
that were historically used, grounds specific to reef versus those
specific to non-reef fisheries, which species were more important
compared to others. These issues should all be considered for
future planning efforts. In addition, there are a number of ways
the fishing target could have been developed. A fixed level of 75%
target was chosen for each fishing ground. For example, the target
could be adjusted depending on the size and importance of the
ground or through specific negotiations with the community.
Social, economic and political factors will have a very large
influence on where no-take zones can be implemented. This
influence is loosely represented through the data on fisheries
examined, a major consideration for the MPA zoning process. To
improve this, a novel method of incorporating an expert derived
no-take zoning proposal into the analysis was included that was
developed with people who are working with communities in
developing the zoning plan (scenario four). This allowed indir-
ectly incorporate social, economic and political considerations.
The expert driven proposal represents a more feasible solution
based on knowledge of these communities but it still had biases
in their knowledge about the region. According to the data, theproposal would unfairly impact some communities more than
others and it did not evenly represent all the ecosystem types
assuming the conservation of ecosystems is an important objec-
tive for the MPA network. The results from scenario four can be
used as a method of integrating local knowledge with a systema-
tic zoning analysis.
A major objective of MPA network was ensuring zoning
contributed toward sustainable fisheries. What makes a sustain-
able fishery is a complex matter [42,43] and representing this in a
systematic planning platform difficult. The approach to dealing
with fisheries in this study was static and quite simple. Targets for
different types of coral reefs and fishing grounds were included.
There is evidence to suggest closures can improve fisheries due to
the increased probability of increasing fish abundance and catch[44] and protection of a proportion of each ecosystem can
increase fisheries catch outside of those areas [45]. More sophis-
ticated approaches to determining the costs and benefits of
zoning for sustainable fisheries and fishery access are needed
for small-scale fisheries and MPA zoning, although transparency
and ability to implement in tropical countries should be consid-
ered. These approaches are likely to require a lot more data (e.g.
spatial fish and fisheries dynamics), which might not be readily
available in many tropical countries. Other less data intensive
approaches could include ensuring key species and interactions
within the ecosystem are included within a no-take zone [46],
further protection of key life history stages areas of fisheries
species (e.g. spawning and nursery grounds), and addressing
trophic ‘‘gate keepers’’ such as small pelagic fish [47–49].
0.1
0.12
0.14
0.16
0.18
0.2
0.22
0.24
0.26
0 100
P r o p o r t i o n o
f t h e s
u m
o f n o - t a
k e z o n e
c o s
t ( % )
Proportion of no-take zone proposal targeted (%)
108
110
112
114
116
118
120
122
124
0
N u m
b e r o
f f i s h i n g g r o u n
d s
t h a t
d o n o
t
m e e
t t a r g e
t ( % )
20 40 60 80
20 40 60 80 100
Proportion of no-take zone proposal targeted (%)
Fig. 9. The trade-offs when increasing the amount of the expert derived no-take
zone proposal as a target for the no-take zone. Different percentages of the expert
derived proposal were targeted to be included in the no-take zone ranging from 0%
(none of it targeted) to 100% (all of it targeted). Measuring (a) proportion of
no-take zone cost metric, and (b) number of community fishing grounds that did
not reach their target.
H.S. Grantham et al. / Marine Policy 38 (2013) 184–194192

8/21/2019 A Comparison of Zoning Analyses to Inform the Planning of a Marine Protected Area Network in Raja Ampat, Indo…
http://slidepdf.com/reader/full/a-comparison-of-zoning-analyses-to-inform-the-planning-of-a-marine-protected 10/11
A visual representation of zoning solutions from the analyses in
this study is a powerful tool to help the decision makers decide on
zoning configurations. There are a number of spatial representations
produced in this project that can be used to facilitate those discus-
sions. For example, the maps that present the frequency a particular
planning unit selected for a specific zone (e.g. Fig. 5i and ii) illustrate
the best options for achieving targets while also considering other
objectives for both zones. The areas identified in these maps could be
used to guide future location of final zones, with the areas that aremost frequently selected to be included in a particular zone type
likely to be critical areas. The map showing which zone was most
frequently selected is also useful as it summarizes the whole analysis
for a scenario on a single map and makes it visually easier to interpret
e.g. (Fig 7ii and iii). The maps that present a single solution are the
probably the least useful because they only show one configuration of
zones out of potentially many (e.g. Fig. 2). They do, however, indicate
what a solution that achieves most of the targets looks like. Finally
the map that incorporates the original expert derived zoning proposal
is very useful as it shows within the proposal which areas have
agreement for the zone in the proposal, which areas do not and
finally, other areas to consider for that zone e.g. (Fig. 7iii).
Identifying the most socially-acceptable locations particularly for
no-take zones is a difficult process. The analysis presented here can
help inform potential locations and is part of a much wider process
that includes extensive community consultation. The results from this
study have provided scenarios and options to government, NGO and
communities, working towards developing zoning plans for a net-
work of MPAs within the Raja Ampat Regency.
Acknowledgments
This project would not be possible without the efforts of
government, NGO and community partners to collect data rele-
vant to spatial planning. Foremost, we would like to thank the
communities we work with at MPA sites, who have shared their
local knowledge about their marine resources, to contribute
towards the zoning process. We would like to sincerely thanklocal staff from The Nature Conservancy (L. Rumetna, S. Tjoe,
S.Wawiyai, M. Syakir, M. Saleh, A. Darmarwan and Lukas
Rumetna) and Conservation International (C. Huffard, M.E.
Lazuardi) for contributing their data towards this analysis, and
for providing technical inputs into the interpretation of the
results. We would also like to thank local NGO and government
partners, especially BBKSDA and DKP for their invaluable con-
tributions during workshops. We would like to thank Mark
Erdmann for helping with technical inputs and help with work-
shops. Finally we thank the staff and students in The Spatial
Ecology Lab, University of Queensland for input throughout this
project, in particular, Carissa Klein. This work was done under the
Bird’s Head Ecosystem-based management program, funded by
the David and Lucille Packard Foundation. HP was supported bythe Australian Research Council.
Appendix A. Supplementary information
Supplementary data associated with this article can be found
in the online version at http://dx.doi.org/10.1016/j.marpol.2012.
05.035.
References
[1] Halpern BS, Walbridge S, Selkoe KA, Kappel CV, Micheli F, D’Agrosa C, et al. Global
map of human impact on marine ecosystems. Science 2008;319:948–952.
[2] Douvere F. The importance of marine spatial planning in advancing ecosys-tem-based sea use management. Mar Policy 2008;32:762–771.
[3] Brown K, Adger WN, Tompkins E, Bacon P, Shim D, Young K. Trade-off analysis for marine protected area management. Ecol Econ 2001;37:417–434.
[4] Lahdelma R, Salminen P, Hokkanen J. Using multicriteria methods in environ-mental planning and management. Environ Manage 2000;26:595–605.
[5] Wood L, Dragicevic S. GIS-based multicriteria evaluation and fuzzy sets to identifypriority sites for marine protection. Biodivers Conserv 2007;16:2539–2558.
[6] Moilanen A, Wilson KA, Possingham HP. Spatial conservation prioritization:quantitative methods and computational tools. Oxford University Press; 2009.
[7] Pressey RL, Nicholls AO. Efficiency in conservation planning: scoring versus
iterative approaches. Biol Conserv 1989;50:199–218.[8] Fernandes L, Day J, Lewis A, Slegers S, Kerrigan B, Breen D, et al. Establishing
representative no-take areas in the Great Barrier Reef: large-scale implementa-tion of theory on marine protected areas. Conserv Biol 2005;19:1733–1744.
[9] Possingham HP, Andelman SJ, Noon BR, Trombulak S, Pulliam HR. Makingsmart conservation decisions. In: Orians G, Soule M, editors. Researchpriorities for conservation biology. California: Island Press; 2001.
[10] Ban NC, Klein CJ. Spatial socioeconomic data as a cost in systematic marineconservation planning. Conserv Lett 2009;2:206–215.
[11] Watts ME, Ball IR, Stewart RS, Klein CJ, Wilson K, Steinback C, et al. Marxanwith zones: software for optimal conservation based land- and sea-usezoning. Environ Model Software 2009;24:1513–1521.
[12] Klein CJ, Steinback C, Watts M, Scholz AJ, Possingham HP. Spatial marinezoning for fisheries and conservation. Front Ecol Environ 2010;8:349–353.
[13] Margules CR, Pressey RL. Systematic conservation planning. Nature2000;405:243–253.
[14] Pressey RL, Bottrill MC. Opportunism, threats, and the evolution of systema-tic conservation planning. Conserv Biol 2008;22:1340–1345.
[15] van der Werf GR, Morton DC, DeFries RS, Olivier JGJ, Kasibhatla PS, JacksonRB, et al. CO2 emissions from forest loss. Nat Geosci 2009;2:737–738.[16] Weeks R, Russ GR, Bucol AA, Alcala AC. Incorporating local tenure in the
systematic design of marine protected area networks. Conserv Lett 2010;3:445–453.
[17] Allen GR. Conservation hotspots of biodiversity and endemism for Indo-Pacificcoral reef fishes. Aquat Conserv: Mar Freshwater Ecosystems 2008;18:541–556.
[18] Roberts CM, McClean CJ, Veron JEN, Hawkins JP, Allen GR, McAllister DE, et al.Marine biodiversity hotspots and conservation priorities for tropical reefs.Science 2002;295:1280–1284.
[19] Allen GR, Erdmann MV. Reef fishes of the Bird’s Head Peninsula, West Papua,Indonesia. Check List 2009;5:587–628.
[20] Veron JEN, Devantier LM, Turak E, Green AL, Kininmonth S, Stafford-Smith M,et al. Delineating the Coral Triangle. Galexea, J Coral Reef Stud 2009;11:91–100.
[21] Brooks TM, Mittermeier RA, Mittermeier CG, Da Fonseca GAB, Rylands AB,Konstant WR, et al. Habitat loss and extinction in the hotspots of biodiversity. Perdida de Habitat y Extinciones en Areas Crıticas para laBiodiversidad. Conserv Biol 2002;16:909–923.
[22] Donnelly R, Neville D, Mous P. Report on a rapid ecological assessment of the
Raja Ampat Islands, Papua, Eastern Indonesia, held October 30–November 22,2002. The Nature Conservancy—Southeast Asia Centre for Marine ProtectedAreas; 2003.
[23] Lourdes M, Palmoares D, Heymans JJ. Historical ecology of the Raja AmpatArchipelago. Fisheries Centre research reports. The Fisheries Centre, Uni-versity of British Columbia; 2006.
[24] Timmer JA. Brief social and political history of Papua 1962–2005. In: MarshallAJ, Beehler B, editors. The ecology of Indonesia series volume VI: the ecologyof Papua. Singapore: Periplus; 2007. p. 1098–1124.
[25] Bailey M, Sumaila UR. Towards ecosystem-based management in the Bird’sHead function seascape of Papua, Indonesia: the economic sub-project. In:Bailey M, Pitcher TJ, editors. Ecological and economic analyses of marineecosystems in the Bird’s Head seascape. Papua, Indonesia: II FisheriesResearch Reports; 2008 [chapter 2].
[26] Ainsworth CH, Pitcher TJ, Rotinsulu C. . Evidence of fishery depletions and shiftingcognitive baselines in Eastern Indonesia. Biol Conserv 2008;141:848–859.
[27] Varkey DA, Ainsworth CH, Pitcher TJ, Goram Y, Sumaila R. Illegal, unreportedand unregulated fisheries catch in Raja Ampat Regency, Eastern Indonesia.Mar Policy 2009;34:228–236.
[28] McLeod E, Szuster B, Sasi Salm RV. and Marine Conservation in Raja Ampat,Indonesia. Coastal Manage 2009;37:656–676.
[29] The Nature Conservancy. Coastal rural appraisal report in Kofiau and Misoolarea of Raja Ampat islands. The Nature Conservancy South East Asia formarine protected areas report; 2004.
[30] Muljadi A. Monitoring report on uses of marine resources in Kofiau marineprotected area, Raja Ampat, Indonesia 2006–2008. The Nature ConservancyBali, Indonesia; 2009.
[31] Syakir M, Lantang R. Monitoring report on uses of marine resources in SouthEast Misool, Raja Ampat, Indonesia 2007–2008. The Nature Conservancy Bali,Indonesia; 2009.
[32] De Vantier L, Turak E, Alllen G. Reef-scapes reef habitats and coral commu-nities of Raja Ampat, Birds’s Head Seascape, Papua, Indonesia. Report to TheNature Conservancy. Bali, Indonesia; 2009.
[33] English S, Wilkinson C, Baker V. Survey manuel for tropical marine resources.Aust Inst Mar Sci 1997.
[34] Wilson J, Rhodes K, Rotinsulu C. Aggregation fishing and local managementwithin a marine protected area in Indonesia. SPC Live Reef Fish Inf
2010;19:7–13 [Bulletin].
H.S. Grantham et al. / Marine Policy 38 (2013) 184–194 193

8/21/2019 A Comparison of Zoning Analyses to Inform the Planning of a Marine Protected Area Network in Raja Ampat, Indo…
http://slidepdf.com/reader/full/a-comparison-of-zoning-analyses-to-inform-the-planning-of-a-marine-protected 11/11
[35] Firman A, Azhar I. Atlas Sumberdaya Pesisir Raja Ampat Provinsi Irian JayaBarat; 2006.
[36] Grantham HS, Possingham HP. Zoning marine protected areas for biodiversityconservation and community livelihoods: a case study from Raja Ampat, WestPapua. Report to The Nature Conservancy; University of Queensland 2010.
[37] McKenna SA, Allen GR, Suryadi S, editors. A marine rapid assessment of theRaja Ampat islands, Papua Province, Indonesia. RAP bulletin of biologicalassessment, vol. 22. Washington DC: Conservation International; 2002.
[38] TNC and WWF. Report on a rapid ecological assessment of the Raja Ampatislands, Papua, Eastern Indonesia, held October 30–November 22, 2002; 2003.
[39] Reed MS. Stakeholder participation for environmental management:
a literature review. Biol Conserv 2008;141:2417–2431.[40] Green EP, Clark CD, Mumby PJ, Edwards AJ, Ellis AC. Remote sensing
techniques for mangrove mapping. Int J Remote Sensing 1998;19:935–956.[41] Game ET, Grantham HS, Hobday AJ, Pressey RL, Lombard AT, Beckley LE, et al.
Pelagic protected areas: the missing dimension in ocean conservation. TrendsEcol Evol 2009;24:360–369.
[42] Hilborn R, Stokes K, Maguire J-J, Smith T, Botsford LW, Mangel M, et al. Whencan marine reserves improve fisheries management? Ocean Coastal Manage2004;47:197–205.
[43] Cinner JE, McClanahan TR, Daw TM, Graham NAJ, Maina J, Wilson SK, et al.
Linking social and ecological systems to sustain coral reef fisheries. Curr Biol
2009;19:206–212.
[44] Babcock RC, Shears NT, Alcala AC, Barrett NS, Edgar GJ, Lafferty KD, et al.
Decadal trends in marine reserves reveal differential rates of change in direct
and indirect effects. Proc Natl Acad Sci 2010.
[45] Guidetti P. Potential of marine reserves to cause community-wide changes
beyond their boundaries. Conserv Biol 2007;21:540–545.
[46] Baskett ML, Micheli F, Levin SA. Designing marine reserves for interacting
species: Insights from theory. Biol Conserv 2007;137:163–179.[47] Rice JC, Rochet M-J. A framework for selecting a suite of indicators for
fisheries management. ICES J Mar Sci 2005;62:516–527.
[48] Cury P, Bakun A, Crawford RJM, Jarre A, Quinones RA, Shannon LJ, et al. Small
pelagics in upwelling systems: patterns of interaction and structural changes
in wasp-waist ecosystems. ICES J Mar Sci 2000;57:603–618.
[49] Bakun A. Wasp-waist populations and marine ecosystem dynamics: navigat-
ing the predator pit topographies. Prog Oceanogr 2006;68:271–288.
H.S. Grantham et al. / Marine Policy 38 (2013) 184–194194