a complex system characterization of modern telecommunication services
TRANSCRIPT

A Complex System Characterization of ModernTelecommunication Services
Perambur S. NeelakantaWichai Deecharoenkul
Department of Electrical Engineering,Florida Atlantic University,Boca Raton, FL
A modern telecommunication service is portrayed as a complex systemand is characterized by its stochastical attributes and fuzzy performanceconsiderations. Asynchronous transfer mode (ATM) telecommunicationis studied as an example of such a complex system. A call admissioncontrol (CAC) procedure is developed using a fuzzy inference methodapplied to the complex connection patterns of ATM service. Such aninference alleviates the potentially over-conservative nature of resourceallocation. A complex system parameter is defined and used as a fuzzyvariable in the inference strategies pursued. Some practical considerationsand merits of the present study are indicated and discussed.
1. Introduction
Modern telecommunication systems are aptly qualified to be describedas complex systems. The associated vastness of inherent technology,variety in service considerations, and the plethora of application pro-files have posed an inevitable attribute of interaction between the con-stituent subsystems of modern telecommunication engineering. Such anattribute describes, in general, how the resources of one subsystem areexpended in interacting with other subsystems in a complex manner.
The quality of service (QOS) parameters associated with a telecom-munication system depicts the metric of complexity. This metric assaysthe global performance of telecommunication service offered versus thecost involved. Estimating QOS parameters, or prescribing such param-eters while negotiating with a service provider to access a specific classof connection across the network, warrants a meaningful modeling ofcomplexity associated with the telecommunication system. The relevantmodeling should include spatial stochasticity of interacting resources aswell as the temporal dynamics of information flow between the endentities of a telecommunication channel.
Studies [1, 2] indicate that such spatiotemporal considerations in themodern telecommunication environment are often fuzzy. That is, theactivity of information transfer across the network refers to the non-
Complex Systems, 12 (2000) 31–69; ! 2000 Complex Systems Publications, Inc.

32 P. S. Neelakanta and W. Deecharoenkul
specificity of the values and sharplessness of the boundaries of activityvariables involved. Hence, it can be expected that the telecommunica-tion QOS parameters would map onto a fuzzy domain. Correspond-ingly, the performance attributes as well as any inferences made thereofcould be more realistically specified in fuzzy domains. Further, any con-trol endeavor on the system can be accomplished via a fuzzy inferenceengine. In other words, the complex system parameters depicting thesystem performance can be used as fuzzy variables to arrive at a controldecision criterion as required.
In the context of modern telecommunication systems the relevanceof stochastical considerations, fuzzy attributes, and complexity (in bothspatial and temporal characterizations) arise mainly due to the follow-ing.
1. Heterogeneity of traffic types (voice, video, and data transmissions).
2. Variety in the physical media of transmission (copper wires, optical fibers,and wireless means).
3. Different versions of switching which interconnect the lines with varyingbuffer sizes.
4. Temporal fluctuation of traffic demands (peak and slack hour traffics).
5. Temporal variations in bits per second emitted by the source (variablebit-rate traffics).
6. Time-dependent bandwidth demands (multimedia transmissions).
7. Synchronous and asynchronous transmissions of packetized information.
8. Types of packetization of bits (either as variable size packets or as fixedsize cells).
9. Protocol specifics such as call admission control (CAC), congestion con-trol, and service priority scheduling.
10. Statistical multiplexing of packets with traffic priorities on contention.
11. Signal-to-noise ratio (SNR) and bit-error rate considerations (bit-errordetection and correction methods implemented).
12. Statistical aspects of the amount of information emitted by differentsources (loading factor considerations as a function of time).
13. Mobility of end entities (wireless communication systems).
14. Types and modes of implementing signaling for connection setup andrelease.
15. Connection-oriented and connectionless configurations of the network.
Complex Systems, 12 (2000) 31–69

A Complex System Characterization of Modern Telecommunication Services 33
16. Geographical outlays: wide-area network, local-area network, metropoli-tan-area network, and global-area network considerations.
17. Network security (encryption and decryption requirements).
The gross features of the network (in terms of its connectivity size andextent of traffic handled) plus the stochastical nature of network per-formance (as a function of time) render the telecommunication systemrealistically complex.
In order to capture fully the intuitive concept of the complexity oftelecommunication systems, it is necessary to portray the associatedcomplexity in a multidimensional framework. This multidimensional-ity should include the gamut of measures, each addressing a specificaspect of service category, QOS objectives, and traffic descriptors alongone dimension. Further, inasmuch as many of these measures could becorrelated, the modeling should facilitate the corresponding enhance-ment in the complexity being assessed due to the interactiveness of themeasures involved.
The metric of QOS objectives in crisp form denotes primitive mea-sures. They do not, per se, reflect the gross and correlatory attributesbetween the parameters. Neither do they depict the fuzziness of the vari-ables. At most, they are represented in probabilistic norms signifyingonly the stochastical attributes.
In order to include cohesively the stochastical considerations andfuzzy characteristics, as well as the gross complexity of the system, anintegration of the following is needed. (i) The spatiotemporal dynamicsof the system specified in the entropy or information-theoretic plane [3–5]; and (ii) rendering fuzzy of the variables involved in the dynamics [6].
The purpose of this paper is to indicate how the complexity of atelecommunication system can be analytically modeled via considera-tions of information-theoretics (IT) and fuzzy properties. Specifically,an asynchronous transfer mode (ATM) switching stage is considered.Modeling is performed in respect to the following two QOS parame-ters. (i) Variations in the delay of cell-transfers. Such cell-delay vari-ations (CDVs) or jitter lead to dropping those cells which are delayedbeyond a permissible upper bound on CDV. This is of concern especiallyin a congested traffic ambient. (ii) Additional loss in the number of cells(packetized segment of bits, which carry the information) due to biterrors caused by the noisy channel.
The performance of a telecommunication network vis-a-vis a givenset of QOS objectives can be deduced in terms of a complexity profileposed by stochastical considerations and fuzzy attributes of the relevantnetwork technology. It is shown in this paper how to reduce the multidi-mensionality of primitive measures concerning network performance toa single complexity parameter (with fuzzy properties) which can decide
Complex Systems, 12 (2000) 31–69

34 P. S. Neelakanta and W. Deecharoenkul
an upper bound on the performance. The relevant strategy involves, asstated earlier, a blend of IT and fuzzy logic considerations.
Using the complexity parameter deduced, it is shown how a fuzzyinference engine can be constructed using the complexity parameteras a fuzzy variable. This inference engine is adopted to formulate analgorithm that enables CAC in ATM networks. That is, a fuzzy inferenceengine, which assesses the complex connection patterns of the networkand prescribes fuzzy norms on resource utilization, is developed. Thisapproach alleviates the risk of over-conservative resource allocations inthe CAC implementation. The efficacy of this algorithm is demonstratedvia simulated results pertinent to a typical ATM environment.
Thus, the content of this paper is presented in two parts. In Part Ia time-dependent complexity metric s(t) is deduced via an IT approachfor ATM telecommunication systems. The statistical bounds on the per-connection guarantee (i.e., QOS parameters) solicited from the networkoperator are obtained in terms of the complexity measure proposed.
The modeling strategy adopted is based on the following. (i) Theflow of information-bearing ATM cell streams is regarded as a queueingsystem. Unlike the conventional queueing model wherein the temporalstatistics of cell arrival and cell waiting are used in the analysis, thepresent study considers the flow of entropy (or information content inShannon’s sense) borne by the queue [4–6]. A relevant metric of com-plexity s(t) is defined thereof, and deduced in terms of the Shannoninformation content. (ii) The temporal dynamics of s(t) are then formu-lated in terms of stochastical differential calculus. Further, (iii) fuzzy at-tributes to s(t) are introduced via Zadeh’s extensive principle and a fuzzyFokker–Planck equation [7] describing the dynamics of s(t) is obtained.
The considerations of an IT strategy allow a direct evaluation of theimpairment to information flow (or information loss) posed by the statis-tics of cell loss. That is, the effects of cell loss impairing the informationtransmitted are introduced appropriately in terms of the complexity pa-rameter adopted. The cell losses considered include both those lost asa result of buffer-overflows or queueing at the ATM switch (or mul-tiplexer) and those dropped due to uncorrectable bit errors stemmingfrom a finite SNR (which depicts the finite extent of noise in the system).
In Part II, using the strategy developed in Part I, a CAC algorithm isdeduced and its efficacy is demonstrated with simulated data.
2. Asynchronous transfer mode telecommunication
2.1 A brief review
ATM is a platform recommended to support broadband integrated sys-tems of digital networks (B-ISDNs). It is a technique that has been de-
Complex Systems, 12 (2000) 31–69

A Complex System Characterization of Modern Telecommunication Services 35
! = 1: Data
! = 2: Voice
! = 3: Video
"1
"2
"3Cells/s
Buffer
ATM MUX
Incoming calls
switch withbuffer(s)
ATM
Outgoing mixed cell traffic µ cells/s
VP/VC
Z Z
Incoming traffics
Output
Figure 1. ATM multiplexing and switching. Η # 1, 2, 3 are incoming cells fromdifferent types of sources at the call-origination end.
veloped to handle cohesively the telecommunication of heterogeneousstreams of messages emanating from different sources such as data,voice, and video on a given network [8].
The characteristics of mixed ATM traffic are as follows. (i) A vastdifference in the speeds of individual traffic (in terms of bits per second).(ii) Delay sensitiveness of isochronous traffic such as video and voice(relative to data traffic). (iii) Cell losses incurred while in transit acrossthe network. (iv) Virtual connectivity offered to the cells (fixed-sizepackets, each with 53 bytes) for transmission across the network.
When the delay experienced by a cell becomes too excessive, theATM protocol would let the cell be dropped from the transmission. Thefraction of such cells dropped is designated by a QOS parameter, knownas the cell loss ratio (CLR). Inasmuch as the causative mechanisms andthe deciding factors of these delays are largely statistical, the delayparameter fluctuates randomly with respect to time. This statisticallyvarying cell delay, as stated before, refers to a parameter designated ascell delay variation (CDV). It represents one of the QOS parameters.A typical multiplexing of cells from different sources and switching ofATM calls is illustrated in Figure 1.
Apart from excessive cell transfer delay (CTD) variation (scaling be-yond an upper bound) causing cell losses, bit errors in the cell-headerwhich are detected but cannot be corrected would also lead to droppingcells. The first type arises as a result of the randomness of the traffic.The second type is due to a change in the bit pattern in the cell-headerdue to a finite extent of noise (specified by a finite SNR prevailing in thetransmission path). A bound on CLR depicts the limit on the numberof cells lost in the transmission path which can be tolerated without anysignificant impairment to the semantic transparency of the informationtransferred. It is proposed in the present work that the CDV-based celllosses and noise-induced cell losses can be combined and representedby a single parameter in the IT plane. The corresponding upper bound
Complex Systems, 12 (2000) 31–69

36 P. S. Neelakanta and W. Deecharoenkul
on the resultant variation in the CTD can be decided by the tail-endprobability Α in the resultant probability distribution of the CDV. Sup-pose the CLR corresponding to jittered CDV is CLR1 and that due tonoise-induced bit-error is CLR2. The net CLR bound should then bethe result of the joint influences of CLR1 and CLR2. The problem oflinking CDV versus CLR1 and SNR versus CLR2 can be done via ITconsiderations. Part I is devoted to relevant efforts.
Part II of this paper refers to using the complexity metric (deducedin Part I) to develop a call admission algorithm under fuzzy operationalconditions. When a call request comes, an ATM switch has to decidewhether the connection would enable or not a required QOS if the callis accepted. If the ATM switch judges that the required QOS can befacilitated, then the call will be accepted. Otherwise, the call will berejected. This is the strategy known as CAC. Basically, it refers to a setof rules or algorithms to decide whether a new call should be acceptedor not [9].
There is a set of essential QOS parameters that characterize sourcetraffic and are required to address CAC issues. Based on these QOSparameters declared by the user, the CAC could determine the typeof service required. For example, a connection can be facilitated onthe basis of available-bit-rate service provided by the network. In thiscase, the connection is assigned whatever the bit rate is available at thatparticular time.
A broadband call, for example, can be a multimedia call havinga number of components such as still-picture, video, voice, and text.Each component generally requires a separate connection. Facilitatingconnectivity (meeting a set of specified QOS objectives) to a call refers toassigning virtual channel identification to that category of cells belong-ing to the call. Transport of these cells takes place on the assigned virtualchannels. A bundle of virtual channels constitutes a virtual path whichis identified by a virtual path identifier. Each virtual connection has atransfer capacity (a bandwidth) assigned to it according to the user’srequest. This is usually done during the connection setup procedureusing CAC. This connection process also determines such parametersas maximum CTD/CDV and/or CLR that a connection will be alloweddepending on user needs.
The decision on whether a call be permitted or not is made based onthe traffic characteristics of the call and availability of required networkresources to handle the additional traffic without affecting the resourcerequirements of the existing calls. In other words, the additional trafficdemand on the resources to be generated by the new call should nothave any effect on the traffic performance aspects of existing calls.
There are several CAC algorithms described in the literature [1, 2, 8,9]. CAC is a software function in a switch that is invoked at the callsetup time, when a virtual channel or a virtual path is established. It
Complex Systems, 12 (2000) 31–69

A Complex System Characterization of Modern Telecommunication Services 37
accepts the request only if the QOS for all existing connections will stillbe met if accepted.
3. Part I: Quality of service specification a system complexity metric
In the present study, the QOS specification of the telecommunicationsystem (such as an ATM network) is presented as a single parameterby taking into considerations of the associated stochastical and fuzzyattributes of the system parameters.
In the relevant modeling, the end-to-end delay, or CTD, of the ith cellis assumed to be governed by a random factor arising out of queueingand buffering (multiplexing) within the network, as well as by the extentof noise (in terms of SNR) involved. As stated before, it is assumed thatthe SNR attribute of the network leads to a bit-error based, finite CLR,CLR2; and the buffer induced CDV in the cells which eventually leadsto dropping of cells to an extent that is specified by CLR1. Thus, thereare two phenomena which ultimately lead to an effective CLR in thesystem. Normally, the CDV-based cell dropping is decided by the extentof buffering used while the SNR-based cell dropping is largely decidedby the physical media. For example, if the physical medium correspondsto a wireless transmission, the bit errors are relatively larger than in thetelecommunication facilitated via fiber optic lines.
Presently, a complexity metric is proposed that is deduced via max-imum entropy considerations [10] plus the fuzzy attributes associatedwith the stochastical characteristics of cell losses. Such cell losses in-clude cohesively, the SNR considerations and CDV performance. Interms of the metric so derived, it is possible to bifurcate the networkend-to-end transmission as “simple” or “complex” in a fuzzy domain.The dividing line sets a limit on the acceptance level of CLR and im-poses an upper bound on the CAC implemented. Pertinent analyses areelaborated in the following section using a heuristic approach of theaforesaid problem.
3.1 A complexity metric for the acceptable threshold of cell loss ratio
Suppose 0 % p(i) % 1 denotes the probability of occurrence of theith cell in an ATM transmission. Let i # 1, 2, . . . , M represent thecells for which the end-to-end performance is assessed in an ATM link.Then, the axiomatic probability requirement is that !M
i#1 p(i) # 1 andthe mean value !M
i#1 ip(i) % Β0. Here Β0 > 0 depicts the constrainingvalue on the ensemble mean as decided by the limit of acceptable trafficperformance. Given a set of parameters attributed to a virtual channeltraffic, the entropy (Shannon information) parameter of the epochs of
Complex Systems, 12 (2000) 31–69

38 P. S. Neelakanta and W. Deecharoenkul
cell occurrence is given by:
H(p) # 'M"i#1
p(i) ln[p(i)] nats. (1)
Following the procedure presented by one of the authors elsewhere [6],the entropy associated with the M participating cells can be written interms of a complexity parameter s as follows:
H(s, M) # ln #1 ' sM(1
1 ' s$ ' # s
1 ' s'
(M ( 1)sM(1
1 ' sM(1 $ ln(s), for s < 1 (2a)
# #1 ' ΡM(1
1 ' Ρ% 1ΡM &$ ' # Ρ
1 ' Ρ%1Ρ&
((M ( 1)ΡM(1
1 ' ΡM(1 Ρ % 1ΡM(1 &$ ln(Ρ), for Ρ % 1 (2b)
where s is the complexity parameter [10].The given relations refer to the maximized entropy functional that
is based on the probability of having i disorderly (performance-wise)subsets in the cell space of total size M. That is, p(i) depicts the prob-ability distribution which maximizes the entropy H(p) of disorderlinessassociated with epochal occurrence of cell events and implicitly refers tothe statistics of associated performance impairment such as jitter and/orbit-errors. Explicitly, the entity s in equation (2) is specified by exp('b)where b is a lagrangian parameter used in maximizing the entropy func-tional [10].
The entropy of disordered subsets is a positive function increasingmonotonically with respect to M for all values of s * 0. It also increasesmonotonically with s for s < 1 but decreases monotonically with s fors > 1.
The coefficient s can be regarded as a measure of complexity asso-ciated with the ATM transmission experiencing cell losses as a resultof cell delay jitter and SNR-dependent bit errors in an end-to-end con-nection. Suppose the mean value Β0 (specified as a constraint on thestatistics of M) is specified in terms of s as Β0 # E[s, M]. For a givenstretch of cells, s represents the extent of CLR expected. As such, whens # 0, the cells flowing between an end-to-end connection constitute a“simple” subsystem with an expected value of E[0, M] equal to zero.The other extreme situation refers to s + ,, in which case the system istotally complex with E[,, M] # M meaning that the associated loss ofinformation is excessively large inasmuch as the cell loss includes all ofthe M cells involved.
That is, when the number of disordered subsets of cell loss in a cellpopulation M + ,, the complexity associated refers to the entire uni-verse of the jittered cells and/or bit errors. The corresponding expectedvalue E[s,,] can be deduced using the following relations [10].
Complex Systems, 12 (2000) 31–69

A Complex System Characterization of Modern Telecommunication Services 39
In the limit M + ,, the functions associated with (M, s) becomenonanalytic at s # 1. Explicitly, this implies that
E[s, M]-M+, #
./////0/////1
s1's s < 1M2 s # 1Ρ
1'Ρ s # 1Ρ * 1
(3a)
and
E[s,,] # E[s, M] for small s and moderately large M. (3b)
Correspondingly,
H['s, M(]M+, # ' ln(1 ' s) 's ln(s)1 ' s
0 % s < 1 (4a)
# ' ln(1 ' Ρ) 'Ρ ln(Ρ)1 ' Ρ
s #1Ρ* 1 (4b)
and H(s, M) ! H(s,,) for small s. Relevant inferences pertinent to thesealgorithmic derivations follow.
(a) For very small extents of CLR with s 2 1, the expected extent of cell lossis almost independent of the number M of cells involved.
(b) For very large extents of CLR with s 3 1, the expected extent of cell lossis characterized by the number of participating cells M.
(c) The characteristic value of s # 1 bifurcates the system as simple or com-plex in respect to the extent of information loss perceived due to droppingcells caused by CDV and/or bit-errors.
The simple, or small extents of CLR, when grown to a larger levelwould make the overall system performance be designated as com-plex. That is, small values of cell losses can be considered as quasi-autonomous (simple) subsets, but when grown to a large extent wouldrender the system complex in terms of its performance assessed via CDVand/or SNR parameters. To model this consideration, the complexitycoefficient s can be written as a function of M. Specifically, around s # 1,let s # (1 ' 4) where 4 # (A/M) + 0 as M + , and the constant Aremains invariant. Using Taylor’s expansion, on equation (3a) at s # 1,one has:
E[s, M] 5M2%1 ' A
3&)%1 ' A
2(
A2
6(!& (5)
and the corresponding entropy deduced from equation (2) is,
H(s, M) 5 ln(M ( 1). (6)
Complex Systems, 12 (2000) 31–69

40 P. S. Neelakanta and W. Deecharoenkul
This result leads to defining a coefficient of cell loss complexity in afunctional form of the type:
s # exp %' AM& (7)
with s < 1 and A > 0, (i.e., when the system is considered simple). Withthe exponential form of s given by equation (7), the following resultscan be deduced with A > 0:
s(e'A/M) #MA
[1 ' e'A] (12
[1 ' e'A] ( 6 % AM& (8)
E[e'A/M, M] # MF(A) 'G(A) ( 6 % AM& (9)
H[e'A/M, M] # ln M 'U(A) ( 6 % AM& (10)
where
F(A) #1A'
1(eA ' 1)
,
G(A) #12(
1
(eA ' 1) ' AeA
(eA'1)2
,
U(A) # AF(A) ( ln1A
(1 ' e'A).
Further, 6(7) represents the “order of (7).”At the critical point of s # 1 and in its neighborhood, the mean value
of system performance denotes the extensive property in respect to thepossible number of impaired cells (M) and the propensity of impairmentis directly proportional to ln(M), namely, the message content of M cells.
When s * 1, the exponential law can be modified as s # exp(A/M) inwhich case,
E[eA/M, M] # 81 ' F(A)9M 'G(A) ( 6 % AM& (11)
H[eA/M, M] # ln M (U(A) ( 6 % AM& . (12)
These algorithmic considerations can be adopted appropriately touse the complexity parameter s as a cohesive measure of the extent of aQOS parameter (such as cell losses) in an end-to-end ATM connection.Relevant details follow.
3.2 Entropy of cell losses: Information-theoretic considerations
Suppose the statistics of CDV (∆Η) of a traffic (identified as the trafficfrom source Η) is assumed to be gaussian. Then the probability density
Complex Systems, 12 (2000) 31–69

A Complex System Characterization of Modern Telecommunication Services 41
function of ∆Η, namely, p(∆Η) can be written as:
p(∆Η) #1*
2ΠΣ∆Ηexp
=>>>>>>>>>>?'
(∆Η ' Μ∆Η )2
2Σ2∆Η
ABBBBBBBBBBC(13)
where Σ∆Η and Μ∆Η denote the mean and standard deviations of ∆Η respec-tively. The maximum entropy vis-a-vis the gaussian statistics is givenby:
(Hmax)Η #12
ln[2Πe(ΣD∆Η)2] (14)
where ΣD∆Η is Σ∆Η normalized with respect to a time parameter, such as thetotal time of transmission of M cells, T seconds.
As detailed earlier, a critical transition from a simple to a complexstate mediated by M cells arriving at a rate ΛΗ cells/second occurs whenthe complex parameter s + 1. Using equation (6), the correspondingmaximum entropy associated with M cells flowing at a rate ΛΗ is givenby
(Hmax)Η # ln #M ( 1ΛΗT$ . (15)
Hence, combining equations (14) and (15), it follows that ln[(M (1)/ΛΗT] # ln[2Πe(ΣD∆Η)2
max]1/2. Or, (M ( 1)/ΛΗ #+
2Πe(Σ∆Η)max.In other words, for a set of M cells for which end-to-end delay is as-
sessed, the maximum entropy associated with the delay ∆Η has a standarddeviation given by:
Σ∆Η #M ( 1+2ΠeΛΗ
second. (16)
The corresponding variance parameter then decides the upper limiton the permissible cell delay jitter beyond which the network is led todiscard the cells as indicated earlier.
3.3 Net cell loss ratio due to cell delay variation and signal-to-noise ratioinfluences
Considering the two possible reasons that lead to the dropping of cells,the tail-end probability Α, which can be deduced from equation (13),places an upper bound on net CLR; and, Α can be bifurcated into Α1and Α2 corresponding to CLR1 and CLR2 respectively. That is, thefunctional relations to be ascertained are:
Α1 F CLR1 G CTD1 (17a)Α2 F CLR2 G CTD2 (17b)
Complex Systems, 12 (2000) 31–69

42 P. S. Neelakanta and W. Deecharoenkul
where CTD1 and CTD2 are parameters which decide jointly to specifya net upper bound on CTD and lead to a corresponding (net) upperbound on CLR.
The problem of linking Α1 and CLR1 is the same as correlating thevariance of ∆, namely, (Σ∆)
2 and the CLR1. That is, the variance of theCDV (under the worst case condition) that corresponds to the CTD1exceeding a maximum value equal to fixed delay (F) plus (Σ∆) with aprobability no greater than Α1. It specifies the maximum limit on CTD,CTD1. Similarly, assuming that the cell losses due to SNR-based biterrors (represented by CLR2) correspond to an equivalent delay CTD2,a relation between the bounding parameters Α2 (of CTD2) and CLR2has to be established. The relevant exercise is indicated in [5] andsummarized as the resultant cell loss parameter that can be ascertainedfrom CLR1 and CLR2 that eventually specifies a bound, which can thenbe utilized to establish a CAC criterion.
3.4 CLR1 versus PxΗ and Α1
Relevant to a source Η, suppose a cell loss probability PxΗ is specifiedas the impairment parameter of end-to-end traffic performance due toasynchronous multiplexing and/or congestion induced CDV and PEΗdenotes the bit-error probability leading to relevant cell erasures causedby finite SNR. The strategy to implement the required interrelationsspecified in equation (17) is based on the following heuristics.
The CLR1 parameter concerning cell losses (arising from CDV causedby multiplexing/congestion in ATM links) can be specified by a corre-sponding cell erasure probability PxΗ that leads to a loss of averageinformation content per unit bandwidth associated with M cells consti-tuting the ATM traffic. The nonzero value of PxΗ can be regarded asan “equivalent probability of error” induced by a “corruption factor”CxΗ. That is, the cell loss due to excessive CDV resulting from the multi-plexing/congestion mechanism can be dubbed equivalently, as if such acell loss is a result of some corrupting entity (analogous to noise) beingpresent in the traffic flow. Therefore, from the considerations of digitalcommunication theory as applied to binary digit errors introduced dueto noise, PxΗ in reference to an Ηth source (Η # 1, 2, . . . , N), can be spec-ified by an exponent relation, namely, PxΗ # km exp('CxΗ) where km is aconstant dependent on the modulation scheme. (For example, km # 1/2in frequency shift keying.) In this relation, the corruption factor CxΗ isrepresented as an erasure exponent that sets a limit on CDV exceedingan upper bound. This exponent is analogous to the SNR parameter.
The multiplexer of ATM cells (MUX) is a multi-access shared pro-cessor where cells from different sources compete for the processor timeto get accessed on the trunk line (Figure 1). The more sources active at
Complex Systems, 12 (2000) 31–69

A Complex System Characterization of Modern Telecommunication Services 43
a given time, the less rate of service each receives, since there is morecontention. The total service rate rendered by the MUX depends on thestate of the queue through the number of cells competing for multiplex-ing service. Following the IT model of a multi-access system discussedin [4] and using the underlying concepts of equation (6), it can be shownthat the average information loss HΗ(LΗ) of the Ηth source resolved perunit time at the multiplexer can be specified as:
HΗ(LΗ) # ln[MTLΗ(mΗ) ( 1] nats per bandwidth (18)
where LΗ(7) denotes the expected number of cells dropped at the multi-plexer due to the delay suffered as a result of queueing and contentions,and MT is the total number of cells from all the N active sources re-solved per unit time. Further, mΗ refers to the cells in the Ηth sourcetraffic stream.
The mean delay time H1Η equivalence (representing the cell loss)can be obtained from the well known Little’s formula. That is, whenMTLΗ(mΗ) 3 1,
H1Η 5MTLΗ(mΗ)
ΛΗsecond (19)
where the subscript 1 corresponds to traffic impairment specified byCLR1.
The expected loss of information caused by the cell drops pertinentto the Ηth source as given by equation (18), is identically equal to theentropy associated with the CDV. Hence,
ln #MTLΗ(mΗ)ΛΗ
$ I ln[2ΠeΣ21Η]
1/2 (20a)
or,
Σ1Η #H1Η
(2Πe)1/2 (20b)
which represents the standard deviation of the statistics describing theCDV equivalence of the cell loss pertinent to the Ηth source. It should benoted that both the mean value (H1Η) and the standard derivation (Σ1Η)are specified per unit bandwidth of trunk transmission and resolved perunit time.
3.5 CLR2 versus PEΗ and Α2
Additional delay H2Η is induced as a result of cell drops due to uncor-rectable bit-errors caused by a finite SNRΗ value prevailing in the ΗthATM source-to-MUX link. It can be specified explicitly in terms of the
Complex Systems, 12 (2000) 31–69

44 P. S. Neelakanta and W. Deecharoenkul
error probability as: PEΗ # km exp('SNRΗ). That is, given PEΗ or itsexponent SNRΗ, the pertinent CLR, namely, CLR2 when linked to CTDwill give rise to a corresponding average delay H2Η with a variance Σ2Η.The parameters H2Η and Σ2Η can be determined by a similar procedureindicated in section 3.4 replacing PxΗ by PEΗ and CxΗ by SNR. Again,the subscript 2 in H and Σ refers to the conditions dictated by CLR2.
Summarizing, the net CTD specification pertinent to an ATM systemcan be deduced in reference to an Ηth source in terms of the following.
1. Fixed-delay (F) due to propagation, delay induced by switching systemand/or processes and due to fixed components.
2. Random delay introduced by asynchronous transfer involving bufferingperformed on incoming cells from different sources (of different band-widths and bit rates). This has the worst case or maximum value decidedby H1Η and Σ1Η.
3. Random delay introduced by cell drops due to uncorrectable bit-errorscaused by a finite SNR value prevailing in the ATM link. This has theworst case or maximum value decided by H2Η and Σ2Η.
The combined effects of multiplexing/congestion and nonerasablebit-errors can be specified by a single gaussian statistic of CDV witha mean value of HΗ # (H1Η ( H2Η) and a standard deviation of (ΣΗ) #[(Σ1Η)
2 ( (Σ2Η)2]1/2. Hence, a corresponding effective CLR bound can be
stipulated. The probability Α is decided by an upper bound set by thequartile value equal to 2/3ΣΗ.
Thus, for a given set of specifications on the expected number of1s dropped (LXΗ, LEΗ), probability of error values (PXΗ, PEΗ), rate oftransmission (ΛΗ), and mΗ of the Ηth traffic, a gaussian probability densityfunction curve can be constructed for ∆Η when a total of MT cells (fromall the sources) are impressed on the input to the MUX. It is given by:
p(∆Η) #1*2ΠΡΗ
exp.//0//1'=>>>>>>>>>?
(∆Η ' HΗ)2
2Ρ2Η
ABBBBBBBBBC
J//K//L
. (21)
4. Fuzzy attributes of cell loss characteristics
Referring to earlier discussion, in the region of s % 1 in which the ATMsystem is assumed to be simple (in terms of the net CLR experiencedbeing lower than a certain upper bound), the complexity metric versusentropy is given by equation (6), it follows that
M(s) # exp[H(s)] # #1 ' Aln(s)$ s # 1 (22)
with A > 0. Further, in terms of M(s), equations (6), (10), and (12) can
Complex Systems, 12 (2000) 31–69

A Complex System Characterization of Modern Telecommunication Services 45
be written respectively as:
H(s) # ln(M ( 1) # ln[M(s)] s # 1 (23a)# ln(M) (U(A) 5 ln[M(s)] (U(A) s < 1 (23b)# ln(M) (U(A) 5 ln[M(s)] (U(A) s > 1 (23c)
with the approximations indicated when M 3 1.For the three cases given by equation (23), the following differential
equation can be validly specified:
d2H(s)ds2 ( #dH(s)
ds$2 # MNN(s)
MN(s). (24)
This equation depicts the calculus of entropy (or Shannon information)associated with the complexity parameter s. It describes the calculusof H(s) versus s in the crisp domain. Presently, it is attempted to fusefuzzy concepts using interval-value calculus into the above nonlineardifferential equation. Further, the so-called “extensive principle” dueto Zadeh [11] is adopted notionally to infuse the fuzzy attributes tothe telecommunication system, the cell loss performance of which isdescribed by the complexity parameter s.
For this purpose, a general (algebraic) description of the nonlineardifferential equation (equation (24)) relating the sets 8Hi(s)9 and 8si9which bear crisp values is first considered. Suppose 8x9 and 8y9 are crispsets, which identically represent the independent variable set 8si9 andthe dependent variable set Hi(s) respectively. These sets are crisp in thesense that certain definitive values can be assigned to each element ofthe respective universal set (so as to discriminate between members andnonmembers of the crisp set). The uncertainty features of real worldproblems (such as in telecommunication systems), however, warrant thefollowing considerations.
The values so assigned (to the elements of the universal sets) shouldfall rather within a specified range and qualify the associated uncertaintyby a “membership grade” given to each of the elements in these sets inquestion. That is, the sets 8x9 and 8y9 should be regarded as fuzzysets with linguistic gradation and having corresponding membershipfunctions. Denoting the corresponding fuzzy variables as xf and yf
(with the superscript f denoting explicitly the fuzzy considerations),the membership gradation should allow the representation of the rangeconcepts attributed to the variables involved to be expressed in naturallanguage within the scope of the context pertinent to 8xf , yf 9.
Rewriting equation (24) in terms of x and y, suppose the set of inputvalues of 8xi9 are nonspecific or fuzzy. Extending Taylor’s formula tointervals, the output yi(xi) has a fuzzy value yf
i (xi) for a generic set 8xi9.That is, 8yf
i 9 refers to the fuzzy transmission of the crisp set 8yi9 whosegeneric elements are 8xi9. The ith component of 8yf
i 9 can, therefore, be
Complex Systems, 12 (2000) 31–69

46 P. S. Neelakanta and W. Deecharoenkul
written in respect to the uncertain (fuzzy) boundary value of all vectorsyf
i (xi) in the interval x O [xL, xH] as, [7]:
yfi (xi) # yf
i (xL) (k'1"j#1
[fΨ(j'1)yfi (xL)]xj/j! (25)
where fΨ(7) denotes the corresponding function Ψ(7) defined in respectto the fuzzy set 8yf
i 9.Equation (25) is an algebraic sum of addenda, each one of which takes
an interval value. The summation computed via interval arithmetic leadsto a “width of results” resulting from superposition of the addenda. Inthis interval arithmetic, any interval-value of yf
i will become wider with
increasing values of xfi . Conversely, the interval value of y
fi will become
narrower with decreasing values of xfi .
Considering equation (24), it can be written in the fuzzy domain in avector form where the variables and parameter values can be expressedas intervals with k being the number of interval-valued parameters andn is the order of the system. That is,
d2Yf (x, I)dx2 ( %dY(x, I)
dx&2 # g(x) (26)
where the vector boundary of yfi is specified by Yf (XL,H) # Yf
L,H. Further,8I9 represents the vector set of parameters whose value is an interval andI # [I1, I2, . . . , Ik]. Since equation (24) is a second order (nonlinear)equation, its order n is equal to 2. The explicit solution of this fuzzydifferential equation (equation (26)), namely, yf (x) # f F(x) is indicatedin section 6.
5. Bifurcation of the fuzzy domain and membership attribution tofuzzy sets
In reference to earlier discussions, the set 8yi9 in response to a set 8xi9 inthe fuzzy domain is indicated by a fuzzy differential equation given byequation (26). Now, the question is how the membership attributes canbe incorporated into the fuzzy set. The specifications of membershipfunctions as discussed earlier are ΜA(7) # [0, 1] and its rth interval Ir isgiven by (Λr1, Λr).
The fuzzy function under discussion corresponds to the solution ofequation (26). The variables x and Yf are bounded by x O (xmin +0, xmax + (,) and Y # 8ln[M(s)], ln[M(s)] (U(A)9, respectively.
Now, consider the function B(s) # H(s)/H(Σ)-Σ+1. Explicitly, it iswritten as follows:
B(s) #H(s)H(Σ)
,,,,,,,Σ+1#
ln[M(s)]ln[M(Σ)]
,,,,,,,Σ+1#
ln -1 ' Aln(s) .
ln -1 ' Aln(Σ) .
,,,,,,,,,,,Σ+1
. (27)
Complex Systems, 12 (2000) 31–69

A Complex System Characterization of Modern Telecommunication Services 47
The graphical representation of equation (27) is presented later in Fig-ure 4.
Equation (27) decides the transcritical regimes of simple and complexwhile considering s as a fuzzy variable. Further, this heuristically derivedbifurcation function B(s) includes the overlapping, linguistic attributesof the variable s in each of the bifurcated regimes as will be indicatedlater.
6. Part II: Fuzzy attributes of cell loss ratio and their implications oncall admission control
In general, the values of bounds on CLR required for CAC cannotbe ascertained to a deterministic extent. This is due to the inherentfuzzy attributes and stochastic nature of the complex telecommunicationtransmission involved as discussed earlier.
The nonspecificity of CLR bounds therefore, warrants enforcing afuzzy inference scheme which an ATM switch can use to facilitate a calladmission so that the connection enabled would offer a guaranteed CLRon the limit of not falling out of its upper bound.
In the efforts due to Uehara and Hirota [1], fuzzy CAC for ATMnetworks have been indicated in which the guarantee is restricted to theCLR value; and, as far as CDV is concerned, the associated implicationsare taken care of via traffic smoothing.
In the present study, as mentioned before, the traffic impairmentattributes of CLR are represented by a single complexity parameter s.This single parameter cohesively accounts for the influences of CDVand SNR (or bit errors) in deciding the resultant cell losses in the ATMtransmission. Further, s can be regarded as a fuzzy parameter.
Considering the complexity specified by end-to-end performance ofan ATM link (in terms of s), we now describe a CAC scheme which guar-antees respect of the bounding limits on s. This CAC is based on fuzzyinference and guarantees a limited CLR. The inference engine proposeduses the complexity algorithm deduced via IT considerations. Thatis, from the considerations presented earlier, it can be observed that thecomplexity parameter s inherently has entropy details (or Shannon infor-mation) concerning information loss experienced by the ATM cells dueto CLR. Hence, by using the parameter s, a fuzzy inference method toimplement the CAC is developed. Two analytical methods are suggested.The first one refers to constructing an if-then rule-based look-up tableportraying the implicative output for a set of if-considerations. Thistable represents a fuzzified, overlapping implication set. For example,given a set of traffic descriptors and resource profiles, the relevant call isimplicated to a membership class specified by the complexity metric s.
Thus, in reference to an ith call, the look-up table offers an implica-tive inference on si (usually in a linguistic format) which overlaps with
Complex Systems, 12 (2000) 31–69

48 P. S. Neelakanta and W. Deecharoenkul
adjoining (neighborhood) inferences. A (defuzzification) procedure cannow be adopted to extract a defuzzified value of si from its fuzzifiedmap. CAC is then specified on the basis of this extracted value of si.
The second step deduces a possible distribution of si in the fuzzydomain. Using the relevant algorithm, the upper bound on s is ascer-tained. That is, the upper bound on s allows establishing a CAC (whena number of connection requests prevail at a switch) and an admittedcall guarantees a limit on CLR (as well as the associated CDV). The fol-lowing sections elaborate the procedure involved and present simulationstudies performed to evaluate the efficacy of the proposed strategy.
6.1 Fuzzy complexity based call admission control
The CLR versus number of connections (or traffic load) is invariably anonlinear relation. This is due to extensive variations in the cell gener-ation patterns of participating sources of an ATM transmission. Suchpatterns are usually characterized by constant bit rate and/or variablebit rate transmissions and in each class, the rate may vary significantly.
A typical CLR database versus the number of connections realizedin repeated measurements would exhibit a significant dispersion due tothe statistics of cell emission characteristics of the sources. Therefore,in order to facilitate a meaningful CAC, a correct choice for the upperbound on CLR should be made despite the fact that the observed datais dispersed.
Deciding on the upper bound of CLR can be done with artificialneural networks (ANNs) by training them with a measured set of CLRdata [12–14]. However, since the learning in ANN follows the averagetrend in the learned data, the prediction phase of ANN also yieldsonly an average prediction on CLR; and such an average prediction iscrispy and does not portray the fuzzy profile of the CLR values. As aresult, the connection facilitated would not guarantee the actual trendsin CLR for any cell arrival process so as to satisfy the traffic parametersof the transmission class without overburdening the available resourceallocation schedules.
Another approach adopted in the literature [8] to ascertain the CLRbound refers to a flow approximation model in which a variable bitrate source is assumed to pose alternate active and silent periods ofcell emission characterized solely by its peak and average bit rates.No assumptions on the statistical distributions of the two periods aremade. The resulting algorithm depicting the Chernoff bound on CLRis then used to make the CAC. However, there are two drawbacks ofthis technique. First, this method does not consider the buffer size indecision-making. This means that the decision does not account forany statistical multiplexing gain involved. Second, the procedure doesnot distinguish cell loss requirements of individual connections. That
Complex Systems, 12 (2000) 31–69

A Complex System Characterization of Modern Telecommunication Services 49
is, any connection in the transmission is assumed to have the same CLRcharacteristics as the other connections.
A nonparametric approach has also been studied [15, 16] whereinthe peak and average cell rates of the connections are alone consideredwithout the statistical distribution of the arrival process being specified.This approach, however, overestimates the CLR bound, making CACless efficient; that is, it results in lower multiplexer gain.
Therefore, fuzzy traffic control and fuzzy CAC have been addressedin the literature as alternative strategies [1, 2] and relevant simulationstudies have indicated promising results. But as mentioned before, theCAC in these efforts [1, 2] is based on an established bound on the CLRalone. And, a traffic smoothing is presumed so as to ignore the influenceof CDV on CAC.
The present study presents a parallel approach, but the fuzzy infer-ence made here refers to the complexity parameter s. This parame-ter also cohesively includes both influences of congestion and bufferoverflow-based CDV as well as SNR-based bit errors on the resultingCLR attributes. The “then” part of the if-then rules adopted in the fuzzyinference approach presented here lead to ascertaining the membershipclass of s, namely, Μ(s) governing the connections (to which the if-thenrule is applied). Based on this decided value of s, CAC is performed.
In general, CAC algorithms should be able to cope with normaland heavy traffic situations. Further, they must facilitate negotiationbetween the user and the connection service on QOS requirements.Typically, CAC may permit a certain amount of resource overbookingin order to increase the statistical multiplex gain. Other factors, suchas the slack, are implied by the compliant connection definition. CDVtolerance parameter, buffer size available for a certain cell loss, delayin QOS objective, and so forth, may also allow for a certain laxity inthe admission threshold of the CAC algorithm. All these considerationscontribute to the fuzziness of the inference strategies pursued towardsCAC.
6.2 Linguistic description of fuzzy rules
The linguistic descriptions of if-then rules towards estimating the com-plexity aspects of ATM connectivity can be specified as follows. Let atraffic (such as from a multimedia user) constituting an end-to-end callconnectivity be identified by an index i. Suppose Xi and Zi are twofunctional attributes that belong to a relevant transmission rate classCi. The entity Xi, for example, may denote the variety attributes of thesources involved. That is, Xi depicts the number and variety of the bitrates emitted by the source constituting the ith traffic. It is a collectiverepresentation, for example, of data, voice, and video signals from amultimedia source.
Complex Systems, 12 (2000) 31–69
50 P. S. Neelakanta and W. Deecharoenkul
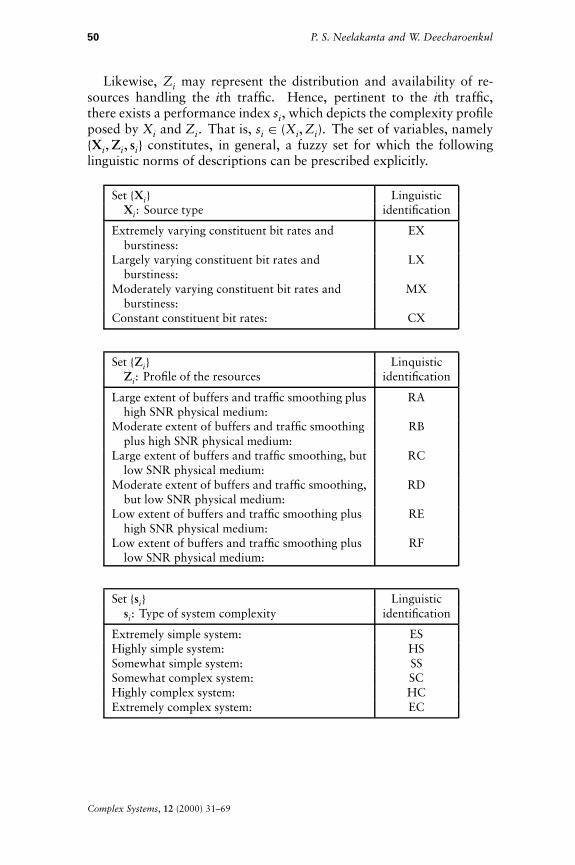
Likewise, Zi may represent the distribution and availability of re-sources handling the ith traffic. Hence, pertinent to the ith traffic,there exists a performance index si, which depicts the complexity profileposed by Xi and Zi. That is, si O (Xi, Zi). The set of variables, namely8Xi, Zi, si9 constitutes, in general, a fuzzy set for which the followinglinguistic norms of descriptions can be prescribed explicitly.
Set 8Xi9 LinguisticXi: Source type identification
Extremely varying constituent bit rates andburstiness:
EX
Largely varying constituent bit rates andburstiness:
LX
Moderately varying constituent bit rates andburstiness:
MX
Constant constituent bit rates: CX
Set 8Zi9 LinquisticZi: Profile of the resources identification
Large extent of buffers and traffic smoothing plushigh SNR physical medium:
RA
Moderate extent of buffers and traffic smoothingplus high SNR physical medium:
RB
Large extent of buffers and traffic smoothing, butlow SNR physical medium:
RC
Moderate extent of buffers and traffic smoothing,but low SNR physical medium:
RD
Low extent of buffers and traffic smoothing plushigh SNR physical medium:
RE
Low extent of buffers and traffic smoothing pluslow SNR physical medium:
RF
Set 8si9 Linguisticsi: Type of system complexity identification
Extremely simple system: ESHighly simple system: HSSomewhat simple system: SSSomewhat complex system: SCHighly complex system: HCExtremely complex system: EC
Complex Systems, 12 (2000) 31–69

A Complex System Characterization of Modern Telecommunication Services 51
µ(Xi)
0
1
CX MX LX EX
0
1
µ(Zi)
0
1
µ(si)
RF RE RD RC RB RA
ES HS SS SC HC EC
(a)
(b)
(c)
Xi
Zi
si
Figure 2. Graphical representation of membership class and overlapping ele-ments of the set 8Xi, Zi, si9.
Each fuzzy variable of the set 8Xi, Zi, si9 identified by these linguisticdescriptions can be assigned a membership class using a membershipfunction Μ(7) O [0, 1], as illustrated in Figure 2. The choice of member-ship function Μ(7) is rather arbitrary. In Figure 2, a triangle function isused for illustration. A host of other functions have been adopted in theliterature [17] to represent Μ(7).
In terms of the linguistic descriptions of 8Xi, Zi9 as identified previ-ously, the extent of the complexity 8si9 should be evaluated, despite theambiguous overlapping features of the linguistic norms depicted in Fig-ure 2. For this purpose, a set of if-then rules should, therefore, be firstestablished with crisp variables. Here is an example.
Rule 1: If the source is of type EX and the resource profile is RF, then thecomplexity is EC.
Rule 2: If the source is of type CX and the resource profile is RA, thenthe complexity is ES.
Rule 3: If the source is of type MX and the resource profile is RD, thenthe complexity is SS.
and so on.
Complex Systems, 12 (2000) 31–69

52 P. S. Neelakanta and W. Deecharoenkul
ZiXi
RA RB RC RD RE RF
EX SC HC HC EC HC EC
LX HS SS SS SC SC HC
MX HS SS SS SS SC HC
CX ES ES HS SS HC HC
Table 1. Decision table on 8si9 given 8Xi, Zi9: crisp domain representation. Thedouble thick line boundary specifies a symmetric dichotomy of simple and com-plex entities; for the upper set si < 1 and for the bottom set si * 1.
Rules 1 through 3 are largely intuitive but have the expert’s reasoningbehind them. For example, Rule 1 represents the extremities in regardsto the source characteristics and resource restrictions. Under these con-ditions, achieving a performance of end-to-end connectivity meeting agiven set of QOS requirements on CDV/CLR is rather constrained ex-tensively. As such, the associated complexity is declared of extremevalue.
The collection of all if-then rules pertinent to the crisp set 8Xi, Zi, si9can be concisely stated in the form of a look-up table as shown in Table 1.Approximately, the linguistic descriptions presented in Table 1 can besplit into a crisp dichotomoy of classes, namely, simple and complex bya symmetrically dividing boundary shown (by a double thick line) acrossTable 1. The top set of this boundary is complex (with si > 1) and thebottom set is simple (with si < 1). That is, for the linguistic elementsof the upper set, the si values are specified as those of equation (4a)with si < 1; and, for the bottom set, the si values refer to those ofequation (4b) with si * 0.
Now, a decision table relevant to fuzzy considerations can be studied.That is, a procedure to construct a decision table by taking into accountthe overlapping attributes of each of the sets 8Xi9, 8Zi9, and 8si9 can beevolved. Corresponding to the map of Table 1, a fuzzy decision table canbe constructed as shown in Table 2. The procedure used in constructingTable 2 is as follows. Write the linguistic identifications of 8Xi9 and 8Zi9in their overlapping formats (consistent with their membership profilesindicated in Figure 2), then for each intersection of Xi and Zi, thecorresponding linguistic identification of system complexity is borrowedfrom Table 1 and indicated. For corners and edges having only one sideneighbor, the missing side neighbor is indicated as a null using asterisks.
The linguistic representation of if-then relations between the variables8X(f )
i , Z(f )i 9 versus 8s(f )
i 9, as specified in Table 2, depicts the overlappingattribute of the implication 8s(f )
i 9. That is, by pairing X(f )i and Z(f )
i , amultiple set of overlapping implications are triggered.
Complex Systems, 12 (2000) 31–69

A Complex System Characterization of Modern Telecommunication Services 53
Z(f )i
X(f )i
D-RA-RB RA-RB-RC RB-RC-RD RC-RD-RE RD-RE-RF RE-RF-D
DEXLX
DD HC
HS
DSC HC
SS
DHC EC
SS
DHC HC
SC
DEC EC
SC
DHC D
HC
EXLXMX
SCD SS
HS
HCHS SS
SS
HCSS SC
SS
ECSS SC
SS
HCSC HC
SC
ECSC D
HC
LXMXCX
HSD SS
ES
SSHS SS
ES
SSSS SS
HS
SCSS SC
SS
SCSS HC
HC
HCSC D
HC
MXCSD
HSD ES
D
SSES HS
D
SSES SS
D
SSHS HC
D
SCSS HC
D
HCHC D
D
Table 2. Fuzzy decision table on 8s(f )i 9 given 8X(f )
i , Z(f )i 9. Is the defuzzified value
to be determined.
Suppose the set 8X(f )i , Z(f )
i 9 denoting a specific traffic, seeks call ad-mission at a switch. Likewise, there are other traffics, each having auniverse of discourse, 8X(f )
i , Z(f )i 9j,k,l! which also request a connection at
the same switch. Whether a given call be admitted or not is then decidedby ascertaining the implication vector 8s(f )
i 9j,k,l! pertinent to that call.In Table 2, this implication vector 8s(f )
i 9 of the ith traffic (or call)resides in the neighborhood as a set of four fuzzy variables representedvia linguistic identifications. From the overlapping attributes of 8s(f )
i 9 inTable 2, a meaningful metric should, therefore, be assessed in order todepict the actual complexity of the ith call, so that this metric can beused to decide the CAC criterion under the fuzzy discourses.
6.3 Concept of possibility distribution and construction of fuzzy look-up table
Using the if-then based fuzzy logic scheme discussed in section 6.2, a setof si values and their membership function Μ(si) for a given incoming ithcall (constituted by an heterogeneous mixture of cells) can be specifiedas follows.
From the IT considerations on CLR1 and CLR2 described earlier, themean delay Hi and the standard deviation Σi corresponding to an ith callconstituted by a set of service categories (voice, video, and data) canbe evaluated. This refers to a set cell population M that loads the lineconnected to the input of the ATM switch (Figure 1). Correspondingto this set 8Hi,Σi9, the entropy function H(Hi,Σi) can be determined
Complex Systems, 12 (2000) 31–69

54 P. S. Neelakanta and W. Deecharoenkul
#i#im
Rel
ativ
e nu
mbe
r o
f oc
curr
ence
Figure 3. Histogram of Hi (Him is the modal value).
via equation (14). Hence, the associated complexity metric si can beextracted from H(si, M) I H(Hi,Σi) given by equation (4).
The population M is then increased in steps, together with randomchanges (within specified bounds) of the values of the parameters per-tinent to the service categories constituting the ith call. For each stepof the increased population with the randomly perturbed parameters,the mean delay Hi is ascertained. Hence an histogram depicting themean delay values Hi versus their relative occurrence can be drawn asillustrated in Figure 3.
Using the histogram of Figure 3, for any Hi, the corresponding si andthe bifurcation domain values B(si) in the simple and complex regimesare plotted as depicted in Figure 4. In Figure 4(a), the set of points[7 7 7] represent the aggregation of data on si collected via linguisticattributes of fuzzy sets of antecedents (premises). Further, the Xi denotethe characteristics of service categories of the ith call and the Zi representthe resource profiles handling the ith call on their respective universe ofdiscourse which decide the delay statistics or possibility distribution ofHi presented in Figure 3.
For each population sample depicting a set of linguistic descriptionsof input vectors 8Xi, Zi9 having appropriate statistical attributes, the cor-responding si (deduced via Hi as the consequent) falls under a linguisticcharacterization (such as “extremely simple” or “somewhat complex”).Hence, in the bifurcation diagram of Figure 4(a), the overlapping mem-bership class pertinent to the linguistic descriptions of the si values isdepicted by means of a chosen membership function (such as the trian-gular function). Thus, the set of si values deduced from the histogram ofFigure 3 and presented on the bifurcation diagram of Figure 4(a), mapson the linguistic overlapping descriptions of si as shown in Figure 4(b).
Now, the task is to decide a single or specific linguistic descriptionof si from the fuzzy, overlapping map of Figure 4. This effort calls
Complex Systems, 12 (2000) 31–69

A Complex System Characterization of Modern Telecommunication Services 55
s
B(s)
(b)
10
1
s
(c)1
Simple Complexregime regime
sim#im$
#i#im
Rel
ativ
e nu
mbe
r of
occu
rren
ce
(a)
ES HS SS SC HC EC
µ(s)
0
Figure 4. Bifurcation and membership functions. (a) Histogram depicting thepopulation of cell delays (Him # modal value). (b) Bifurcation function B(si)obtained from the values of si extracted from the histogram of Hi in Figure 3.(c) Projection of 8si9 onto the overlapping membership set of linguistic descrip-tions, 8ES, . . . , EC9.
for a defuzzification procedure and the following two approaches arepursued in the present study.
Approach 1. This approach uses the so-called centroid method [17]. Inthis procedure, the defuzzified value is evaluated by considering a surfacesuch that all the neighborhood values fall onto this surface. Following thisprocedure, the defuzzified value of si is determined from the neighborhoodinformation in respect to the fuzzy look-up table constructed.
Approach 2. From the possibility distribution of Figure 3, the modal valueof Hi, namely, Him is ascertained and the corresponding sim is marked onthe bifurcation diagram of Figure 4(a). By projecting sim further on theΜ(si) map, the membership class of sim to the appropriate (defuzzified)linguistic description is determined.
Complex Systems, 12 (2000) 31–69

56 P. S. Neelakanta and W. Deecharoenkul
Thus, the extent of complexity in terms of the defuzzified complexity-metric value si and its linguistic description are made available withrespect to the ith call by either one of the two approaches indicated.Based on this value, CAC will be implemented as discussed later.
6.4 Call admission boundary: Crisp and fuzzy considerations
As indicated earlier, in practical CAC mechanisms, the ATM switch con-verts the connection of service request signaled across the user–networkinterface into an appropriate service categorization, traffic description,and QOS objective.
The service categorization is declared in terms of a peak-to-averagebit ratio parameter associated with different types of services (such asvoice, video, or data) being handled. Each of these categorized servicescan be labeled as distinct call types with specified traffic requirementsor descriptors (such as peak cell rate) and/or QOS objectives like CLR,CTD, and CDV.
Shown in Figure 5(a) is a crisp call admission boundary in respectto calls identified by the index i # 1, 2, 3, . . .K. For each call, the CLRis regarded as the QOS parameter to control. Suppose each call bearsthree distinct services designated by Η1, Η2, and Η3. A call is a multiplexof these services. Further, the cell loss rate of an ith traffic with a specificcombination of Η1, Η2, and Η3 is denoted by CLR({)i # ({1Η1, {2Η2, {3Η3)iwhere ({1, {2, {3) are relative proportions of the traffics belonging tothe participating service categories. Let the required CLR objectivebe an upper bound CLR0. Then one can divide the ({1Η1, {2Η2, {3Η3)imap into two regions: CLR({)i > CLR0i and CLR({)i < CLR0i. Thecorresponding surface boundary between these two regions is a crispcall admission boundary. When the combination of the numbers ofconnected categorized calls lies above this boundary surface, the ATMswitching node will reject the call setup requests.
!i
liCLRRegion: CLR( l!)i > CLR0i
Region: CLR( l!)i < CLR0i
Crisp boundary
Fuzzyboundaries
High
Medium
Low
CLR li
!i
(a) (b)
Figure 5. The call admission boundary surface of an ith call. (a) Crisp boundary.(b) Overlapping fuzzy boundaries.
Complex Systems, 12 (2000) 31–69

A Complex System Characterization of Modern Telecommunication Services 57
For the reasons stated earlier, if the call admission inference is decidedon the basis of the crisp boundary as described, the decision rule is rigidand more often would lead to a conservative approach in the allocationof available resources. That is, the resource utilization would becomeinefficient and not cost-effective.
Further, based on earlier discussions, it is rather prudent to considerthe call admission boundary to be fuzzy with linguistic attributes ofhigh, low, or medium in respect to the decision on call admission witha desired CLR0i. In other words, Figure 5(a) can be redrawn to indicatethe fuzziness of accept/reject regimes as illustrated in Figure 5(b).
Thus, a given combination of {1Η1, {2Η2, and {3Η3 constituting the ithcall has an associated fuzzy cell loss ratio, (f )CLR({)i #
(f )({1Η1, {2Η2, {3Η3)iwhere the superscript (f ) explicitly denotes the fuzzy attribute. Themembership class of (f )CLR({)i to high, medium, or low regimes is stip-ulated by the membership function, Μ8(f )CLR({)i9 # [1, 0].
In the present study, the call admission criterion is set by a similarfuzzy procedure but with a modification. The call admission boundaryis constructed in terms of the complexity parameter si (instead of CLRor any other objective parameters such as CTD or CDV). The reason (asindicated earlier) is that the complexity parameter si is derived from ITconsiderations and cohesively includes the information loss suffered bya particular set 8{1Η1, {2Η2, {3Η39 as a result of the global traffic impair-ments caused by cell losses due to CDV and/or SNR. Thus, Figure 5(b)illustrating the fuzzy call admission boundaries can be modified to de-note overlapping boundaries of the system complexity, namely simplethrough complex and specified via linguistic identification ES throughEC indicated before. Hence, relevant fuzzy inference would lead to adecision on call admission devoid of over- or under-utilization of avail-able resources. Therefore, the information loss impairment due to CDVand/or SNR is addressed through the complexity parameter s.
6.5 Fuzzy call admission control procedure
Suppose a CAC scheme is designed assuming that the 24 different calls(described in Table 1) are presented to an ATM switch. The call ad-mission criterion for the ith traffic, for example, is set by the value ofsi obtained via one of the defuzzification procedures (Approach 1 or 2)described in section 6.4. The relevant parameters required are indicatedin Table 3.
For simulation purposes two sets of data with source descriptions8Xi9 and profiles of the resources 8Zi9 of the ith call are presumed asgiven in Tables 4 and 5.
Complex Systems, 12 (2000) 31–69

58 P. S. Neelakanta and W. Deecharoenkul
Service categories Parameters
Η1: Data traffic High bit rate # Λ1h(CBR: Interrupted Bernoulli process) Low bit rate # Λ1{
Transition probability from high-to-low rate # PHLlow-to-high rate # PLHLoading factor: {D1
Η2: Voice traffic On-time bit rate # Λ2(CBR: On-off Bernoulli process) On-state probability # Pon
Off-state probability # PoffLoading factor: {D2
Η3: Video traffic Nonbursty bit rate # Λ3(VBR: Markov-modulated Bernoulli Burstiness ratio # BPprocess) Transition probability from
bursty-to-nonbursty state # PBNTransition probability fromnonbursty-to-bursty state # PNB
Loading factor: {D3
Table 3. Source descriptions ({D1 ( {D2 ( {
D3 # 1).
Service category Priority, if any
EX Video: Λ3 # 10 Mbps (MPEG2); BP # 3; {D3 # 0.35;PNB # 0.35; PBN # 0.55
I: Video
Voice: Λ2 # 32 Kbps (compressed voice); Pon # 0.50;Poff # 0.20; {D2 # 0.40
II: Voice
Data: Λ1h # 2 Mbps (data file transfer); Λ2h # 64 Kbps;PLH # 0.50; PHL # 0.90; {D1 # 0.30
III: Data
LX Video: Λ3 # 10 Mbps (broadband video retrieval); BP #5; {D3 # 0.30; PNB # 0.50; PBN # 0.50
I: Video
Voice: Λ2 # 64 Kbps (telephony); Pon # 0.80; Poff #0.10; {D2 # 0.30
II: Voice
Data: Λ1h # 64 Kbps (narrowband document retrieval);Λ1{ # 64 Kbps; PLH # 0.50; PHL # 0.50; {D1 # 0.40
III: Data
MX Video: Λ3 # 2 Mbps (video phone); BP # 1; {D3 # 0.80; I: VideoVoice: Λ2 # 64 Kbps (telephony); Pon # 0.60; Poff #0.40; {D2 # 0.20
II: Voice
CX Voice: Λ2 # 32 Kbps (compressed voice); Pon # 0.50;Poff # 0.50; {D2 # 0.40
I: Voice
Data: 64 Kbps # Λ1h # Λ1{ (data on demand); PLH #PHL # 0.50; {D1 # 0.60
II: Data
Table 4(a). Data set I: Traffic (source) types, 8Xi9.
Complex Systems, 12 (2000) 31–69

A Complex System Characterization of Modern Telecommunication Services 59
Type Description Nominal parameters (typical)
RA: (intense traffic-handling and mediumBER)
Large buffersMedium SNR
Buffer size: 30SNR: 3.5 dBΜ/Λ3 # 15Μ/Λ1h # 75
RB: (moderate traffic-handling and high BER)
Medium buffersLow SNR
Buffer size: 10SNR: 2 dBΜ/Λ3 # 1.5Μ/Λ1h 5 30
RC: (intense traffic-handling and high BER)
Large buffersLow SNR
Buffer size: 30SNR: 2.5 dBΜ/Λ3 # 5Μ/Λ1h 5 20
RD: (low traffic-handlingand medium BER)
Low buffersMedium SNR
Buffer size: 5SNR: 3 dBΜ/Λ3 # 2Μ/Λ1h # 5
RE: (low traffic-handlingand low BER)
Low buffersHigh SNR
Buffer size: 3SNR: 10 dBΜ/Λ3 # 5Μ/Λ1h # 10
RF: (low traffic-handlingand high BER)
Low buffersLow SNR
Buffer size: 2SNR: 1.5 dBΜ/Λ3 # 3Μ/Λ1h # 10
Table 4(b). Data Set I: Profile of the resources, 8Zi9.
Service category Priority, if any
EX MultimediaVideo/MPEG: Λ3 # 90 Mbps; BP # 4; PBN # 0.20;PNB # 0.50; ΛD3 # 0.35
I: Video
Voice: Λ2 # 64 Kbps; Poff # 0.40; Pon # 0.60; {D2 # 0.55 II: VoiceData: Λ1h # 10 Mbps; Λ1{ # 6 Mbps; PLH # 0.20;PHL # 0.85; {D1 # 0.10
III: Data
LX MultimediaVideo: Λ3 # 30 Mbps; BP # 3; PBN # 0.13; PNB # 0.75;{D3 # 0.30
I: Video
Voice: Λ2 # 64 Kbps; Poff # 0.24; Pon # 0.76; {D2 # 0.40 II: VoiceData: Λ1h # 6.3 Mbps; Λ1{ # 2.33 Mbps; PLH # 0.30;PHL # 0.90; {D1 # 0.30
III: Data
MX Voice: Λ2 # 32 Kbps (compressed); Poff # 0.30; Pon #0.70; {D2 # 0.50
I: Voice
Data: Λ1h # 10 Mbps; Λ1{ # 3 Mbps; PLH # 0.20;PHL # 0.80; {D1 # 0.50
II: Data
CX Voice: Λ2 # 64 Kbps; Poff # 0.15; Pon # 0.85; {D2 # 0.65 I: VoiceData: Λ1h # 3 Mbps; Λ1{ # 500 Kbps; PLH # 0.30;PHL # 0.80; {D1 # 0.35
II: Data
Table 5(a). Data set II: Traffic (source) types, 8Xi9.
Complex Systems, 12 (2000) 31–69

60 P. S. Neelakanta and W. Deecharoenkul
Type Description Nominal parameters(typical)
RA: (intense traffic-handling and low
BER)
Large number of buffersTraffic-smoothing presentLarge SNR
Buffer size: 20SNR: 15 dBTraffic-intensities:
Μ/Λ3 # 4; Μ/Λ1h # 30
RB: (moderate traffic-handling and mediumBER)
Medium number of buffersTraffic-smoothing presentMedium SNR
Buffer size: 15SNR: 10 dBTraffic-intensities:
Μ/Λ3 # 3; Μ/Λ1h # 15
RC: (intense traffic-handling and highBER)
Large number of buffersTraffic-smoothing presentLow SNR
Buffer size: 20SNR: 3 dBTraffic-intensities:
Μ/Λ3 # 4; Μ/Λ1h # 30
RD: (moderate traffic-handling and high
BER)
Medium number of buffersTraffic-smoothing presentLow SNR
Buffer size: 10SNR: 2 dBTraffic-intensities:
Μ/Λ3 # 2; Μ/Λ1h # 10
RE: (low traffic-handling and mediumBER)
Low number of buffersTraffic-smoothing presentMedium SNR
Buffer size: 5SNR: 7.5 dBTraffic-intensities:
Μ/Λ3 # 3; Μ/Λ1h # 5
RF: (low traffic-handling and highBER)
Low number of buffersTraffic-smoothing:
presentLow SNR
Buffer size: 5SNR: 2 dBTraffic-intensities:
Μ/Λ3 # 3; Μ/Λ1h # 5
Table 5(b). Data set II: Profile of the resources, 8Zi9.
7. Simulations and results
Relevant to fuzzy heuristics concerning the complexity attributes of anATM transmission as discussed, a call admission strategy is consideredin the simulation experiments. It involves the assignment of an outgoingvirtual channel/virtual path in response to an incoming call request atan ATM switch. The admission of a call meets the negotiated QOSobjectives in a heterogeneous system of incoming calls. As indicatedbefore, the QOS objectives are conglomerated into a single complexityparameter s. Further, the traffics associated with each incoming callare characterized by certain stochastic attributes and the related perfor-mance inferences are regarded as fuzzy.
Suppose the incoming call at an ATM switch corresponds to a givenset of categories vis-a-vis source characteristics and resource profilespresented in section 6. Referring to Figure 1, it is presumed that the cellstreams offered by each source are multiplexed at the entry node of ahigh-speed line with a rate of Μ cells per second.
Complex Systems, 12 (2000) 31–69

A Complex System Characterization of Modern Telecommunication Services 61
GraySimple
0 6 12 18 240
0.5
1.0
Complexregime regime regime
(B)
Call-type/number
Supremum of acceptance
Infimum of rejection
(A)
Rel
ativ
e ca
ll ad
mis
sion
/rej
ecti
on
lim
its
0 6 18 240
0.5
1.0
Simulated results (Data set #1)
12
FuzzySimple Complexregime regime regime
Accept
% &i
Reject
% &i–
Figure 6(a). Simulated results pertinent to data set I, Approach 1. The asteriskdenotes normalization with respect to the peak value and (sDi )df is the defuzzifiedvalue obtained from s(f )
i . (A) (sDi )df values versus the call-type/number mappedto depict the single, fuzzy, and complex regimes. (B) Supremum limit on call-accept decision 8Ξi9 and infimum limit on call-reject decision 8Ξi9 with a graytransition across Ξi and Ξ i.
Now, the CAC function with respect to the multiplexed cells of eachincoming ith call can be interpreted as a mapping of the state vector8si9 into the acceptance decision vector 8Ξi9. This functional mappingdivides the state-space crisply into two regions, namely, the acceptanceregion and rejection region (as indicated in Figure 5(a)), if the inputvariable si and the decision considerations 8Ξi9 are studied in crisp for-mats. However, due to the reason indicated earlier, the input 8Xi, Zi9would cause fuzzy, overlapping decision regions while implementing theacceptance or rejection of a connection request.
Hence, using the fuzzy set 8si9 O 8Xi, Zi9 pertinent to the ith call, thedefuzzification procedure (Approach 1 or 2) would lead to a defuzzifiedvalue (si)
f , say, (si). In Approach 1, it corresponds to the centroidalvalue and in Approach 2, it refers to the modal value sim.
Using the defuzzification approaches, the defuzzified values (si) areobtained for the 24 calls (i # 1, 2, . . . , 24) pertinent to the data sets Iand II.
Complex Systems, 12 (2000) 31–69

62 P. S. Neelakanta and W. Deecharoenkul
0 6 12 18 24
0.0
0.5
1.0
0 6 18 240.0
0.5
1.0
12
(B)
(A)
Rel
ativ
e ca
ll ad
mis
sion
/rej
ecti
on
lim
its
Call-type/number
GraySimple Complexregime regime regime
Simulated results (Data set # 2)
FuzzySimple Complexregime regime regime
Supremum of acceptance
Infimum of rejection
Reject
% &i–
Accept
% &i
Figure 6(b). Simulated results pertinent to data set I, Approach 2. The subscripts1m and 2m on (sDi ) represent the dichotomous solution obtained via equation (4)corresponding to the modal value Him G sim. (A) (sDi )1m and (sDi )2m versus thecall-type/number mapped to depict the single, fuzzy, and complex regimes. (B)Supremum limit on call-accept decision 8Ξi9 and infimum limit on call-rejectdecision 8Ξi9 with a gray transition across Ξi and Ξi.
Since the call admission corresponds to the condition that (si) of anyith call maps onto a preset acceptance decision vector 8Ξi9, the call isallowed, if (si) O 8Ξi9. In Figures 6(a) and 6(b), the defuzzified results fordata set I are presented. The simulated results for data set II are shownin Figures 7(a) and 7(b). The simulations indicated can be performed forany given set of calls submitted to the ATM switch for call admission;and, the admission priority schedule can be specified accordingly.
Consider the graphical results of data set I presented in Figures 6(a)and 6(b) corresponding to Approaches 1 and 2 respectively. In Fig-ure 6(a)/A, the defuzzified and normalized values of si, namely (sDi )dfversus each call type (number) are indicated. These values show twodistinct clusters in the extreme regions marked as simple and complex.In the middle, the set of values presented show transitional character-istics. That is, their membership in the simple or complex category israther fuzzy or nonspecific.
Complex Systems, 12 (2000) 31–69

A Complex System Characterization of Modern Telecommunication Services 63
Simulated results (Data set # 2)
0 6 12 18 240
0.5
1.0
GraySimple Complexregime regime regime
0 6 12 18 240
0.5
1.0
FuzzySimple Complexregime regime regime
Call-type/number
Supremum of acceptance
Infimum of rejection
Accept
% &i
Reject
% &i–
(B)
(A)
Rel
ativ
e ca
ll ad
mis
sion
/rej
ecti
on
lim
its
Figure 7(a). Simulated results pertinent to data set II, Approach 1. (A) (sDi )df val-ues versus the call-type/number mapped to depict the single, fuzzy, and complexregimes. (B) Supremum limit on call-accept decision 8Ξi9 and infimum limit oncall-reject decision 8Ξi9 with a gray transition across Ξi and Ξ i.
The task now is to decide a boundary across this fuzzy regime. Thisis done as shown in Figure 6(a)/B. First, a supremum bound is fittedfor the simple (or accept regime O Ξi) and for the complex (or rejectregime Ξi) an infimum bound is fitted. These boundaries are obtainedby considering the dichotomous values of si (obtained via equation (4))for the linguistic attributes of Table 1. If a value of (sDi )df shown inTable 6(a) (and plotted in Figure 6(a)/A) is set by neighborhood values(sDi )1,2, the corresponding supremum or infimum value is set by theneighborhood values (sDi )2,1 or vice versa.
Similarly, using Approach 2, simulations with data set I (as illustratedin Figure 6(b)), the bounding limits can be specified by (sDi )2m and (sDi )1mand vice versa.
In both approaches the bounds of call accept/reject domains indicate atransitional gray regime as shown in Figures 6 and 7. A line constructedacross this gray region of discontinuity in either case can be regarded asthe boundary of separation between Ξi and Ξi (in this gray regime).
Complex Systems, 12 (2000) 31–69

64 P. S. Neelakanta and W. Deecharoenkul
0 6 12 18 24
0.0
0.5
1.0
0 6 18 240.0
0.5
1.0
12
(B)
(A)
Rel
ativ
e ca
ll ad
mis
sion
/rej
ecti
on
lim
its
Call-type/number
GraySimple Complexregime regime regime
Simulated results (Data set # 2)
FuzzySimple Complexregime regime regime
Supremum of acceptance
Infimum of rejection
Reject
% &i–
Accept
% &i
Figure 7(b). Simulated results pertinent to data set I, Approach 2. (A) (sDi )1m
and (sDi )2m versus the call-type/number mapped to depict the single, fuzzy, andcomplex regimes. (B) Supremum limit on call-accept decision 8Ξi9 and infimumlimit on call-reject decision 8Ξi9 with a gray transition across Ξi and Ξi.
Hence, with the limiting bounds on call acceptance or rejection estab-lished, the two approaches can be compared. Listed in Table 6 are thecounts on accepted type calls (A) and reject type calls (R) enumeratedwithin the bounds indicated in Figures 6(a) and 6(b). There are certaincalls which are close to the boundaries and are marked as A/BL or R/BL(where BL denotes the borderline cases). Table 7 is similar, using theresults of Figures 7(a) and 7(b) obtained from the simulations relevantto data set II with Approaches 1 and 2.
8. Discussions on the results
Referring to the results presented in Figures 6 and 7 and in Tables 6 and7, a summary of details on call admission and/or rejection can be madeas shown in Table 8.
Complex Systems, 12 (2000) 31–69

A Complex System Characterization of Modern Telecommunication Services 65
Approach 1 (Figure 6(a)) Approach 2 (Figure 6(b))
Call Accept Reject Regime/ Accept Reject Regime/Number Type (A) (R) Counts (A) (R) Counts
1 EX-RA A/BL Simple A Simple2 LX-RA A A3 MX-RA A 6-A A4 CX-RA A 2-A/BL A5 EX-RB A/BL 1-R A 9-A6 LX-RB A A7 MX-RB A A8 CX-RB A A9 EX-RC R A
10 LX-RC A/BL Fuzzy A/BL Gray11 MX-RC A R 2-A12 CX-RC A 4-A R/BL 2-R13 EX-RD A/BL 1-A/BL A 1-A/BL14 LX-RD A 1-R/BL A 1-R/BL15 MX-RD A R
16 CX-RD A Complex R Complex17 EX-RE R R18 LX-RE R R19 MX-RE R 1-A R20 CX-RE R 8-R R 9-R21 EX-RF R R22 LX-RF R R23 MX-RF R R24 CX-RF R R
Table 6. Call accept/reject decisions (data set I, Approaches 1 and 2).
From Table 8, it can be observed that Approach 1 leads to decisionsmore diffused and indicates the existence of certain borderline decisioncases. On the other hand, Approach 2 specifies distinct accept/rejectdivision of calls even in the fuzzy regime. Nevertheless, both approachesin majority agree on common decisions.
The above observations are quite justifiable. Approach 1 is based onthe centriod of fuzzy opinion gathered from the neighborhood; whereas,Approach 2 relies on a dichotomous opinion centered around a modalvalue. Hence, a diffused transition across simple-to-complex regimesand abrupt transitions across these regimes can be expected in Ap-proaches 1 and 2 respectively.
Relatively, the diffused decisions obtained via Approach 1 are robustinasmuch as they also indicate the borderline cases (decisions which canbe made only subject to system tolerance or via predefined criterion).Approach 2 on the other hand, has a tendency towards crisp decisionsand therefore may lead to over- or under-specified decisions.
Relevant to these observations, the following inferences can be enu-merated.
Complex Systems, 12 (2000) 31–69

66 P. S. Neelakanta and W. Deecharoenkul
Approach 1 (Figure 7(a)) Approach 2 (Figure 7(b))
Call Accept Reject Regime/ Accept Reject Regime/Number Type (A) (R) Counts (A) (R) Counts
1 EX-RA A Simple A Simple2 LX-RA A A3 MX-RA A A4 CX-RA A 7-A A 8-A5 EX-RB A/BL 1-A/BL A 1-A/BL6 LX-RB A 1-R/BL A7 MX-RB A A8 CX-RB A A9 EX-RC R/BL A/BL
10 LX-RC A/BL Fuzzy A/BL Gray11 MX-RC A R 1-A12 CX-RC A 4-A R 1-A/BL13 EX-RD R/BL 1-A/BL R/BL 2-R14 LX-RD A 1-R/BL A 2-R/BL15 MX-RD A R/BL
16 CX-RD A Complex R Complex17 EX-RE R R18 LX-RE R R19 MX-RE R 1-A R20 CX-RE R 8-R R 9-R21 EX-RF R R22 LX-RF R R23 MX-RF R R24 CX-RF R R
Table 7. Call accept/reject decisions (data set II, Approaches 1 and 2).
Approach 1 Approach 2Data set Regime Decision % of calls % of calls
I Simple Accept 34* 38Reject 4 —
Gray Accept 18* 12Reject 6* 12
Complex Accept 4 —Reject 34 38
II Simple Accept 34* 37*Reject 5* —
Gray Accept 17* 8*Reject 5* 17*
Complex Accept 5 —Reject 34 38
Table 8. Summary of accept/reject decisions. (*Includes borderline decisions.)
Complex Systems, 12 (2000) 31–69

A Complex System Characterization of Modern Telecommunication Services 67
The linguistic classification of calls distinctly fall into three categories,namely, “simple type,” “complex type,” and “fuzzy type” in regards totheir admissibility across the ATM switch.
Approaches 1 and 2 presented here classify these calls and cluster theminto two specific domains namely, simple/accept regime (O Ξi) and com-plex/reject regime (O Ξi). Also, a nonspecific (fuzzy) domain is indicated(between the accept/reject regimes) in which a partial set of calls appear.
A procedure is indicated to obtain the limiting bounds (a supremum onaccept decisions and an infimum on reject decisions) in the accept (Ξi) andreject (Ξi) domains.
Across the fuzzy domain, a transitional boundary (which can brute-forcethe decision either as accept or reject) is drawn by smoothing the asymp-totic discontinuities of supremum and infimum bounds.
With the limiting bounds constructed as above, the decisions made viathe two approaches proposed in respect to data sets I and II can beenumerated as summarized in Table 8.
Another interesting inference that can be made from Figures 6 and7 refers to the nonlinear transition from simple/accept regime to com-plex/reject regime across the fuzzy regime that lies in between.
The nonlinearity of this type arises from the interaction between var-ious subsystems/parameters, which decide the performance (depictingsimple or complex considerations), in reference to the call admissibilityprofile of the traffic. The interaction and the associated uncertainty leadsto a fuzzy nonlinearity which is governed by the fuzzy nonlinear equa-tion (equation (26)) as discussed by one of the authors elsewhere [7].
Typically, the simple-to-complex transitional nonlinearity is dictatedby the order-to-disorder (or vice versa) changes in an interactive system.The nonlinear curve is sigmoidal and can be functionally specified bythe Langevin–Bernoulli function, namely LQ(x) with Q depicting theextent of order/disorder of the system. Its slope at the origin x # 0 isΑ0 # (1 (Q)/3. Shown in Figures 6 and 7 are linear approximations ofthe sigmoidal nonlinearity depicting the transitional states. In Figure 8,the call accept/reject boundary is illustrated in terms of LQ(x) where xdenotes a call characterization parameter.
9. Concluding remarks
The present study offers a robust design methodology to construct afuzzy inference engine, which can manage CAC in ATM transmissions.It uses the concept of complexity in depicting the expert knowledge onoverlapping attributes of traffic parameters. The fuzzy complexity met-ric adopted merges cohesively the delay considerations resulting frombuffer flow and SNR-induced cell losses. Further, two approaches of
Complex Systems, 12 (2000) 31–69

68 P. S. Neelakanta and W. Deecharoenkul
+ 0.5
– 1
– LQ(x)
x+ 1/'0
Slope:'0 = (1 + Q)/3
– 1/'0– 0.5
+ 1
Simple ComplexFuzzy or gray
Acc
ept
Rej
ect
Figure 8. Normalized sigmoidal nonlinearity depicting the bounding limit oncall acceptance/rejection criterion.
defuzzification are indicated. The efficacy and implementation of thisCAC technique are presented via simulated results on a set of calls hav-ing characteristics of practical significance. The CAC proposed herewould match any traffics with varying mean rates and mixed applica-tions as normally encountered in ATM telecommunication. The majorfeature of the CAC strategy indicated here is its simplicity and straight-forwardness.
References
[1] K. Uehara and H. Hirota, “Fuzzy Connection Admission Control forATM Networks Based on Possibility Distribution of Cell Loss Ratio,”IEEE Journal on Selected Areas in Communications, 15 (1997) 197–190.
[2] R. Cheng, “Design of a Fuzzy Traffic Controller for ATM Networks,”IEEE/ACM Transactions on Networking, 4 (1996) 460–469.
[3] N. G. Duffield, J. T. Lewis, N. O’Connell, R. Russell, and F. Toomey, “En-tropy of ATM Traffic Streams: A Tool for Estimating QOS Parameters,”IEEE Journal on Selected Areas in Communications, 13 (1995) 981–990.
[4] I. E. Telatar and R. G. Gallager, “Combining Queueing Theory withInformation Theory for Multiaccess,” IEEE Journal on Selected Areasin Communications, 13 (1995) 963–969.
[5] S. Hsu, P. S. Neelakanta, and S. Abeygunawardana, “Maximum Cell-transfer Delay versus Cell-loss Ratio in ATM Transmission,” Proceedingsof ATM’96 Workshop (San Francisco, CA, Aug. 25–27, 1996, Paper #4,Session TP2).
Complex Systems, 12 (2000) 31–69
A Complex System Characterization of Modern Telecommunication Services 69
[6] P. S. Neelaknata and W. Deecharoenkul, “Fuzzy Aspects of QueueingDynamics of ATM Cell Streams in Information-theoretic Domain,” Pro-ceedings of the Thirty-third Annual Conference on Information Sciencesand Systems (Baltimore, MD, March 17-19, 1999).
[7] P. S. Neelakanta (editor), Information Theoretic Aspects of Neural Net-works (CRC Press, Boca Raton, FL, 1999).
[8] R. J. Gibbens, F. P. Kelly, and P. B. Key, “A Decision-theoretic Approachto Call Admission Control in ATM Networks,” IEEE Journal on SelectedAreas in Communications, 13 (1995) 1101–1113.
[9] J. Libenherr, D. E. Wrege, and D. Ferrari, “Exact Admission Control forNetworks with a Bounded Delay Service,” IEEE/ACM Transactions onNetworking, 4 (1996) 885–901.
[10] A. E. Ferdinand, “A Theory of System Complexity,” International Journalof General Systems, 1 (1994) 19–23.
[11] L. A. Zadeh, “Fuzzy Sets,” Information and Control, 8 (1965) 338–354.
[12] I. Herrero, A. Diaz-Estrella, and F. Sandoval, “Neural Call AdmissionControl through Virtual Link Estimates,” Proceedings of ATM’97 Work-shop (May 25–28, 1997, Lisboa, Portugal).
[13] C. Douligeris and G. Develckos, “Neuro-fuzzy Control in ATM Net-works,” IEEE Communication Magazine, (May 1997) 154–162.
[14] J. E. Neves, M. J. Leitao, and L. B. Almeida, “Neural Networks in B-ISDN Flow Control: ATM Traffic Prediction or Network Modeling,”IEEE Communication Magazine, (October 1995) 50–56.
[15] H. Saito, Teletraffic Technologies in ATM Networks (Artech House,Boston, MA, 1994).
[16] H. Saito, “Toward a Future Dimensioning Method: Nonparametric Ap-proach,” Institute of Electronics Information and Communications Trans-actions, J.76-B-I (3) (1993) 1373–1379.
[17] B. Kosko, Fuzzy Engineering (Prentice Hall, Upper Saddle River, NJ,1997).
Complex Systems, 12 (2000) 31–69