a comprehensive protocol for chemical analysis of flame
TRANSCRIPT
HAL Id: hal-02315159https://hal.archives-ouvertes.fr/hal-02315159
Submitted on 14 Oct 2019
HAL is a multi-disciplinary open accessarchive for the deposit and dissemination of sci-entific research documents, whether they are pub-lished or not. The documents may come fromteaching and research institutions in France orabroad, or from public or private research centers.
L’archive ouverte pluridisciplinaire HAL, estdestinée au dépôt et à la diffusion de documentsscientifiques de niveau recherche, publiés ou non,émanant des établissements d’enseignement et derecherche français ou étrangers, des laboratoirespublics ou privés.
A comprehensive protocol for chemical analysis of flamecombustion emissions by secondary ion mass
spectrometryCornelia Irimiea, Alessandro Faccinetto, Yvain Carpentier, Ismael-Kenneth
Ortega, Nicolas Nuns, Eric Therssen, Pascale Desgroux, Cristian Focsa
To cite this version:Cornelia Irimiea, Alessandro Faccinetto, Yvain Carpentier, Ismael-Kenneth Ortega, Nicolas Nuns, etal.. A comprehensive protocol for chemical analysis of flame combustion emissions by secondary ionmass spectrometry. Rapid Communications in Mass Spectrometry, Wiley, 2018, 32 (13), pp.1015-1025.�10.1002/rcm.8133�. �hal-02315159�
1
A comprehensive protocol for chemical analysis of flame combustion emissions by Secondary Ion Mass Spectrometry
Cornelia Irimiea1,2,†
, Alessandro Faccinetto1,*
, Yvain Carpentier2, Ismael-Kenneth
Ortega3, Nicolas Nuns
4, Eric Therssen
1, Pascale Desgroux
1, Cristian Focsa
2
1Univ. Lille, CNRS, UMR 8522 - PC2A - Laboratoire de Physico-Chimie des Processus de Combustion et de
l’Atmosphère, F-59000 Lille, France.
2Univ. Lille, CNRS, UMR 8523 - PhLAM - Laboratoire de Physique des Lasers, Atomes et Molécules, F-59000
Lille, France.
3ONERA – The French Aerospace Laboratory, F-91123 Palaiseau, France.
4Univ. Lille, CNRS, UMR 2638, Institut M. E. Chevreul, F-59000 Lille, France.
†Currently affiliated to
3.
*Correspondence to: [email protected]
Abstract
RATIONALE. Time of flight secondary ion mass spectrometry (ToF-SIMS) is used to
provide detailed information on the surface chemical composition of soot. An analytical
protocol is proposed and tested on a laboratory flame, and the results are compared with our
previous measurements provided by two-step laser mass spectrometry (L2MS).
METHODS. This work details: (1) the development of a dedicated apparatus to sample
combustion products from atmospheric flames and deposit them on substrates suitable for
ToF-SIMS analysis; (2) the choice of the deposition substrate and the material of the sampling
line, and their effect on the mass spectra; (3) a method to separate the contributions of soot
and condensable gas based on impact deposition, and finally (4) the post-acquisition data
processing.
RESULTS. Compounds produced during flame combustion are detected on the surface of
different deposition substrates and attributed a molecular formula based on mass defect
analysis. Silicon and titanium wafers perform similarly, while the surface roughness of glass
microfiber filters results in a reduced mass resolution. The mass spectra obtained from the
analysis of different locations of the deposits obtained by impaction show characteristic
patterns that are attributed to soot/condensable gas.
CONCLUSIONS. A working method for the analysis of soot samples and the extraction of
useful data from mass spectra is proposed. This protocol should help avoiding common
experimental issues like sample contamination, while optimizing the setup performance by
maximizing the achievable mass resolution.
Keywords: ToF-SIMS, soot, sampling protocol, mass defect, data reduction.

2
1. Introduction
Time of flight secondary ion mass spectrometry (ToF-SIMS) is an analytical technique
used to probe the composition (elemental and/or molecular) of any predefined micro-volume
from any solid surface by sputtering the sample with a primary ion beam, then mass-analyze
the secondary ions ejected from the surface with a time of flight mass spectrometer. The
strength of ToF-SIMS is its ability to identify unknown species when little to any a priori
knowledge of the sample is available. For this very reason, in the last decade ToF-SIMS has
been successfully applied to many fields, e.g. material and Earth sciences and biosciences[1]
.
Dedicated commercial versions can nowadays be purchased as standard laboratory equipment,
while both commercial and freeware software for the reduction and interpretation of the mass
spectra are readily available. However, despite the recent developments, there are still many
issues and challenges when it comes to the analysis of complex samples and quantitative
measurements. In particular, the fast dissociation of the parent ions generated after the surface
sputtering, especially occurring in samples with a high organic content, potentially limits the
access to a complete chemical characterization of the samples[2]
.
Combustion processes release in the troposphere a wide array of pollutants among which
particulate matter (soot) is well known to have detrimental effects on the environment that
range from impacting the radiative balance of the atmosphere[3,4]
to desorbing harmful
compounds inside the lungs after being inhaled. To date, detailed knowledge on the formation
process of soot and on the chemical composition of the soot particles found in the atmosphere
is not fully available. Airborne particles are usually collected directly from the exhausts or
from urban and rural areas after aging in the atmosphere[2,5–7]
. Then, they are analyzed using a
variety of techniques like online aerosol mass spectrometry (AMS) or ex-situ two-step laser
mass spectrometry (L2MS) with the aim of identifying the pollutants formed during the
combustion and/or aging process[8–11]
. Generally, ToF-SIMS is not the technique of choice
when it comes to soot characterization. In order to be analyzed, soot aerosols have to be
sampled and deposited on a solid substrate. Hence, the analysis is obviously limited to the
stable compounds that can survive degradation during the time required for the transfer of the
samples to the analysis facility. Despite such limit, we believe that ToF-SIMS provides
substantial benefits for the characterization of samples containing soot particles and
precursors as polycyclic aromatic hydrocarbons (PAHs). Such benefits include the ability to
probe a layer as thin as 1 nm on the sample surface, thus giving direct detailed molecular
information on the surface chemical composition as opposed to the bulk information
obtainable by other techniques. Furthermore, the high mass resolution that can typically be
achieved from the ion extraction occurring from a flat surface is only possible when analyzing
solid samples. As discussed in this work, the higher mass resolution enables for mass defect
analysis that is a powerful tool to identify unknown species from a mass spectrum[12]
. In
particular, in this work we propose an analytical protocol to analyze soot aerosols that can be
applied either to combustion fundamental research or environmental sciences. We compare
soot samples obtained on three different solid substrates (glass microfiber filters, silicon and
titanium wafers), we assess the effect of the sampling line material on the structure of the
mass spectra (stainless steel, conductive tubing for aerosol transport), and finally we discuss
an experimental approach to separate the soot particulate from the condensable gas in the
aerosol during the ToF-SIMS analysis. The results are compared to our previous
investigations by L2MS.
3
2. Experimental setup
2.1. Burner and sampling system
A laminar diffusion methane flame (DIF-S for short) is used as a soot generator. The
flame is stabilized at atmospheric pressure on a custom burner similar to that used by Shaddix
et al.[13]
and more recently by Tian et al.[14]
The burner is equipped with a 9.4 mm inner
diameter central injector supplied with 0.52 L min-1
of N5.0 grade methane. The injector is
surrounded by a ring-shaped 88 mm outer diameter chamber for the air shield. To obtain a
homogeneous gas shield, the chamber is filled with mineral wool covered with glass beads
and the air enters the bottom of the chamber from three ports spaced at 120°. To improve the
flame stability during the measurements, a large shielding flow is required (86.6 L min-1
of
air) that results in a 11.5 cm high non-smoking flame. To minimize any perturbations from the
environment, a quartz windowed chimney is installed on the top of the burner as shown in
Figure 1a. Laminar diffusion flames similar to flame DIF-S have been subject of many in-situ
investigations by laser induced incandescence/fluorescence (LII/LIF)[15,16]
for real time
monitoring of soot volume fraction and soot precursors[13,14]
. A flame sampling technique is
developed as detailed below. Flame DIF-S is sampled in the axis, roughly mid-flame at
65 mm height above the burner.
To quickly cool down soot and combustion gas extracted from the flame and to quench
post-sampling chemical reactions and limit particle aggregation, an extraction system
featuring high dilution ratio is developed. The extraction system consists of a sampling
microprobe coupled to an automatic pressure regulation system as shown in Figure 1b,
engineered to combine high dilution ratio while minimizing flame perturbations. The
extraction system is a further development of the apparatus that we first tested in Betrancourt
et al.[17]
. Briefly, the microprobe is made of two co-annular quartz tubes that define the
aerosol path. The outer tube has 14 mm OD, 2 mm thickness, while the inner tube has 8 mm
OD, 1 mm thickness. The outer tube ends with a 20 mm long thin tip on which an orifice is
obtained by erosion with emery polishing paper. The incertitude on the aperture diameter is
determined by means of calibrated wires. A nitrogen dilution flow (typically 0.5-20 L min-1
)
enters the microprobe side port and flows between the two quartz tubes up to the probe tip. A
sample flow from the flame enters the microprobe tip orifice drawn in by the room-probe
pressure difference. The sample flow and dilution nitrogen mix in the small chamber at the
probe tip and are quickly removed into the pumping flow through the inner tube. The
automatic pressure regulation system is located downstream the microprobe, and consists of a
HEPA filter, a Pfeiffer CMR261 pressure gauge, a Pfeiffer EVR116 automatic regulation
valve and a pumping unit, as shown in Figure1b. The automatic regulation valve uses a
proportional-integral-derivative (PID) control loop feedback to maintain the pressure in the
sampling line within 0.5 mbar from the set point. The pressure differential p between the
sampling line (thus the microprobe) and the room (thus the flame) is typically set in the range
30-50 mbar depending on the required dilution. The larger the p the more efficient the
extraction from the flame (soot and gas concentration in the sampling line increases), but also
the larger the particle aggregation and vapor condensation rates in parallel. The p was
limited below 50 mbar to avoid flame perturbation and to reduce the flame sampled volume.
In particular, improvements with respect to Betrancourt et al.[17]
include:
increased the probe orifice diameter up to 500±50 µm to be able to sample flame
DIF-S (sooting flame) without clogging the probe , typically 5-10 min;
replaced the conducting tubing for aerosol transport with stainless steel tubing to
avoid polysiloxane contamination (see Results and Discussion);
4
implemented a homemade impactor used for the deposition of soot on substrates
suitable for ex-situ analyses.
calibrated the system for dilution ratio as high as 3.10
4. The sampling system is
tested and calibrated with a reference ammonium sulfate aerosol. The aerosol is
generated in a TSI model 3076 atomizer, dried then injected into a 2 L buffer
volume in which the microprobe is introduced through a side port. The particle
concentration inside the buffer volume and downstream the probe are monitored in
parallel in real time using two condensation particle counters CPC TSI model
3775, both of them calibrated shortly before the test. With this setup it is possible
to reliably calculate the dilution ratio introduced by the probe on the test aerosol as
a function of p and dilution flow.
2.2. Preparation of samples for surface analysis
The mass resolution is affected by the surface roughness, therefore the substrates have to
be prepared in a way that limit their surface irregularities. This way aerosols can be analyzed
after deposition on suitable substrates with a well-defined procedure. This section details the
substrate choice, the employed cleaning protocol and the deposition method. We compare the
mass spectra obtained by deposition of soot and condensable gas on glass microfiber filters
that allows high efficiency particle collection with those obtained from the impaction on
ultra-flat silicon and titanium wafers that enables for the maximum mass resolution. Filters
and wafers are first decontaminated then used as substrates for soot deposition.
2.2.1. Substrate decontamination
Binder-free, glass microfiber Whatman filters having 21 mm diameter, 0.26 mm thickness
(52 g m-2
, 0.7 µm smallest pore size) are purchased from Fisher Scientifics. Silicon (100)
wafers 10x10x0.5 mm optically polished on one side are purchased from PI-KEM Ltd. Grade
5 titanium alloy wafers (90% titanium, 6% aluminum, 4% vanadium) 10x10x0.5 mm optically
polished on one side are purchased from Optics Concept. All chemicals employed in the
surface cleaning protocols detailed below are 99.5% or higher purity and purchased from
Sigma-Aldrich.
The glass microfiber filters are washed with dichloromethane then heated up to 250°C for
12 hours before sampling in order to reduce surface contamination and finally transferred to
the sample holders.
Silicon and titanium wafers are pre-cleaned with ethanol-wet optical paper then specific
protocols are employed to increase the thickness of the passivating oxides and remove surface
contaminations.
Silicon wafers are further decontaminated by RCA cleaning[18]
that consists of two steps
during which oxidative desorption with hydrogen peroxide/ammonium hydroxide (RCA1) is
followed by complexation with hydrogen peroxide/hydrochloric acid (RCA2). The wafers are
first immersed in the RCA1 solution contained into a large crystallizer (325 mL ultrapure
water, 65 mL of ammonia solution 27% w/w and 65 mL of hydrogen peroxide 30% w/w)
heated up to 70°C for 20 min, rinsed five times with ultrapure water. The wafers still wet are
transferred in a second crystallizer containing the RCA2 solution (300 mL ultrapure water,
50 mL of hydrochloric acid 36% w/w and 50 mL of hydrogen peroxide 30% w/w, heated up
to 70°C) for 20 min then rinsed with ultrapure water.

5
Titanium wafers are further decontaminated by nitric acid cleaning. The wafers are
immersed in the cleaning solution contained into a large crystallizer (50 mL ultrapure water
and 50 mL of nitric acid 70% w/w) and heated up to 60°C for 20 min.
All wafers are finally rinsed five times with ultrapure water then dried by gradually
heating them up to 50°C inside a clean closed crystallizer. Once dry, they are transferred to
the sample holders consisting of 3.5 cm diameter glass Petri dishes for storage. The sample
holders are sealed with Parafilm strips to avoid recontamination, and opened only
immediately before flame sampling.
2.2.2. Sampling procedure: soot/condensable gas deposition
The microprobe used to sample the flame is connected downstream to the sample holders
as follows.
Sampling on glass microfiber filters: a custom sample holder for glass microfiber filters is
obtained from two KF25 flanges by fitting a disc of porous glass inside the centering ring, and
blocking a glass microfiber filter on its surface with a suitable o-ring. The microfiber filter
covers the whole line section so that the pumping flow is entirely forced to pass through the
filter. Soot particles are trapped between the fibers, while condensable gas deposit/adsorb on
the fibers surface as well as on the already deposited soot.
Sampling on wafers: the sample holder for wafers is a custom homemade impactor. The
wafer is fixed on a supporting metal grid 1.0 mm from the very end of the inner metal tube
that transports the soot-laden flow. The wafer covers around one third of the sampling line
cross section, and no appreciable difference in the line pressure drop can be measured with or
without it. Soot particles and condensable gas impact the wafer at around 30 m s-1
flow
velocity, and generate a thin layer of deposited materials on its surface.
A bypass line is installed in both cases to allow a pre-sampling pumping of the main line
and the easy replacement of the filters/wafers without affecting the line pressure and
temperature, and to avoid cross-contamination of the samples. The sampling time for flame
DIF-S is 3 min per deposition.
2.3. Two-step laser mass spectrometry (L2MS)
The custom developed L2MS apparatus has been described in detail elsewhere[19,20]
.
Briefly, a Nd:YAG laser beam (Quantel Brilliant, 4 ns, 532 nm, 10 Hz) is focused to a
0.2 mm2 circular spot on the surface of the sample that is placed in the ion source of the mass
spectrometer (10−8
mbar residual pressure) on a cryogenic stage. Neutral species in the
desorption plume are then ionized by an orthogonal laser beam (Continuum Powerlite, 6 ns,
266 nm, 10 Hz), and mass analyzed in a custom Jordan ToF Products Inc. 1.72 m long
reflectron ToF-MS (maximum resolving power is ~1500). The ion detector signals are
recorded using a 2 GHz digital oscilloscope LeCroy Waverunner 6200A. Both desorption and
ionization irradiances are kept close to the threshold (typically several MW cm-2
) to avoid
post-ionization dissociation of the analytes. L2MS mass spectra are averaged over 25
desorption spots on the same sample surface.
2.4. Time of flight secondary ion mass spectrometry (Tof-SIMS)
To gain information on the surface chemical composition of soot and gas
deposited/condensed on the samples, a protocol that makes use of the commercial ION-TOF
GmbH apparatus ToF.SIMS5 available at the Surface Analysis Platform at Univ. Lille is

6
developed[21]
. The theoretical maximum resolving power of the mass spectrometer is ~104.
The instrument can be operated in either static or dynamic mode. The two modes are
delimited by the value of the total ion dose which is set to 1013
ions cm-2[22]
. A total ion dose
below this threshold (static mode) is considered to provide no more than one ion to the top
surface layer of atoms and molecules, and this classifies this technique as suitable for soot
surface analysis without loss of chemical information of the parent molecules due to
post-ionization dissociation reactions. Our main interest is the organic content and in this case
Bi3+ is the appropriate primary ion gun to be used
[22]. The static mode is used to obtain mass
spectra of selected regions from the sample surface by irradiating it in random mode at 25 kV.
The acquisition is performed using 130 scans/acquisition (300 s) on a 500 x 500 µm2 surface,
with 256 x 256 pixels image resolution. An electron flood gun is used for the surface charge
compensation whenever insulating substrates like glass microfiber filters are analyzed. These
settings lead to an ion dose of ~1011
ions cm-2
, well below the threshold of SIMS static mode.
Multiple zones from the sample surface are scanned in positive polarity. Some contamination
between samples is observed when analyzing multiple samples, therefore we recommend
analyzing one sample at a time.
2.4.1. Post-acquisition data processing
Data pre–processing is used to correct or minimize some acquisition issues before
analyzing mass spectra, like instrument miscalibration and background noise. In this work the
mass spectra are calibrated, smoothed and aligned. Then, the signal peaks are selected and
built into a peak list and attributed a molecular formula by mass defect analysis.
Mass calibration
Easily identified C+, CH+ and CH2+ are used for a first mass calibration, and later replaced
by other carbon–hydrogen ions selected because of their symmetrical shape and roughly
equally spaced on the m/z range of interest. Internal consistency of the mass calibration is
verified by double checking the m/z of some polyaromatic hydrocarbon molecular ions well
known to form into flames (C10H8+, C16H10+ and C24H12+ to name a few) after every addition
of a new mass calibration peak.
Mass resolution and effect of the deposition substrate
The achieved mass resolution calculated at the full width of the peak at half its maximum
height (FWHM) is in the range [1000, 2500] for depositions on glass microfiber filters, and
[6000, 7500] for depositions on wafers (Si or Ti). The comparison between the two mass
spectra obtained from soot deposited on microfiber glass filters and Si wafers as well as the
Gaussian fit of the identified peaks are shown in Figure 2. In particular, the mass spectra
obtained from deposition on wafers give access to additional information and improve the
confidence level on the determination of the accurate mass, while depositions on microfiber
glass filter result in a much poorer accuracy. There is no significant difference between
samples deposited on silicon and titanium wafers once the mass spectra are normalized and
the blank peaks are removed.
Smoothing
Being the primary purpose of the data reduction the measurement of both the accurate
mass (m/z value of the center of the peaks) and the peak integrated area, a low smooth ratio
algorithm is preferred to avoid excessive peak height reduction. A satisfying compromise
7
between noise reduction and peak height reduction is found with a fast Fourier transform
algorithm (FFT), five points sampling (corresponding to 105 Hz cutoff frequency) that
efficiently removes the high frequency noise in exchange of approximately 5% reduction of
the peak intensity. A baseline correction is not deemed necessary.
m/z alignment
A common issue in high resolution mass spectrometry is the systematic shift between the
time of flight and the observed m/z that is often due to poor calibration or slight changes in the
analytical parameters over different acquisitions. Therefore, systematic shifts sometimes
appear in repeated acquisitions that might result in the same compound to be attributed
different accurate mass. To minimize this uncertainty, the m/z axes are re–scaled and shifted
in order to maximize the correlation between different samples and the calculated m/z of a
group of reference peaks. The pattern of carbon fragment ions at low m/z and PAHs is
assessed from the analysis of PAHs standards, and can be used as a reference to align the peak
sequence.
Normalization
Systematic differences in the amount of desorbed and ionized compounds are common
and may originate from a variety of sources: different sample size, preparation, inconstancy of
the acquisition parameters, etc. The overall result is a fluctuation of the ion count. To
compensate at least partially for these differences, the mass spectra are normalized to the
partial ion count calculated on the selected peak list only (discussed in the following section),
after discarding any signal attributed to the blank (mostly organosilicon or organotitanium
compounds). The blanks are filters/wafers cleaned as detailed above. This approach is deemed
necessary to compare samples deposited on substrates having different chemical composition
and thus very different background signals and intensities.
Background subtraction and peak finding
A peak finding algorithm based on second derivative filtering is used to automate the peak
finding procedure. The automatically generated peak list is then manually refined based on
the comparative analysis of samples obtained from different substrates as detailed below.
The reactivity of soot and condensable gas at the substrate surface is not completely
negligible, especially in the case of depositions on silicon and titanium wafers, and peak
signals corresponding to some reaction products are well distinctive of the substrate material.
Although organotitanium compounds are easily identified courtesy of titanium’s very
distinctive isotopic pattern and large negative mass defect (see below), organosilicon
compounds tend to effectively overlap carbon and carbon-oxygen compounds and sometimes
can be tricky to identify.
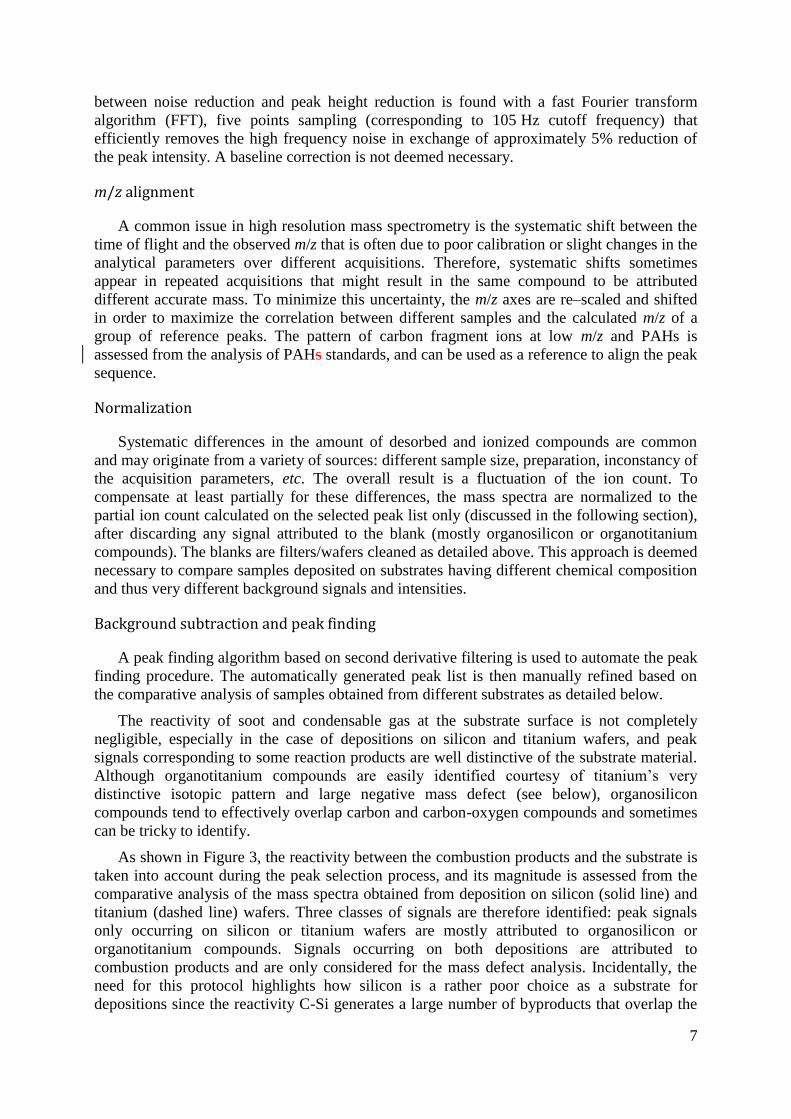
As shown in Figure 3, the reactivity between the combustion products and the substrate is
taken into account during the peak selection process, and its magnitude is assessed from the
comparative analysis of the mass spectra obtained from deposition on silicon (solid line) and
titanium (dashed line) wafers. Three classes of signals are therefore identified: peak signals
only occurring on silicon or titanium wafers are mostly attributed to organosilicon or
organotitanium compounds. Signals occurring on both depositions are attributed to
combustion products and are only considered for the mass defect analysis. Incidentally, the
need for this protocol highlights how silicon is a rather poor choice as a substrate for
depositions since the reactivity C-Si generates a large number of byproducts that overlap the

8
combustion products in the mass spectra and therefore heavily interfere with the peak
identification and area integration. Once the substrate-specific peaks are removed, the
substrate chemical composition does not seem to play any other role on the structure of the
peak sequence.
Accurate mass and peak integrated areas are obtained from Gaussian fits using the
freeware ToF Tools platform[23]
. The peak deconvolution in the range m/z = 476-478 is shown
in Figure 2. A mass spectrum obtained in the same experimental conditions on glass
microfiber filter is also shown for comparison. The uncertainty on the determination of the
accurate mass is estimated as the standard deviation of at least three measurements performed
on the surface of the same sample.
3. Results and discussion
Five different samples are collected in the same flame conditions, and five zones are
analyzed at the surface of each sample for reproducibility tests. The reproducibility of the
mass spectra obtained from different surface locations is satisfying when the data
post-processing is limited to the signals in the peak list (i.e. attributed to soot). After removal
of the blank signals and normalization of the mass spectra by the partial ion count calculated
on the peak list, the standard deviation calculated on the five different acquisitions on the
same sample is typically the 15-20% of the average.
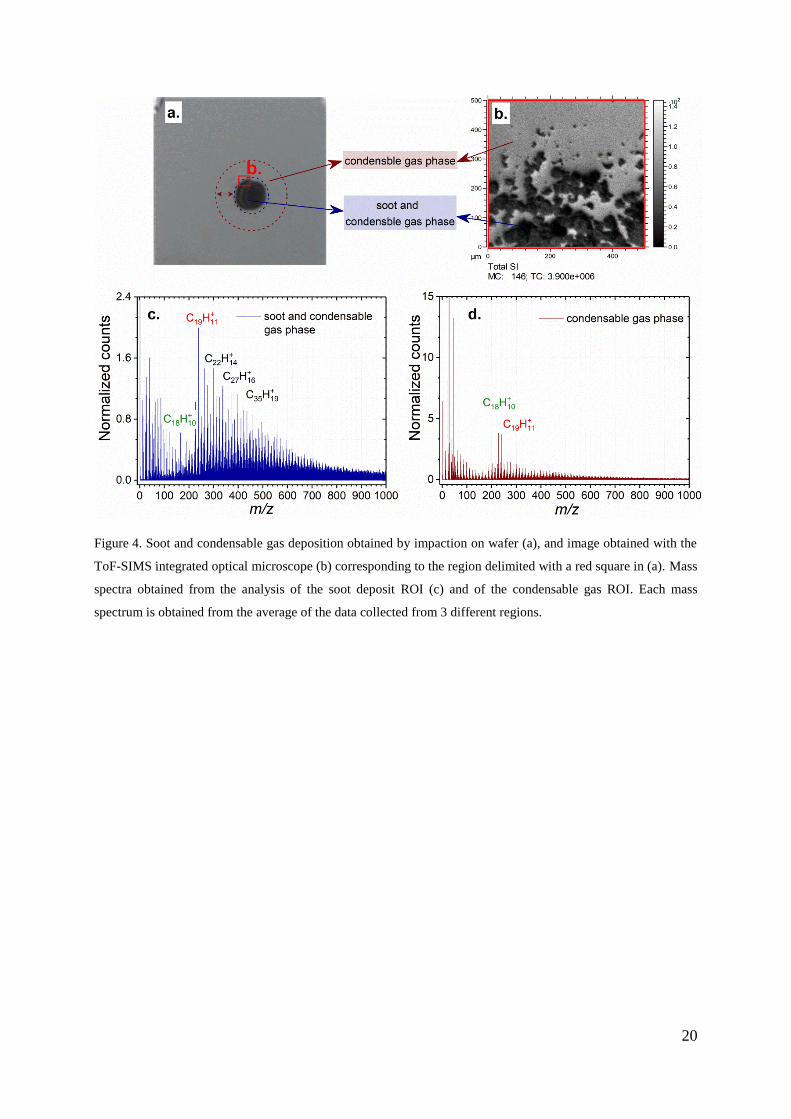
3.1. Soot vs. condensable gas
High velocity impaction in the range of 30 m s-1
results in the soot particles depositing on
the wafer surface on a small spot having roughly 3–5 mm diameter as shown in Figure 4a.
Figure 4b shows an image 500 x 500 µm2 on the border of the soot deposit. Soot particles
aggregate on the center of the wafer, while condensable gas scatter on the whole wafer
surface. Post-analysis data reconstruction allows for the attribution of a mass spectrum to
different areas corresponding to the selected regions of interest (ROI). The analysis of a ROI
in the soot deposit (Figure 4c) and a ROI on the wafer surface surrounding the soot (Figure
4d) can be exploited for a rough separation of the contributions to the mass spectra of
condensable gas and soot particles as explained below. The mass spectra feature different
contribution of the molecular ions in the low and high mass region. The condensable gas ROI
is dominated by low mass fragment ions in the region m/z < 100. After normalization, the
peak relative intensities differ in the high m/z region, with a very low contribution of high
mass molecular ions. In general, the soot deposit ROI are significantly richer in high m/z
masses than the condensable gas ROI, and feature an intensity maximum in the region
m/z ∈ [200, 300]. Another major difference between the two regions is given by the base peak
identified in the high m/z region that shifts from C18H10+ on the wafer to C19H11
+ on the soot
spot.
As already mentioned above and shown in Figure 4a, soot accumulates on a spot in front
of the impactor aperture and is visually absent anywhere else on the wafer surface. On the
other hand, the deposition of condensable gas on the top of already deposited soot cannot be
ruled out, especially when considering the high specific surface area of young soot particles.
In order to separate the contribution to the mass spectra of soot and condensable gas, a direct
subtraction between the two zones is risky since it would likely generate spurious negative
and positive peaks. In Betrancourt et al.[17]
we showed that the probe is able to sample
ultrafine particles as small as 4 nm for online mobility diameter measurements. However, in
this work, to be detected the particles have to deposit on the wafer surface and therefore any
9
particle smaller than the cutoff diameter escapes impaction. At the time of this work the cutoff
diameter of the custom-made impactor was not known. This way we sampled a reference
flame in which the primary particle diameter is known from laser induced incandescence
measurements and estimated bellow 4 nm, Bladh et al.[33]
. The sampling over wafers resulted
in depositions reproducible and visible to the naked eye. Accordingly deposition of ultrafine
particles is most likely possible because of the occurrence of post-sampling aggregation that
shifts their size distribution, above the impactor cutoff diameter. However, it is reasonable to
believe that post-sampling aggregation does not affect the surface chemical composition, and
therefore ToF-SIMS surface analysis is still expected to be representative of the surface
chemical composition of the sampled particles. Furthermore, it is already shown for a
premixed flame[32]
that the condensed gas phase contains masses as high as m/z = 400. A
similar mass distribution is identified for the zone outside the soot spot in this work (Figure
4d). The small contribution of the masses higher than m/z = 400 may be due to soot
aggregates that are trapped within the condensable gas phase.
Although the wafer surface ROI provides chemical information on the condensable gas
phase, the contributions to the mass spectra of condensable gas and soot particles cannot be
easily separated on the soot deposit ROI. This asymmetry is due to the larger diffusion
coefficient of the gas compared to the particles. This approach is a further improvement of our
previous works based on deposition on microfiber glass filters[31,32]
. In particular, soot
particles and condensable gas tend to form a homogenous mix on the surface of the glass
microfiber filters and as a result their contributions are very tricky to separate. By contrast, the
main advantage of impaction is the net separation between the particulate matter that deposits
on the central spot, and the condensable gas that can diffuse and deposit all over the wafer
surface.
3.2. Mass defect analysis to identify unknown compounds
Data pre–processing is used to correct or minimize some of the acquisition issues before
analyzing mass spectra data. The mass spectra are calibrated, smoothed and re–aligned as
detailed in the methodology section. Then, mass defect analysis allows the assignment of a
molecular formula to the selected accurate masses and therefore the definition of a working
peak list.
The nuclear binding energy is slightly different for every nuclide, and this is reflected into
a different exact mass. Therefore, different atoms, molecules or ions have unique exact mass
even if they share the same nominal mass. The mass defect , defined as the difference
between the exact mass of an atom, molecule or ion with a given isobaric composition and its
nominal mass is also unique and is a powerful tool to identify unknown species[25,26]
. In
principle, this procedure can be extended to any atom, molecule, ion or even cluster once its
mass defect is known. The use of mass defect plots has two distinctive advantages. First, each
signal peak corresponds univocally to one data point, so that large data sets can be represented
in a relatively simple plot. Second, homologous series of peaks line up and important patterns
become apparent even for complex mass spectra. From this representation it is possible to
associate classes of molecules to the identified species: for instance, in the mass defect plot
aliphatic groups have a larger slope (due to the higher number of hydrogen atoms contained
into the molecule) while aromatic compounds have a smaller slope (they contain a lower
number of hydrogen atoms per carbon atom).
The mass defect plots obtained from the mass spectra in Figure 4c and d are shown in
Figure 5. CmHn+ ions are identified with high confidence by mass defect analysis (accurate

10
and exact mass differ by 0.1-5 ppm), and represent the most intense signals. Many signals
attributed to CmHn+ ions are consistent with PAH molecular ions.
A sequence of low mass defect compounds emerges below the main CmHn+ sequence. The
identification of these signals is not yet conclusive since the lower mass defect can be due to
the presence of more oxygen atoms or fewer hydrogen atoms alike. At low m/z the mass
resolution alone is generally sufficient to univocally attribute a CmHn+ or CmHnOp
+ formula,
however at higher m/z more and more elemental combinations are consistent with the same
accurate mass within the experimental incertitude. Sometimes, the isotopic pattern can
provide useful information to distinguish the two different situations; however, we have not
yet performed a systematic investigation but only examined some specific cases that so far
seem to support the presence of oxygen-containing molecules rather than fragment ions.
It should be noted that at this level of the data analysis, the presence of fragment ions in
the mass defect plot does not really impact the data interpretation. However, in order to
extract detailed chemical information from the mass spectra it is required to separate
molecular and fragment ions. Developing and validating a method to identify fragment ions is
beyond the scope of this paper, but we will address it in the future developments of our work.
3.3. Sample contamination due to polysiloxanes
Significant amounts of contaminating organosilicon compounds are occasionally detected
by mass defect analysis. In some cases, the contaminated samples can be simply recognized
by visual inspection of the wafers, since a white-iridescent layer appears at the wafer surface.
The presence of a large concentration of organosilicon compounds often corresponds to a
drastic drop of the mass resolution in the contaminated samples, in parallel with the
appearance in the mass spectra of new peaks mostly attributed to polysiloxanes fragment ions.
This way becomes impossible to extract information from the mass spectrum because
polysiloxanes fragment ions drastically alter the typical soot and condensable gas pattern. The
main peaks identified and attributed to polysiloxanes are listed in Table 1. The comparative
analysis of the samples and a close investigation of the sampling process show that the
contamination source is the conductive tubing for aerosol transport used during early tests.
The surface reactivity on silicon wafers is quickly ruled out since depositions on titanium
wafers are occasionally contaminated as well. Furthermore, polysiloxanes from the
conductive tubing produce a significantly different mass pattern than the soot surface
reactivity on silicon wafers: the former generates peaks that are mostly attributed to
oxygen-containing (polysiloxane) fragment ions as shown in Table 1. The latter are generally
characterized by larger mass defect peaks that are attributed to fragment ions with significant
lower oxygen content. In any case, replacing the conductive tubing for aerosol transport with
Teflon or stainless steel tubing completely removed the contamination source. Silicone
conductive tubing is widely used for aerosol transport because they minimize the particle loss,
therefore we recommend caution, all the more since this issue was already addressed in the
past[27–30]
. In fact, especially if the transport line is heated (in our case because of the
proximity to the sampling probe), polysiloxane desorbed from the tubing can re-adsorb at the
particle surface, completely changing the structure (peak list and peak relative intensity) of
the mass spectra of contaminated samples.
3.4. ToF-SIMS vs. L2MS
The mass spectra obtained with ToF-SIMS and L2MS are compared in Figure 6. The
L2MS mass spectrum is characterized by a single mass distribution, spanning the range
m/z ∈ [150, 600] and dominated by m/z = 202 (C16H10+). m/z < 100 contains a low

11
contribution of fragments of PAHs. Similar mass distributions have been previously
reported[31,34]
. By contrast, the SIMS mass spectrum shows two different peak distributions:
the first one at low m/z is dominated by ions having intensity rapidly decreasing with m/z, and
a second one covering m/z ∈ [150, 800] features the strongest peaks in m/z ∈ [200, 300].
Observations of the former distribution suggest that post-ionization dissociation reactions
likely play a prominent role in SIMS measurements.
In the high mass distributions of both mass spectra, the strongest peaks are 12 u spaced
and are accompanied by weaker satellite peaks. This distribution is commonly attributed to
PAH molecules[35]
. A closer look to the L2MS mass spectrum shows an alternation of strong
and weak groups of peaks. The strongest ones are associated with structures having an even
number of carbon atoms and corresponding to Stein’s stabilomers[36]
. The maximum of the
distribution in SIMS is slightly shifted to higher masses compared to the L2MS mass spectra.
This behavior is likely due to the strong post-ionization dissociation reactions occurring under
ion bombardment in the keV regime. Tyler et al.[37]
observed that the signals of small PAH
parent ions (naphthalene, anthracene and pyrene) are one order of magnitude less intense than
fragment ions in positive SIMS measurements. By contrast, the mass spectrum of coronene is
mostly fragment-free[38]
. For larger PAHs, additional fragmentation peaks are recorded
corresponding to the sequential loss of 2H as also mentioned in[38]
. The preferential loss of 2H
has also been reported for PAHs during photolysis[39]
.
The low m/z region in L2MS mass spectra is almost signal-free for two main reasons.
First, successive optimization steps in our technique[19,20]
led to the conclusion that desorption
and ionization laser irradiance must be lowered close to the threshold to increase the PAH
signal by avoiding fragmentation. Second, resonant one-color, two-photon laser ionization at
266 nm (4.66 eV) is a very efficient method to selectively ionize PAHs since they have strong
– * absorption bands in this spectral region and their ionization potentials are lower than
the energy of two photons (9.32 eV)[40,41].
On the contrary, we cannot expect to see any
aliphatic molecules which do not absorb at this wavelength and for which the ionization
potentials lie at higher energies[42]
. We note that extensive discussion can be found in the
literature on the presence or absence of the aliphatic compounds in the adsorbed phase of soot
particles[43,44]
.
4. Conclusions
In this paper we developed an experimental method to analyze soot and condensable gas
produced during flame combustion by ToF-SIMS. We focused on the definition of an
analytical protocol including all steps from the soot sampling to the data processing. In
particular, we developed a dedicated probe sampling apparatus that enables for high dilution
ratio during sampling. We compared sampling using silicone conductive tubing and stainless
steel tubing for aerosol transport and we observed that many samples obtained with the
former are affected by large amounts of polysiloxanes, which makes any further data
reduction nigh impossible. In order to improve the overall quality of the mass spectra, we
investigated soot depositions on three different substrates, microfiber glass filters, silicon and
titanium wafers, and compared the results with our previous measurements by L2MS. The
ultra-flat surface resulting from depositions on wafers enables for a mass resolution roughly
four times larger than microfiber glass filters that in turn makes mass defect analysis possible.
Once the substrate-specific peaks are removed, silicon and titanium wafers perform very
similarly. However, titanium is the preferred substrate since its surface reactivity byproducts
are more easily identified than silicon. The mass spectra are calibrated, smoothed, and
aligned. The accurate masses are built into a peak list and identified by mass defect analysis
12
and comparative analysis of the depositions on different substrates, and mainly attributed to
CmHn+ and CmHnOp
+ ions.
The mass spectra obtained from the analysis of the soot deposit are significantly richer in
high mass than those obtained from the wafer surface far from the deposit. Such difference
can be exploited to get information on the chemical composition of the gas phase: while
particles only deposit on the impaction spot, condensable gas deposit all over the wafer
surface, including the already deposited soot.
The differences between ToF-SIMS and L2MS are due to the instrument performance and
to analytical method. While ToF-SIMS features higher overall sensitivity, mass range and
resolving power, the harsh ionization process results in the mass spectra being heavily
affected by post ionization dissociation reactions. On the other hand, low-irradiance laser
ionization in L2MS enables for almost fragment free mass spectra, while REMPI ionization
greatly enhances the detection of few PAHs only.
Future work will focus on the development of a database of samples. In particular, the
analysis of a variety of soot samples collected from different flames and reaction times is
expected to provide useful information on the kinetic of soot nucleation and surface growth.
5. Acknowledgements
This work was supported by the Agence Nationale de la Recherche through the LABEX
CAPPA (ANR-11-LABX-0005), the Ministry of Higher Education and Research, Hauts-de-
France Regional Council and European Regional Development Fund (ERDF) through the
Contrat de Projets Etat-Region (CPER CLIMIBIO), the H2020 project Portable Nano-Particle
Emission Measurement System (PEMs4Nano, Grant Agreement no. 724145) and the
international project SW-0608.

13
6. References
[1] P. van der Heide, FrontMatter, in Secondary Ion Mass Spectrometry. John Wiley &
Sons, Inc., Hoboken, NJ, USA, 2014, pp. i–xvii.
[2] R. E. Peterson, B. J. Tyler. Analysis of organic and inorganic species on the surface of
atmospheric aerosol using time-of-flight secondary ion mass spectrometry (TOF-SIMS).
Atmos. Environ. 2002, 36, 6041.
[3] B. Öktem, M. P. Tolocka, B. Zhao, H. Wang, M. V Johnston, M. V Johnston. Chemical
species associated with the early stage of soot growth in a laminar premixed ethylene–
oxygen–argon flame. Combust. Flame 2005, 142, 364.
[4] H. Wang. Formation of nascent soot and other condensed-phase materials in flames.
Proc. Combust. Inst. 2011, 33, 41.
[5] U. Kirchner, R. Vogt, C. Natzeck, J. Goschnick. Single particle MS, SNMS, SIMS,
XPS, and FTIR spectroscopic analysis of soot particles during the AIDA campaign. J.
Aerosol Sci. 2003, 34, 1323.
[6] W. Cheng, L. T. Weng, Y. Li, A. Lau, C. Chan, C. M. Chan. Characterization of size-
segregated aerosols using ToF-SIMS imaging and depth profiling. Surf. Interface Anal.
2014, 46, 480.
[7] O. B. Popovicheva, C. Irimiea, Y. Carpentier, et al. Chemical Composition of
Diesel/Biodiesel Particulate Exhaust by FTIR Spectroscopy and Mass Spectrometry:
Impact of Fuel and Driving Cycle. Aerosol Air Qual. Res. 2017, 17, 1717.
[8] A. Faccinetto, K. Thomson, M. Ziskind, C. Focsa. Coupling of desorption and
photoionization processes in two-step laser mass spectrometry of polycyclic aromatic
hydrocarbons. Appl. Phys. A. 2008, 92, 969.
[9] R. Lemaire, A. Faccinetto, E. Therssen, M. Ziskind, C. Focsa, P. Desgroux.
Experimental comparison of soot formation in turbulent flames of Diesel and surrogate
Diesel fuels. Proc. Combust. Inst. 2009, 32, 737.
[10] F. Aubriet, V. Carré. Potential of laser mass spectrometry for the analysis of
environmental dust particles-A review. Anal. Chim. Acta 2010, 659, 34.
[11] T. R. Dallmann, T. B. Onasch, T. W. Kirchstetter, et al. Characterization of particulate
matter emissions from on-road gasoline and diesel vehicles using a soot particle aerosol
mass spectrometer. Atmospheric Chem. Phys. 2014, 14, 7585.
[12] A. Faccinetto, C. Focsa, P. Desgroux, M. Ziskind. Progress toward the quantitative
analysis of PAHs adsorbed on soot by laser desorption/laser ionization/time-of-flight
mass spectrometry. Environ. Sci. Technol. 2015, 49, 10510.
[13] C. R. Shaddix, J. E. Harrington, K. C. Smyth. Quantitative measurements of enhanced
soot production in a flickering methane/air diffusion flame. Combust. Flame 1994, 99,
723.
[14] B. Tian, Y. Gao, S. Balusamy, S. Hochgreb. High spatial resolution laser cavity
extinction and laser-induced incandescence in low-soot-producing flames. Appl. Phys. B
Lasers Opt. 2015, 120, 469.
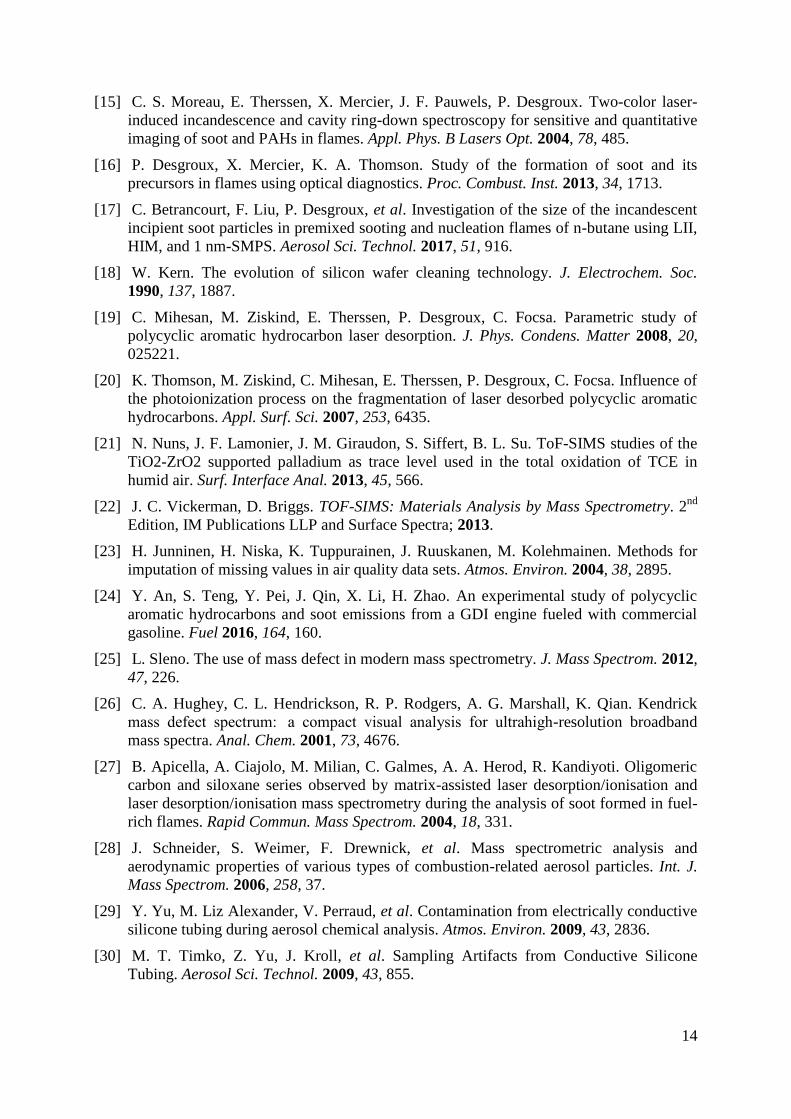
14
[15] C. S. Moreau, E. Therssen, X. Mercier, J. F. Pauwels, P. Desgroux. Two-color laser-
induced incandescence and cavity ring-down spectroscopy for sensitive and quantitative
imaging of soot and PAHs in flames. Appl. Phys. B Lasers Opt. 2004, 78, 485.
[16] P. Desgroux, X. Mercier, K. A. Thomson. Study of the formation of soot and its
precursors in flames using optical diagnostics. Proc. Combust. Inst. 2013, 34, 1713.
[17] C. Betrancourt, F. Liu, P. Desgroux, et al. Investigation of the size of the incandescent
incipient soot particles in premixed sooting and nucleation flames of n-butane using LII,
HIM, and 1 nm-SMPS. Aerosol Sci. Technol. 2017, 51, 916.
[18] W. Kern. The evolution of silicon wafer cleaning technology. J. Electrochem. Soc.
1990, 137, 1887.
[19] C. Mihesan, M. Ziskind, E. Therssen, P. Desgroux, C. Focsa. Parametric study of
polycyclic aromatic hydrocarbon laser desorption. J. Phys. Condens. Matter 2008, 20,
025221.
[20] K. Thomson, M. Ziskind, C. Mihesan, E. Therssen, P. Desgroux, C. Focsa. Influence of
the photoionization process on the fragmentation of laser desorbed polycyclic aromatic
hydrocarbons. Appl. Surf. Sci. 2007, 253, 6435.
[21] N. Nuns, J. F. Lamonier, J. M. Giraudon, S. Siffert, B. L. Su. ToF-SIMS studies of the
TiO2-ZrO2 supported palladium as trace level used in the total oxidation of TCE in
humid air. Surf. Interface Anal. 2013, 45, 566.
[22] J. C. Vickerman, D. Briggs. TOF-SIMS: Materials Analysis by Mass Spectrometry. 2nd
Edition, IM Publications LLP and Surface Spectra; 2013.
[23] H. Junninen, H. Niska, K. Tuppurainen, J. Ruuskanen, M. Kolehmainen. Methods for
imputation of missing values in air quality data sets. Atmos. Environ. 2004, 38, 2895.
[24] Y. An, S. Teng, Y. Pei, J. Qin, X. Li, H. Zhao. An experimental study of polycyclic
aromatic hydrocarbons and soot emissions from a GDI engine fueled with commercial
gasoline. Fuel 2016, 164, 160.
[25] L. Sleno. The use of mass defect in modern mass spectrometry. J. Mass Spectrom. 2012,
47, 226.
[26] C. A. Hughey, C. L. Hendrickson, R. P. Rodgers, A. G. Marshall, K. Qian. Kendrick
mass defect spectrum: a compact visual analysis for ultrahigh-resolution broadband
mass spectra. Anal. Chem. 2001, 73, 4676.
[27] B. Apicella, A. Ciajolo, M. Milian, C. Galmes, A. A. Herod, R. Kandiyoti. Oligomeric
carbon and siloxane series observed by matrix-assisted laser desorption/ionisation and
laser desorption/ionisation mass spectrometry during the analysis of soot formed in fuel-
rich flames. Rapid Commun. Mass Spectrom. 2004, 18, 331.
[28] J. Schneider, S. Weimer, F. Drewnick, et al. Mass spectrometric analysis and
aerodynamic properties of various types of combustion-related aerosol particles. Int. J.
Mass Spectrom. 2006, 258, 37.
[29] Y. Yu, M. Liz Alexander, V. Perraud, et al. Contamination from electrically conductive
silicone tubing during aerosol chemical analysis. Atmos. Environ. 2009, 43, 2836.
[30] M. T. Timko, Z. Yu, J. Kroll, et al. Sampling Artifacts from Conductive Silicone
Tubing. Aerosol Sci. Technol. 2009, 43, 855.

15
[31] A. Faccinetto, P. Desgroux, M. Ziskind, E. Therssen, C. Focsa. High-sensitivity
detection of polycyclic aromatic hydrocarbons adsorbed onto soot particles using laser
desorption/laser ionization/time-of-flight mass spectrometry: An approach to studying
the soot inception process in low-pressure flames. Combust. Flame 2011, 158, 227.
[32] P. Desgroux, A. Faccinetto, X. Mercier, T. Mouton, D. Aubagnac Karkar, A. El Bakali.
Comparative study of the soot formation process in a nucleation and a sooting low
pressure premixed methane flame. Combust. Flame 2017, 184, 153.
[33] H. Bladh, N.-E. Olofsson, T. Mouton, et al. Probing the smallest soot particles in low-
sooting premixed flames using laser-induced incandescence. Proc. Combust. Inst. 2015,
35, 1843.
[34] B. Apicella, A. Carpentieri, M. Alfè, et al. Mass spectrometric analysis of large PAH in
a fuel-rich ethylene flame. Proc. Combust. Inst. 2007, 31 I, 547.
[35] K. H. Homann. Fullerenes and soot formation - New pathways to large particles in
flames. Angew. Chem. Int. Ed. Engl. 1998, 37, 2435.
[36] S. E. Stein, a. Fahr. High-temperature stabilities of hydrocarbons. J. Phys. Chem. 1985,
89, 3714.
[37] B. J. Tyler, S. Dambach, S. Galla, R. E. Peterson, H. F. Arlinghaus. Investigation of the
utility of laser-secondary neutral mass spectrometry for the detection of polyaromatic
hydrocarbons in individual atmospheric aerosol particles. Anal. Chem. 2012, 84, 76.
[38] T. Stephan, E. K. Jessberger, C. H. Heiss, D. Rost. TOF-SIMS analysis of polycyclic
aromatic hydrocarbons in Allan Hills 84001. Meteorit. Planet. Sci. 2003, 38, 109.
[39] S. P. Ekern, A. G. Marshall, J. Szczepanski, M. Vala. Photon-induced Complete
Dehydrogenation of Putative Interstellar Polycyclic Aromatic Hydrocarbon Cations:
Coronene and Naphtho[2,3-[CLC]a[/CLC]]pyrene. Astrophys. J. 1997, 488, L39.
[40] F. Mühlberger, R. Zimmermann, A. Kettrup. A Mobile Mass Spectrometer for
Comprehensive On-Line Analysis of Trace and Bulk Components of Complex Gas
Mixtures: Parallel Application of Laser-Based Ionization Methods VUV-Single-Photon
Ionization, Resonant Multiphoton Ionization, and Laser-Induced Electron Impact
Ionization. Anal. Chem. 2001, 73, 3590.
[41] O. P. Haefliger, R. Zenobi. Laser mass spectrometric analysis of polycyclic aromatic
hydrocarbons with wide wavelength range laser multiphoton ionization spectroscopy.
Anal. Chem. 1998, 70, 2660.
[42] Y. Kato, T. Wakabayashi, T. Momose. A mass spectroscopic study of laser vaporized
graphite in H2 and D2 gases: The stability of C2nH2 (n=2-5) and C10. Chem. Phys. Lett.
2004, 386, 279.
[43] J. P. Cain, J. Camacho, D. J. Phares, H. Wang, A. Laskin. Evidence of aliphatics in
nascent soot particles in premixed ethylene flames. Proc. Combust. Inst. 2011, 33, 533.
[44] B. Öktem, M. P. Tolocka, B. Zhao, H. Wang, M. V. Johnston. Chemical species
associated with the early stage of soot growth in a laminar premixed ethylene–oxygen–
argon flame. Combust. Flame 2005, 142, 364.

16
Mr / u Assignment Mr / u Assignment Mr / u Assignment
27.977 Si+ 86.972 Si2CH3O+ 191.002 Si3C4H11O3
+
28.985 SiH+ 100.988 Si2C2H5O+ 191.038 Si3C5H15O2
+
29.993 SiH2+ 101.996 Si2C2H6O
+ 205.054 Si3C6H17O2+
31.000 SiH3+ 102.967 Si2CH3O2
+ 206.025 Si3C5H14O3+
40.985 SiCH+ 103.004 Si2C2H7O2+ 207.033 Si3C5H15O3
+
41.993 SiCH2+ 115.004 Si2C3H7O2
+ 209.049 Si3C5H17O3+
43.000 SiCH3+ 117.019 Si2C3H9O2
+ 221.049 Si3C6H17O3+
43.972 SiO+ 131.035 Si2C4H11O+ 221.085 Si3C7H21O2
+
44.980 SiOH+ 132.006 Si2C3H8O2+ 265.020 Si4C6H17O4
+
57.016 SiC2H5+ 133.014 Si2C3H9O2
+ 265.057 Si4C7H21O3+
57.987 SiCH2O+ 133.050 Si2C4H13O2
+ 266.028 Si4C6H18O4+
58.995 SiCH3O+ 147.03 Si2C4H11O2
+ 267.036 Si4C6H19O4+
61.011 SiCH5O+ 147.066 Si2C5H15O2
+ 267.072 Si4C7H23O3+
71.949 Si2O+ 159.012 Si3C4H11O
+ 279.072 Si4C8H23O3+
72.957 Si2HO+ 160.991 Si3C3H9O2+ 281.052 Si4C7H21O4
+
73.011 SiC2H5O+ 175.007 Si3C4H11O2
+ 323.008 Si5C7H19O5+
74.055 SiC3H10+ 176.986 Si3C3H9O3
+ 324.987 Si5C6H17O6+
75.027 SiC2H7O+ 189.022 Si3C5H13O2
+ 355.070 Si5C9H27O5+
Table 1. Identified masses, up to m/z = 355, of polysiloxane fragment ions and assigned molecular formulae.

17
Figure 1. (a) Investigated flame (DIF-S) surrounded by a shielding quartz windowed chimney. During the soot
sampling procedure one of the windows is removed for the sampling probe insertion. (b) Overview of the
experimental setup used for soot and condensable gas sampling (A) from laboratory diffusion flames. The quartz
probe (B) consists of two concentric tubes through which the sampling flow is stabilized. The dilution nitrogen
enters the top port, flows between the two quartz tubes up to the probe tip, mixes with the sample flow from the
flame and it is removed through a bypass system (C) and impactor (D). The pressure in the line is kept constant
using a PID controller and a preliminary vacuum pump (E).

18
Figure 2. Comparison of mass spectra at m/z = 476-478 obtained from deposits on glass microfiber filter (dark
blue line) and Si wafer (red line). The colored areas below the curves are the Gaussian fits of the deconvoluted
peaks.

19
Figure 3. Example of comparative analysis for the identification of unknown compounds. The figure shows
m/z = 61 in the mass spectra obtained from sampling flame DIF-S, 65 mm HAB, deposition on silicon (solid
line) and titanium (dashed line) wafers. The only strong peak occurring in both mass spectra is the one attributed
to fragment ion C5H+. Notice that after normalization by the partial ion count calculated on the peak list, the
intensity of the peak C5H+ in the two mass spectra are similar so that no further data manipulation is required.
20
Figure 4. Soot and condensable gas deposition obtained by impaction on wafer (a), and image obtained with the
ToF-SIMS integrated optical microscope (b) corresponding to the region delimited with a red square in (a). Mass
spectra obtained from the analysis of the soot deposit ROI (c) and of the condensable gas ROI. Each mass
spectrum is obtained from the average of the data collected from 3 different regions.

21
Figure 5. Mass defect plots of soot samples obtained from (a) the soot deposit ROI and (b) the condensable gas
ROI. The size of the data points is proportional to the area of the peak normalized to the total ion counts
calculated on the selected peak list.

22
Figure 6. Mass spectra obtained with (a) SIMS in positive polarity and (b) L2MS. The SIMS mass spectrum is
obtained from soot deposit on wafer while the L2MS mass spectrum corresponds to soot and condensable gas
phase deposited over glass microfiber filter. The L2MS mass spectrum is obtained by irradiating the sample
surface with 12.5 mJ cm-2
at 266 nm desorption wavelength, and at a delayed time the expansion plume is
ionized by a second ionization wavelength at 26.3 mJ cm-2
.