a computational investigation of icing effects on an s
TRANSCRIPT

©Freund Publishing House Ltd. International Journal of Turbo and Jet Engines, 27 ,277-294 (2010)
A Computational Investigation of Icing effects on an S-Duct Inlet
W o n j i n J in ' , Ray R. T a g h a v i 2 and Saeed Farokhi 3
'Advanced Aerodynamics & Structure Department, Korea Aerospace Research Institute, Daejeon, South Korea
2'3Aerospace Engineering Department, The University of Kansas, Lawrence, KS 66045, USA
Abstract
The effects of a typical glaze ice accretion shape on the performance of the M2129 S-duct inlet are computationally investigated for a range of flight Mach numbers. A Reynolds-Averaged Navier-Stokes (RANS) code with k-o> turbulence model is used to simulate the compressible viscous flow in the S-duct inlet. The glaze ice accretion on the cowl lip is modeled on a steady-state basis f rom N A S A LEWICE3D code. The results show that the total pressure recovery is reduced and the compressor face distortion level is increased with flight Mach number. A reduction of 22 .8% in total pressure recovery is calculated for a flight Mach number of 0.85 in fully-developed glazed ice condition. The massive flow separations in the inlet induced by the glaze ice horn shapes also create a mass flow reduction in the inlet between 27 and 33% as compared to clean inlet for flight Mach numbers of 0.13 and 0.475, respectively. The combined effects of reduced total pressure recovery and the reduced mass flow rate results in a reduction of engine thrust between ~30 and 6 0 % from low speed flight to Mach 0.85.
Nomenclature
A Area (m2) a Semi-major axis of ellipse (m)
b Semi-minor axis of ellipse (m)
D Diameter (m) DP Total pressure distortion parameter (~)
F„ Thrust (kN) L Length (m) LWC Liquid water contents (g/m3) MVD Mean volume diameter (mm) Μ Mach number (~)
Ρ Pressure (kPa) R Radius (m) SFC Specific fuel consumption (g/kN s) Τ Temperature (°C) V Velocity (m/s)
'Senior Researcher, Professor
y+ Non-dimensional wall distance (~)
Χ, Υ, Ζ Cartesian coordinates (~) Greek Symbols α Inlet angle of attack (deg.) β Inlet sideslip angle (deg.)
θ Circumferential angle (deg.) ρ Density (g/m3) Subscripts cl Centerline ef Engine face max Maximum min Minimum
s Static se Secondary flow t Total th Inlet throat oo Free-stream
Superscript Area-averaged
277 Brought to you by | provisional account
UnauthenticatedDownload Date | 11/18/15 4:55 PM

278
1. Introduction
Ice accretes on the surfaces of the aircraft flying through clouds made of super-cooled water droplets. Ice accretions not only on the wings, but also on the engine inlets and tails can seriously impact aircraft operation. A total of 803 aviation accidents and incidents from 1975 to 1988 were caused by in-flight icing problems / l / . Therefore, detailed experimental and numerical studies have been carried out to investigate the icing effects on the performance of airfoils and wings 121-161. Another aspect of ice accretion is its time dependency. Shin, et. al. Ill investigated the effect of ice accretion shape as a function of time on airfoil aerodynamic performance. The time constant for ice accretion is usually measured in seconds/minutes and thus our analysis is based on the steady-state calculation of the fully-developed ice shapes on an aircraft inlet. In addition, icing studies have been mainly performed on airfoils and wings with less attention paid to the icing effects on the performance of the aircraft inlets for gas turbine engines, although the effects are equally hazardous to aircraft engines. In particular, the ice accretion on the aircraft inlet lip alters the shape of the inlet lip and cause significant degradation of the performance of an engine inlet.
Acker, et al./8/ first conducted a flight test to investigate icing effects on a turbojet engine and they found ice accretion on the engine inlet resulted in reduction of engine thrust ranging from 9 to 26 percent, and the combined efficiency of the compressor and inlet diffuser were of approximately the same order of magnitude as the thrust losses. Also, Gelder, et al. 19/ studied total pressure distortion and recovery of a full scale unheated supersonic nose inlet in the subsonic icing conditions. Their study showed that in the icing condition of LWC=1.3 g/m3 with MVD=16mm, and in test condition of M„o=0.27, total pressure distortion increased from about 6 percent in clear air to 12.5 percent after 2 minutes. Concurrently, total pressure recovery decreased from about 98 to 94.5 percent. An experimental method was developed by
Papadakis, et al. /10/ to determine the water droplet impingement characteristics on 2- and 3-dimensional bodies, including an axisymmetrical aircraft inlet. Bidwell, et al. /11/ calculated the impingement efficiencies and ice shapes for an axisymmetric inlet by using the LEWICE3D/12/ ice accretion program. In their work, a typical rime and glaze ice shape on the axisymmetrical inlet lip were numerically defined in the icing conditions; Vm=25 m/s: LWC= 0.2 g/m3: TsM= -29.9°C (243.3K) and V„=25 m/s: LWC= 0.695 g/m3: Ts„o=-9.3°C (263,9K), respectively /11/.
The M2129 S-duct inlet is characterized by two curvatures with a diffusing shape. The air intake system of aircraft gas-turbine engines, in buried configuration, frequently uses the S-shaped inlet due to its advantages in the installation. However, it is known that a simple S-curved duct induces a secondary flow pattern that may cause the flow separation at the first bend, and the secondary flow is further amplified in the second bend of the S-duct. In addition, a diffusing duct has an additional burden of potential flow separation due to the streamwise adverse pressure gradient in the diffuser. Therefore, for the M2129 S-duct inlet, the secondary flow pattern and flow separation contribute to the problem of total pressure loss and inlet distortion. Distortion represents non-uniformity in the flow (see Farokhi /13/), and the most frequently encountered inlet distortion in flight is total pressure distortion, which is caused by separated boundary layers in the inlet. The level of distortion that an inlet creates at the compressor face affects the stability of the compressor and engine performance. Farokhi /] 3/ presents the topic of inlet distortion and its impact on compressor stability margin in the context of aircraft jet engines in his recent book.
Moreover, if ice accretes on the lip portion, the efficiency of the S-duct inlet would be substantially affected since the shape of an inlet lip has a direct influence on the quality of the inlet flow. For instance, a sharp inlet lip at the ice-free condition induced higher total pressure loss at the engine face, as compared to a blunt (ellipse) inlet lip, due to lip
Brought to you by | provisional accountUnauthenticated
Download Date | 11/18/15 4:55 PM

279
separation /14/. Typically, the ice shapes on the leading edge of wings or inlet lips are categorized into rime and glaze ice, and the examples are shown in Figure 1 /15/.
(b) Glaze Fig. 1: Example of two dominant forms of leading
edge icing shapes/15/.
The effects of the rime ice accretion, which had a more streamlined shape, on the flow field and performance of the M2129 S-duct inlet were almost negligible /16/. However, a more significant total pressure distortion at the engine face and a more substantial degradation in the inlet performance occurred with the glaze ice shape due to the stronger flow separation from its ice horn. As noted earlier, a diffusing S-duct has an additional disadvantage of flow separation due to streamwise adverse pressure gradient in the diffuser. Therefore, the combined
flow separations which were caused by both the inlet icing and inlet-duct geometry contributed to a more serious distortion problem at the engine face at the relatively low-flight Mach number, Mm=0.23 /16/. Furthermore, it is known that the engine face distortion is highly dependent on flight or throat Mach numbers /17/. In particular, supersonic flows, which involve shock formations and shock-boundary layer interactions, can occur in a diffusing S-duct inlet at high-subsonic flight Mach numbers due to the flow acceleration through inlet blockage due to icing and curvatures. Therefore, coupled effects of fully-developed inlet icing and high-subsonic flight Mach numbers on the performance of the M2129 S-duct inlet were computationally investigated in this study. The free-stream Mach number range from M^O.13 to 0.85, was tested, and the corresponding changes in the free-stream temperatures, Ts00=265.7K to 233K, were considered for the computations. The Reynolds numbers ranged from Re=1.74xl05 to 5.1 χ 106, based on the throat diameter of the clean inlet.
Only fully-developed glaze ice shape which produces more severe effects on the duct flow was considered in the present study, and the glaze ice shape was assumed to be symmetrical in the circumferential direction of the inlet lip. In the practical icing conditions, the shape and size of ice accretion are a function of free-stream velocity as demonstrated in numerical studies /11/ and experimental icing tests /18/. However, a constant shape and size were assumed (for a single-phase flow) in this investigation to study the changes in inlet flow pattern caused by a fully-developed inlet icing shape at different free-stream Mach numbers.
2. Numerical methodology
The M2129 S-duct inlet consists of a diffusing S-bend and two constant-area parts with circular-cross sections, as shown in Figure 2. The geometry of the inlet was taken from /19/ and /20/. The centerline of the S-bend part is defined by Eq. (1):
Brought to you by | provisional accountUnauthenticated
Download Date | 11/18/15 4:55 PM

280
Z c l = - A Z d [ l - c o s ^ X c l / L ) ] ( 1 )
Constant Area
0.3415 Inflow i j . _
λ Inlet lip
Bot tom of First bend
Throat
Dif fus ing S-bend
2.39
Unit: in
Constant Area
0.404
Engine Face
(a) M2129 S-duct inlet
External inlet lip
Internal Inlet lip
- 0.056
0.2234
0.077
Unit: in
(b) Inlet lip Fig. 2 : Geomet ry and dimension of M2129 S-duct inlet and inlet lip.
and the radii of circular-cross sect ions of the S-bend, measured perpendicular to the inlet centerline, are
described by Eq. (2):
ί R - R . h Ί (
Χ-Ί 4 /
x - 1 3
ί R - R . h Ί = 3 1 - Χ-Ί - 4 1 x - 1 + 1 L J V L J
(2)
Brought to you by | provisional accountUnauthenticated
Download Date | 11/18/15 4:55 PM

281
Note that the entrance and outlet of the inlet are defined by throat and engine face, respectively, as shown in Figure 2. The constant-area parts extend from the S-bend to the throat and engine face by 2 Dth and 1 Dth, respectively. In addition, the area ratio of the engine face to throat is approximately 1.4, and the total inlet length is about 7 D^. In the current study, however, the inlet size was set according to the diameter of an axisymmetric inlet in /10/. The geometry and size of the inlet lip were also defined based on /10/. The shape of the inlet lip is elliptical and the ellipse ratio of the external and internal lip is a/b= 4.0 and 2.5, respectively.
The glaze ice shape investigated in this study was based on the Bidwell 's / I I / 2-dimensional ice shape on an axisymmetric inlet lip which was numerically predicted by LEWICE3D code as shown in Figure 3.
Fig. 4: Mesh generation for the glaze-iced inlet lip
observations focused on the effect of fully-developed ice geometry, in particular glaze ice horn. In addition, as shown in Figure 4, the rear part in the upper-glaze ice horn, which forms on the outside of the inlet lip and exerts no influence on the duct internal flow, was further simplified. Figure 5 shows the 3-dimensional modeling and mesh generation for the clean and glaze-iced inlet lip.
Fig. 3: Numerically-predicted glaze ice shape / l l / by LEWICE3D
The icing condition was based on zero inlet flow angularity, i.e., α=β=0 ο , M ^ O . 2 3 , V„o=75 m/s, TsM=263.9 K, LWC=0.695 g/m3, MVD=20.36 mm, and icing time=30 min. /11/. For the present study, the Bidwell 's ice shape was reconstructed on the inlet lip of the M2129 S-duct inlet using the GAMBIT 2.2.30 software /21/ as shown in Figure 4. Here, a relatively rough surface of real glaze ice was assumed to be smooth, therefore, an additional roughness effect was not considered; the
(a) Clean inlet lip
(b) Glaze-iced inlet lip
Fig. 5: Three-dimensional modeling and mesh generation
Brought to you by | provisional accountUnauthenticated
Download Date | 11/18/15 4:55 PM

282
Note that the 3-dimensional mode l ing of the glaze
ice was achieved by extending the two-dimens ional
ice shape in the c i rcumferent ia l direction of the inlet
lip as indicated in Figure 5(b); therefore , the glaze
ice shape is assumed to be ci rcumferent ia l ly
symmetrical. Also, note that the inlet frontal area is decreased by 21 percent by the s imulated glaze ice.
The circumferential or az imuthal angle (Θ) for the
M2129 S-duct inlet is def ined in F igure 6. Using
this definit ion, the stations with the concave and
convex corner of the first bend are denoted by top
(θ=0°) and bottom (θ=180°), respect ively.
θ = 0'
Fig. 6: Definition of c i rcumferent ia l angle (Θ)
All computat ional s imulat ions in this s tudy were
carried out using a commerc ia l C F D code, STAR-
CCM+ 2.10.013 1221. The far-field (free-stream) boundary condition was used for all the outer
boundaries to simulate the f ree-s t ream condition at
infinity. In particular, the far-f ield boundaries that
encompass the inlet lip region were radially
extended by - 2 0 D th into x-, y-, and z-direction
upstream to prevent boundary e f fec ts on the
simulation regions of interest, as shown in Figure 7.
Fig. 7: Extension of a far-f i led boundary
Also, the inner and outer surfaces of the duct,
and the cowl surface, including the iced lip region,
were def ined by the adiabatic wall boundary
condition, and no convective/conductive/radiative wall heat transfer was thus considered. In addition, the cross-sectional s tat ions inside the duct, including
the engine face station, were defined to see the icing
effects on the internal f low field and inlet
performance. Figure 8 s h o w s the mesh generat ions
for the outer and inner boundar ies around the S-duct
inlet. Using the G A M B I T sof tware , the structured
meshes for the iced inlet lip, S-duct with inner
regions, and far-field boundary were generated for a
total of 66 volumes.
Fig. 8: Mesh genera t ions for outer and inner
boundaries of M 2 1 2 9 S-duct inlet (clean
inlet)
Also, the mesh densi ty after the glaze ice was
increased to properly capture the expected flow
separation f rom the glaze ice horn, as shown in
Figure 4. The number of mesh nodes in the duct
section was 2 3 0 x 1 6 0 x 1 0 0 in the streamwise,
c ircumferent ial , and radial direction respectively for
the clean and ice cases. T h e total numbers of mesh
cells for all parts including the inlet lip and the far-
field region were approximate ly 3.7 and 5.2 million
for the clean and glaze iced inlets, respectively.
Note that those cell number s were f ixed over the
range of the f ree-s t ream Mach number . Also, the
mesh resolution in the near-wall region of turbulent
boundary layers, represented by y+ , is a critical issue
in the computat ional s imulat ions of turbulent f lows
that employ wall funct ion in turbulence modeling.
Brought to you by | provisional accountUnauthenticated
Download Date | 11/18/15 4:55 PM

283
In particular, a study on the mesh resolution showed that the accurate prediction of the flow separation and distortion in the M2129 S-duct inlet depended on the proper choice of y+1211. Therefore, the a II y wall treatment option in STAR-CCM+ was chosen to have reasonable results in the turbulent boundary layers at different free-stream Mach numbers. By applying the wall treatment, the limitation of meshes with low and high y+ can be improved, and a more accurate turbulence modeling can be formulated in the near wall region of the iced inlet lip and duct.
Using a variety of turbulence models, a validation study with experimental data /24/ was also carried out. Although many turbulence models produced reasonable results, the Shear Stress Transport (SST) k-ω model 1251 showed the best performance for the baseline S-duct inlet. The use of the SST k-ω turbulence modeling in S-shape diffusers with vortex separation and compressible flow in transonic diffusers is also supported by other researchers /26-28/. The coupled-implicit solver for the steady-state condition was utilized for the flow simulations, and the second-order upwind scheme was applied for the spatial discretization. Also, the density change option using the ideal gas law was chosen during the computations since compressible-viscous flow effects were expected due to the flow acceleration inside the S-duct at the higher free-stream Mach numbers.
The ambient pressure at sea level was imposed on the far-field boundary condition as the free-steam total pressure, ptoo=101,125.4 Pa. According to the studied Mach numbers; M ^ O . 1 3 to 0.85, the free-stream static pressure range: p„=99,942.2 Pa to 63,051.7 Pa and temperature range: Ts00=265.7 Κ to 233 K, based on the glaze-icing temperature (Ts„=263.9K at Mm=0.23) by Bidwell, et al. / I I / were applied to the far-field boundary condition. Other physical properties of air, such as viscosity and air-thermal conductivity, were also defined according to the icing condition in /11/.
All simulations were performed on the computing cluster at the Information and Telecommunication Technology Center (ITTC) at
the University of Kansas. For the parallel computations, each simulation case was distributed among eight to twenty processors according to the mesh sizes. Each node has two Intel® Xeon" EM64T processors at 3.2 GHz and 4,096 MB of RAM. The simulations were run and monitored until the residuals for continuity equation, x, y, z-velocity, energy equation, and turbulence factors dropped below 10"4 to I0"5 where the value of the area-averaged total pressure at the engine face changed by less than 0.5 percent between runs.
3. Validation of Numerical Solutions
The validation of the numerical solutions by STAR-CCM+ was conducted for the baseline M2129 S-duct inlet. From the investigation by AG ARD Working Group 13 /24/, the experimental measurement data for the performance of an M2129 inlet, generally represented by total pressure recovery, were available for the baseline configuration only; however, no validation data has been found for the icing cases. Also, the computational data for the baseline M2129 inlet using WIND-US code from 1291 were provided for the comparison. For this validation, the size of the duct inlet was set based on the geometrical data from /24/ and /29/. According to the modeling approach for the baseline M2129 inlet in /29/, only half of the geometry was meshed due to the symmetry across the mid plane with the reflecting boundary condition, and the inlet lip and far-field region were not considered. Consequently, the pressure-inlet and pressure-outlet boundary condition was applied to the computational domain, and the static pressure at the engine face was varied to obtain the throat Mach number range, M th=0.1 to 0.77. The main features of computational setup, including the mesh size and turbulence model, for STAR-CCM+ and WIND-US are listed in Table 1.
As shown in Figure 9, the total pressure recovery result by STAR-CCM+ is compared to the experimental data and WIND-US result. The totai
Brought to you by | provisional accountUnauthenticated
Download Date | 11/18/15 4:55 PM

284
Table 1 Computational setups for STAR-CCM+ and WIND-US /27/
Code Ice Inlet lip Mesh type Meshe d Part
Mesh size (Total cell
No.)
Boundary condition
Turbulent model
STAR-CCM+ WIND
-US 1211
No No
(baseline -inet)
Structured
Unstructure d
180,000 Half
Plane 830,000
Pressure inlet-
Pressure outlet
SST *-ω
Spalart-Allmaras
Fig. 9: Total pressure recovery ( p l e f /pt00) in the baseline M2129 S-duct inlet
pressure recovery, the area-averaged total pressure at
the engine face normalized to the free-stream total
pressure ( p t e f /p100), measures the extent of
reversibly-decelerated free-stream flow into an engine compressor, and is the important factor for evaluating the inlet operational efficiency. Furthermore, the total pressure loss in an S-shaped inlet is primarily caused by the flow separation at the first bend and subsequent turbulent mixing downstream. Also, Figure 9 indicates that total pressure recovery decreases as the throat Mach number increases, as expected. The enhanced flow separation and turbulent mixing with the higher-speed duct flow are represented by the lower-total
pressure recovery and higher-engine face distortion. In Figure 9 it can be seen that STAR-CCM+ accurately predicts the experimental measurements, showing a similar variation and level of total pressure recovery with increasing throat Mach number. In particular, a relatively good agreement is obtained by STAR-CCM+ near M th=0.8, where the strong flow separation and mixing are expected: the STAR-CCM+ total pressure recovery result is 0.958 for M th=0.77, while the experimental result is about 0.96 for M,h=0.78 /24/. Also, compared to the WIND-US data, STAR-CCM+ produces a well-matched characteristic of total pressure recovery, although the mesh generation and turbulence
Brought to you by | provisional accountUnauthenticated
Download Date | 11/18/15 4:55 PM

285
modeling for both codes are different . As noted in
Table 1, the structured mesh with the SST k-ω
model and the unstructured mesh with the one-
equation turbulence model of Spalar t -Almaras were
utilized in S T A R - C C M + and W I N D - U S code,
respectively. In addition, the d i f ference in mesh
sizes for both codes (0.18 vs. 0.83 mill ion) is
expected to induce a minor discrepancy in the
simulations of the inlet pe r fo rmance . The total
pressure recovery by W I N D - U S is 0 .957 at M t h=0.78
1291.
The performance of S T A R - C C M + and the ef fec t
of mesh size for the iced inlet cases were also
evaluated. Again, the exper imental data for iced S-
duct inlets are not available; therefore , the validity of
S T A R - C C M + for the glaze-iced M 2 1 2 9 inlet was
assessed through two mesh densi t ies and a
comparison with another C F D code, F L U E N T /30/.
Both the clean and glaze-iced inlets were tested, and
the inlet lip and far-field region were included to the
meshes in order to s imulate the ice on the inlet lip.
The inlet size and the inlet-lip shape were taken
from /10/. Based on the glaze cases, the total cell
number of the coarse mesh was about 15 percent of
that of the f ine mesh, since the mesh covered only
half the geomet ry accord ing to the symmet ry plane
with fewer nodal number s as shown in Table 2.
S T A R - C C M + solved the f ine mesh cases, while
F L U E N T was dedicated for the coarse-mesh cases,
using the same turbulence model ing, the SST k-ω.
Other computa t ional parameters , such as boundary
condit ions and solver choice, were set up as listed in
the previous section.
Table 2 Mesh generat ion for S T A R - C C M + and F L U E N T (*Streamvfrdse * c i rcumferent ia l χ radial direct ion).
Total cell
Case
Clea Coars η
e Glaz e
Fine
Clea η
Glaz e
Code
F L U E N T
S T A R -C C M +
Inlet lip Mesh type
Yes ( Including Far-field region)
Structure d
Meshed part
Whole
Mesh nodal No . (Duct only)
Half plane 140x40 (half ) χ 7 0 *
2 3 0 x 1 6 0 (whole)x 100*
No. ( Including Far-field region)
651 ,200
771 ,200
3 ,722,300
5 ,194,300
Table 3 Total pressure recovery by two mesh density levels
Clean Glaze
Coarse Fine Coarse Fine
0.13 0 .996 0.998 0 .985 0 .985
0.25 0.989 0.992 0 .949 0 .949
0.34 0 .977 0.978 0 .907 0 .910
0.475 0 .940 0 .947 0 .836 0 .836
0.65 0.845 0.843 0.725 0 .719
0.85 0.791 0.789 0 .619 0 .610
Brought to you by | provisional accountUnauthenticated
Download Date | 11/18/15 4:55 PM

286
Table 3 shows the effect of mesh density in terms of total pressure recovery for the free-stream Mach number range, M«=0.13 to 0.85. We first note that the total pressure recoveries generated from the two mesh density levels are in relatively good agreement for both the clean and glaze cases up to MCO=0.85, and the deviation caused by different computational dissipations between STAR-CCM+ and FLUENT seems to be insignificant. The glaze-iced inlet was assumed to be more susceptible to the mesh density due to the anticipated flow separation from the ice formation on the inlet lip. For the glaze cases, however, the coarse mesh (with FLUENT) yields the deviation of only about 1.5 percent in total pressure recovery at MM=0.85, and this deviation is the maximum throughout all cases and Mach numbers, as indicated in Table 3. Therefore, it can be concluded that STAR-CCM+ is still properly computing the performance of the M2129-S duct inlet under the icing effects, showing a relatively high-mesh independency. Despite the increase in computational efforts, the fine meshes with the whole geometrical modeling were employed for the following computations, as noted in the previous section: about 3.7 and 5.2 million cells for the clean and gaze case, respectively.
4. Results and Discussion
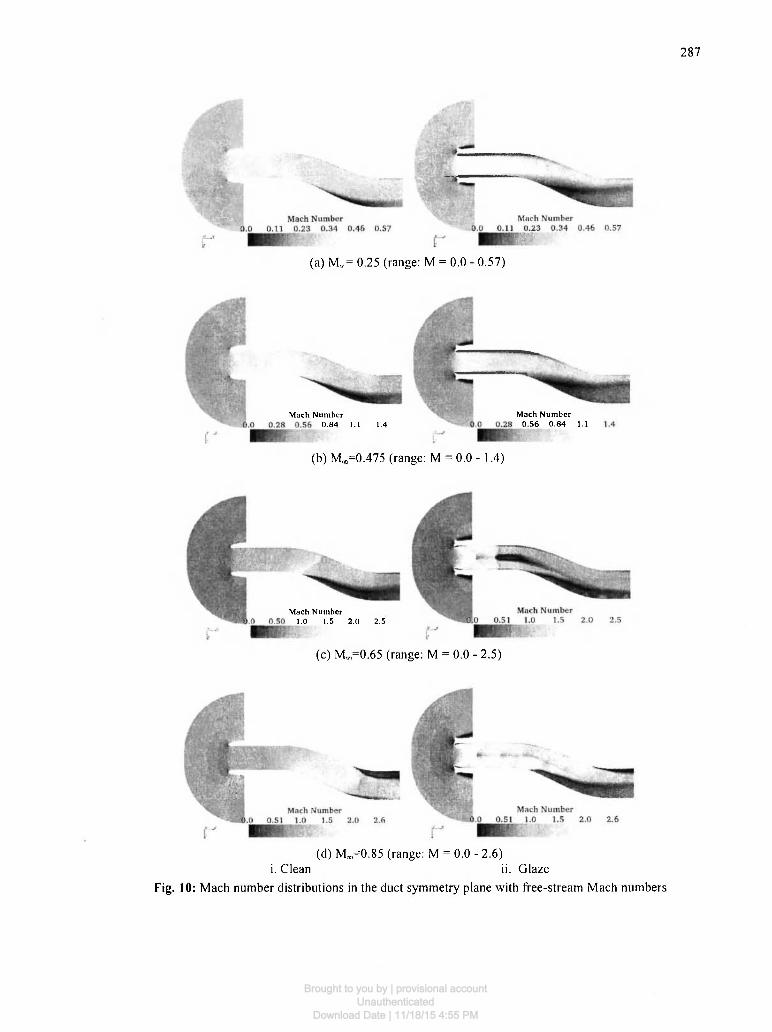
Figure 10 shows the Mach number distribution in the duct symmetry plane for both the clean and glaze ice cases, as the free-stream Mach number increases from M00=0.25 to 0.85. In Figure 10(a) and (b), the clean cases show the flow deceleration and acceleration at the top (0=0°, i.e., concave) and bottom (0=180°, i.e., convex) surfaces, respectively, of the first bend of the S-duct inlet. This typical flow pattern in a clean S-shaped inlet is the result of the curved flow centrifugal pressure gradient at the first bend that induces the inlet flow separation at the bottom side by swirl or the secondary flow /31 /. The inlet flow separates more severely from the first bend at the higher free-stream Mach number as presented in the clean case of Figure 10(b). This is
reasonable since the centrifugal pressure gradient is proportional to the mainstream velocity of the inlet flow /31 /. On the other hand, the flow and boundary layers separate at the glaze ice horn and the flow separation at the first bend becomes more massive as seen in the glaze ice case of Figure 10(a) and (b). A relatively strong pressure gradient over the glaze ice horn causes the duct internal flow to separate, and the flow with lower energy aggravates the flow separation at the first bend of the S-duct inlet. Furthermore, in both clean and glaze ice cases a supercritical flow, where the local Mach number is 1, occurs in the free-stream Mach number range between Moo=0.25 and 0.475. The difference in the local supersonic regions of the clean and glaze ice cases is their location as seen in Figure 10(b). For the clean inlet case, the flow accelerates to a supersonic velocity at the bottom of the first bend which is indicated in Figure 10(b). On the other hand, the glaze ice case shows the supersonic region forming at the inlet throat due to the much diminished-effective throat area by the flow separation from the glaze ice. As the free-stream Mach number increases up to Moo=0.65, the interacting oblique shocks of opposite family and their multiple reflections from the wall are visible in the glaze ice case as shown in Figure 10(c). At M^O.85, the multiple shock cells persist into the first and second bends of the S-duct as presented in Figure 10(d). Moreover, compared to the Moo=0.65 case, the flow separation at the first bend of the glaze case is more intense with a stronger pressure gradient, which is indicated by the comparably lower and higher Mach number region at the top and bottom sides, respectively, of the first bend. In addition, the expected total pressure decrease after the multiple shock cell structure, caused by the glaze ice accretion, is clearly another source of total pressure loss at the engine face. Note that in the clean case at M^O.85, there is no flow separation at the first bend. Instead, the supersonic flow accelerates until the second bend due to its diffusing duct shape, and a flow separation occurs at the top side of the second bend.
Brought to you by | provisional accountUnauthenticated
Download Date | 11/18/15 4:55 PM
287
(a) M „ = 0.25 (range: Μ = 0.0 - 0.57)
(b) Μ,ο=0.475 (range: Μ = 0.0 - 1.4)
Mach Number 0.84 1.1 1.4
Mach Number 0.56 0.84 1.1
(c) M„=0.65 (range: Μ = 0.0 - 2.5)
Mach Number 1.0 1.5 2.0 2.5
(d) M m =0.85 (range: Μ = 0.0 - 2.6) i. Clean ii. Glaze
Fig. 10: Mach number distr ibutions in the duct symmetry plane with f ree-s t ream Mach numbers
Brought to you by | provisional accountUnauthenticated
Download Date | 11/18/15 4:55 PM

288
(a) M„= 0.25 (p t/p t o=0.77 - 1.0, p to=101.1 kPa, and V J V ^ 0.0 - 0.5)
mmm Ä f e f l W γ'
0.32 0.46 0.S9 0.73 0.86 1.0 0. Tangent ia l Velocity Rat io Total P ressure Ratio 0.1 0.2 0.3 0.4 0 .5 0.32 0.46 0.59 0.73 0.86 1.0 0.
Tangent ia l ve loc i ty Ratio 0.1 0.2 0 .3 0 .4 0 .5
mm
(b) M.=0.475 (p,/ptoo=0.32 - 1.0, ptoo=101.1 kPa, and V s e /V„= 0.0 - 0.5)
A - ^
Total P res su re Rat io 0 .10 0 . 2 8 0 .46 0 .64 0 .82 1.0 0.
4 ί ' I 'angential Velocity Ratio 0.1 0.2 0.3 0.4 WS*
dm w
Total Pressure Ratio 0 .5 0 .10 0 .28 0.46 0 .64 0.82 1.0 0 .
T a n g e n t i a l Velocity Ratio
(c) M x = 0.65 (ρ,/ρια>=0.1 - 1.0, ptco=101.1 kPa, and V ^ / V ^ 0.0 - 0.5)
Total P res su re Rat io Tangent ia l Velocity Ratio Total P ressure Ratio Tangen t i a l Velocity Rat io 0 .10 0 .28 0 .46 0 .64 0 .82 1.0 0. 0.1 0 .2 0 .3 0 .4 0 .5 0 .10 0 .28 0 .46 0 .64 0 .82 1.0 0. 0.1 0.2 0 .3 0 . 4 0 .5
(d) Μ„= 0.85 (pt/pt00= 0.1 - 1.0, p tm=101.1 kPa, and VS /VM= 0.0 - 0.5) i. Clean ii. Glaze
Fig. 11: Total pressure contours and the secondary flow fields at the engine face with free-stream Mach numbers.
Brought to you by | provisional accountUnauthenticated
Download Date | 11/18/15 4:55 PM

289
The total pressure ratio (p, /pt00) patterns and the secondary flow fields at the engine face are compared in Figure 11. The secondary flow vectors are given in the form of the vector of the secondary-flow velocity magnitude (Vse) divided by the free-stream velocity (VK) at each Μα,. It is known that the secondary flow in the flow separation at the first bend of the clean S-duct inlet is further amplified, azimuthally rotates through the second bend, and affects the overall flow quality at the engine face in terms of inlet distortion, even though the impact on the engine performance could be insignificant. The typical secondary flow pattern at the engine face of the clean inlet shown in Figure 11(a) is characterized by a pair of counter-rotating vortices. The region of intense secondary flow with swirl that has caused flow separation is also represented by the total pressure loss region on the lower part of the duct, as shown in the same figure. Furthermore we note that the size and intensity of the counter-rotating vortex pattern, as well as the region of total pressure loss, increases with increasing free-stream Mach number for the clean cases, as shown in Figure 11(a) to (c). However we notice a significant change in secondary flow pattern at Μ„=0.85, exhibiting the migration of the counter-rotating vortex pair towards the top of the duct. The
reason behind this migration is seen in Figure 10. At Mach 0.65, an oblique shock is formed at the first bend, with a shock-induced separation that is on the lower part of the duct (see Figure 10 (c)). For Mach 0.85, the shock structure is pushed further ait and is in the second bend with shock-induced flow separation on the upper part of the duct. For the glaze ice cases, the size and intensity of the swirling flow pattern becomes larger due to stronger shock formations. A nearly-periodic shock cell structure is formed at freestream Mach numbers of 0.65 and 0.85 (see Figure 10 (c) and (d)) that are created at the throat and are stretched along the duct axis and cause flow separation on the lower wall. As a result, a complex secondary flow pattern is created that involves the formation of two pairs of counter-rotating vortices at the engine face with a potential of causing compressor stall. In general we observe that inlet icing impacts the core flow as well as the near wall region of the inlet duct. The core experiences oblique shock formation (of opposite family), interaction and reflection of those shocks with the wall boundary layer creates massive regions of separated flows and thus engine face distortion. These effects are magnified with increasing free stream Mach number, as expected.
» 1 Φ > Ο υ Φ Od φ 3 w </) φ k. Ο-ίο Ο
1
0.95
0.9
0.85
0.8
0.75
0.7
0.65
° · δ ι
—o— Clean
— G l a z e
—o— Clean
— G l a z e
—o— Clean
— G l a z e
0.2 0.3 0.4 0.5 0.6 0.7 0.8 Free-stream Mach Number, ~
0.9
Fig. 12: Variation of total pressure recovery (Pt fr/PtM) with free-stream Mach numbers (Pt»=T01.1 kPa)
Brought to you by | provisional accountUnauthenticated
Download Date | 11/18/15 4:55 PM

290
Figure 12 shows mean (i.e., a rea-averaged) total
pressure recoveries ( p t e f / p t « ) at the engine face in
the Mach numbers range of M „ = 0 . 1 3 to 0.85.
Reduction in the total p ressure recovery of both the
clean and glaze iced inlet accelera tes as the f ree-
stream Mach number increases. However , the total
pressure recovery of the g laze ice cases drops even
faster, compared to the clean cases . Total pressure
recoveries of the glaze ice case at M„=0 .13 and 0.85
are 0.985 and 0.61, while , those of the clean case are
0.998 and 0 .789, respect ively. There fo re , the total
pressure recovery is decreased by 1.3 and 22.8
percent at M„,=0.13 and 0.85, respect ively. The
greater loss in total p ressure recovery at higher
Mach numbers can be expla ined by the stronger
f low separation plus more intense and extens ive
shock structure in the duct f l ow with the glaze ice
formation, as descr ibed earl ier . At the relatively low
free-s t ream Mach numbers , f l ow separat ion f rom the
ice accretion is the main source of the total pressure
loss. However , the occur rence of a near ly-per iodic
and strong shock structure under the icing ef fec t at
the higher Mach number s is the ma jo r contr ibutor to
the lower total pressure reduct ion at the engine face.
The effect of the inlet icing on the pe r fo rmance
of a turbofan eng ine system can be approximate ly
est imated. A mil i tary specif icat ion, MIL-E-5007D
/32/ , def ines the requi rement for the engine
pe r fo rmance in the icing condi t ion. According to
the specif icat ion, a tu rbofan engine should operate
sat isfactori ly under the meteorologica l condit ions
with not more than 5 percent total loss in thrust
available and 5 percent total increase in specif ic fuel
consumpt ion at all opera t ing condi t ions above 50
percent m a x i m u m cont inuous power setting /32/
(Figure 13).
Fig. 13: Decrease in engine net thrust (Fn) or increase in specif ic fuel consumpt ion ( S F C ) under the glaze-icing
ef fec ts
In addition, it is we l l -known that 1 percent reduct ion
in inlet total pressure recovery leads to an
approximately 1.5 percent d rop in the net installed
thrust in an aircraf t gas turbine engine or
equivalently about a 1.5 percent increase in its
specif ic fuel consumpt ion /33/ . There fore , the total
pressure degradat ion wi th the g laze ice at M m =0 .85
that is 18 percent , it cor responds to roughly a 27
percent total loss in the engine thrust (Fn) and 27
percent increase in the specif ic fuel consumpt ion
(SFC). H o w e v e r as we shall present, a more severe
loss source for the engine thrust with icing s tems
f r o m a reduction in engine mass flow rate that is
caused by the b lockage due to ice format ion. The
Brought to you by | provisional accountUnauthenticated
Download Date | 11/18/15 4:55 PM

291
overall degradat ion in thrust is substant ial and far
exceeds the limits of m i n i m u m requi rement for the
engine pe r fo rmance under the icing condi t ion. Note
that the s imula t ions in the current s tudy were based
on s impl i fy ing a s sumpt ions of s teady-state , single-
phase f low, ax i symmet r i c icing e f fec t at sea-level
condi t ion and icing tempera tures . Consequent ly , the
degradat ion level of an engine pe r fo rmance as
represented by the thrust and specif ic fuel
consumpt ion in an actual f l ight is expected to be
more severe than those o f fe red by our s imulat ion.
0 . 2 0 . 3 0 .4 0 .5 0 .6 0 .7 0 .8 0 .9
Free-stream Mach Number, ~
Fig. 14: Variat ion of total pressure distort ion parameter (DP) with f ree-s t ream Mach number s
Figure 14 shows a compar i son of the total
pressure distortion paramete rs (DP) of the clean and
glaze ice cases with the f ree-s t ream Mach numbers .
The total pressure distort ion parameter (DP) is one
possible descriptor that highl ights the m a x i m u m
distortion at the engine face , as def ined by Eq. (3):
DP = P.,max-P..
P.,ef (3)
Overall , the glaze- iced inlet induces higher DP
levels compared to the clean inlet at all f ree-s t ream
Mach numbers , and this fact was noted earlier in the
engine face distort ion pat terns shown in Figure 11.
In addition, the d i f f e rence be tween the DP levels
becomes more apparent as the Mach number
increases, except MCO=0.65 case. T h e reason for the
relatively lower DP for the glaze ice case at
M„=0.65 is found in the descr ipt ion of the distortion
parameter itself, i.e., DP. In this case we note that
most of the engine face is con tamina ted with high
total pressure loss as the coreßow totally disappears
at Moo=0.65 under the e f fec t of glaze ice; therefore ,
the m a x i m u m total pressure , pt,max> is comparab ly
low as shown in F igure 11(c). However , the
d i f fe rence in the DP levels b e c o m e the max imum at
the highest Mach number , M a ,=0.18. For the clean
and glaze cases, DP=0.01 and 0.02, respectively, at
Μ , λ =0.13 , whi le D P = 0 . 7 4 and 0.9, respect ively, at
Μ . λ =0.85. Hence, the engine face distort ion problem
is exacerbated by higher f l ight Mach number , as
expected.
The var ia t ions of the inlet mass f low with
increasing f rees t ream Mach n u m b e r are plotted in
Figure 15. T h e inlet mass f l ow rate (pefAefVer) is
calculated at the engine face station and it is the
index of the a i r - swal lowing capaci ty of an inlet. In
both cases as presented in F igure 15, the increase of
mass f low rate s tops a round MrJ0= 0.5 due to the inlet
Brought to you by | provisional accountUnauthenticated
Download Date | 11/18/15 4:55 PM

292
24
22
to 20 o> 18
16 ο 16
u_ 14 Μ <Λ ra 12 Έ +-> ω 10 c
8 8
6
: v : y
/ j : :
; j
/ > 2 1 ι ι i :
η
e —A—Glaz 1
η
e : : : 1 1 1
—A—Glaz 1
η
e
0.2 0.3 0.4 0.5 0.6 0.7 0.8 Free-stream Mach Number, ~
0.9
Fig. 15: Variation of inlet mass flow with free-stream Mach lumbers
choking effect. However, the levels of inlet mass flow for the glaze ice cases are much lower than those for the clean cases, and this is mainly due to the decreased inlet frontal area by 21 percent, i.e., blockage, with the simulated glaze ice. Also, at Moo=0.13, the level of the mass flow rate in the glaze iced inlet is about 73 percent of that in the clean inlet, while at M^O.475 , which is the Mach number before choking, 1 the level is approximately 67 percent. This fact suggests that when the glaze ice accretes on the inlet lip, the amount of air flow through the S-duct inlet is significantly reduced as the free-stream Mach number increases. A higher reduction in inlet mass flow rate with the higher flight Mach number, M„=0.475, is caused by the more massive flow separation and blockage from the glaze ice.
In summary, our computational results indicate that a fully-developed glaze ice accretion on the inlet lip increases the total pressure loss and distortion level at the engine face of the M2129 S-duct inlet. The higher distortion levels at the engine face that are very severe may lead to compressor stall or engine surge. The loss in engine net installed thrust and increase in specific fuel consumption are caused by inlet lower total pressure recovery as well as
reduced mass flow rate. Inlet icing and the attendant flow separation induced by ice horns cause an increase in inlet blockage and choking.
5. Future W o r k
We intend to relax our simplifying assumptions such as axisymmetric ice shape around the inlet by introducing asymmetrical ice shape that wraps around the inlet lip. We also intend to investigate the effect of flow angularity with angle of attack and sideslip on the flow qualities of an iced inlet. The steady-state assumption about the ice shape needs to be relaxed with time scales related to ice accretion. Therefore, a time dependent approach to temporal ice shapes and formation needs to be investigated. The dynamic distortion problem requires the time dependent calculations on a different time scale as ice accretion. In recognition of the importance of the time-resolved distortion and its impact on gas turbine engine stability, we intend to study the root-mean-square of the turbulent fluctuation at the engine face. In particular distortion levels that exceed a prescribed critical value and last on a time scale that is of the order of shaft rotation are of
Brought to you by | provisional accountUnauthenticated
Download Date | 11/18/15 4:55 PM

293
interest. Finally, time-dependent freestream flow that models atmospheric gust is of special interest. This category of externally-generated disturbance can be another source of the dynamic inlet distortion 734-35/.
Acknowledgement
The authors express their sincere appreciation to Dr. Chuan-Tau (Eddie) Lan, Emeritus Distinguished Professor of Aerospace Engineering at the University of Kansas, who has continually supported this work.
References
1.Cole, J. and Sand, W., 1991, "Statistical Study of Aircraft Icing Accidents," AIAA Paper 91-0558.
2. Potapczuk, M. G„ "Numerical Analysis of an NACA 0012 Airfoil with Leading-Edge Ice Accretion," Journal of Aircraft, Vol. 25, No. 3, pp 193-194, Mar. 1988.
3. Bragg, Μ. B., Khodadoust, Α., and Spring, S. Α., "Measurement in a Leading-Edge Separation Bubble due to a Simulated Airfoil Ice Accretion," AIAA Journal, Vol. 30, No. 6, pp 1462-1467, 1992.
4. Kerho, M. F and Bragg, Μ. B., "Airfoil Boundary-Layer Development and Transition with Large Leading-Edge Roughness," AIAA Journal, Vol. 35, No. 1, Jan. 1997.
5. Kim H. S. and Bragg, Μ. B., "Effects of Leading -Edge Ice Accretion Geometry on Airfoil Performance," AIAA Paper 99-3150. Jun. 1999.
6. Chung, J., Choo, Y., Reehorst, A. L., Potapczuk, M. G., and Slater, J., "Navier-Stokes Analysis of the Flowfield Characteristics of and Ice Contaminated Aircraft Wing," AIAA Paper 99-0375, Jan. 1999.
7. Shin, J., Berkowitz, B., Chen, H.H. and Cebeci, T., "Prediction of Ice Shapes and Their Effect on Airfoil Performance," Journal of Aircraft, Vol. 31, No. 2, pp. 263-270, 1994.
8. Acker, L. W. and Kleinknecht, Κ. S , "Effects of Inlet Icing on Performance of Axial-Flow Turbojet Engine in Natural Icing Conditions," NACA Research Memorandum E50C15, 1950.
9. Gelder, Τ. F., "Total-Pressure Distortion and Recovery of Supersonic Nose Inlet with Conical Centerbody in Subsonic Icing Conditions," NACA Research Memorandum E57G09, 1957.
10. Papadakis, M., Zumwalt, G. W., Elangonan, R., Freund, G. Α., Jr., Breer, M., and Whitmer, L., "An Experimental Method for Measuring Water Droplet Impingement Efficiency on Two- and Three-Dimensional bodies," NASA-CR-4257, 1989.
11. Bidwell, C. S. and Möhler, S. R., Jr., "Collection Efficiency and Ice accretion Calculations for a Sphere, a Swept MS(1)-317 wing, a Swept NACA-0012 Wing Tip, an Axisymmetric Inlet, and a Boeing 737-300," AIAA Paper 95-0755, Jan. 1995.
12. Bidwell, C. S. and Potapczuk, M. G., "Users Manual for the NASA Lewis Three-Dimensional Ice Accretion Code (LEWICE3D), NASA TM-105974,1993.
13.Farokhi, S., "Aircraft Propulsion," Wiley, New York, USA, 2008.
14.Seddon, J. and Goldsmith, E. L„ "Intake Aerodynamics," the 2nd edition, AIAA Inc. and Blackwell Science Ltd., Osney, UK, 1999.
15. Henry, R., Guffond, D., Aschettino, S., and Duprat, G., "Characterization of Ice Roughness and Influence on Aerodynamic Performance of Simulated Ice Shapes," AIAA Paper 2001-0092, Jan. 2001.
16. Jin, W. and Taghavi, R. R., "Computational Study of Icing Effects on the M2129 S-Duct Inlet," AIAA Paper 08-0075, Jan. 2008.
17. Anderson, Β. H., Reddy D. R., and Kapoor, K , "Study on Computing Separating Flows within a Diffusing Inlet S-Duct," Journal of Propulsion and Power, Vol. 10, No. 5, Sept.-Oct. 1994.
18.Addy. Jr., Η. E., "Ice Accretions and Icing Effects for Modern Airfoils," NASA TP-2000-210031,2000.
Brought to you by | provisional accountUnauthenticated
Download Date | 11/18/15 4:55 PM

294
19. Willmer, A. C., Brown, Τ. W „ and Goldsmith , E.
L., "Ef fec t s of Intake Geomet ry on Circular Pitot
Intake Per formance at Zero and Low Forward
Speeds," Aerodynamics of Power Plant
Installation, pp. 5.1-5.16 ( A G A R D CP301 , Paper
5), Toulouse, France, May 1981.
20 .G ibb , J. and Jackson, M., " S o m e Prel iminary
Results f rom Tests Using Vortex Generators in
the Circular/Circular Di f fus ing S-Duct Model
M2129 Test Phase 3 ," Defense Research Agency
Rept. AP4(92 )WP15 , Aug. 1992.
21. G A M B I T Sof tware Package, Ver. 2.2.30, Fluent
Inc., Lebanon, N H , USA, 2004.
22. S T A R - C C M + Sof tware Package, Ver. 2 .10.013,
CD-adapco Inc., Melvil le, N Y , USA, 2007.
23. Anderson, Β. H. and Farokhi, S., "A study of
Three Dimensional Turbulent Boundary Layer
Separation and Vortex Flow Control Using the
Reduced Navier Stokes Equat ions ," Turbulent
Shear Flow Sympos ium, Munich, Germany ,
Sept. 1991.
24. A G A R D Fluid Dynamics Panel Work ing Group
13, "Air Intakes for High Speed Vehicles ,"
AR.270, Fort Worth, TX, USA, Sept. 1991.
25 .Mente r , F. R., "Two-Equa t ion Eddy-viscosi ty
Turbulence Mode l s for Engineer ing
Applicat ions," A I A A Journal , Vol. 32, No. 8, pp
1598-1605, Aug. 1994.
26. Menzies, R. D. D„ Babcock, K. J., Barakos, G.
N., and Richards, Β. E., "Validat ion of the
Simulation of Flow in an S-duct ," AIAA Paper
2002-2808, Jun. 2002.
27. May, Ν. E., "A N e w Vortex Generator Model for
Use in Complex Conf igura t ion CFD Solvers,"
AIAA Paper 2001-2434 , Jun. 2002.
28 .Berr ie r , B. L. and Allan B. G., "Experimental
and Computa t ional Evaluation of Flush-
Mounted, S-Duct Inlets," AIAA Paper 2004-764,
Jan. 2004.
29. Möhler , S. R. Jr., " W I N D - U S Flow Calculat ions
for the M 2 1 2 9 S-Duct Using Structured and
Unstructured Gr ids ," A I A A Paper 2004-525, Jan.
2004.
30. F L U E N T Sof tware Package, Ver. 6.2.16, Fluent
Inc., Lebanon, NH, U SA , 2005.
31. Dunham, J., "The Genera t ion of Swirl in an S-
Duct with Axial F low," N G T E unpublished
memo, 1979.
32. MIL-E-5007D General Specification for
Engines, Aircraft , Turbo je t and Turbofan .
33 . Johnson , R. W., " T h e Handbook of Fluid
Dynamics ," the 1st edit ion. Springer publishing
Co., 1998.
34. Macmilier , C. J. and Haagenson, W. R ,
"Unsteady Inlet Distortion Characterist ics with
the B-1B," the Propulsion and Energetic 68th (A)
Specialists ' Meet ing, Munich, Germany, 1986.
35. Barry, F. W., "Ef fec t s of Atmospher ic Gust
Criteria on Supersonic Inlet Performance ,"
AIAA Paper 1966-367, Mar. 1966
Brought to you by | provisional accountUnauthenticated
Download Date | 11/18/15 4:55 PM