a computer simulation model facies-3d for the ... · 408 fumiaki matsuda, yoshinori matsuda,...
TRANSCRIPT

CEOSEtl '98 Proceedillg" , Ceo /. Soc. , lftlltl.IJditl Bit II. -15, Deei'm llf!· /999; jljI . -i07--iJ5
Ninth Regional Congress on Geology, Mineral and GEOSEA '98
Energy Resources of Southeast Asia - GEOSEA '98 17 - 19 August 1998 • Shangri-La Hotel, Kuala Lumpur, Malaysia
A computer simulation model facies-3D for the reconstruction of the carbonate sedimentary process
FUMIAKI MATSUDA, YOSHINORI MATSUDA, MICHINORI SAITO AND RYOTARO I WAHASHI
Technology Research Center Japan National Oil Corporation
2-2, Hamada 1-Chome, Mihama-Ku, Chiba-Shi Chiba-Ken 261 Japan
Abstract: A computer simulation model for the reconstruction of the sedimentary processes for carbonates and siliciclastics (Facies-3D) has been developed by the Technology Research Center of the Japan National Oil Corporation. The Facies-3D carbonate model describes carbonate facies in each grid in three dimension based on water depth and current velocity . Water depth is calculated from sea level changes and basement movement. Current velocity at each grid is calculated from boundary current velocity data given at four corners of the simulation area and at any other points. The accumulation rate of sediments is determined from the type of carbonate facies and the calculated water depth. Output data at each step are facies and thickness for each grid. The above-mentioned series of calculations is made at each step for the simulation period. A simulation case study was conducted using the deposition al model of the reefal carbonate facies of the upper Kais Formation, which is the main oil reservoir in the Walio field in the Salawati Basin in Indonesia. The upper Kais Formation is interpreted to have been deposited during a third-order cycle (5.5 Ma-4.2 Ma). Eight carbonate facies were delineated in the Kais and overlying Klasafet Formations as follows; (1) restricted back reef, (2 ) open back reef, (3) reef flat, (4) reef crest, (5) reef front, (6) shallow fore reef, (7) fore reef talus, and (8) deep fore reef. Parameters for the simulations such as carbonate facies, basement data, sea level curve, basement subsidence, and current conditions were evaluated from various analyses from eight key wells in the Walio field area, regional geology and ODP data. The simulation was conducted for the period of 5.4 Ma to 4.8 Ma. The results indicate that the simulation model describes the back-stepping feature and facies change at the major flooding events such as Q-1, 0 and K interpreted from well data.
INTRODUCTION
A computer simulation model for the reconstruction of the sedimentary processes for carbonates and siliciclastics (GEOSIM) was developed by the Technology Research Center (TRC) of the Japan National Oil Corporation (JNOC) during the period from 1986 to 1995. The GEOSIM carbonate model was developed based on results of surveys conducted during the project on the Quaternary carbonates in the Ryukyus (Tsuji, 1993; Honda et al., 1994; Tsuji et al., 1994) and the Recent sediments from offshore Fraser Island, eastern Australia (Harris et al., 1996). Some simulation case studies were carried out using the results of
. these surveys (Sunouchi et al., 1989; Iwata et al. , 1993; Matsuda et al., 1997). The results of these case studies indicate that the simulation model reconstructed to a high degree, the distribution of the carbonate facies. Since 1995, TRC of JNOC has
developed Facies-3D (Matsui et al., 1997) which is an upgraded version of GEOSIM. Since 1996, a case study using the Facies-3D carbonate model (Matsuda et al., 1997) has been conducted for the Walio field (Gibson-Robinson et al . , 1990; Livingstone et al., 1992) located in the Salawati Basin, Irian Jaya, eastern Indonesia (Fig. 1). The purposes of the case study are as follows: • To reconstruct the depositional model of the
Miocene carbonate reservoir of the Kais Formation in the Walio field .
• To predict three-dimensional distribution and heterogeneity of the Kais carbonate reservoir. using Facies-3D.
• To verify the feasibility of Facies-3D as an exploration and production tool. During this case study, the Facies-3D carbonate
model has been upgraded to include three new modules such as mud accumulation, reef environment and compaction. This paper describes

408 FUMIAKI MATSUDA, YOSHINORI MATSUDA, MICHINORI SAITO AND RYOTARO IWAHASHI
the principle ofthe Facies-3D carbonate model and preliminary results ofthe case study for the Miocene carbonate reservoir in the Walio field .
PRINCIPAL OF THE SIMULATION MODEL
A schematic flow diagram for the Facies-3D carbonate model is shown in Figure 2. The Facies-3D carbonate model describes carbonate facies in each grid in three dimensions based on water depth and current velocity. The simulation area is defined by X and Y axial grids. Basement data showing paleo-topography is defined by X, Y, and Z axes. Water depth (Z axis) is calculated from sea level changes and basement movement. Current velocity at each grid is calculated from boundary current velocity data given at four corners of the simulation area and at any other points. Analyses on mud accumulation and reef environment are made to limit the area for deposition of mud in deep water, and to define fore reef and back reef settings, respectively, in each grid. This is followed by defining carbonate facies from the calculated water
~'~ () Salawati ~ • _ .. j- ~ Basin ......
.. td 0-=
o 500 1000~n~nesia 0 --;;;- 0_:-~
depth and current velocity. The accumulation rate of sediments is determined from the type of carbonate facies and the calculated water depth. Mechanical compaction is then predicted. Output data at each step are facies and thickness for each grid. The above-mentioned series of calculations is made for each step during the simulation period.
DEPOSITIONAL MODEL
A simulation case study was conducted using the preliminary depositional model of the main Walio reservoir in the reefal carbonate facies of the upper Kais Formation, which is overlain by claystones of the Klasafet Formation (Fig. 3). The upper Kais carbonates laterally change into the Klasafet claystones. The Walio field is considered to be located on the shelf margin bank which extends a minimum of 50 km east and west of the field. Eight carbonate facies were delineated in the Kais and overlying Klasafet Formations as follows; (1) restricted back reef (F Ali) , (2) open back reef (FAlii), (3) reef flat (FA2), (4) reef crest (FA3), (5) reeffront (FA4), (6) shallow fore reef (FA5), (7) fore
...N
alio-179
1 km
Figure 1. Map showing the location of the Walio field, a cross section A-B of the depositional model in Figure 3 (in the upper map) and the location of the simulation area A (lower left) in Figure 8 (in the lower left map).
CEOSEr! '98 Pr(lceerhllq,' (CS/I! BIIII. 45)

A COMPUTER SIMULATION MODEL FACIES -3~ FOR THE RECONSTRUCTION OF THE CARBONATE SEDIMENTARY PROCESS 409
- Sediment Data - Basement Data - Sea Level Data
Loop for Time Steps - Flow Data
reef talus (FA5i), and (8) deep fore reef (FA6) (Matsuda et al., 1997). The depositional features of the upper Kais Formation in the Walio field are shown in Figure 3 and are summarized below. • The deposition of the upper Kais Formation
occurred during a third-order cycle (5 .5 Ma- 4.2 Ma) (Fig. 4).
• The lateral facies changes are recognized from the FA1-FA5 facies of the Kais Formation in the reef core to the F AS and F A6 facies in the reef margin.
• The back step ofthe reefal facies are interpreted on the reefal margin
• The reef growth in the Walio field possibly ended at 5.0 Ma due to transgression and periodic influxes of detrital clay-rich sediments towards the end of the Kais reef.
EXTRACTION OF PARAMETERS FOR CARBONATE ACCUMULATION THE SIMULATION
- Facies - Thickness
Figure 2. Schematic flow diagram for the Facies-3D carbonate model.
A Wes
Walio-245 Wafio-23
Several sets of parameters were tested during the case study and the results were calibrated with the preliminary depositional model of the field and lithology observed in Walio-23. The simulations were made for three different sizes of the area; the regional area A (area size: 30 km x 40 km, grid size: 1 km x 1 km), the main Walio field area B (area size: 7 km x 5 km, grid size: 200 m x 200 m), and the eastern Walio field area C (area size: 3 km x 3
Wafi0-69
FA6
FA5
B East
Walio-20
==-7Air--~~..;;.2!!!t...:::.....::........,;:::..!.f6!;..~= FA5 L==-~~:.aa.-=~"--=--=:::=====~ ________ Q_1
0-1 "'-"'-1-, -Res:b--ict8d--bact--ree(--:
FA 1- Open bact reef FA2 Reef FA3 Reef crest FAA Reef front
(MFS 5.4 Ma) (R) FAS ShaIIowforereef
FA6 Deep fore reef
Figure 3. Depositional model ofthe eastern part ofthe Walio field. Location of the cross section is shown in Figure 1.
DeceJllf,t'/' / 999

410 FUMIAKI MATSUDA, YOSHINORI MATSUDA, MICHINORI SAITO AND RYOTARO IWAHASHI
Age lanklonic Lager Systems Eustatic Sea Level Epoch Foram. Foram. Formation (Ma Zones Zones Tracts Curve (Haq et aI., 1987)
4 . 1 TR - S8 3 1:
CU ~ " c.. N19/20 - Klasafet .5 Q) <0 (part)
6 I: E: Tg/h HST Q) >-7 CJ 'i:
.8 .2 <0 Textularia-II
.9 0:: W
5 FS . 1 TR .2 TS .3 N18 ." SMW
.5 SB
.6
HST -.8 1: MF cu ~ .9 c.. Upper Tf
6 - <0 TR Q) E: Tf3, part
.1 I: TS
.2 Q) Q) SMW CJ -.3 0 <0 N17 SB ...J
" ~ (part) .5
.6 HST
.7
.8
.9 MFS
Figure 4. Stratigraphy and sequence stratigraphic framework in the Walio field.
AOOV · 12.79
4000.00 ·24,32 • · 12,79 ·311.09 • ·24,32 ·47.30 • ·311,116 ·9S.8' • ·47,30 ·70.44 • ·1111.8'
3.000.00 ·01.8G • ·70.44 ·9:t.40 • ·01.90
(m) . , 09.02 • ·03.40 . , 1 0. 9 '· ' 01) ,02
·120,00 '. " lIiBIl 2000.00
• · '38, l ' ·120.00 • • 111 1. 14 • · 130.111
• ·1G2,07 '·19' . ' 4 • ·174,10 ' " 112.07 • · 1811,72 '·174.18
• DilLOW ·101).72
(m) Figure 5. Basement data ofthe main Walio field simulation area B. The location of the area B is shown in Figure 8 with a rectangle.
GEOSEA '98 Proceedin!J.! (GS/1I/ BuLL. 45)

A COMPUTER SIMULATION MODEL FACIES -3D FOR THE RECONSTRUCTION OF THE CARBONATE SEDIMENTARY PROCESS 411
km, gird size: 200 m x 200 m). The optimum conditions for each parameter and the results of the simulation for the area B are described below. • Simulations were conducted for the period of
5.4 Ma to 4.8 Ma at every 5,000 years. • Basement data indicating paleo-topography was
reconstructed at the 5.4 Ma MFS (Fig~ 5). • Sea-level changes in the Late Miocene to Early
Pliocene are inferred from stable oxygen isotope data from ODP sites 846 of Leg 138 in the southeastern Pacific Ocean (Shackleton et al., 1995; Haq et al., 1987). The change in the oxygen isotope ratios between the present time and the last glaciation in the Quaternary is assumed to be equivalent to 120 m of sea level change. Oxygen isotope data were converted to sea-level change data based on the assumption that this conversion ratio in the Quaternary can be applied to the Late Miocene to Early Pliocene (Fig. 6). Major flooding events such as R, Q-1, 0, N, M, and K were defined as shown in Figure 7 using GR and INPEF A (processed from GR using CycloLog*) curves in Walio-23. These events are correlated with the-sea level change data. * CycloLog: trade mark of ENRES
INTERNATIONAL • The results of the simulations indicate that the
rate, 5.0 m/10,000 year is optimum to describe the facies.
• Paleocurrents in the area were inferred from dipmeter analysis data, and are interpreted to be in a direction of the west to the east. This direction seems to be reasonable because this is parallel both to the regional trend of the 'Walio bank' and to an elongated Kasim pinnacle reef. Current conditions such as its direction and velocity at each grid can be simulated according to the input boundary current condition data, basement configuration and water depth. Several simulations in the regional area were conducted to estimate reasonable current data in the Walio field area (Fig. 8).
• The template of carbonate facies shown in Figure 9 was delineated and based on carbonate facies and their associated carbonate rocks, which were inferred from sedimentary and faunal analyses from eight key wells in the Walio field area.
RESULTS OF THE SIMULATION
Results of the simulation are as follows (Figs. 10 and 11): • Lateral facies changes from the F A1-F A5 facies
in the reef core to the F A5 and F A6 facies in the reef margin and basinal area are simulated.
Decemher 1999
• Overall back-step features in the field are simulated.
• Major flooding events such as Q-1, 0, N, M, and K interpreted from CydoLog data are described by the simulation.
• Back reef facies are described in the interval between events R and Q-l. The FA1 and FA4 facies are mainly described in the tntecval between events Q-1 and o. An overall deepening upward section is represented in the interval between events 0 and K. The reef is drowned after event K.
• Influences of back reef generally decrease toward the top of the Walio reef. The southwestern part of the Walio field, which is the inner part of the reef, has more back reef influences.
FUTURE TARGET OF FACIES-3D
The following module and concept will be incorporated into the Facies-3D carbonate model in the feature target. • . A module for shallow diagenesis to estimate
dissolution and cementation in the reconstructed carbonate facies.
• The idea on estimation of the location of a carbonate factory and supply of carbonate sedIments from the factory to surrounding areas.
ACKNOWLEDGEMENTS
The authors would like to thank Pertamina, Santa Fe and "its joint venture partners, and JNOC for their permission to publish this study.
REFERENCES GIBSON-ROBINSON, c., HENRY, N.M., THOMPSON, S.J. AND TRI
RAHARJO, H., 1990. Kasim and Wallo Fields - Indonesia, Salawati Basin, Irian Jaya. AAPG Treatise of Petroleum Geology, Atlas of Oil and Gas Fields, Stratigraphic Traps 1,257-295.
HAQ, B.U.,HARDENBOL,J. ANDVAlL,P.R., 1987. Chronology of fluctuating sea level since the Triassic. Science, 235, 1156-1167.
HARRIs, P.T., TsUJI, Y., MARSHALL, J.F., DAVIES, P.J., HONDA, N., AND MATSUDA, H., 1996. Sand and rhodolith-gravel entrainment on the mid- to outer-shelf under a western boundary current, Fraser Island continental shelf, eastern Australia. Marine Geology, 129,313-330.
HONDA, N., TSUJI, Yo, MATSUPA, Ho AND SAOTOME, Jo, 1994. Sea level changes and development of the Pleistocene Ryukyu Group in the Irabu Island region, southwest Japan. Journal of the Japanese Association Jor Petroleum Technology, 59/1, 86-98 (in Japanese with English abstract).
IWATA, To, TsUJI, Y., SUNOUCHI, H. AND YAMAMURA, To, 1993. Computer simulation models for carbonate

~ <:::l V:l
~ \Q 0.,
~ ~
" '" '" ':)....
~. "-
~ ~ tl:l :::: ""':---
to
(a) 60
40
20
g J 0 iii
-20
-40
-60 5.5
F
~
f ~ l\t~ fJ "Il
5.4
U-1 i
, ,
114 M ~
. 53
~ t<
~ ,,~ ~ ~ Ii A' ~11A~ I!!t 1\
~ n\ W~ '~I t f
~
5.2 5.1 5 4.9 4.8 Age (Me)
Figure 6a. Sea-level change, 5.5-4.8 Ma estimated from stable oxygen isotope data ofODP 846. Major flooding events, R, Q-l, 0 and K correlated with Walio-23 log data in Figure 7 is shown both in Figures 6a and 6b.
(b)
(m)
240.00
! i ···-1······ ·1······1· ...[-----1 ..... -1 .. 1 ..
1 i i ! K ! ALii ", ' i', ' <.I
j i! ! 1 11'>'1 'I 1 ! i i. ; I .. 11'1J1 ,., i i : : 0" i rM.!"" ~ll': :
'Q" ", " ______ j ___ .___ 1"-t--------l t fI\ jr~ft ¥. r :" i , ' , .... - -.----. J j' " "
160.00
80.00
i-I; , ~! ,-.--------.' ; R! .. T!iY~l\·IT-t--l,,!; .. /ir ", i "f,'l.f' .. ·.. i fi"
.00 < ~. ,) ", .. 1' ......... -..... ' !
i~l' i Iii -5.39 -5.25 -5.11
(Ma) -4.97 -4.83
Figure 6b. Sea-level change in conjunction with basement subsidence at rate of 5.0 mllO,OOO years.
I? 12500.01 F 1 ~ I.,. 7
1 :f:, 12600.0~·J L 1 l: £,
10 (5.2 M..-.-.~ TS)
~ .
~ ") {- -f ~ ~ 1 -t ~ '\.. ") 2800.0· 3:~ -f" Q-1 $2 >?1 \ .) 1.:S ~ ,i . ~ 1 ~
" >-" """ - -. ------,." r-- ---- "--- --:c-~ \ -5- -L " ~ ,. ~~ "~ ~ ) J} ~ ( 2900_0 r:; t J c"
\, $ J: ~ R (5.4 Ma MFS)~> /" ,(. r r>
.f .~
Figure 7. Electrical log data in Walio-23. PEFA and INPEFA curves are process using CycloLog(a trademark of EN RES INTERNATIONAL). Flooding events are marked as K, M, N, 0, Q-l, and R.
~ ..... I\)
" c 3:
~ s:: ~ ~ ~ g ::I:
~ ~
s:: ~ ~ ~ s:: C'5 ::I: Z o ~
V! a ~ o
~ :xl o
~ ~ ;;!;
A COMPUTER SIMULATION MODEL FACIES -3~ FOR THE RECONSTRUCTION OF THE CARBONATE SEDIMENTARY PROCESS 413
24000.00 ABOVE 0.13
0.12. - 0. l3
O.ll - 0.12
O. [Q - 0.11
• O.lO - 0.10
18000.00 • 0.09 - 0.10
• 0.08 - 0.09
Y • 0.07 - 0.08
1m) • O.~ - 0.07 - 0.1:6 - O .~
1200000 • 0.04 - 0.1:6 - 0.03 - 0.04 - 0.03 - 0.03 - 0.02 - 0.03
6000.00 - 0.01. - 0.02 - 0.00 - om _ BELOW 0.00
X )m)
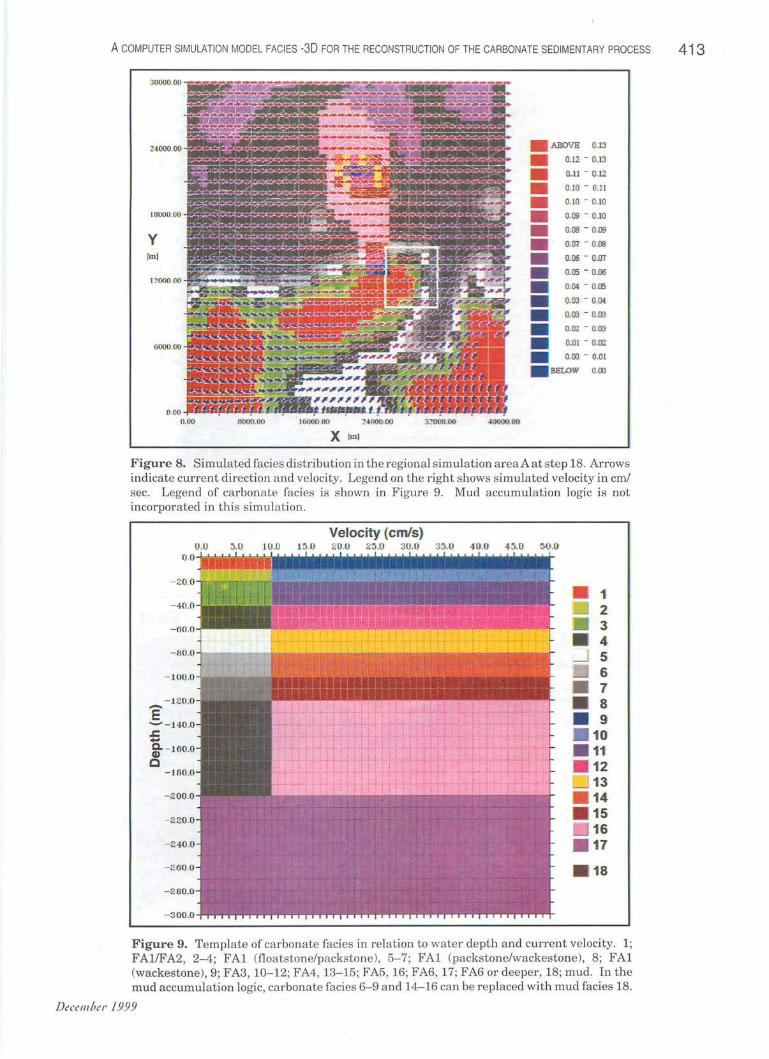
Figure 8. Simulat ed facies distribution in the regional simula tion area A at step 18. Arrows indicate current direction and velocity. Legend on the right shows simulated velocity in crrJ sec. Legend of carbonate facies is shown in Figure 9. Mud accumulation logic is not incorpora ted in this simula tion.
Velocity (cmls) 0 .0 :l.0 1 0 .0 1:l.0 2 0 .0 2:).0 30 .0 3 :).0 4Q.0 4:). 0 :lo .t)
1 2 3 4
.-J 5 6 7 8
• 9 . 10 . 11
12 13 14 15 16 . 17
. 18
Figure 9. Template of carbonate facies in relation to water depth and current velocity. 1; FA11F A2, 2-4; FA1 (fl oa tstone/packstone), 5-7; F Al (packstone/wackestone), 8; FA1 (wackestone), 9; FA3, 10- 12; FA4, 13- 15; FA5, 16; FA6, 17; FA6 or deeper , 18; mud. In the mud accumulation logic, ca rbonate facies 6- 9 and 14-16 can be replaced with mud facies 18.
December 1999
414 FUMIAKI MATSUDA, YOSHINORI MATSUDA, MICHINORI SAITO AND RYOTARO IWAHASHI
5,000.00
4,000.00
y
(m)
2,000.00 ........... ~IItjBI~
o.oo+-<ll-~~.~~~~~~U~~~~1!W1II 0.00 1,400.00 2,800.00 4,200.00 5;600.00 7;000.00
X (m)
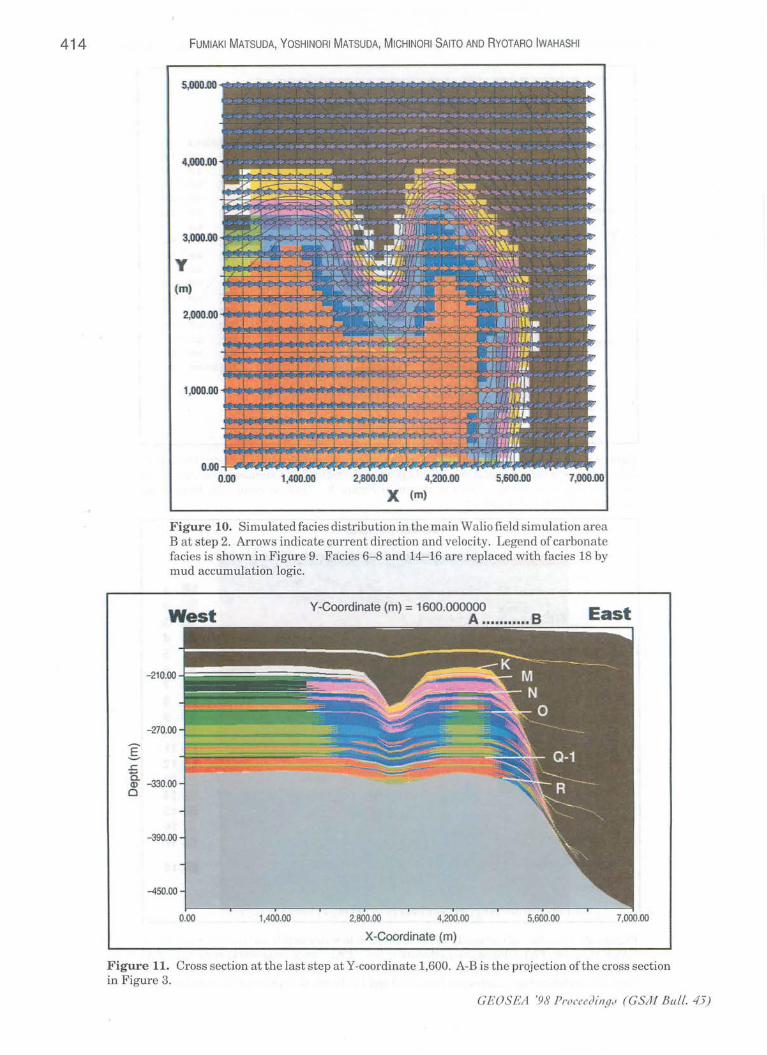
Figure 10. Simulated facies distribution in the main Walio field simulation area B at step 2. Arrows indicate current direction and velocity. Legend of carbonate facies is shown in Figure 9. Facies 6-8 and 14-16 are replaced with facies 18 by mud accumulation logic.
West V-Coordinate (m) = 1600.000000
A ......... , ... 8 East ==~-----------,
-21o.001========!!!!
-<l90.oo
-450.00
0.00 1,400.00 2,800.00 4,200.00 5,600.00 7,000.00
X-Coordinate (m)
Figure 11. Cross section at the last step at Y-coordinate 1,600. A-B is the projection ofthe cross section in Figure 3.
CEOSEfJ '98 ProcuiJill.lJ" (GSM Bilil. 45)

A COMPUTER SIMULATION MODEL FACIES -3D FOR THE RECONSTRUCTION OF THE CARBONATE SEDIMENTARY PROCESS 415
sedimentation. Report of the Technology Research Center, J.N.O.c., 24, 213-232 (in Japanese with English abstract).
LIVINGSTONE, H.J., SINCOCK, B.W., SYARIEF, A.M., SRIWIDADI AND WILSON, J.N., 1992. Comparison of Walio and Kasim reefs, Salawati Basin, western Irian Jaya, Indonesia. In: Siemers,C.T.,Longman,M.W.,Park,P.K.andKaldi,J.G. (Eds.), Carbonate rock and reservoirs of Indonesia: A Core Workshop. IPA Core Workshop Notes No. 1, 4-1 to 4-14.
MATSUDA, F, MATSUDA, Y., SAITO, M. AND IWAHASHI, R, 1997. A computer simulation model for the reconstruction of the carbonate sedimentary process. Indonesia Petroleum Association, Proceedings of the Petroleum Systems of SE Asia and Australasia Conference, 977-986.
MATSUI, R, MATSUDA, F., IMAYOSHI, A., MATSUDA, Y., IWAHASHI, R AND SAITO M., 1997 (in prep.). SedimentarySimulation Model for Reconstruction of Facies Distribution. Journal of the Japanese Association for Petroleum Technology (in
Japanese with English abstract). SHACKLETON, N.J., CROWHURST, S., HAGELBERG, T., PISIAS, N.G.
AND ScHNEIDER, D.A., 1995. A new Late Neogene time scale: application to Leg 138 sites. Proceedings of the Ocean Drilling Program, Scientific Results, 138, 73-1Ol.
SUNOUCHI, H., YUKI, T. AND TSUJI, Y., 1989. Two-dimensional simulation model·of carbonate accumulation process controlled by water depth. Abstracts, 28th International Geological Congress, Washington, 3, 196-197.
TSUJI, Y., 1993. Tide influenced high energy environments and rhodolith-associated carbonate deposition on the outer shelf and slope off the Miyako Islands, southern Ryukyu Island Are, Japan. Marine Geology, 113, 255--27l.
TSUJI, Y., HONDA, N., MATSUDA, H. AND SUNOUCHI, H., 1994. Research on Quaternary carbonates in the Ryukyu Are, southern Japan, and the implications on petroleum geology. In: Japan National Oil Corporation (Ed.), Carbonate Rocks-Hydrocarbon Exploration & Reservoir Characterization. TRC Special Publication, 3, 13-27.
•• GIl ••
Malluscript received 28 October 1998
December 1999