a conceptual ground-water-quality monitoring network for san
TRANSCRIPT
A CONCEPTUAL GROUND-WATER-QUALITY MONITORING NETWORK
FOR SAN FERNANDO VALLEY, CALIFORNIA
By James G. Setmire
U.S. GEOLOGICAL SURVEY
Water-Resources Investigations Report 84-4128
Prepared in cooperation with the
CALIFORNIA STATE WATER RESOURCES CONTROL BOARD
o I<t o oLO
Sacramento, California 1985
UNITED STATES DEPARTMENT OF THE INTERIOR
DONALD PAUL MODEL, Secretary
GEOLOGICAL SURVEY
Dallas L. Peck, Director
For additional information write to:
District Chief U.S. Geological Survey Federal Building, Room W-2234 2800 Cottage Way Sacramento, CA 95825
Copies of this report may be purchased from:
Open-File Services Section Western Distribution Branch U.S. Geological Survey Box 25425, Federal Center Denver, CO 80225 Telephone: (303) 236-7476

CONTENTS
PageAbstract------------------------------------------------------------ 1Introduct ion-------------------------------------------------------- 2
Purpose and scope---------------------------------------------- 2Approach------------------------------------------------------- 3Description of the study area---------------------------------- 4Numbering system for suggested monitoring sites---------------- 6
Geohydrology-------------------------------------------------------- 7Overview of basin geohydrology--------------------------------- 7Geohydrology of individual subbasins --------------------------- 7
San Fernando subbasin------------------------------------- 7Sylmar subbasin------------------------------------------- 11
Ground-water inflow and outflow-------------------------------- 12Historical water-level fluctuations---------------------------- 13
Water quality------------------------------------------------------- 13Imported water------------------------------------------------- 14Surface water-------------------------------------------------- 14Ground water--------------------------------------------------- 14
Land use------------------------------------------------------------ 15Distribution and use of toxic materials----------------------------- 18Network design------------------------------------------------------ 22Summary------------------------------------------------------------- 27Selected references------------------------------------------------- 27
PLATES
[Plates are in pocket]
Plates 1-6. Maps of San Fernando Valley, California, showing:1. Generalized geology and locations of sections.2. Selected ranges of dissolved solids in 1950.3. Selected ranges of dissolved solids in 1970.4. Generalized land use.5. Potential sources of pollution and water-level
contours, autumn 1980.6. Ideal ground-water-quality monitoring network.
ILLUSTRATIONS
Page Figure 1. Map showing location of study area----------------------- 5
2. Generalized sections showing wells located approximatelyalong A-A 1 , B-B 1 , and C-C 1 ----------------------------- 8
III
TABLES
Table 1. Representative chemical analyses of water------------------2. Industries in San Fernando Valley using toxic chemicals----3. Toxic wastes generated in San Fernando Valley--------------4. Solid toxic chemicals used in San Fernando Valley----------5. Ambient monitoring network---------------------------------6. Nonpoint-sources monitoring network------------------------7. Line-sources monitoring network----------------------------8. Point-sources monitoring network-------------------------- 9. San Fernando basin ground-water-quality monitoring network-
Page 161920212425262628
CONVERSION FACTORS
For readers who prefer to use metric units rather than inch-pound units the conversion factors for terms used in this report are listed below:
Multiply
acresacre-feet (acre-ft)acre-feet per year(acre-ft/yr)
feet (ft)feet per year (ft/yr) gallons (gal) inches (in.) miles (mi) square miles (mi 2 ) pounds (lb)'
0.40470.0012330.001233
0.30480.30480.00378525.41.6092.590453.6
To obtain
hectarescubic hectometerscubic hectometersper year
metersmeters per year cubic meters millimeters kilometers square kilometers kilograms
Air temperature is given in degrees Fahrenheit (°F), which can be converted to degrees Celsius (°C) by the following equation: °C=(°F-32)/l.8
Abbreviations used:
mg/L - milligrams per literuS/cm at 25°C - microsiemens per centimeter at 25° Celsius
Water Year: The water year starts October 1 and ends September 30; it is designated by the calendar year in which it ends.
IV

A CONCEPTUAL GROUND-WATER-QUALITY MONITORING NETWORK
FOR SAN FERNANDO VALLEY, CALIFORNIA
By James G. Setmire
ABSTRACT
A conceptual (ideal) ground-water-quality monitoring network was devel oped for San Fernando Valley to provide the California State Water Resources Control Board with an integrated, basinwide control system to monitor the quality of ground water. The geology, occurrence and movement of ground water, land use, background water quality, and potential sources of pollution were described and then considered in designing the conceptual monitoring network. The network was designed to monitor major known and potential point and non- point sources of ground-water contamination over time. The network is composed of 291 sites where wells are needed to define the ground-water quality.
The ideal network includes four specific-purpose networks to monitor (1) ambient water quality, (2) nonpoint sources of pollution, (3) line sources of pollution, and (4) point sources of pollution.

INTRODUCTION
Under the Porter-Cologne Water Quality Control Act and Federal regula tions, the California State Water Resources Control Board and the Regional Water Quality Control Boards are responsible for protecting the ground-water quality in California. San Fernando Valley is one of 21 "priority l" ground- water basins in which water-quality-monitoring networks are required. Various governmental and private agencies have their own specific and regional monitor ing needs and programs; however, an integrated, basinwide monitoring network would best fulfill the State's requirements and serve each of the agencies' needs.
San Fernando Valley is located in Los Angeles County about 15 miles north west of the city of Los Angeles. The valley represents a prime example of the transformation of agricultural land into a modern suburban area. In the late 1920's, irrigated agriculture occupied about 50 percent of the San Fernando Valley, but by 1960 decreased to about 10 percent. Present land use in the valley is predominantly residential with industrial complexes, industrial and commercial complexes, and commercial with service-oriented businesses inter spersed.
Water quality in the valley is diverse, ranging in dissolved-solids con centration from 210 mg/L for imported Owens River-Mono Basin water, to 740 mg/L for imported Colorado River water, and 1,200 to 1,500 mg/L for low flows in the Los Angeles River. The specific conductance of ground water in the western part of San Fernando Valley ranges from 940 to 2,240 yS/cm, and in the eastern part it ranges from 420 to 1,210 yS/cm. Specific conductance in the Sylmar subbasin ranges from 540 to 680 yS/cm.
Purpose and Scope
The purpose of this study was to design an ideal or conceptual basinwide network to monitor ambient ground-water quality, trends in ground-water qual ity, and the degree of threat from point and nonpoint pollution sources in San Fernando Valley. Specific objectives were to (1) define the ground-water system, including the direction and velocity of flow; (2) define regional base line ground-water quality; (3) describe land use as it may affect ground-water quality; (4) define sources and potential sources of pollution, whether natural or manmade; and (5) in consideration of items 1-4 above, present a water- quality monitoring scheme for San Fernando Valley.

This report is one of seven reports, each dealing with a specific basin, completed by the U.S. Geological Survey under a cooperative program with the California State Water Resources Control Board. The presence of existing wells was not considered in the network design. Because of past litigation among various local agencies, the necessary well data are tightly controlled and were not made available for use in the design of this network.
Approach
This report is the third phase of a four-phase study. Phase 1 determined the level of ongoing surveillance in the San Fernando Valley ground-water basin. Work in the second phase resulted in a comprehensive catalog of oper ational ground-water-quality monitoring networks, containing a description of individual monitoring sites and data being collected; however, because of liti gation concerning water rights, few data were made available for cataloging. Phase 3, developing a ground-water-quality monitoring network, involved two steps. First, an ideal or conceptual network was designed without regard to cost, logistical constraints, or presence of existing wells. Sites for monitoring in this ideal network were selected based only on land use, geo- hydrology, ground-water-quality conditions in the valley, and potential for contamination. Second, an operable network, corresponding as closely as possible to the ideal, was to be designed using wells currently being monitored by an agency; however, because the necessary well data were unavailable due to litigation, the operable network could not be designed. Hence, this report presents only the ideal network. Virtually all data used in this study are from previously published sources, and no fieldwork was performed.
Developing this network to meet the monitoring objectives involved a number of tasks. First it was necessary to describe the geohydrology, includ ing occurrence and movement of ground water, aquifer characteristics, and sources of recharge and discharge. This information provided many of the cri teria necessary to determine the number and location of sites and to assess their usefulness. Following geohydrology, the land use and water-quality characteristics of the basin were evaluated. Land use and water quality were the major sources of information that helped determine the type and location of existing or potential problems in the basin. The final selection of the monitoring sites was based on the geohydrology at the problem areas, which provided the information necessary to determine sampling frequency, constit uents to be sampled, and depth of the well. Each of these characteristics-- geohydrology, water resources, land use, and water quality--are discussed in the sections that follow. The information from these sections was evaluated to determine how an ideal network might be developed to meet not only the general monitoring needs, but also more specific monitoring objectives identified during the basin-evaluation process and by the Regional Board.

Description of the Study Area
San Fernando Valley is an alluvial basin located about 15 miles northwest of the city of Los Angeles and alined in a westerly direction (fig. 1) . It is bounded on the northeast by the San Gabriel Mountains, on the northwest by the Santa Susana Mountains, on the west by the Simi Hills, on the south by the Santa Monica Mountains, and on the east by the San Rafael Hills, the Repetto Hills, and the Verdugo Mountains (pi. 1). The alluviated part of the valley is about 23 miles long and about 12 miles wide at its broadest point, and occupies 185 mi 2 . The main cities include San Fernando, Burbank, and Glendale (pi. 1). The main access is by U.S. Highway 101 and Interstate Routes 5, 210, and 405. The Southern Pacific Railroad serves the area.
Comprising about 514 mi 2 , the valley and its drainage area ranges in altitude from 7,124 feet above sea level at the mountain peaks to 320 feet on the valley floor. The alluvial basin itself ranges from an altitude of about 1,600 feet in the Sylmar area to 320 feet at the Los Angeles River's outlet from the basin.
The Los Angeles River system drains the entire study area (pi. 1). The main tributaries of the Los Angeles River are Arroyo Calabasas, Browns Canyon, Aliso Canyon, Bull Creek, Pacoima Wash, and Big and Little Tujunga Creeks. Records of the Los Angeles County Flood Control District indicate that for the 29-year period 1929-57, the average annual discharge of the Los Angeles River above Arroyo Seco (at outlet of San Fernando Valley) was about 40,000 acre-ft (Upper Los Angeles River Area Watermaster, 1981, p. 15). Since 1940, the flow above the outlet has been regulated by the Hansen flood-control reservoir, and by the Sepulveda flood-control reservoir since 1941. These two reservoirs have a combined capacity of 49,400 acre-ft. Many diversions from the Los Angeles River are made above this point for domestic use and irrigation.
Average annual precipitation for 85 years of record is 19.86 inches for the drainage area, 16.3 inches for the valley-fill area, and 22 inches for the hill and mountain areas (California State Water Rights Board, 1962, p. 69). Generally, precipitation in the drainage area ranges from 14 inches at the western end of the valley to 35 inches in the San Gabriel Mountains (California State Water Rights Board, 1962, p. 65); average annual temperature is 63°F.

8
< 37'
\\
INYO
CO
UNTY
H
aiw
ee
TULA
RE
\ltfeserv
or>
C
OU
NTY
121
h
v/w
un i
' \
I -N
-
I20«>
||g
o
36
°^
^
-" -r-f--- ---f.__ _
_i4
._._
,_.
__
- -\
SAN
LUIS
O
BISP
O
COUN
TY rniiN
TY
VENT
URA\
CO
UNTY
I
COUN
TY \
L°S
ANGE
LES
C°UN
TY Los Angel
es - - -
0 25
50
75
10
0 M
ILES
V 116'
SAN
BER
NAR
DIN
O
COUN
TY
RIV
ER
SID
E
COUN
TY
.J"
5010
0 KI
LOM
ETER
S
SAN
DIEGO
j ^ Sea
COUNTY
j IM
PERI
AL COUNTY
_.--
U---
4
V 1
15
FIG
UR
E 1
. L
ocat
ion
of s
tudy
are
a

Numbering System for Suggested Monitoring Sites
The system used herein to designate location of selected monitoring sites is based on the State's we11-numbering system. Wells are numbered according to their location in the rectangular system for the subdivision of public land. That part of the number preceding the slash, as in 2N/16W-31J, indicates the township (T. 2 N.); the part following the slash indicates the range (R. 16 W.); tne number following the hyphen indicates the section (sec. 31); the letter following the section number indicates the 40-acre subdivision accord ing to the lettered diagram below. All wells are north and west of the San Bernardino base line and meridian.
E F G H 2N/16W-31J
B
M L67
18
*st'woli
58
17
2029
32
49
16
21
2833
310
15
22
27
34
211
14
23
2635
112
1324
2536
T. imW
T_5 Nl|
T. 1 N.1
'T. 3 N.N
T. 2 % N.x
T. I N.
L
1
It
>
San Bernardino Base Line

GEOHYDROLOGY
Overview of Basin Geohydrology
San Fernando Valley is composed of unconsolidated deposits and consoli dated rocks (pi. 1). The consolidated rocks, exposed in the surrounding moun tains, form the basement complex of the valley and in most areas define the boundary of the alluvial basin. The consolidated rocks range from Precambrian age for the basement complex to Pliocene age for some of the sedimentary forma tions (California State Water Rights Board, 1962, p. 29). Unconsolidated deposits of Pleistocene and Holocene age compose the valley fill and consti tute the main water-bearing units of San Fernando Valley.
Other water-bearing deposits include the Saugus Formation, the older allu vium, and the younger alluvium. The Saugus Formation, composed of uncemented continental and marine deposits of conglomerate, sand, silt, and clay, is found only in the northern part of the valley where it crops out on the southerly slopes of the mountains (California State Water Rights Board, 1962, p. 32). It probably underlies the younger water-bearing formations in the extreme northern part of the basin. The California State Water Rights Board (1962) recognizes the part of the Saugus Formation overlain by the older and younger alluvium and below the water table as part of the ground-water reservoir. In the areas where it is exposed, such as in Sylmar and the northern part of San Fernando Valley (pi. 1), the Saugus Formation forms the boundary of the basin and is treated as non-water bearing.
Geohydrology of Individual Subbasins
Underlying the valley fill and other water-bearing areas, the San Fernando basin includes the San Fernando and Sylmar subbasins (pi. 1). Sections through the Sylraar and San Fernando subbasins are shown in figure 2.
San Fernando Subbasin
With the exception of its division from the Sylmar subbasin, the boundary of the San Fernando subbasin is the same as that for San Fernando Valley as described in the section, "Description of the Study Area." The Sylmar subbasin is separated from the San Fernando subbasin to the south by the eroded south limb of the Little Tujunga syncline (pi. 1) which causes a break (or offset) in the water table. Water levels on the northwestern side of the syncline have been about 40 to 50 feet higher than the levels on the southeastern side (California State Water Rights Board, 1962, p. 46).

Los Xn^e^es River
AREA OF SYLMAR/ SAN FERNANDO SUBBASIN BOUNDARY
(Ground-water barrier)

^
<D o
_o a
3 un
3-JB
.OJ
C' -120
0'
-lOO
O'
^20
0'
SEA
LEV
EL
200'
Sec
tions
modif
ied f
rom
Cal
iforn
ia
Sta
te W
ater
Rig
hts
Bo
ard
(1962)
For
lo
cati
on
of
se
ctio
ns,
se
e P
late
I
Vert
ical
exag
gera
tion
XIO
0 I
2 M
ILES
I i H
H
0
12
3
KILO
MET
ERS
EX
PL
AN
AT
ION
CL
AY
SA
ND
SA
ND
A
ND
G
RA
VE
LS
ED
IME
NT
AR
Y
NO
N-W
AT
ER
B
EA
RIN
G
RO
CK
S
WA
TE
R
BE
AR
ING
NO
N-
WA
TE
R-
_
BE
AR
ING
Qal
Qoa
l
Qs
Qsm
Tr Tm
T? Be
YO
UN
GE
R
AL
LU
VIU
MO
LD
ER
A
LL
UV
IUM
TE
RR
AC
E D
EP
OS
ITS
S
AU
GU
S
FO
RM
AT
ION
SA
UG
US
F
OR
MA
TIO
NM
AR
INE
F
AC
IES
R
EP
ET
TO
F
OR
MA
TIO
N
MO
DE
LO
FO
RM
AT
ION
U
ND
IFF
ER
EN
TIA
TE
DT
ER
TIA
RY
B
AS
EM
EN
T C
OM
PL
EX
FIG
UR
E 2
. G
ener
aliz
ed s
ecti
on
s sh
owin
g w
ells
loc
ated
app
roxi
mat
ely
alon
g A
-A1,
B-B
', an
d C
-C1.

West of Pacoima Wash (pi. 1), the valley fill of the San Fernando subbasin is composed of materials that have a high clay content. Movement of water in this area is relatively slow--probably about 5 to 10 feet per year--because of the clay and resulting decreased porosity. East of Pacoima Wash, most of the material forming the aquifer is sand and gravel. In these materials, water levels fluctuate with precipitation and irrigation withdrawal, which might indicate water-table conditions. Ground-water mounds are developed around certain wells, suggesting that water from deeper confined zones is leaking into the shallow zone in the alluvium (California State Water Rights Board, 1962, p. 44-48).
In the western part of the subbasin, local thin sedimentary beds contain water under pressure. Some confined zones are also located in the western part of the subbasin. These appear to be in aquifers formed by shallow, older material that is overlain by younger alluvium (California State Water Rights Board, 1962, p. 46 and 48). However, areas where ground water occurs under water-table versus confined conditions are not well defined.
The older alluvium in the subbasin is composed of coarse-grained unconsol- idated deposits (California State Water Rights Board, 1962, p. 33). Deposition of this material was from modern streams during earlier periods of erosion and deposition. These deposits have greater permeabilities than those of the Saugus Formation, though the permeabilities vary according to the source. Ground water moves readily through these deposits, probably on the order of several tens to 100 to 200 ft/yr.
According to the California State Water Rights Board (1962, p. 34), "Recent deposits east of Pacoima Wash and north of the Los Angeles River consist of predominantly coarse accumulations of boulders, gravels, and sands in the form of coalescing alluvial fans derived primarily from basement complex sources. West of Pacoima Wash and south of the Los Angeles River, the sedi ments are derived primarily from sedimentary rocks and are finer grained and deposited in much the same manner as the underlying older alluvium." Because of these geological differences, the major well fields are east of Pacoima Wash.
Two major faults, the Verdugo and the Northridge Hills, influence ground- water movement and levels in the San Fernando subbasin (pi. 1). The Verdugo fault, which runs along the southwesterly base of the Verdugo Mountains from Eagle Rock northwesterly toward Pacoima, has a controlling influence on water levels. In the Glendale area, depth to bedrock and water-level differences of 300 feet across the fault indicate a bedrock displacement along the Verdugo fault. These water-level differences are less when the Hansen spreading grounds are in operation. The Northridge Hills fault probably affects the movement of ground water, but data are insufficient to assess its influence (California State Water Rights Board, 1962, p. 35-36). Other faults, synclines, and anticlines are shown on plate 1.
The direction of ground-water movement in this subbasin is perpendicular to the water-level contours (pi. 5)--roughly parallel to that of the surface water--from the periphery of the subbasin toward the lower areas and out the southeastern corner near Burbank.
10

Sylmar Subbasin
The Sylmar subbasin is bounded by the San Gabriel Mountains on the north, the Mission Hills on the southwest, the exposed Saugus Formation of upper Lopez Canyon on the east, and the eroded south limb of the Little Tujunga syncline on the south (pi. 1) . Faulting and folding of non-water-bearing materials and the water-bearing Saugus Formation in the Sylmar subbasin have produced complicated geology. The most important geologic factor of the subbasin in relation to ground water is the Little Tujunga syncline, which affects at least 6,000 feet of the thickness of the Saugus Formation and a greater thickness of non-water bearing sediments. "The syncline has been truncated by erosion and covered by a thin blanket of older and younger alluvium" (California State Water Rights Board, 1962, p. 51-52).
The following summary from the report by the California State Water Rights Board (1962) describes the effects of this syncline on water levels of the Sylmar subbasin geology:
"l. Water levels northwesterly of the break in water surface are about 50 feet higher than those to the southeast of the break.
2. Water levels northwesterly of the break are related to the eroded ends of confined aquifers in the Saugus Formation.
3. Water levels southeasterly of the break are free ground-water levels and are associated with coarse alluvial deposits which had the Pacoima drainages as a source area.
4. The discordance in water levels is related to the eroded south flank of the Little Tujunga syncline which has been covered with a thin veneer of alluvium.
5. Subsurface flow from the Sylmar subbasin into the San Fernando sub- basin occurs only at two places; namely, the Sylmar and Pacoima notches [which are buried stream channels filled with alluvium that are cut into underlying, older material having a low permeability]. There is hydraulic continuity between the confined aquifers and the veneer of alluvium that overlies that eroded south flank of the Little Tujunga syncline.
6. Continuity exists between the Sylmar and San Fernando subbasins through the saturated alluvium in the two notches.
7. The configuration of the break in water surface through the Sylmar and Pacoima notches is not sharp as would be caused by a fault but is a steep gradient which is similar to that found in a ground-water cascade."
Ground water flows from the periphery of the Sylmar subbasin to the notches described above and thence to the San Fernando subbasin as mentioned above. In 1888, the Pacoima submerged dam at the Pacoima notch was constructed to retard the flow of ground water from the Sylmar subbasin. Confined aquifers in the Saugus Formation provide all the water for the subbasin, though there is an area of unused free ground water in the south-central part of the subbasin.
11

Ground-Water Inflow and Outflow
In order to select sites for monitoring wells, it was necessary to have a general idea of the inflow and outflow of water in the basin. The inflow, depending on its quantity and quality, can significantly improve or degrade the water quality of the aquifer. This section provides general indications of the amounts and sources of recharge and discharge. The information was compiled from an annual publication by the Upper Los Angeles River Area Watermaster (1981).
Recharge to San Fernando Valley is derived from precipitation onto the valley floor, runoff from precipitation on the surrounding hills and mountains, and from imported water via the Colorado River aqueduct, the California Water Project, and the Los Angeles aqueduct.
The 25-year runoff average from hill and mountain areas was 35,450 acre-ft to the San Fernando subbasin and 7,050 acre-ft to the Sylmar subbasin (California State Water Rights Board, 1962, p. 76). Average precipitation over San Fernando Valley for the 1980 water year was 30.25 inches (Upper Los Angeles River Area Watermaster, 1981, p. 11). For the same year, precipitation over San Fernando Valley and its drainage area amounted to 923,000 acre-ft (Upper Los Angeles River Area Watermaster, 1981, p. 7). Of this, the Los Angeles County Flood Control District and the city of Los Angeles were able to recharge 47,852 and 5,448 acre-ft in their respective spreading basins (Upper Los Angeles River Area Watermaster, 1981, p. 8). The largest amount recharged, 31,087 acre-ft at the Hansen spreading grounds below Hansen Dam, was composed primarily of runoff from the San Gabriel Mountains via Big Tujunga Creek (Upper Los Angeles River Area Watermaster, 1981, p. 16). The second-largest amount 15,583 acre-ft at the Pacoima spreading grounds, was runoff from the San Gabriel Mountains via Pacoima Creek.
The total amount of water infiltrated at spreading basins in San Fernando Valley in 1980 was about 73,500 acre-ft. Imported water, which is one of the major sources of water supply for southern California, comprised only 20,200 acre-ft of the amount spread. Although only 20,200 acre-ft of imported water was spread, a total of 540,231 acre-ft was imported to the basin. Of this, 62,477 acre-ft came from the Metropolitan Water District with the remainder coming from the Owens River via the Los Angeles Aqueduct (Upper Los Angeles River Area Watermaster, 1981, p. 8). From the 540,231 acre-ft of water import ed, 255,543 acre-ft was subsequently exported from the basin to the city of Los Angeles.
The drainage system within the San Fernando subbasin consists of the Los Angeles River and its tributaries. Urbanization of the San Fernando sub- basin has led to increased impervious areas, especially in the foothills. The effect of this increase is that more precipitation is falling on impervious surfaces and is collected by storm drains, routed in concrete-lined channels to the Los Angeles River, and then discharged from the subbasin resulting in a decrease in the "natural" recharge.
12

For the San Fernando subbasin, a total of 63,000 acre-ft was pumped from the ground-water system in the 1980 water year (Upper Los Angeles River Area Watermaster, 1981, p. 26). For the Sylmar subbasin, 6,100 acre-ft of ground water was extracted for the same water year. (Ground-water-level contours for the San Fernando and Sylmar subbasins for autumn 1980 are shown on plate 5.)
Historical Water-Level Fluctuations
Data from the California State Water Rights Board (1962) show that in a small part of the western area of the San Fernando subbasin during the period 1931-58, water levels rose from a few inches to as much as 30 feet, but in most of the area east of Balboa Boulevard water levels declined from 10 to 20 feet to as much as 110 feet. In the eastern part of the subbasin from 1942-44 to 1966-67, water levels generally declined from 80 to 190 feet (Upper Los Angeles River Area Watermaster, 1981). Between 1967 and 1977 a slight recovery occur red, followed by another decline to about the 1966-67 lows. Since 1977, water levels have generally risen about 10 to 100 feet because of above-normal rain fall and spreading operations. Water-level fluctuations in the Sylmar subbasin reflect a similar pattern, but of less total change.
WATER QUALITY
Ground-water quality in the eastern part of the San Fernando subbasin deteriorated between 1953 and 1973. According to the Los Angeles Department of Water and Power (1977, p. 1), concentrations of dissolved solids increased as much as 40 percent. This increase is shown when comparing plate 2, which has selected ranges of dissolved solids in 1950, to plate 3, which has 1970 data. Greater permeabilities in the eastern part of the subbasin have led to pumping in excess of the safe yield. Water-level decline in the western half (generally west of the Pacoima Wash) of the San Fernando subbasin probably caused the trapped water in hill and mountain areas to flow into the eastern well fields which raised the dissolved-solids concentration of the pumped water (Los Angeles Department of Water and Power, 1977, p. 3). However, other exter nal sources may have contributed to this increase in dissolved solids.
The majority of the streams in the western part of the San Fernando sub- basin are underlain by sedimentary rocks which contain gypsum, thereby produc ing runoff high in calcium sulfate. The streams in the eastern part of the subbasin, with runoff from areas that are granitic (from basement complex), produce a predominantly calcium carbonate water (California State Water Rights Board, 1962, p. 100-103).
The following sections on "imported Water," "Surface Water," and "Ground Water" summarize the water quality in the San Fernando Valley and are extracted from a report by the Upper Los Angeles River Area Watermaster (1981, p. 24-25).
13
Imported Water
Owens River-Mono basin water is sodium bicarbonate in character and is the highest quality water available to the area. Before 1969 the dissolved-solids concentration averaged approximately 210 mg/L for 30 years with the highest re cord being 320 mg/L on April 1, 1946, and the lowest, 150 mg/L on September 17, 1941. The average dissolved-solids concentration for 1979-80 was 177 mg/L, which was higher than the 160 mg/L for 1978-79. This increase in dissolved solids was caused by a decreased export of streamflow (90 mg/L average) and a greater export of pumped ground water (195 mg/L average) from Owens Valley.
Colorado River water is predominantly sodium calcium sulfate in character, changing to sodium sulfate after treatment to reduce total hardness. Between 1941 and 1975, the dissolved-solids concentration was as high as 875 mg/L in August 1955, and as low as 625 mg/L in April 1959. The average dissolved- solids concentration over the 34-year period was approximately 740 mg/L. For 1979-80, the average dissolved-solids concentration was 698 mg/L.
Northern California water (State Water Project water) is sodium bicarbon ate sulfate in character and generally contains less dissolved solids and is softer than local southern California and Colorado River water. Since April 1972 when the northern California water arrived, the dissolved-solids concen tration of the water has ranged from a low of 247 mg/L to a high of 390 mg/L. The average dissolved-solids concentration during 1979-80 was 378 mg/L. Colorado River and northern California water were first blended in May 1975. In the 1979-80 period, the average dissolved-solids concentration was 502 mg/L.
Surface Water
Surface-water runoff contains salts dissolved from rocks in the tributary areas. Predominant cations are sodium and calcium, with sulfate and bicar bonate as anions. In 1979-80, low flows in the Los Angeles River at its out flow from the subbasin had an average dissolved-solids concentration of 670 mg/L and a total hardness of 230 mg/L.
Ground Water
Ground water in San Fernando Valley is moderately hard to very hard. The character of ground water from the major water-bearing formations is of two general types, each reflecting the composition of the surface-water runoff in the area. In the western part of the valley, it is calcium sulfate bicarbonate in character, whereas in the eastern part, including the Sylmar subbasin, it is calcium bicarbonate.
Ground water is generally within the recommended limits of the U.S. Environmental Protection Agency drinking water standards, except perhaps for wells in the western end of the San Fernando subbasin which have excess concen trations of sulfate. Chemical-quality data from wells and sites representative of the San Fernando basin are presented in table 1.
14

LAND USE
Land use is one of the major factors in determining the need for monitor ing wells when selecting sites for an ideal network. In San Fernando Valley, past land use is often as important a criterion as in site selection as current land use. A network of monitoring wells must meet the need of describing the effects of the past widespread agricultural land use on the water table as well as take into account the current problems of urban runoff. In the western part of the valley where the soils are of low permeability, transit time for dissolved chemicals, such as nitrate, to reach the water table can be up to 50 years. Generalized land use in San Fernando Valley is shown on plate 4.
Many types of land use have the potential to cause a specific type of pollution. Sites with these types of land use were selected when designing the ideal network. Generally, networks are established to monitor land uses, such as parks, golf courses, airports, urban areas, and sewage-treatment plants that are associated with ground-water contamination. For example, not all air ports contaminate the surrounding aquifer with toxic organics and jet fuels; however, because airports are a repository for those types of compounds, the potential for contamination exists, thereby establishing the need for monitor ing.
Another way of looking at land use as an indicator of the potential for ground-water contamination is that prior to any development, a monitoring net work would be needed to describe the ambient ground-water quality of an area. As the land use changes and the activity in that area increases, additional sites are needed to monitor the effects of that increased activity. Areas such as airports and industrial developments represent a substantial increase in activity and therefore require additional monitoring sites.
The western half of San Fernando Valley was dominated by irrigated agri culture until 1950. During the same period, the eastern part of the valley was residential but there was an increasing amount of industry. The size of the residential area in the eastern part of the valley increased during the years 1920 to 1950. From 1950 to 1955, the amount of irrigated agriculture in the western half of the valley diminished considerably as residential commu nities, along with business and industry, spread westward. "in 1928-29, irrigated agriculture occupied 47 percent of the valley floor and by 1957-58, constituted only 13 percent of the valley floor. On the other hand, residen tial, commercial, and industrial acreage had tripled during the period 1928 through 1957-58" (California State Water Rights Board, 1962, p. 126). By the 1960's, irrigated agriculture had virtually been eliminated except for some isolated patches throughout the valley.
Urban areas commonly contribute runoff that has a high chemical and bio chemical oxygen demand, and contains lead, cadmium, detergents, and other pollutants. Agricultural areas contribute runoff that is high in dissolved solids, sodium, chloride, and nitrate. Older residential areas that previously used septic tanks for waste disposal produce an effluent that is high in dis solved solids, inorganic and organic nitrogen, fecal coliform bacteria, fecal streptococcal bacteria, and has a high chemical oxygen demand.
15
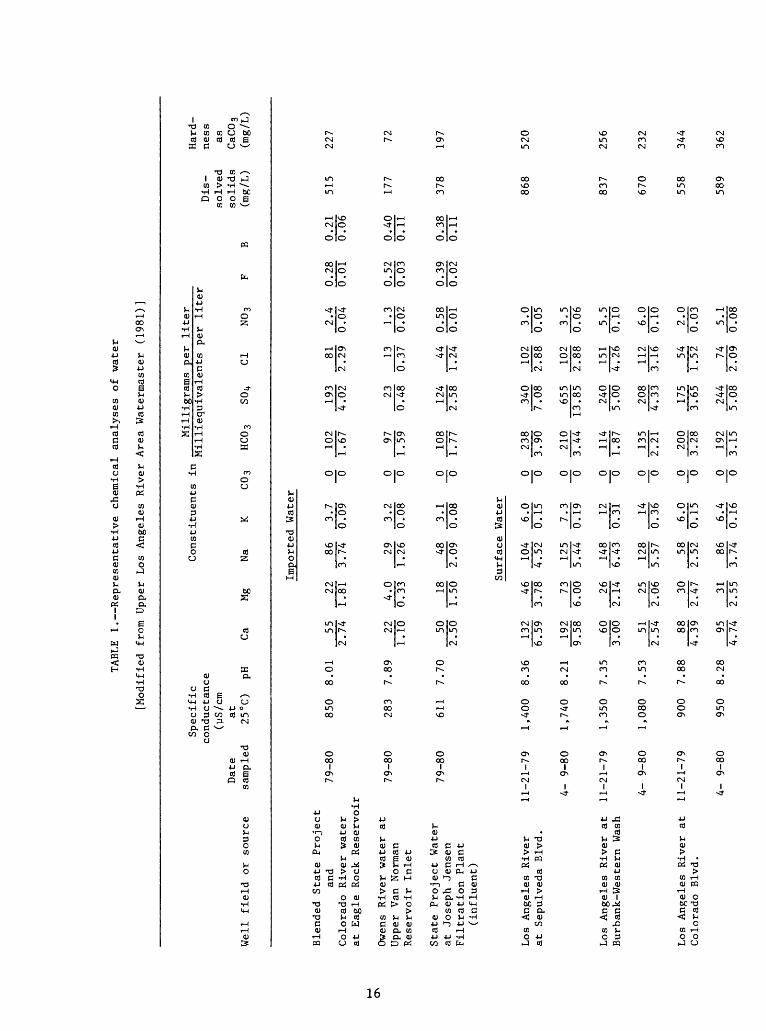
TABLE 1. Representative chemical analyses of water
[Mod
ifie
d fr
om Upper Los
Angeles River Area Watermaster (1
981)
]
Spec
ific
conductance
(yS/cm
Date
at
Well field
or so
urce
sampled
25 °C)
pH
CaMg
Constituents in
Na
K C0
3
Milligrams per
lite
rMilliequivalents pe
r li
ter
m solved
solids
HC0
3 SO
i*
Cl
N0
3 F
B (m
g/L)
Hard
ness
as
CaC0
3 (mg/L)
Impo
rted
Water
Blended State
Project
and
79-8
0Co
lora
do River water
at Eagle Rock Reservoir
Owen
s River water at
..
onTT
TT
XT
/I? 8U
Upper
Van
Norman
Reservoir In
let
Stat
e Pr
ojec
t Wa
ter
7_
__
at Jo
seph
Jensen
Filt
rati
on Pl
ant
(inf
luen
t)
Los
Angeles
River
11-2
1-79
at Sepulveda
Blvd
.
4- 9-
80
Los
Ange
les
River
at
11-21-79
Burbank-Western Wa
sh
4- 9-
80
Los
Angeles River
at
11-2
1-79
Colorado Bl
vd.
4- 9-
80
850
8.01
55
2.74
283
7.89
221.10
611
7.70
50
2.50
1,40
0 8.
36
132
6.59
1,740
8.21
19
29.
58
1,350
7.35
603.
00
1,08
0 7.53
512.
54
900
7.88
884.
39
950
8.28
95
4.74
221.81 4.0
0.33 18
1.50 46
3.78 73
6.00 26
2.14 25
2.06 30
2.47 31
2.55
863.
74 291.26 48
2.09
Surf
ace
104
4.52 125
5.44 148
6.43 128
5.57 58
2.52 86
3.74
3.7
0.09 3.2
0.08 3.1
0.08
Wate
r
6.0
0.15 7.3
0.19 12
0.31 14
0.36 6.0
0.15 6.4
0.16
0 0 0 0 0 0 0 0 0 0 0 0 0 0 0 0 0 0
102
1.67 97
1.59 108
1.77 238
3.90 210
3.44 114
1.87 135
2.21 200
3.28 192
3.15
193
4.02 23
0.48 124
2.58 340
7.08 655
13.85
240
5.00 208
4.33 175
3.65 244
5.08
812.
29 130.
37 441.24 102
2.88 102
2.88 151
4.26 112
3.16 54
1.52 74
2.09
2.4
0.28
0.
21
515
0.04
0.
01
0.06
1.3
0.52
0.40
177
0.02
0.
03
0.11
0.58
0.
39
0.38
378
0.01
0.02
0.
11
3.0
868
0.05 3.5
0.06 5.5
837
0.10 6.0
670
0.10 2.0
558
0.03 5.1
589
0.08
227 72 197
520
256
232
344
362
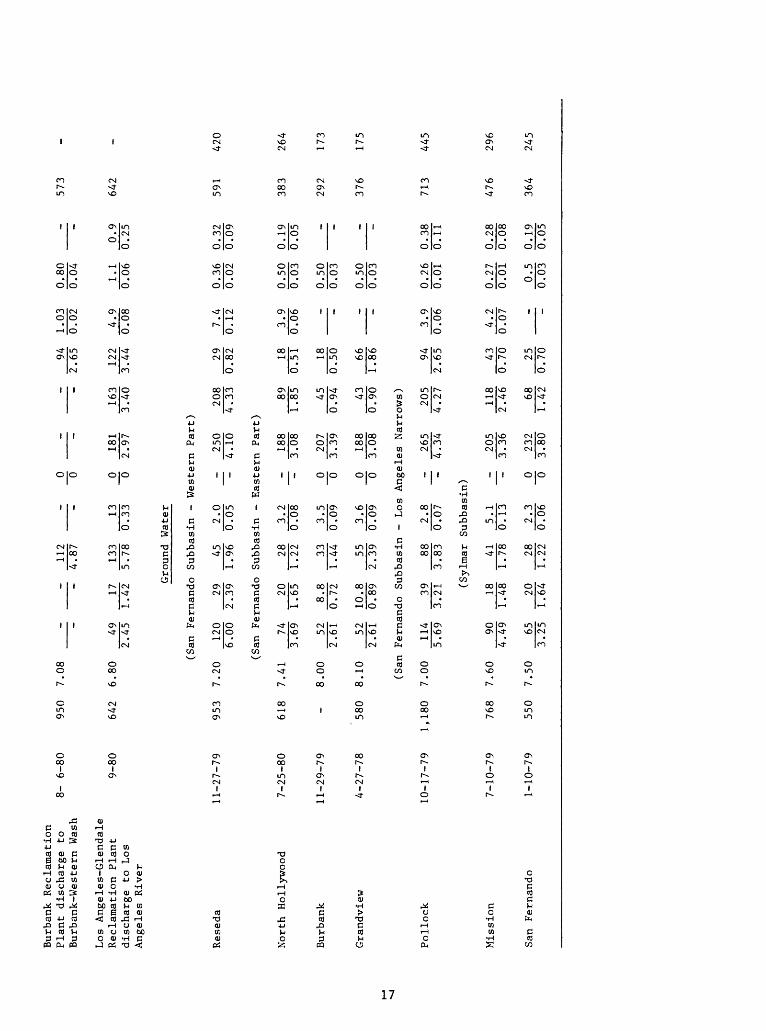
Burbank
Recl
amat
ion
Plant
discharge
to
8- 6-
80Bu
rban
k-We
ster
n Wa
sh
Los
Angeles-Gl
enda
le
Recl
amat
ion
Plant
discharge
to Lo
s An
gele
s Ri
ver
Reseda
North
Hollywood
Burbank
Gran
dvie
w
Pollock
Mission
San
Fernando
9-80
11-2
7-79
7-25
-80
11-2
9-79
4-27
-78
10-17-79
7-10
-79
1-10-79
950
7.08
642
6.80
49
2.45
1.
- 17
112
4.87
133
42
5.78
Ground
(San Fernando
953
7.20
12
0 29
6.00
2.
39
(San Fe
rnan
do
618
7.41
74
203.
69
1.
8.00
52
82.61
0.
580
8.10
52
102.61
0.
(San Fernando
1,18
0 7.
00
114
5.69
3.
768
7.60
90
4.49
1.
550
7.50
65
3.25
1.
65
.8 72
.8
- 130.33
Wate
r
Subbasin -
45
2.0
1.96
0.05
Subbasin -
28
3.2
1.22
331.44
5589
2.
39
Subbasin
39
8821
3.
83
(Sylmar
18
4148
20 64
1.78
281.
22
0.08
3.5
0.09
3.6
0.09
- Lo
s
2.8
0 0 0 0 2
West
ern
- 4
Eastern
- 3
0 0 3
0
-
181
.97 Part
)
250
.10 Part)
188
.08
207
.39
188
-
163
3.40
208
4.33
891.85
450.
94
430
3.08
0.90
Angeles
Narr
ows)
265
205
0.07
- 4
Subb
asin
)
5.1
0.13
2.3
0.06
- 3
0 0 3
.34
205
.36
232
.80
4.27
118
2.46
681.42
942.
65
122
3.44
290.
82
180.
51
180.50
661.86
942.
65
430.70
250.70
1.03
0.02
4.9
0.08
7.4
0.12
3.9
0.06 3.9
0.06
4.2
0.07
-
0. 0.
10.
0. 0.
0. 0.
0. 0.
0. 0.
0. 0.
0. 0. 0 0.
80 04
.1 06
36 02
50 03
50 03
50 03
26 01
27 01
.5 03
-
0.9
0.25
0.32
0.09
0.19
0.05
0.38
0.11
0.28
0.08
0.19
0.05
573
642
591
383
292
376
713
476
364
420
264
173
175
445
296
245
Airports, heavy industry, and landfills are also major potential sources of pollution and must be included in any monitoring network. The Hollywood- Burbank Airport, with its surrounding industrial area, is a major feature of San Fernando Valley. The area encompassing this land has been associated with hazardous organic chemicals and is a key area to the development of an ideal monitoring network.
Any ground-water-quality monitoring network for San Fernando Valley must take into account the potential for contamination. Within San Fernando Valley, 6.0 million gallons of liquid chemicals and 1.1 million pounds of solid chemi cals are used per year (SCS Engineers and Calscience Research, Inc., 1982, p. S-2). Over half of the liquid chemicals are made up of gasoline (SCS Engi neers and Calscience Research, Inc, 1982, p. S-2). The production, handling, storing, use, and disposal of this volume of chemicals represents a signifi cant potential for contaminating the ground water of San Fernando Valley.
Because trichloroethylene, tetrachloroethylene, and carbon tetrachloride have been found in the wells in the North Hollywood area, a major concern is industrial use of the 24,000 gallons of halogenated compounds used annually (SCS Engineers and Calscience Research, Inc., 1982, p. S-2). The toxic wastes generated by industrial use of liquid chemicals in San Fernando Valley amount to almost 7.3 million gallons annually (SCS Engineers and Calscience Research, Inc., 1982, p. S-5). Most of the industries using these toxic chemicals have onsite treatment facilities. Nevertheless, a significant amount of wastewater containing chromium, copper, cyanide, nickel, and zinc is generated in San Fernando Valley.
DISTRIBUTION AND USE OF TOXIC MATERIALS
Many businesses and industries in San Fernando Valley have onsite waste- water treatment and disposal. Even though discharge permits established limits for the quality of the water discharged, the discharge sites within the valley represent a potential for ground-water contamination. For instance, within the North Hollywood area alone over 75 businesses have private disposal systems. Considering the very large number of discharges, identification and location of all the private disposal systems in the basin is a task greater in scope than can be covered in this report. For the purpose of this network design, an effort was made to identify only those areas where there is a high density of these disposal sites. The potential sources of pollution in San Fernando Valley are shown on plate 5. A breakdown of the various types of industries, the number of companies, and the annual quantity of toxic chemicals used is given in table 2. The various chemical wastes, the number of companies, and the annual quantity of generated wastes are presented in table 3. The number of pounds of solid toxic chemicals used annually in San Fernando Valley is given in table 4.
Within San Fernando Valley there are 39 dischargers that release effluent into various tributaries of the Los Angeles River and operate under permits issued by NPDES (National Pollutant Discharge Elimination Systems) (Los Angeles Department of Water and Power, 1982a, p. 8). Some of the tributaries receiving effluent are Bell Creek, Bull Creek, Tujunga Wash, Burbank Western Wash, and
18

Verdugo Wash. According to a Los Angeles Department of Water and Power report (1982a), "Of these 39 NPDES permittees, 21 discharge cooling tower waters; 7 discharge swimming pool wastewater, fountain water, or artificial lake over flow; 4 permittees discharge film rinse water; and 7 discharge miscellaneous waste streams." These surface-water releases are regulated and monitored; nevertheless they present the potential for ground-water contamination in the area of the unlined reaches of the Los Angeles River, and therefore are considered in the network design.
TABLE 2.--Industries in San Fernando Valley using toxic chemicals
[Data from SCS Engineers and Calscience Research, Inc., 1982]
Number of Annual quantity Industry companies (gallons)
Construction 6 6,205Furniture manufacturing 3 11,300Printing and publishing 26 5,627Chemical manufacturing 27 165,556Miscellaneous plastic products 2 300
Fabricated structural metal products 28 11,149Screw machine products 6 505Metal stamping 7 750Metal coating 26 14,367Miscellaneous fabricated metal products 7 763
Metal working machinery 11 1,735Special industrial machinery 5 703Miscellaneous machinery 127 18,919Electronic components 2 27Motor vehicle equipment manufacturing 3 725
Aircraft and parts manufacturing 41 1,973,815 Instruments, photographic equipment,
and optical goods 7 391Miscellaneous manufacturing 9 3,410Public warehousing 1 90,000
Water transportation services 1 360Machinery (wholesale) 3 250Chemicals (wholesale) 7 1,850Alcoholic beverages 2 732,000Service stations 13 2,954,594
Reproduction, commercial art 6 1,415Building services 6 287Automotive services 123 10,830Miscellaneous repair services 7 590Motion picture production services 2 ______400
Total 6,008,823
19

TABLE 3.--Toxic wastes generated in San Fernando Valley
[Data from SCS Engineers and Calscience Research, Inc., 1982]
Type of chemical wasteCompanies Annual quantity
producing waste (gallons)
Aliphatic solventsChlordaneChromium solutionsCopper solutions
Cyanide solutionsHalomethanesHeavy metals, mixed or unspecifiedInsecticides, unspecifiedKetones
Nickel solutionsOils, wastePaints/ lacquersPetroleum distillates
Photographic chemicalsSludges, toxicSolvents, halogenated, mixed
or unspecifiedSolvents, nonhalogenated, mixed
or unspecifiedTetrachloroethylene
Toluene1, 1, 1-TrichloroethaneZinc solutions
Total
1131
11211
1107
11
1162
7
1
431
1260
4,225,000130,000
150,00052,000
1,750,05512010
130,000107,987
250200
251,23616,7503,720
7,455
110
982360
500,0007,326,307
Effluent from the Burbank and Los Angeles-Glendale Water Reclamation Plants is discharged to the Los Angeles River. During the 1980-81 water year, these two plants discharged approximately 13,600 acre-ft/yr of wastewater, which accounted for 56 percent of the annual baseflow in the Los Angeles River (Los Angeles Department of Water and Power, 1982a, p. 9). The major reason these discharges and those of the NPDES permittees are considered potential pollution sources is that the Los Angeles River below Sepulvada Dam has two unlined reaches in which infiltration to the ground-water table can occur. Because of the potential for ground-water contamination in these unlined reaches, the design of the ideal network must take these areas into account.
20

TABLE 4.--Solid toxic chemicals used in San Fernando Valley
[Data from SCS Engineers and Calscience Research, Inc., 1982]
ChemicalAnnual quantity used
(pounds)
AminesAntimony compounds Beryllium Chromium compounds Copper compounds Cyanides Lead compounds Nickel compounds Petroleum products ThiramZinc compounds
Total
4004,000
552,048
2503,6399,9001,200
1,000,000225
33,4001,055,117
Landfills are another important potential source of ground-water contam ination within San Fernando Valley. There are over 65 active, inactive, or proposed landfill sites in San Fernando Valley (Los Angeles Department of Water and Power, 1982b). Although Group 1 wastes (toxic substances that could impair ground-water quality) are not permitted to be disposed of in San Fernando Valley, current monitoring wells located downgradient of some sites have shown increases in carbon dioxide and methane (indicators of gas production in land fills); trichloroethene, tetrachloroethene, and nitrate, and have dissolved- solids concentrations above background levels (Los Angeles Department of Water and Power, 1982b, p. 28-30). According to the Upper Los Angeles River Area Watermaster (1980):
Following the discovery of trichloroethene (TCE) in four San Gabriel Valley wells in January 1980, and at the request of the State Depart ment of Health Services (SDKS), a survey of Los Angeles City wells for TCE was initiated on January 17, 1980, by DWP. The survey was again expanded to include tetrachloroethene (PCE) on July 21, 1980. The survey was again expanded to include carbon tetrachloride (CTC) on September 26, 1980. By September 30, 1980, there had been 80 wells tested for TCE; 67 wells tested for PCE; and 25 wells tested for CTC. During this test period, 16 wells exceeded the SDKS action level (5 ppb) for TCE. As testing proceeded over the approximate eight-month period, some wells increased from below to above action level for TCE and some decreased from above to below the action level for TCE. The highest values measured during the DWP survey were 31 ppb for TCE and 31 ppb for PCE through September 30, 1980. Testing for these constit uents is continuing. The blend of water served to consumers has not exceeded the SDKS action levels of 5 ppb for TCE, A ppb for PCE, and 5 ppb for CTC since testing began for these constituents by DWP.
21

Although current regulations control the location, design, and operation of landfills, prior to 1949 they were virtually unregulated as to both location and operation. It was not until 1978 that an impervious liner was required on the bottom of landfills in San Fernando Valley to prevent ground-water contam ination by landfill leachate (Los Angeles Department of Water and Power, 1982b, p. 7).
NETWORK DESIGN
The geohydrology, land use, water quality, and potential sources of pollution of San Fernando Valley described heretofore provide the basis for selecting sites for the ideal monitoring network. The geohydrology, land use, and water quality are used to indicate either the presence of or the potential for a water-quality problem that would result in contamination of the ground water.
The first step in the design of the monitoring network was to determine the monitoring objectives for the basin. The second step was to prioritize these objectives according to their potential impact upon the utilization of ground water within the basin. The third step was to develop a specific mon itoring network for each of the objectives. The final step was to combine the individual networks into one cohesive basinwide monitoring network. The following are the proposed ground-water-quality monitoring objectives for San Fernando Valley:
1. Determine ambient water quality2. Monitor nonpoint sources of pollution
a. Agricultural areasb. Industrial areas (including airports) c. Private disposal areas
3. Monitor line sources (unlined reaches of Los Angeles River)4. Monitor point sources of pollution
a. Landfills b. Sites where toxic organic pollutants have been detected.
An ideal monitoring network was developed for each of the objectives listed above.
Present or potential sources of pollution (pi. 5) as determined by land use, geohydrology, or water-quality data were major site-selection factors. A monitoring site was selected within the immediate influence of each of the pollution sources to determine the quality of the water. From the ground-water contours (pi. 5), probable flow lines were projected and monitoring sites were selected downgradient of the pollution source to monitor the movement of the plume of pollution. The distance between the site and the source of pollution was determined by a combination of the velocity of ground-water movement, the frequency of sampling, and the presence of any ground-water recharge or dis charge. Where major areas of ground-water use are located downgradient of a pollution source, monitoring sites were usually spaced closer to the source in order to maintain surveillance of the movement of the plume of pollution.
22

Sampling frequency can be increased or decreased in order to detect the pres ence of the pollutant prior to its arrival at the area of water use in suffi cient time that management plans can be initiated to prevent contamination of the water supply.
Sampling frequency was determined according to the source of pollution, the importance of the water, and the rate of ground-water movement (the higher the rate of movement, the more frequent the sampling interval). In areas that have been designated as well fields (intensive concentrations of public supply wells and heavy pumping in areas of high permeability), the sampling frequency is usually annual. Monitoring sites located at greater distances from pollu tion sources are usually monitored every 2 years. Areas that have slower ground-water velocities generally have sampling frequencies of 3 to 5 years. However, in a few cases, ambient water-quality areas of slow ground-water movement and no major present or potential sources of pollution have sampling frequencies of 5 to 10 years. Even though ground water will move only 50 to 100 feet in 10 years in the southwestern part of San Fernando Valley, sampling frequencies of 5 to 10 years are still recommended because drastic changes in land use can occur in that period.
In addition to monitoring potential or present sources of pollution in areas of major land use, monitoring sites for ambient water quality were also selected in areas where no major land-use features associated with pollution existed. These monitoring sites were often set up along ground-water contour lines to detect any pollutants in the flow perpendicular to the contours along a broad advancing front. By setting the sites on equal contour lines, an early- warning network of sites oriented toward ground-water movement is achieved. The lateral spacing of the sites is based primarily on the number of upgradient potential sources of pollution and the density most likely to detect the movement of a dispersing and migrating pollutant.
The idea of early-warning lines is carried over to the area in the south eastern part of San Fernando Valley where the soil is most permeable and the greatest densities of water-supply wells are located. These lines of monitor ing sites are located upgradient of the major well fields to intercept and detect the advance of any pollutants.
In industrial areas where no toxic constituents have been detected, the area is treated as a potential nonpoint source. The Los Angeles Department of Water and Power has identified an area west of the Hollywood-Burbank Airport as having the greatest density of private disposal systems (Los Angeles Depart ment of Water and Power, 1982a, p. 1). This area is also treated as a nonpoint source of pollution even though it is made up of many point sources.
The sites for the different monitoring objectives, which are included in the ideal water-quality network, are given in the following tables: the ambient monitoring network (table 5), the nonpoint-sources monitoring network (table 6), the line-sources monitoring network (table 7), and the point-sources monitoring network (table 8). The ideal network (comprised of the sites in tables 5, 6, 7, and 8) is presented in table 9 (at end of report). In addition to site locations for each network, this table includes the constituents to be sampled, sampling frequency, and the reason for site selection. Locations of the sites for the ideal network are shown on plate 6.
23

TABLE 5.--Ambient monitoring network
[Site location: Gives location of sites using State we11-numbering system but does not refer to any existing wells]
Index Index Index No. Site No. Site No.
(pi. 6) location (pi. 6) location (pi. 6)
1314152122232430353941424344454647484977838485868889909192949596979899
100101102113116
1N/13W-21E20R21A17P18H18D
1N/14W-24C22B20H16J30A19F18L07L08M08M08F08G08Q09J03A02K12F06M
1N/15W-24L24C13F12F01F02P11M14M16P10M03M03B04E08H18Q
1N/16W-01L
117118119120121122123124128129130131132133134135136137138139140141142143144145147148149150151152153154155156157163164165
1N/16W-13K14F10H03J02C09H04A04Q06F
1N/17W-12F01N01D
2N/17W-36M36F25R
2N/16W-36G25K24K34J35C26K26B23G13M13F12R31J29P22J28F28A22E15A15JIIPUK12D17R17J17G
166167173B180181182185190191192193194195196197198204205206207208209210211215218219220221222223224225226227228239240241242
Index Site No. Site
location (pi. 6) location
2N/16W-18J18M
2N/15W-34H28R27L26C24D29P29H28B22P23E20N20H15P14K11A02R18H17G16E16A10L03R36N09F07E08D03D03E03F
3N/15W-33R34E34A35B36M28J
2N/14W-32H32K32M
243253254258259260261262263264265266267268269270271272273274275276277278279280281282283284285286287288289290291
2N/14W-31Q19K19M06E
1N/16W-05C2N/16W-32R
33G34C28P33G
3N/15W-31D30K30H20P2 IN22P23N25C
2N/14W-09G09H10L11M11Q14A12P13B
2N/13W-18Q20D2 IN21Q28L34D34M
1N/13W-03F10C10P15L
24

TABLE 6.--Nonpoint-sources monitoring network
[Site location: Gives location of sites using State we11-numbering system but does not refer to any existing wells]
Index No.
(pl. 6)
456789
101112171819202627282930313233343536373839454647484950515253
Site location
1N/13W-32M32M32L32K32E32F32G30R30A19L19G16Q16N
1N/14W-23C14P14F14H22B22K22P28D06M2 OH16N16L16G16J08M08M08F08G08Q07H07A07A06R
Index No.
(pl. 6)
545556596061626364656667686970717273747578798081828687929398
100103104105106107
Site location
1N/14W-05M05 L05P07D06N06M06E06E06D06C06B06G08H08A04M04M04L04K04P04A10D10B10H03P11L06M06K
1N/15W-01F02A10M03B09L17K08L05M05D
Index No.
(pl. 6)
108109110111112114115125126127146147148149150151152153154155156157160161162168171172173A174175176177A177B178179
Site location
1N/15W-06G06K07B07F07Q
1N/16W-12E12C07H08D05P
2N/16W-31K31J29P22J28F28A22E15P15JIIPUK12D30B20L21P
2N/15W-36K25N36D34M33K32J31L3 IN31F31P32Q
Index No.
(pl. 6)
183184188189199202203209210211212213214215216217218221222223229230231232233234235236237238240244256257258
Site location
2N/15W-24N25D13J13R15M11D11M16A10L03R02N02K02A36N02A09D09F03D03E03F
3N/15W-26R35A26M27R33F33L29R29R29H28H
2N/14W-32H3 1C19B19E06E
25

TABLE 7.--Line-sources monitoring network
[Site location: Gives location of sites using State we11-numbering system but does not refer to any existing wells]
Index No. (pl. 6)
123456789
10111216
Site location
1S/13W-04M04P09B
1N/13W-32M32M32L32K32E32F32G30R30A19E
TABLE 8.--Point-sources monitoring network
[Site location: Gives location of sites using State we11-numbering system but does not refer to any existing wells]
Index No. (pl. 6)
123
162533405051525354555657586869707172
Site location
1S/13W-04M04P09B
1N/13W-19E1N/14W-24D
28D29H07H07A07A06R05M05L05P08D08C08H08A04M04M04L
Index No. (pl. 6)
73767787158159169170186187200201245246247248249250251252255
Site location
1N/14W-04K09H09J06K
2N/16W-27F27G
2N/15W-36B36B25D24P10P15R
2N/14W-31G31A19P19R20P20L20L20F19G
26

SUMMARY
The purpose of this study was to develop an ideal or conceptual ground- water-quality monitoring network for San Fernando Valley. This report presents the network design with the recommended constituents to be sampled, the fre quency of sample collection, and the rationale for site selection. Background information on the geohydrology and land use; nonpoint, line, and point sources of pollution; and water quality of San Fernando Valley was compiled and is included to show the reasoning behind the selection of the sites.
SELECTED REFERENCES
California Department of Water Resources, 1975, California's ground water:Bulletin 118, 135 p.
California State Water Rights Board, 1962, Report of referee, City ofLos Angeles vs. City of San Fernando: In the Superior Court of theState of California in and for the County of Los Angeles, No. 650079,v. 1, 258 p.
Los Angeles Department of Water and Power, Sanitary Engineering Division,1977, Salt balance and groundwater quality trends in the San FernandoValley: Report No. 77-22, 52 p.
-----1982a, Report on dry weather drainage, San Fernando Valley basin ground- water quality management plan: 18 p.
-----1982b, Report on landfills, San Fernando Valley basin groundwater qualitymanagement plan: 30 p.
SCS Engineers and Calscience Research, Inc., 1982, Final report: Industrialsurvey and development of best management practices, ground water qualitymanagement plan, San Fernando Valley basin: 74 p.
Upper Los Angeles River Area Watermaster, 1980, Watermaster service in theupper Los Angeles River area, Los Angeles County, October 1, 1978 -September 30, 1979: 46 p.
-----1981, Watermaster service in the upper Los Angeles River area, Los Angeles County, October 1, 1979 - September 30, 1980: 51 p.
27

TA
BLE
9
.--S
an
F
ern
an
do
b
asin
gro
und-w
ate
r-quality
m
on
ito
rin
g
netw
ork
N3
00
Index
No.:
A
conv
enie
nt numbering
syst
em fo
r th
e sites
of the
idea
l network.
Numbers
are
shown
on plate
6.
Site
lo
cati
on;
Gives
loca
tion
of sites
usin
g State
well-
numb
erin
g system
bu
t does not
refer
to an
y ex
isti
ng
we I
Is.
Moni
tori
ng ob
ject
ive:
Determine
the
quality
of gr
ound
water in the
San
Fernando Valley;
ambi
ent, surrounding
on all
sides; nonpo in
t. agricultural,
industrial,
and
private
disp
osal areas;
I ine
. unlined
reac
hes
of the
Los
Ange
les
Rive
r; po
int.
land
fill
s, and
site
s wh
ere
toxic
orga
nic
pollutants have been dete
cted
.
Well
de
pth
and
(perforated
inte
rval
):
The
firs
t nu
mber
in th
e parenthesi
s minus
10 feet shows
dept
h to water
in au
tumn
19
80.
For
example, for
index
number 1,
the
depth
to water is
30 fe
et (4
0 feet minus
10);
the
per
forated
inte
rval
is
40 to 10
0 fe
et.
Consti
tuents to be sampled:
DOC:
Diss
olve
d organic
carbon.
Specific co
nduc
tance:
Specific co
nduc
tanc
e at 25
°C
(for
all
sites
where
spec
ific
co
nduc
tanc
e is used,
pH and
temperat
ure
also should be
me
asured).
Toxi
c organic
subs
tanc
es:
Incl
udes
analysis for
tric
h lo
roet
hyle
ne,
perc
h lo
roet
hy len
e, carbon te
tra-
ch
lori
de,
and
other
indu
stri
al organic
substances.
Trac
e el
emen
ts:
Silver,
alum
inum
, ar
seni
c, barium,
beryllium, ca
dmium, chromium,
copper,
merc
ury,
nickel,
lead,
scandium,
and
zinc.
Inor
gani
c constituents and
properties:
Alkalinity,
boro
n, ca
lciu
m, chlorine,
iron
, hardness,
pota
ssiu
m,
nitrate, si
lica
, and
sulfate.
Nutr
ient
s:
Diss
ojve
d nitrite
plus
nitrate
as nitrogen,
dissolved
ammo
nium
as nitrogen,
dissolved organic
nitrogen as ni
trogen,
and
diss
olve
d orthophosphate as
phosphorus.
Diss
olve
d so
lids
: Residue
on evaporation at
180
C.
Samp
ling
frequency;
I u
t i o n
is
taken
annua
2,
3, 5,
or
10 ye
ars.
-,_.
._.,
. Where in
filt
rati
on of industrial po
I -
poss
ible or
TCE
has
been
detected,
samp
les
are
ally;
if contamination
is not
detected,
eve
ry
Re
aso
n fo
r sele
ction:
Site
sele
ction
an
d
fre
qu
en
cy o
f sam
plin
g
is
base
d
on g
rou
nd
-wa
ter-
qu
ality
co
nd
itio
ns
in
the valley.
A basin
wid
e
netw
ork
to
m
onitor
am
bie
nt
gro
un
d-w
ate
r q
ua
lity
w
ould
d
ete
rmin
e p
ote
ntia
l sourc
es of
po
I Iu
t io
n.
1 ndex
No.
(pl. 6)
1
Site
lo
cat io
n
1S/1
3W-0
4M
Mon
i tor
i ng
obje
ctiv
e
Poin
t,
I in
e
We I
I de
pth
and
( Per
forated
interva
I ),
i n feet
100
(40-100)
Cons
t i tue
nts
to be sa
mple
d
DOC, sp
ecif
ic
cond
ucta
nce,
toxic
orga
nics
Samp
I in
g frequency
Annu
a I Iy
This site is
TCE
has
been
gradient and
Reason for
selection
loca
ted
in a
we I
I detected.
Site
i
in the
flow
I in
es
fiel
d whe re
s down-
of an
unlined
reach
of
the
Lo
s A
ngele
s
Riv
er
(5,0
00
fe
et
or
about
15 years
) w
he
re
infiltra
tio
n of
ind
ustr
ial
po
llu
tan
ts
is
possib
le.
1S
/13
W-0
4P
Po
int,
I in
eTO
O
(10
-50
)D
OC
, specific
conducta
nce,
toxic
org
anic
s
An
nu
aII
y
if
TCE
is
p
rese
nt;
every
5
yea
rs
i f
not
Locate
d
1,5
00
fe
et
dow
ngra
die
nt
and
flo
w
I in
es of
site
1.
i n
the

TA
BLE
9.-
-San
Fe
rna
nd
o
ba
sin
gro
und-w
ate
r-quality
m
onitoring
ne
two
rk C
on
tin
ue
d
N)
I ndex
No.
(Pi.
6)
3 4 5 6 7 8 9 10
Site
loca
t io
n
1S
/13
W-0
9B
1N/1
3W-3
2M1
N/1
3W
-32
M1
N/1
3W
-32
L1N
/13W
-32K
1N
/13
W-3
2E
1N
/13
W-3
2F
1N
/13W
-32G
Mon
i to
ri n
gobje
ct
ive
Poin
t,1 in
e
Lin
e,
nonpo in
t
Lin
e,
nonpoin
t
Wel
1
depth
and
( P
erf
ora
ted
inte
rva 1
),in
fe
et
75
(10-5
0)
100
(26
-60
)10
0 (2
5-6
0)
100
(30
-70
)11
0 (5
0-1
00)
100
(25-6
0)
100
(25
-60
)12
5 (6
0-1
00)
Co
nst
i tuents
to
be
sam
ple
d
DO
C,
sp
ecific
co
nd
ucta
nce
,to
xic
org
anic
s
DO
C,
sp
ecific
co
nd
ucta
nce
,to
xic
o
rga
nic
s,
tra
ce
ele
ments
DO
C,
specific
co
nd
ucta
nce
,to
xic
org
anis
es,
Sam
p 1 in
gfr
eq
ue
ncy
Annua 1
lyif
TCE
is
pre
sent;
eve
ry
5ye
a r
s
i fnot
An
nu
a 1
ly
Every
3
yea r
s
Re
aso
n fo
rse
le
ct
ion
Lo
ca
ted
4,5
00 fe
et
dow
ngra
die
nt
an
d
in
the
pro
bable
flow
lin
es
of
site
2
.
Locate
d
up
gra
die
nt
of
Po
llo
ck w
ell
field
to
inte
rcept
flow
lin
es
fro
m
unlined
reach o
fL
os
An
ge
les
Riv
er,
in
du
str
ial
are
a,
an
dsew
age-t
reatm
ent
pla
nt.
T
he
se site
s
are
to
serv
e
as
an early w
arn
ing
pe
rim
ete
raro
und
the
Pol
lock w
ell
fie
ld.
Lo
ca
ted
about
1,7
50
fe
et
up
gra
die
nt
of
site
s
4 th
rou
gh
7
an
d
in
flo
w
lines
do
wn
-g
rad
ien
t o
f unlined
reach of
Los
Angele
s
11
1N/13W-30R
12
1N/13W-30A
13
1N/13W-21E
trace
elem
ents
, d
i ssoIved so I ids
Line
, no
npoi
nt
Line,
nonpo
i nt
Amblent
100
(10-50)
110
(45-
80)
280
(190
-250
)
DOC, sp
ecif
ic
cond
ucta
nce,
toxic
orga
nics
, trace
elem
ents
, d
i ssoIved so
l id
s
DOC,
specific
conductance,
toxic
organ ic
s,
trace
elem
ents
, d
i sso
Ived
so
l ids
DOC, specific
conductance,
toxic
orga
nics
, trace
elem
ents
, d
i ssoIved so
l ids
Ever
y 2
yea rs
Ever
y 2
year
s
Ever
y 5
yea rs
River,
indu
stri
al ar
ea,
and
sewage-
trea
tmen
t pl
ant.
Si
te 10 located
on the
downgradient end
of the
industrial area.
These
site
s sh
ould
show any effects of
the
indu
stri
al area on ground-water quality and
act
as an early warning indicator
for
the
Pol lock we
I I fi
eld.
Loca
ted
within in
dust
rial
area to determine
any local
effe
cts
on ground-water qu
alit
y.
Shou
ld pick up
in
filt
rati
on by the
unlined
reac
h of
the
Los
Angeles Ri
ver.
Site
is
also
downgradient of a
sewage-treatment
plant.
Loca
ted
within industrial area to
determine
any local
effe
cts
on ground-water qu
alit
y.
In flow li
nes,
picking
up any in
filt
rati
on
by the
unlined
reac
h of
the
Los
Angeles
Rive
r.
Ambient water quality.
TA
BLE
9
. S
an
F
ern
an
do
b
asin
g
rou
nd
-wa
ter-
qu
ality
m
on
ito
rin
g
ne
two
rk--
Co
ntin
ue
d
1 ndex
No.
(pl.
6)
14
15
Site
locat io
n
1N/1
3W-2
0R
1N/13W
-21A
Moni
tori
ng
obje
ct ive
Ambi
ent
Ambi
ent
Wel
1 de
pth
and
( Perforated
inte
rva
1 ),
in feet
250
(150
-200
)
400
(290
-350
)
Const ituents
to be sampled
DOC,
sp
ecif
ic
cond
ucta
nce,
toxic
orga
nics
, tr
ace
elem
ents
, d
i ssol ve
d so
l id
s
DOC, specific
cond
ucta
nce,
Samp
I in
g frequency
Ever
y 5
yea rs
Ever
y 5
year
s
Reas
on for
se lect ion
Ambi
ent
water qu
alit
y.
Ambi
ent
water qu
alit
y.
16
1N
/13
W-1
9E
17 18 19 20 21 22 23
1N
/13
W-1
9L
1N
/13W
-19G
1N
/13W
-16Q
1N
/13W
-16N
1N
/13W
-17P
1N
/13W
-18H
1N
/13W
-18D
1N
/14W
-24C
Poin
t,
20
0
(110-1
60)
I in
e
No
np
oin
t 12
0 (4
5-9
0)
No
np
oin
t 19
0 (9
0-1
40)
52
0
(430-4
80)
330
(23
0-2
80
)
Am
bie
nt
Am
bie
nt
27
0
(170-2
20)
310
(21
0-2
60
) 2
80
(1
80-2
30)
290
(190-2
40)
toxic
o
rga
nic
s,
tra
ce
ele
ments
, d
i ssolv
ed
sol
ids
DO
C,
sp
ecific
co
nd
ucta
nce
, to
xic
org
anic
s,
tra
ce
ele
ments
DO
C,
sp
ecific
co
nd
ucta
nce
, to
xic
o
rga
nic
s,
trace
ele
me
nts
DO
C,
sp
ecific
co
nd
ucta
nce
, to
xic
o
rga
nic
s,
tra
ce
e
lem
en
ts
DO
C,
sp
ecific
co
nd
ucta
nce
, to
xic
org
anic
s,
tra
ce
ele
ments
, d
i ssolv
ed
sol
ids
DO
C,
sp
ecific
co
nd
ucta
nce
, to
xic
org
anic
s,
tra
ce
ele
ments
, d
i ssoIv
ed
sol
ids
AnnuaIly
An
nu
aIly
An
nu
aIly
Every
5
years
Eve
ry
5 ye
ars
Lo
ca
ted
in
w
ell
field
w
here
TC
E
has
been
de
tecte
d.
Site
is
in
flow
path
dow
n-
gra
die
nt
of
an
un
lin
ed
re
ach of
the
L
os
Angele
s
Riv
er
where
in
filtra
tion o
f in
du
str
ial
polluta
nts
is
possib
le.
Locate
d
up
gra
die
nt
of
we
ll
field
. S
erv
es
as
mo
nito
rin
g
site fo
r south
ern
end
of
we
I I
field
.
Site
s
are
lo
cate
d
upgra
die
nt
of
well
field
to
m
onitor
gro
un
d-w
ate
r fjow
to
th
e w
ell
field
a
nd
to
se
rve
as
indic
ato
rs o
f p
ote
ntia
l p
ollu
tio
n
pro
ble
ms.
Site
20
is
lo
ca
ted
in
a
n
industr
ial
are
a
upgra
die
nt
of
the
we
I I
field
.
Am
bie
nt
wate
r quality
.
Am
bie
nt
wate
r quality
.

TABL
E 9.
--Sa
n Fe
rnan
do ba
sin
ground-water-quality mo
nito
ring
network Continued
Index
No.
(Pi. 6)
Site
locat io
nMo
n i tori ng
obje
ct i ve
Wel
1 de
pth
and
( Perf
orat
edinte
rva
1 ),
in fe
et
Cons
t i tue
nts
to be sampled
Samp
1 in
gfrequency
Reason for
se 1 ect ion
25
1N/1UW-2
UD
26
1
N/1
UW
-23
C2
7
1N
/1U
W-1
UP
28
1N
/1U
W-1
UF
29
1N
/1U
W-1
UH
30
1N
/1U
W-2
2B
31
1N
/1U
W-2
2K
32
1N/1UW-22P
33
1N/1UW-28D
Poin
t
Nonpoint
Nonp
oint
, ambient
190
(90-140)
210
(110
-160
) 210
(110
-160
) 210
(110
-160
) 19
0 (90-1UO)
220
(120
-170
)
Nonpoint
190
(90-1UO)
Nonpoint
200
(100
-150
)
Poin
t,
nonpoint
200
(100
-150
)
35
36
37
38
39
1N/1UW-06M
1N/1
UW-2
0H
1N/1
UW-1
6N
1N/1
UW-1
6L
1N/1
UW-1
6G
1N/1UW
-16J
Nonpoint,
ambi
ent
(35, 39)
370
(270
-320
) 230
(130
-180
) 2UO
(1UO
-190
) 230
(130-180)
2UO
(1UO
-190
) 220
(120
-170
)
DOC, specific
cond
ucta
nce,
toxic
orga
nics
DOC,
sp
ecif
ic
cond
ucta
nce,
to
xic
orga
nics
, trace
elements,
d i ssolved so
l ids
DOC,
sp
ecif
ic
cond
ucta
nce,
toxic
orga
nics
, trace
elements
DOC,
sp
ecif
ic
cond
ucta
nce,
toxic
orga
nics
, tr
ace
elem
ents
DOC, specific
cond
ucta
nce,
toxic
orga
nics
, trace
elements
DOC, specific
cond
ucta
nce,
toxic
orga
nics
, trace
elem
ents
, nutrients
DOC, sp
ecif
ic
cond
ucta
nce,
toxic
orga
nics
, trace
elem
ents
, di
sso
lved
so
l id
s
AnnuaIly
Every
3 ye
ars
Every
3 ye
a rs
Every
3 ye
a rs
i f
cont
am-
inat
ion
de
tect
ed
at site 32
Ever
y 3
year
s
Eve
ry
3 ye
ars
if
co
nta
m-
i nat
ion
dete
cte
d
at
site
U
Initia
lly,
eve
ry
3 ye
ars
; th
ere
a
fte
r,
eve
ry
5 years
Locate
d
in w
ell
field
w
here
TC
E
ha
s been
de
tecte
d.
Site
is
5,0
00 fe
et
or
ab
ou
t 15
ye
ars
o
f g
rou
nd
-wa
ter
flo
w
dow
n-
gra
die
nt
of
two
in
dustr
ial
are
as.
Site
s
are
lo
cate
d
be
twe
en
1
,50
0
an
d
2,5
00
feet
up
gra
die
nt
of
well
field
to
in
terc
ept
gro
un
d-w
ate
r flow
to
th
e w
ell
field
a
nd
act
as
ea
rly w
arn
ing
ind
ica
tors
fo
r con
tam
inants
m
ovi
ng
d
ow
ng
rad
ie
nt.
S
ite
s
26
and
29
are
dow
ngra
die
nt
of
industr
ial
are
as.
Site
loca
ted
u
pg
rad
ien
t o
f in
dustr
ial
are
a.
Site
to
dete
rmin
e
am
bie
nt
wa
ter
qu
ality
.
Site
locate
d
dow
ngra
die
nt
of
industr
ial
are
a.
If co
nta
min
atio
n dete
cte
d
at
site
3
2,
this
site w
ill
dete
rmin
e
mo
vem
en
t o
f p
lum
e of
conta
min
ation.
Site
locate
d w
ith
in
industr
ial
are
a
to
dete
rmin
e
an
y
loca
l e
ffe
cts
o
n
gro
und
wate
r.
Site
lo
ca
ted
in
th
e flo
w p
ath
d
ow
ng
rad
ien
t o
f a
lan
dfiI
I.
Sites
loca
ted
about
2,0
00 fe
et
up
gra
die
nt
of
well
field
to
in
terc
ep
t g
rou
nd
-wa
ter
flow
to
th
e w
ell
field
a
nd
act
as
early
warn
ing
indic
ato
rs fo
r co
nta
min
atio
n
mo
vin
g
dow
ngra
die
nt.
Sites
36
thro
ugh
38
are
lo
cate
d
in
the
are
a
of
dis
solv
ed-
solids
ch
an
ge
. S
ites
35
and
39
are
a
lso
fo
r a
mb
ien
t quality
.
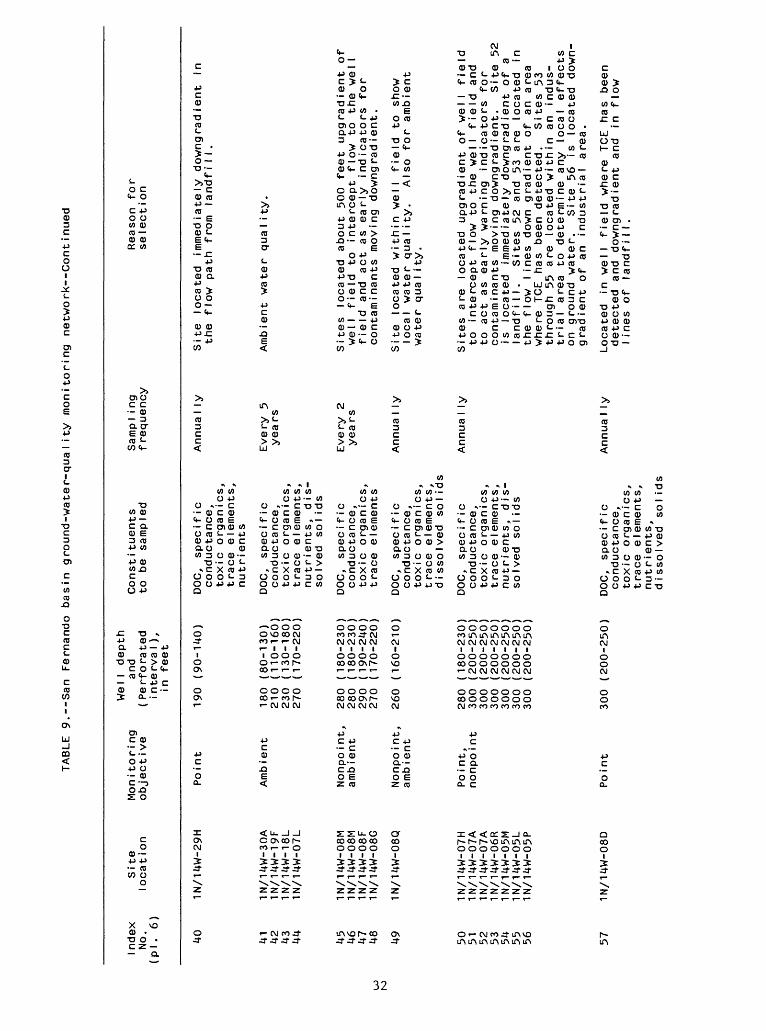
TABL
E 9.
--Sa
n Fernando ba
sin
ground-water-quality mo
nito
ring
network--Continued
Index
No.
(Pi.
6)
Site
loca
t ion
Monitoring
obje
ct ive
We I
I depth
and
( Pe
rfor
ated
interva
I ),
in fe
et
Const
i tue
nts
to be sampled
Samp
I i ng
frequency
Reas
on fo
rse
lect io
n
40 49 57
1N/14W-29H
41
42
43
44 45
46
47
48
1N/14W-30A
1N/14W-19F
1N/14W
-18L
1N/14W-0
7L
1N/14W-08M
1N/1
4W-0
8M
1N/14W-08F
1N/14W-08G
1N/1
4W-0
8Q
1N/1
4W-0
8D
Poin
t
Amb ient
Nonpo in
t,
amb ient
Nonp
o int,
amb ie
nt
190
(90-
140)
180
(80-130)
210
(110
-160
) 230
(130
-180
) 270
(170
-220
)
280
(180
-230
) 280
(180
-230
) 290
(190
-240
) 270
(170-220)
260
(160
-210
)
50
51
52
53
54
55
56
1N/14W-07H
1N/14W
-07A
1N/14W-0
7A
1N/14W
-06R
1N/14W-05M
1N/14W
-05L
1N/14W-05P
Poin
t,
nonpo int
280
300
300
300
300
300
300
(180
-230
) (2
00-2
50)
(200
-250
) (2
00-2
50)
(200
-250
) (2
00-2
50)
(200
-250
)
Poin
t300
(200
-250
)
DOC,
specific
cond
ucta
nce,
to
xic
organics,
trac
e elements,
nutr
ient
s
DOC, sp
ecif
ic
cond
ucta
nce,
toxic
organics,
trace
elem
ents
, nutrients, d
i s-
soIv
ed so
I ids
DOC, sp
ecif
ic
cond
ucta
nce,
toxic
orga
nics
, tr
ace
elem
ents
DOC, specific
cond
ucta
nce,
toxic
orga
nics
, tr
ace
elements,
d i ssoIved so
I id
s
DOC, specific
cond
ucta
nce,
toxic
orga
nics
, trace
elements,
nutr
ient
s, di
s-
soIv
ed so
I id
s
DOC, specific
cond
ucta
nce,
to
xic
organics,
trace
elements,
nutrients,
d i ssolved so
I ids
Annu
aI l
y
Ever
y 5
years
Every
2 years
Annua
I ly
Annu
aIly
Annu
aIly
Site lo
cate
d immediately
downgradient
in
the
flow path from la
ndfi
ll.
Ambient
wate
r quality.
Sites
loca
ted
abou
t 500
feet
up
grad
ient
of
well field
to intercept
flow to the
well
field
and
act
as ea
rly
indi
cato
rs fo
r contaminants mo
ving
downgradient.
Site located
within well field
to show
loca
l wa
ter
quality.
Also
fo
r ambient
water
qua
I ity.
Sites
are
loca
ted
upgr
adie
nt of well fi
eld
to in
terc
ept
flow to
the
well fi
eld
and
to act
as early
warning
indicators fo
r contaminants mo
ving
downgradient.
Site
52
is lo
cate
d immediately
downgradient of
a
landfill.
Site
s 52 and
53 ar
e located
in
the
flow
li
nes
down
gradient of an area
where
TCE
has
been
de
tect
ed.
Site
s 53
th
roug
h 55
ar
e located
with
in an indus
trial
area to determine
any
loca
l effects
on gr
ound
wa
ter.
Si
te 56
is located
down-
grad
ient
of an industrial area.
Located
in well fi
eld
where
TCE
has
been
de
tect
ed and
downgradient and
in flow
I ines
of la
ndfi
I I.

TABL
E 9. San Fernando basin
ground-water-quality mo
nito
ring
network Cent inued
1 ndex
No.
(Pi. 6)
Site
1 ocat ion
Won
i tor
i ng
obje
ctiv
e
Wel
1 de
pth
and
( Perforated
i nte
rva
1 ) ,
in feet
Cons
t! tue
nts
to be sampled
Samp
1 in
gfrequency
Reas
on for
se lec
t ion
58 75 76
1N/1UW-08C
1N/1UW-04P
1N/1UW-04A
1N/1UW-09H
Poin
t290
(190-240)
59 60 61 62 63 64 65 66 67 68 69 70 71 72 73
1N/1UW-07D
IN/1UW-06N
1N/1UW-06M
1N/1UW-06E
1N/1UW-06E
1N/1UW-06D
1N/1UW-06C
1N/1UW-06B
1N/1UW-06G
1N/1UW-08H
1N/1UW-08A
1N/1UW-OUM
1N/1UW-OUM
1N/1UW-04L
1N/1UW-OUK
Nonpoint
290
300
310
330
330
330
330
330
330
Point,
300
nonpoint
300
310
310
300
300
( 19
0-24
0)(200-250)
(210-260)
(230-280)
(230-280)
(230-280)
(230-280)
(230-280)
(230-280)
(200-250)
(200-250)
(210-260)
(210-260)
(200-250)
(200-250)
Nonpoint
280
(180-230)
Nonpoint
270 (170-122)
Po int
260
(160-210)
DOC, sp
ecif
ic
cond
ucta
nce,
toxic
orga
nics
, tr
ace
elem
ents
, nu
trie
nts,
d
i sso
Ived
so I id
s
DOC,
specific
cond
ucta
nce,
toxic
orga
nics
, tr
ace
elem
ents
, nu
trie
nts,
d
i ssolved so I id
s
DOC,
sp
ecif
ic
cond
ucta
nce,
to
xic
orga
nics
, tr
ace
elem
ents
, d
i ssolved so
l id
s
DOC, sp
ecif
ic
cond
ucta
nce,
toxic
orga
nics
, trace
elements,
d i ssolved so
l id
s
DOC, sp
ecif
ic
cond
ucta
nce,
toxic
orga
nics
, trace
elements,
d i sso
Ived
so I id
s
DOC, sp
ecif
ic
cond
ucta
nce,
to
xic
orga
nics
, tr
ace
elem
ents
, nu
trie
nts,
d
i ssoIved so I id
s
AnnuaIly
AnnuaIly
AnnuaIly
AnnuaIly
Ever
y 2
yea rs
AnnuaIly
Loca
ted
downgradient and
in flow lines
of
land
fiI
I.
Site
s lo
cate
d upgradient of
well field
to
intercept
flow to we
ll field
and
act
as
early warning in
dica
tors
for
contaminants
moving downgradient.
Sites
62,
63,
65,
66,
and
67 are
loca
ted
within industrial
area to
determine any
loca
l effects on
grou
nd wa
ter.
Sites
63 and
65 located
downgradient and
in flow lines
from
area
of pr
ivat
e di
spos
al systems.
Site
s 68
through
73 lo
cate
d upgradient of
we I
I fi
eld
to intercept
flow to
the
we I
I fi
eld
and
to act
as early warning indica
tors for
contaminants moving downgradient.
Site 69 lo
cate
d in ar
ea where TCE
has
been
detected.
Sites
70 through
73 located
within in
dust
rial
ar
ea to
determine any
loca
l ef
fect
s on gr
ound
water.
Site located
in well field
and
downgradient
and
in fl
ow line of
major industrial ar
ea
which in
clud
es an
ai
rpor
t.
Site
located
within major industrial ar
ea
to determine any
local
ground-water
effe
cts.
Site located
immediately
downgradient and
in flow li
nes
of a
landfill.

TABL
E 9. San Fe
rnan
do basin
grou
nd-w
ater
-qua
lity
mo
nito
ring
network Continued
OJ
Ind
ex
No
.(P
i.
6)
77
78
79
80
81 82
83 84
85
Site
locat
ion
1N
/14W
-09J
1N
/14W
-10D
1N
/14W
-10B
1N
/14W
-10H
1N
/14W
-03P
1N
/14
W-1
1L
1N
/14W
-03A
1N
/14W
-02K
1N
/14W
-12F
Mo
nito
rin
go
bje
ct
ive
Poin
t,am
bie
nt
Nonpoin
t
Nonpoin
t
Am
b ie
nt
We
I I
de
pth
an
d( P
erf
ora
ted
inte
rva
I ),
in fe
et
250
(150-2
00)
260
(160-2
10)
240
(14
0-1
90
)220
(12
0-1
70
)
260
(160-2
10)
210
(110-1
60)
210
(110-1
60)
37
0
(27
0-3
20
)3
30
(2
30
-28
0)
Co
nstitu
en
tsto
b
e
sam
ple
d
DO
C,
sp
ecific
conducta
nce,
toxic
o
rga
nic
s,
trace
ele
me
nts
,n
utr
ien
ts,
d is
so I
ved
so
l id
s
DO
C,
sp
ecific
co
nd
ucta
nce
,to
xic
o
rga
nic
s,
trace
ele
me
nts
,d
i sso
I ved
so
l id
s
DO
C,
sp
ecific
co
nd
ucta
nce
,to
xic
org
anic
s,
trace
ele
me
nts
,d
i sso I
ved
so
l id
s
DO
C,
sp
ecific
conducta
nce,
toxic
org
anic
s,
Sam
p I
ing
fre
qu
en
cy
Eve
ry
5ye
ars
Eve
ry
3ye
ars
Re
aso
n fo
rsele
ction
Site
lo
cate
d
ab
ou
t 1
,50
0
feet
dow
ngra
die
nt
an
d
in
flow
lines o
f la
nd
fill.
wate
r q
ua
I ity
.
Site
s
locate
d
dow
ngra
die
nt
and
lines of
majo
r in
dustr
ial
are
a
Am
bie
nt
in
flo
wto
d
ete
rmin
eany
local
effects
on
gro
und w
ate
r.
Eve
ry
2years
Eve
ry
5ye
ars
Site
s
locate
d w
ith
in
ind
ustr
ial
de
term
ine
any
local
effects
on
wa
ter.
Am
bie
nt
wate
r q
ua
lity
.
are
a
togro
und
86 87 88 89 90 91
1N/14W-06M
1N/14W-06K
1N/15W-24L
1N/15W-24C
1N/15W-13F
1N/15W-12F
Nonpoint,
ambient
Poin
t,
nonpoint
Amb ie
nt
230
(130-180)
320
(220-270)
170
(70-
120)
210
(110-160)
230
(130-180)
270
(170-220)
trace
elements,
d issolved sol id
s
DOC, specific
cond
ucta
nce,
toxic
organics,
trac
e elements,
d i ssoIved so
l ids
DOC, specific
conductance,
toxic
organics,
trace
elements,
d i ssoIved sol id
s
DOC, specific
cond
ucta
nce,
nutrients,
d i ssoIved so
I ids
Annu
aIly
Annu
aIly
Every
5 yea rs
Site
located
in in
dust
rial
area an
d in
well
field
to de
term
ine
any
loca
l effects
on
grou
nd wa
ter.
Lo
cate
d downgradient of
area high in
dissolved
solids.
Site
lo
cate
d in
well fi
eld
and
in ar
ea wh
ere
TCE
has
been
detected.
Site al
so down-
grad
ient
and
in flow line of in
dust
rial
area.
Ambient
wate
r qu
alit
y.

TA
BLE
9
.--S
an
F
ern
an
do
b
asin
g
rou
nd
-wa
ter-
qu
ality
m
onitoring
netw
ork
--C
ontinued
Index
No.
(pl. 6)
92
Site
locat io
n
1N/15W-01F
Mon
i to ring
object i ve
Nonpoint,
amb le
nt
Wel
1 depth
and
( Perforated
interva
1 ),
i n fe
et
310
(210-260)
Const i tuents
to be
sampled
DOC,
specific
conductance,
Samp 1 ing
frequency
Every 3
yea rs
Reason for
select ion
Site
lo
cate
d downgradient and
of ar
ea where private disposa
in flow
1 ines
1 systems are
93
U)
Ln
103
104
105
106
107
1N
/15W
-02A
94
95
96 97
98
99
100
101
102
1N/15W-02P
1N/15W-11M
1N/15W-14M
1N/15W-16P
1N/15W-10M
1N/15W-03M
1N/15W-03B
1N/15W-04E
1N/15W-08H
1N
/15W
-09L
1N
/15W
-17K
1
N/1
5W
-08
L
1N
/15W
-05M
1N
/15W
-05D
No
np
oin
t 310
(21
0-2
60
)
Amb
ien
t
Ambient
(97-102),
nonpo int
(98, 100)
270
(170-220)
250 (150-200)
210
(110-160)
(40-90)
230 (130-180)
270
(170-220)
280 (180-230)
280
(180-230)
230
(130-180)
Nonpoint
230
(130-180)
Nonpo int
Nonpoint
140
(40-
90)
200
(100-150)
250
(150-200)
260
(160-210)
toxic organics,
trace elements,
d i ssolved so I ids,
n it
rate
s
DOC,
specific
Annually
conductance,
toxic organics,
trace elements,
d i ssolved so
l ids,
n it
rate
s
Specific
Every 5
conductance,
years
nutrients, dis
solved sol ids
Sites 97-102:
Every 5
specific conduct-
years
ance
, nutrients,
d i ssolved sol
ids.
Sites 98,
100
add
DOC,
toxic organics,
trace elements.
DOC,
specific
conductance,
toxic organics,
trace elements,
d i ssolved sol ids
Specific conduct
ance
, nutrients,
d i ssoIved so
I ids
DOC,
specific
conductance,
toxic organics,
trace elements,
d issoIved so I ids
AnnuaIly
Every 2
yea rs
Every 3
years
used
. Also for ambient water quality and
to monitor ar
ea high
in dissolved solids.
Site lo
cate
d within area of
private dis
posa
l systems usage to determine any
loca
l effects on
ground water.
Ambient water quality.
Ambient water quality.
Sites 98
and
100
are lo
cate
d downgradient and
in the flow
line
s of industrial areas to determine
any local
effects on ground water.
Located within industrial ar
ea to determine
any lo
cal
effects on
ground water.
Sites located
in agricultural area near
Sepulveda Dam to determine any lo
cal
effects on
ground water.
Sites located
downgradient and
in flow
line
s of
industrial area to determine
any lo
cal
effects on
ground water.

TA
BLE
9
.--S
an
F
ern
an
do
b
asin
g
rou
nd
-wa
ter-
qu
ality
m
onitoring
netw
ork
Centinued
Inde
x Site
No.
loca
tion
(Pi. 6)
108
1N/15W-06G
109
1N/15W-06K
110
1N/15W-07B
111
1N/15W-07F
112
1N/15W-07Q
113
1N/15W-18Q
114
1N/16W-12E
115
1N/16W-12C
116
1N/16W-01L
Mon
i tori ng
obje
ct ive
Nonp
o int
Nonp
oint
Nonp
oint
Nonpoint
Ambient
Nonpoint
Nonp
o i nt
Ambient
We I
I depth
and
( Perforated
interva
I ),
in fe
et
250
(150-200)
240
(140-190)
250 (150-200)
230
(130-180)
180
(80-130)
130
(30-
80)
140
(40-
90)
150
(50-100)
180
(80-
130)
Cons
t i tue
nts
to be
sampled
DOC,
specific
cond
ucta
nce,
toxic
organics,
trace
elements,
d i sso
l ved
so 1 id
s
Spec
ific
co
nduc
tance,
nutrients,
d i sso
l ved
so 1 id
s
Specific co
nduc
tan
ce,
nutr
ient
s,d
i sso
Ive
d so
1 id
s
DOC,
sp
ecif
icco
nduc
tanc
e,toxic
organics,
trace
elements,
d i sso Ive
d sol id
s
Specific co
nduc
tance,
nutr
ient
s,d
i sso
l ve
d so
1 id
s
Specific conduct
ance
, nutrients,
d i sso Ive
d so
1 id
s
Spec
ific
co
nduc
tan
ce,
nutrients,
d i sso Ive
d so
1 ids
Specific conduct
ance
, nutrients,
Samp
1 ing
frequency
Annua
1 ly
Ever
y 5
yea rs
Ever
y 2
yea rs
Ever
y 2
yea rs
Reas
on for
select ion
Sites
loca
ted
with
in industrial area to
dete
rmin
e an
y lo
cal
effects
on ground
water.
Site lo
cate
d do
wngr
adie
nt an
d in fl
owlines
of ag
ricu
ltur
al ar
ea.
Site
lo
cate
d within ag
ricu
ltur
al ar
eabehind Sepulveda
Dam.
Site lo
cate
d in flood
control
area be
hind
Sepulveda
Dam
to determine
any
local
effe
cts
on gr
ound
water fr
om storm
runoff
Ever
y 5
yea rs
Ever
y 2
yea rs
Ever
y 5
yea rs
Every
5yea rs
held by
th
e dam.
Ambient
water quality.
Site
lo
cate
d in ag
ricu
ltur
al area
in basin
behind Sepulveda
Dam
to determine
any
loca
l effects
on gr
ound
wa
ter.
Site
lo
cate
d do
wngr
adie
nt an
d in fl
ow
1of ag
ricu
ltur
al ar
ea.
Ambient
water qu
alit
y.
ines
d is
so
Ive
d
so I
ids

TA
BLE
9
.--S
an
F
ern
an
do
basin
g
rou
nd
-wa
ter-
qu
ality
m
onitoring
ne
two
rk--
Co
ntin
ue
d
1 nde
xNo
.(Pi. 6)
117
118
119
120
121
122
123
124
125
Site
loca
tion
1N/16W-13K
1N/16W-14F
1N/1
6W-10H
1N/1
6W-03J
1N/16W-02C
1N/16W-09H
1N/16W-04A
1N/16W-04Q
1N/1
6W-07H
We I
I depth
Moni
tori
ng
and
objective
(Perfo
rated
interva
I ),
in feet
Ambi
ent
170
(70-120)
190
(90-140)
120
(20-
70)
120
(20-
70)
130
(30-80)
Ambient
110
(10-60)
120
(20-70)
110
(10-60)
Nonpoint
140
(40-90)
Const ituents
to be sa
mple
d
Spec
ific
co
nduc
tan
ce,
nutrients,
d i sso 1 ve
d so 1 id
s;f
i rst samp le
add
Samp
ling
Re
ason
for
frequency
sele
ctio
n
Every
5 Ambient water qu
alit
y.ye
ars
DOC, toxic
organ ic
s,trace
elem
ents
(con
tinu
e th
ese
only
if contami
nati
on found).
Spec
ific
co
nduc
tance,
nutr
ient
s,d
i sso 1 ve
d so 1 ids
DOC, sp
ecif
icco
nduc
tanc
e,
Ever
y 5
Ambient
water qu
alit
y.ye
ars
Ever
y 5
This
is an area of
low permeability and
year
s sl
ow horizontal velocities (5 ft
/yr)
.
126
127
128
129
130
131
132
133
134
1N/16W-08D
1N/16W-05P
1N/16W-06F
1N/17W-12F
1N/17W-01N
1N/17W-01D
2N/17W-36M
2N/17W-36F
2N/17W-25R
Nonpoint
120
(20-
70)
110
(10-60)
toxic
organics,
trac
e el
emen
ts,
d i ssoIved so I id
s,
nutr
ient
s
DOC,
specific
cond
ucta
nce,
toxic
orga
nics
, tr
ace
elem
ents
, d
i ssoIved so
l id
s
Amb ient
Ambi
ent
120
(20-70)
125
(25-
75)
110
(10-60)
110
(10-
60)
120
(20-
70)
120
(20-70)
140
(40-90)
Spec
ific
co
nduc
t
ance
, nu
trie
nts,
d
i sso
Ived
so I ids
Spec
ific
co
nduc
t
ance,
nutr
ient
s,
d i ssoIved so I id
s
Samp
le si
te
126
ever
y 10 ye
ars
only
if
co
n-
tarn ina
t io
n de
tect
ed at
site 12
5.
Samp
le si
te
127
every 10
year
s on
ly if
co
ntar
nina
t ion
dete
cted
at
site 126
Ever
y 10
year
s
Site
lo
cate
d within industrial area to
determine any
loca
l effects
on ground
wate
r.
Site
s located
downgradient and
in flow
lines
of in
dust
rial
area to determine
any loca I
effects.
Ambient
water quality.
Ever
y 10
year
sAm
bient
water quality.

TA
BLE
9. S
an
Fern
ando
ba
sin
gro
und-w
ate
r-quality
m
onitoring
netw
ork
Continued
Inde
xNo
.(P
i. 6)
135
136
137
138
139
mo 141
142
143
144
145
Site
locat ion
2N/1
6W-36G
2N/1
6W-25K
2N/1
6W-24Q
2N/1
6W-34J
2N/16W-35C
2N/1
6W-26K
2N/16W-26B
2N/1
6W-23G
2N/16W-13M
2N/16W-13F
2N/16W-12R
Wel
1 de
pth
Monitoring
and
obje
ctiv
e (Per
forated
inte
rva
1 ),
in feet
Ambi
ent
200
(100
-150
)220
(120
-170
)260
(160
-210
)
Ambi
ent
120
(20-
70)
130
(30-80)
170
(70-120)
210
(110
-160
)27
0 (1
70-2
20)
330
(230
-280
)340
(240
-290
)340
(240
-290
)
Constituents
to be sampled
Spec
ific
co
nduc
tance,
nutrients,
d i s
sol
ved
sol ids
Spec
ific
co
nduc
tan
ce,
nutrients,
d i sso 1 ve
d so 1 id
s
Samp
1 in
gfrequency
Ever
y 5
year
s
Ever
y 5
years
Reason for
select ion
Ambient
water qu
alit
y.
Site
slocated
upgradient of large
a re
a .
Ambient water qu
alit
y.
135
and
136
industria
I
OJ
Co
146
147
2N
/16W
-31K
2N
/16
W-3
1J
Nonpoin
t 130
(30-8
0)
Nonpoin
t,
amb
ient
130
(30-
80)
DOC, specific
cond
ucta
nce,
toxic
orga
nics
, tr
ace
elem
ents
, d
i ssoIved so I id
s
DOC, specific
cond
ucta
nce,
toxic
orga
nics
, trace
elements,
d i sso I ve
d so
l ids,
nutr
ient
s
Every
3 ye
a rs
Site
located
within industrial area to
determine any
loca
l effects on gr
ound
wate
r.
Every
5 years fo
r sp
ecif
ic
cond
ucta
nce,
d
i ssoIved-
soli
ds,
and
nutrients.
DOC, toxic
orga
nics
, trace
elements
on
ly if co
n-
tarn inat ion
dete
cted
at
site
146
Site
located
downgradient of
industrial
area
to
determine any local
effects on
grou
nd water.
Ambient
water quality.

TA
BLE
9
.--S
an
F
ern
an
do
basin
g
rou
nd
-wa
ter-
qu
ality
m
onitoring
ne
two
rk--
Co
ntin
ue
d
Index
No.
(Pi.
6)
148
149
150
151
152
153
154
155
156
157
Site
location
2N
/16W
-29P
2N
/16
W-2
2J
2N
/16
W-2
8F
2N
/16W
-28A
2N
/16W
-22E
2N
/16W
-15P
2N
/16
W-1
5J
2N
/16W
-11P
2N
/16W
-11K
2N
/16W
-12D
Wel
1
depth
Mo
nito
rin
g
an
do
bje
ctive
(P
erf
ora
ted
inte
rva
1 ),
in
feet
Nonpoin
t,
150
(50
-10
0)
am
bie
nt
170
(70-1
20)
140
(40-9
0)
140
(40-9
0)
190
(90-1
40)
220
(120-1
70)
25
0
(150-2
00)
37
0
(270-3
20)
370
(270-3
20)
420
(320-3
70)
Constitu
ents
to
be
sam
ple
d
DO
C,
specific
co
nd
ucta
nce
,to
xic
org
anic
s,
tra
ce
ele
ments
,d
i sso
I ve
d
so
l id
s,
nutr
ients
Sa m
p I
i ng
frequency
Initia
lly
Ssa
mple
fo
ra
I I
co
nst
i t-
ue
nts
. If
any
conta
m-
inat
ion
dete
cte
d,
co
nt
inue
sam
p I
i ng
for
all
con
st
i tuents
eve
ry
3 ye
ars
.O
the
rwi se
,sa
mple
fo
rsp
ec if ic
co
nd
ucta
nce
,n
utr
ien
ts,
an
d
Re
aso
n fo
rse
le
ct
ion
ites
148
thro
ugh
154
loca
ted
a
t vary
ing
dis
tan
ce
s
do
wn
gra
die
nt
of
industr
ial
and
agricultura
l are
as
to
serv
e
as
early w
arn
in
g
ind
ica
tors
fo
r conta
min
ants
m
ovi
ng
south
westw
a r
d
in
the
basin
.A
mbie
nt
wa
ter
qu
ality
.
d i s
so
l ved
so I
ids
eve
ry
5 years
158
2N/16W-27F
159
2N/16W-27G
Po i nt
Po i nt
130
(30-
80)
130
(30-80)
DOC, sp
ecif
ic
cond
ucta
nce,
to
xic
orga
nics
, tr
ace
elem
ents
, nu
trie
nts,
di
s-
soIv
ed so I id
s
DOC,
sp
ecif
ic
cond
ucta
nce,
toxic
orga
nics
, trace
elem
ents
, nu
trie
nts,
di
s-
soIv
ed so
l id
s
AnnuaIly
Every
5 years
only
if contam
inat
ion
dete
cted
at
site 158
Site
located
imme
diat
ely
downgradient and
in flow lines
of landfill.
Site located
abou
t 900
feet below la
ndfi
ll
to determine movement of containments down-
grad
ient
.
160
2N/16W-30B
Nonp
oint
17
0 (70-120)
Spec
ific
co
nduc
t
ance,
nutrients,
diss
olve
d so
l ids
Every
5 ye
ars
only
if
contam
inat
ion
dete
cted
at
site
158
Site located
on downgradient side of ag
ri
cult
ural
ar
ea to
determine any lo
cal
effects on
gr
ound
water.

TA
BLE
9. S
an
Fern
ando
ba
sin
gro
und-w
ate
r-quality
m
on
ito
rin
g
ne
two
rk--
Co
ntin
ue
d
1 ndex
No.
(Pi. 6)
161
162
163
164
165
166
167
168
169
170
Site
locat ion
2N/16W-20L
2N/16W-21P
2N/16W-17R
2N/16W-17J
2N/16W-17G
2N/16W-18J
2N/16W-18M
2N/15W-36K
2N/15W-36B
2N/15W-36B
Wel
1 depth
Monitoring
and
objective
(Perforated
inte
rva
1 ) ,
in feet
Nonpoint
190
(90-40)
Nonpoint
160
(60-110)
Ambient
200
(100-150)
200 (100-150)
180
(80-
130)
Ambient
170
(60-
110)
120
(20-70)
Nonpoint
330
(230-280)
Poin
t 34
0 (240-290)
Point
340
(240-290)
Constituents
to be sampled
DOC,
specific
conductance,
toxic organ ics,
trace elements,
d is so
1 ved
so 1 ids
Specific conduct
ance
, nutrients,
d i sso 1 ve
d so 1 ids
Specific conduct
ance
, nutrients,
d i sso Ived
sol ids
Specific conduct
ance
, nutrients,
d i sso Ived
so 1 ids
DOC,
specific
cond
ucta
nce,
toxi
c organ ic
s,trace
elements,
nutrients, di
s-so
Ived
sol id
s
DOC,
specific
conductance,
toxic organics,
trace elements,
nutrients, d
i s-
so Ived
sol ids
DOC,
specific
conductance,
toxic organics,
trace elements,
nutrients, di
ssolved so
l ids
Samp 1 in
g frequency
Annua 1
ly
Every 3
years
Ever
y 5
yea rs
Every
5ye
a rs
Ever
y 2
yea rs
Annua
1 ly
Ever
y 3
years
ifcontami
-at ion
is
dete
cted
at si
te 16
9
Reas
on fo
r select ion
Site
lo
cate
d within industrial ar
ea to
dete
rmin
e an
y lo
cal
effe
cts
on gr
ound
wate
r.
Site lo
cate
d wi
thin
agricultural area to
determine
any
loca
l effects
on gr
ound
wate
r.
Sites
loca
ted
across dissolved so
lids
grad
ient to determine
any
chan
ges.
Am
bien
twater
qua
I i ty.
Ambient
water
qual
ity.
Site lo
cate
d up
grad
ient
of
landfill for
comp
aris
on of wa
ter
qual
ity with down-
grad
ient
sites.
Site
lo
cate
d immediately
down
grad
ient
an
din flow lines
of landfill.
Site located
down
grad
ient
an
d in
flow
Iof landfill to determine
spread of an
ycontaminants detected at si
te 16
9.
ines
con-

TA
BLE
9.-
-San
Fe
rna
nd
o
ba
sin
gro
und-w
ate
r-quality
m
onitoring
netw
ork
Cent
inued
Ind
ex
Site
No
. lo
cation
Pi.
6)
We
I I
de
pth
M
on
ito
rin
g
and
obje
ctive
(Perf
ora
ted
inte
rva
I ),
in
fe
et
Constitu
ents
to
b
e
sa
mp
led
Sam
p I
i ng
frequency
Re
aso
n fo
r se
Iect
i on
171
2N
/15W
-25N
N
onpoin
t 350
(25
0-3
00
)1
72
2
N/1
5W
-36
D
34
0
(24
0-2
90
)
173A
2N
/15W
-34M
17
3B
2N
/15W
-34H
17
5
2N
/15
W-3
2J
176
2N
/15W
-31L
177A
2N
/15W
-31N
17
7B
2
N/1
5W
-31
F
Nonpoin
t 310
(21
0-2
60
)
Am
bie
nt
31
0
(19
0-2
60
)
174
2N/15W-33K
Nonpoint
290
(190-240)
Nonpoint
290
(190-240)
280 (180-230)
290
(190-240)
178
2N/15W-31P
Nonpoint
280
(180-230)
179
2N/15W-32Q
280 (180-230)
180
2N/15W-28R
Ambient
330
(230-280)
181
2N/15W-27L
340
(240-290)
182
2N/15W-26C
370
(270-320)
Specific conduct
ance
, toxic
organics, trace
elements,
d i s-
soIved so I id
s
DOC,
specific
conductance,
toxic organics,
trac
e elements,
d i ssoIved so
I id
s
Specific conduct
ance,
nutrients,
d i ssoIved so I id
s
DOC,
specific
conductance,
toxic organics,
trace elements,
d i ssoIved so
I ids
DOC,
specific
conductance,
toxic organics,
trac
e elements,
d i ssoIved so
I ids
DOC,
specific
conductance,
toxi
c organics,
trace elements,
d i ssoIved so I id
s
Specific conduct
ance
, nutrients,
d i ssolved so
I id
s
Site
17
1 annuaIly,
site
172
eve ry 3
yea rs
AnnuaIly
Every 3
yea rs
AnnuaIly
AnnuaIly
Site 178
eve ry
3 ye
a rs
i f
contami-
nation
is
detected at
site
178
Every 5
yea rs
Sites lo
cate
d downgradient of
major
recharge ar
ea.
Site lo
cate
d within industrial ar
ea to
determine any effects on
ground water.
Ambient water quality.
Site lo
cate
d within industrial ar
ea to
determine any effects on
ground wa
ter.
Sites lo
cate
d within industrial ar
ea and
airport to determine any local
effects on
ground water.
Sites lo
cate
d about 500 and
1,500 fe
et,
respectively, downgradient and in flow
line
s of
industrial ar
ea and
airport to
determine th
e spread of
any contaminants.
Ambient water quality.

TA
BLE
9
.--S
an
F
ern
ando
basin
gro
und-w
ate
r-quality
m
on
ito
rin
g
ne
two
rk--
Co
ntin
ue
d
1 nde
xNo
.(P
i. 6)
Site
loca
tion
Monitoring
objective
Wel
I de
pth
and
( Pe
rfor
ated
interv
a 1 )
,in
fe
et
Constituents
to be sampled
Samp
1 i ng
frequency
Reas
on for
sele
ct ion
183
2N/15W-2
4N
184
2N/15W-25D
185
2N/1
5W-2
4D
186
2N/15W-24L
187
2N/1
5W-2
4P
Nonp
oint
410
(310
-360
)
Nonp
oint
430
(330
-380
)
Ambi
ent
445
(345
-395
)
Poin
t 410
(310
-360
)
Point
410
(310
-360
)
188
2N/15W-1
3J
189
2N/1
5W-1
3R
Nonpoint
450
(350
-400
)
Nonpoint
440
(340
-390
)
DOC, sp
ecif
ic
conductance,
toxic
organics,
trace
elem
ents
, d is
so Ived
sol ids
DOC, sp
ecif
ic
conductance,
toxic
organ ic
s,
trace
elem
ents
, d
i ssoIved so I ids
Spec
ific
co
nduc
t
ance
, nutrients,
d i sso
Ived
so
l ids
DOC, sp
ecif
ic
conductance,
toxic
orga
nics
, trace
elements,
d i ssoIved so I ids
DOC, specific
conductance,
toxi
c or
gani
cs,
trace
elem
ents
, d
i ssoIved so
l ids
DOC,
sp
ecif
ic
conductance,
toxic
orga
nics
, trace
elem
ents
, d
i ssoIved so I ids
DOC,
sp
ecif
ic
conductance,
toxi
c or
gani
cs,
trace
elem
ents
, d
i ssoIved so
l ids
AnnuaIly
Every
3 ye
a rs
i f
contami-
nat ion
detected
at site 183
Every
5 ye
a rs
Annu
aI ly
Ever
y 3
yea rs
i f
cont
ami-
na
t io
n detected
at si
te 186
Annua
I ly
Ever
y 3
year
s if
contami-
nat io
n de
tect
ed
at si
te 188
Site
lo
cate
d within in
dust
rial
ar
ea to
determine lo
cal
effects
on ground water.
Site
lo
cate
d ab
out
1,000
feet
downgradient
and
in flow lines
of industrial area to
determine spread of
any contaminants
dete
cted
at
site 18
3.
Ambient water qua Ii
ty.
Site
lo
cate
d downgradient side of landfill
to determine any
loca
l effects on gr
ound
wa
ter.
Site
lo
cate
d downgradient and
in fl
ow lines
of landfill to determine sp
read
of
any
contaminants de
tect
ed at site 18
6.
Site
located
within industrial ar
ea to
determine any
loca
l effects on ground
water.
Site
lo
cate
d downgradient and
in flow lines
of in
dust
rial
area to determine the
spre
ad
of any
contaminants detected at
site 18
8.
Site
al
so located
upgradient of re
char
ge
area.

TA
BLE
9
. S
an
F
ern
ando
ba
sin
g
rou
nd
-wa
ter-
qu
ality
m
onitoring
ne
two
rk C
on
tin
ue
d
Index
No.
(pl. 6)
Site
locat ion
Mon
i toning
objective
We I
I de
pth
and
(Per
forated
interva
I ),
in feet
Cons
t it
uent
s to be sampled
Samp
I in
g fr
eque
ncy
Reason for
sele
ct ion
190
191
192
193
194
195
196
197
198
199
200
201
202
203
2N/15W-29P
2N/15W-29H
2N/15W-28B
2N/15W-22P
2N/15W-23E
2N/15W-20N
2N/15W-20H
2N/15W-15P
2N/15W-14K
2N/15W-15M
2N/15W-10P
2N/15W-15B
2N/15W-11D
2N/15W-11M
Ambient
320
(220-270)
340
(240-290)
350
(250-300)
370
(270-320)
420
(320-370)
330
(230-280)
360
(260-310)
410
(310-360)
460 (360-410)
Nonpoint
440 (340-390)
Point
430
(330-380)
204
205
2N/15W-11A
2N/15W-02R
Poin
t 470
(370-420)
Nonpoint
500
(400-450)
Nonpoint
470 (370-420)
Ambi
ent
470
(70-
420)
19
0 (90-140)
Spec
ific
co
nduc
t
ance,
nutrients,
d issolved so I id
s
Specific co
nduc
t
ance
, nu
trie
nts,
d
i ssolved so I ids
DOC, sp
ecif
ic
conductance,
toxic
orga
nics
, tr
ace
elem
ents
, d
i ssolved so
l id
s,
nutrients
DOC,
sp
ecif
ic
cond
ucta
nce,
to
xic
orga
nics
, trace
elem
ents
, d
i ssoIved so
l id
s,
nutr
ient
s
DOC,
specific
conductance,
toxic
organics,
trac
e el
emen
ts,
d i ssolved so
l ids
DOC,
specific
conductance,
toxi
c or
gani
cs,
trace
elem
ents
, d
i ssolved so
l id
s
Spec
ific
co
nduc
t
ance
, nutrients,
dissoIved
so I id
s
Every
5 yea rs
Ambient water qu
alit
y.
Every
2 yea rs
AnnuaIly
Every
3 ye
a rs
i f
co
ntam
i
nati
on
dete
cted
at si
te 20
0
AnnuaIly
Ever
y 3
yea rs
i f
contami
nati
on
dete
cted
at
s i te
202
Ever
y 5
yea rs
Site
located
immediately
downgradient and
in flow lines
of major recharge area to
determine lo
cal
effect on
ground water.
Site
located
imme
diat
ely
downgradient of
landfill to
determine any
local
effects
on
ground wa
ter.
Site
located
abou
t 1,500
feet
downgradient
and
in fl
ow li
nes
of la
ndfi
ll to
determine
spread of any
contaminants de
tect
ed at
site 20
0.
Site
located
within industrial area to
determine any
loca
l effects on
ground
wate
r.
Site
located
downgradient and
in flow lines
of in
dust
rial
ar
ea to determine sp
read
of
any
contaminants detected at site 20
2.
Ambient
water qu
alit
y.

TA
BLE
9.-
-San
Fe
rna
nd
o
ba
sin
gro
und-w
ate
r-quality
m
on
ito
rin
g
ne
two
rk C
en
tin
ue
d
1 ndex
No.
(pl. 6)
206
207
208
209
210
211
-P-
-p-
212
213
214
215
216
Site
locat ion
2N/15W-18H
2N/15W-17G
2N/15W-16E
2N/15W-16A
2N/15W-10L
2N/15W-03R
2N/15W-02N
2N/15W-02K
2N/15W-02A
2N/15W-36N
2N/15W-02A
Mon
i tor
i ng
object ive
Amb ien
t
Amb ient,
nonpo i nt
Amb ient,
nonpo int
Amb ient,
nonpo i nt
Nonpo i nt
Nonpoint,
amb ie
nt
Nonpoint
Wel
1 depth
and
( Perforated
inte
rva
1 ),
in fe
et
360
(260-310)
350
(250-300)
350
(250-300)
390
(290-340)
440
(340-390)
490
(70-
440)
230
(80-
180)
220
(120-170)
270
(170-220)
270
(170-220)
270
(170-220)
Const i tuents
to be
sampled
Specific conduct
ance
, nutrients,
d i sso
I ve
d so I ids
Specific conduct
ance
, nutrients,
d i sso
I ve
d so I ids
DOC,
specific
conductance,
toxic organics,
trace elements,
nutrients,
d i sso I ve
d so
l ids
DOC,
specific
conductance,
toxic organics,
trace elements,
nutrients,
d i sso
I ve
d so I ids
DOC,
specific
conductance,
toxic organics,
trace elements,
d i sso
l ve
d so
l id
s
DOC,
specific
conductance,
nutrients,
toxic organics,
trace elements,
d i sso
l ve
d so
l ids
DOC,
specific
conductance,
Samp I
i ng
frequency
Every 5
yea rs
Every 3
yea rs
Every 3
years
Every 3
yea rs
Every 3
yea rs
Annua I
ly
Every 3
yea rs
Reason for
select ion
Ambient water quality.
Ambient water quality.
Site located
upgradient of major recharge area.
Ambient water quality.
Site located
upgradient of landfill.
Ambient water quality.
Site located
upgradient of
in
dust
rial
area.
Sites lo
cate
d downgrad ient
and
in flow
line
s of
industrial areas to
determine any
local
effects on
ground water and
to
determine spread of
any contaminants from
the
industries.
Site
lo
cate
d downgrad ient
of recharge
Sylmar subbasin.
from
Site located
downgrad ient
of area of
recharge from Sylmar subbasin to
determine
nutr
ients
,d
i sso
Ive
d
so
l id
sth
e
move
ment
and
wa
ter
quality
of
the
re
cha
rge.

TA
BLE
9
.--S
an
F
ern
an
do
basin
gro
und-w
ate
r-quality
m
onitoring
netw
ork
Continued
Ind
ex
No
. (P
i.
6)
217
218
219
220
221
222
223
224
225
226
227
228
229
230
Site
lo
ca
t io
n
2N
/15
W-0
9D
2N
/15W
-09F
2N
/15
W-0
7E
2
N/1
5W
-08
D
2N
/15
W-0
3D
2
N/1
5W
-03
E
2N
/15
W-0
3F
3N
/15W
-33R
3N
/15W
-34E
3
N/1
5W
-34
A
3N
/15W
-35B
3
N/1
5W
-36
M
3N
/15W
-26R
3N
/15
W-3
5A
Mo
nito
rin
g
ob
ject
ive
Nonpo in
t
No
np
o in
t,
amb
ient
Am
b ie
nt
Nonpo in
t,
amb
ient
Am
b ie
nt
Nonpo in
t
No
np
o in
t
Wel
1
de
pth
a
nd
( P
erf
ora
ted
in
terv
a 1
),
in fe
et
37
0
39
0
36
0
340
250
25
0
25
0
20
0
26
0
25
0
330
21
0
230
28
0
(270-3
20)
(290-3
40)
(260-3
10)
(240-2
90)
(100-2
00)
(80-2
00)
(80-2
00)
(100-1
50)
(160-2
10)
( 1
50
-20
0)
(230-2
80)
(11
0-1
60
)
(130-1
80)
(180-2
30)
Co
nst
i tu
ents
to
be
sa
mple
d
Sp
ecific
conduct
ance,
nutr
ients
, d
i sso
I ve
d
so I
ids
Specific
conduct
ance,
nu
trie
nts
, d
i sso
I ve
d
so I
ids
Sp
ecific
conduct
ance,
nutr
ients
, d
i sso
I ve
d
so I
ids
DO
C,
sp
ecific
co
nd
ucta
nce
, to
xic
org
anic
s,
tra
ce
e
lem
en
ts,
nu
trie
nts
, d
i sso
I ve
d
so
l id
s
Sp
ecific
conduct
ance,
nu
trie
nts
, d
i sso
I ve
d
so I
ids
Sp
ecific
conduct
ance,
nu
trie
nts
, d
i sso
I ve
d
so I
ids
Sp
ecific
co
nd
uct
ance,
nu
trie
nts
, d
i sso
I ve
d
so I
ids
Sam
p I in
g
fre
qu
en
cy
Every
2
yea r
s
Every
5
yea r
s
Every
5
yea
rs
Site
221
an
nu
a I
ly,
site
s
22
2
an
d
22
3
eve
ry
3 ye
ars
Every
5
ye
ars
Eve
ry
2 ye
a r
s
Every
5
yea r
s
i f
conta
m i
-n
at
ion
de
tecte
dat
site
229
Re
aso
n fo
r se
lect
ion
Site
lo
ca
ted
w
ith
in a
gricu
ltu
ral
are
a
to
de
term
ine
any
local
effects
o
n
gro
un
d
wa t
e r
.
Site
lo
cate
d
ab
ou
t 1
,50
0
feet
dow
ngra
die
nt
and
in
flo
w
line o
f a
n agricultura
l a
rea
to
dete
rmin
e
sp
rea
d
of
any
conta
min
ants
fr
om
site
217.
Am
bie
nt
wa
ter
quality
.
Am
bie
nt
wa
ter
quality
.
Site
s
are
lo
cate
d
do
wn
gra
die
nt
of
the
S
ylm
ar
no
tch
w
here
gro
und
wate
r flow
s
from
th
e
Sylm
ar
subbasin
to
th
e
San
F
ern
an
do
su
bb
asin
.
Am
bie
nt
wa
ter
quality
.
Site
locate
d w
ith
in agricultura
l a
rea
to
d
ete
rmin
e
local
eff
ects
on
gro
un
d w
ate
r.
Site
loca
ted
d
ow
ng
rad
ien
t a
nd
in
flo
w
lin
es
of
ag
ricu
ltu
ral
are
a
to
de
term
ine
th
e
spre
ad
of
any co
nta
min
an
ts
fro
m site
229.

TA
BLE
9
.--S
an
F
ern
ando
basin
gro
und-w
ate
r-quality
m
onitoring
netw
ork
Centinued
Index
No.
(Pi. 6)
231
232
233
234
235
236
237
Site
lo
cati
on
3N/15W-36M
3N/15W-27R
3N/15W-33F
3N/15W-33L
3N/15W-29R
3N/15W-29R
3N/15W-29H
We I
I de
pth
Monitoring
and
objective
(Perforated
interva
I ),
in feet
Nonpoint
270
(170
-220
)
Nonpoint
210
(110
-160
)
Nonp
oint
21
0 (1
10-1
60)
Nonpoint
190
(90-140)
Nonpoint
150
(50-100)
Nonpoint
170
(70-120)
Nonpoint
130
(30-
80)
Cons
t i tuents
to be
sa
mple
d
DOC, sp
ecif
ic
cond
ucta
nce,
to
xic
organ ics,
trac
e elements,
d i sso
I ved
so I ids
DOC,
sp
ecif
ic
cond
ucta
nce,
to
xic
organ ic
s,
trac
e elements,
d i sso
I ved
so I ids
DOC, specific
conductance,
toxi
c or
gan ics,
trac
e el
emen
ts,
d i sso I ved
so I id
s
DOC, sp
ecif
ic
conductance,
toxi
c organ ic
s,
trac
e el
emen
ts,
d i ssol ved
sol ids
Specific co
nduc
t
ance,
nutrients,
d i sso
I ved
so I ids
Specific co
nduc
t
ance,
nutrients,
d i sso
I ved
so I ids
Specific co
nduc
t
ance,
nutrients,
Samp
I in
g frequency
Annu
a I l
y
Ever
y 3
yea rs
i f
cont
ami
na
tion
de
tect
ed
at si
te 231
Annua
I ly
Ever
y 3
yea rs
i f
contam i -
nat io
n de
tect
ed
at si
te 233
Every
2 years
Ever
y 5
years
if
contam i -
nat io
n de
tect
ed
at site 235
Every
2 ye
ars
Reas
on fo
r se
lect
ion
Site lo
cate
d within in
dust
rial
area to
determine
any
local
effe
cts
on ground
water.
Site
downgradient and
in flow lines
of
indu
stri
al ar
ea to determine
the
spre
ad
of an
y contaminants detected at site 23
1.
Site located
within in
dust
rial
area to
determine
any
loca
l ef
fect
s on gr
ound
water.
Site lo
cate
d downgradient and
in fl
ow lines
of in
dust
rial
area to
determine
spre
ad of
an
y contaminants de
tect
ed at site 23
3.
Site lo
cate
d within agricultural area to
determine
any
loca
l effects
on ground
water.
Site lo
cate
d downgradient and
in fl
ow lines
of agricultural area to determine
spre
ad
of an
y contaminants detected at site 23
5.
Site lo
cate
d within agricultural area to
determine
any
loca
l effects
of gr
ound
d i s
so
Ive
d
so
l id
sw
ate
r.

TA
BLE
9.-
-San
Fern
ando
ba
sin
g
rou
nd
-wa
ter-
qu
ality
m
on
ito
rin
g
netw
ork
Continued
Index
Site
No.
location
(PL 6)
238
3N/15W-28H
239
3N/15W-28J
We I
I depth
Moni
tori
ng
and
Constituents
obje
ctiv
e (Perforated
to be
sa
mple
d interva
I ),
in feet
Nonpoint
160
(60-110)
Specific conduct
ance
, nu
trie
nts,
d
i sso 1 ve
d so
l id
s
Ambi
ent
170
(70-120)
Spec
ific
co
nduc
tance,
nutrients,
Samp
ling
Re
ason
fo
r frequency
sele
ctio
n
Ever
y 5
Site
located
downgradient and
in fl
ow li
nes
year
s if
of ag
ricu
ltur
al area to
de
term
ine
spre
ad
cont
ami-
of
any
contaminants detected at si
te 237.
nat ion
dete
cted
at site 237
Ever
y 5
Ambient
wate
r qu
alit
y.yea rs
240
242
243
245
246
247
248
249
250
251
252
253
254
2N/14W-32H
2N/14W-32K
2N/14W-32M
2N/14W-31Q
2N/14W-31C
2N/14W-31G
2N/14W-31A
2N/14W-19P
2N/14W-19R
2N/14W-20P
2N/14W-20L
2N/15W-20L
2N/14W-20F
2N/14W-19K
2N/14W-19M
Nonpo int,
ambient
Amb ie
nt
350
(250-300)
340
(240-290)
350
(250-300)
340
(240-290)
Nonpoint
350
(250-300)
Point
Po int
Amb ient
350
(250-300)
340
(240-290)
310
(210-260)
310
(210-260)
290 (190-240)
270
(170-220)
260 (160-210)
240 (140-190)
280 (80-230)
280
(180-230)
DOC, specific
cond
ucta
nce,
toxic
organics,
trace
elements,
d i sso
Ived
sol
ids
Specific co
nduc
t
ance,
nutrients,
d i sso
Ived
sol ids
DOC, specific
cond
ucta
nce,
toxic
organics,
trac
e elements,
d is
soIv
ed sol ids
DOC, specific
cond
ucta
nce,
toxic
organics,
trac
e elements,
d i sso
Ived
so
I ids
DOC, specific
cond
ucta
nce,
to
xic
organics,
trace
elements,
d i sso
lved
sol ids
Specific co
nduc
t
ance,
nutrients,
d i ssoIved sol id
s
Annu
aIly
Ever
y 3
yea rs
Annu
a I l
y
Annu
aI ly
Annua
I ly
Every
3 yea rs
Site located
within in
dust
rial
area to
determine
any
loca
l effects
on ground
wate
r.
Ambient
wate
r quality.
Ambient
wate
r qu
alit
y.
Site located
within in
dust
rial
area to
determine
any
loca
l ef
fect
s on ground
wate
r.
Sites
loca
ted
immediately
down
grad
ient
and
in fl
ow li
nes
of landfills
to determine
any
loca
l ef
fect
s on ground wa
ter.
Sites
located
immediately
downgradient and
in fl
ow li
nes
of landfills
to determine
any
loca
l effects
on ground water.
Ambient
wate
r qu
alit
y.

TA
BLE
9.-
-San
Fern
ando
basin
gro
und-w
ate
r-quality
m
on
ito
rin
g
netw
ork
--C
ontinued
Index
No.
(pl.
6)
Site
loca
t ion
Moni
tori
ngob
ject
ive
Wel
1 de
pth
and
( Pe
rfor
ated
inte
rva
1 ) ,
in fe
et
Constituents
to be sampled
Samp
1 i ng
frequency
Reason for
se lection
255
2N/1UW-19G
00
257
258
259
260
261
262
263
264
265
266
267
268
269
270
271
272
2N/14W-19E
2N/1UW-06E
1N/16W-05C
2N/16W-32R
2N/16W-33G
2N/16W-34C
2N/16W-28P
2N/16W-26P
3N/15W-31D
3N/15W-30K
3N/15W-30H
3N/15W-20P
3N/15W-21N
3N/15W-22P
3N/15W-23N
3N/15W-25C
Point
220
(70-170)
256
2N/1
UW-1
9B
Nonpoint
350
(200
-250
)
Nonpoint
290
(190
-240
)
Nonp
oint
, 510
(410
-460
) am
blen
t
Amb
i ent
Amb ient
100
(30-70)
100
(30-
70)
100
(20-60)
100
(15_60)
120
(35-80)
140
(50-100)
Not
appl
ica
ble.
Some
co
nfin
ed
areas
*250 (1
50-2
25)
J250
(1
50-2
25)
*370 (2
70-3
20)
X250
(150
-225
)
DOC, sp
ecif
ic
Annually
cond
ucta
nce,
toxic
orga
nics
, tr
ace
elem
ents
, dissolved
sol id
s
DOC, specific
Every
2 co
nduc
tanc
e,
years
toxic
orga
nics
, tr
ace
elem
ents
, d
i ssoIved so I id
s
DOC, specific
Annually
cond
ucta
nce,
toxic
organics,
trace
elem
ents
, d
i ssoIved so
l id
s
DOC, sp
ecif
ic
Every
2 conductance,
year
s toxic
orga
nics
, tr
ace
elem
ents
, nu
trie
nts,
d
i ssoIved so I id
s
Spec
ific
co
nduc
t-
Ever
y 5
ance
, nu
trie
nts,
ye
ars
d i ssoIved so
l id
s,
toxic
orga
nics
, tr
ace
elem
ents
Spec
ific
co
nduc
t-
Every
5 an
ce,
nutr
ient
s,
year
s d
i ssoIved so
l id
s,
toxic
orga
nics
, trace
elem
ents
Site
located
immediately
downgradient and
in flow lines
of la
ndfi
ll to
determine
any
loca
l ef
fect
s on gr
ound
wa
ter.
Site
lo
cate
d upgradient of
la
ndfi
ll to be
us
ed as
a
comparison
in determining any
effects
of the
land
fill
on
ground water.
Site located
within in
dust
rial
area to
dete
rmin
e any
loca
l ef
fect
s on ground
wate
r.
Site located
downgradient of
agricultural
area
to determine any
loca
l effects on
grou
nd water.
Ambient water qu
alit
y.
Amb ient.
Amb ient.
Footnote at
en
d of ta
ble.

TA
BLE
9
.--S
an
F
ern
an
do
basin
gro
und-w
ate
r-quality
m
onitoring
netw
ork
Cent
inued
1 ndex
No.
(pl. 6)
273
274
275
276
277
278
279
280
281
282
283
284
285
286
287
288
289
290
291
Site
1 ocat ion
2N/14W-09G
2N/14W-09J
2N/14W-10L
2N/14W-11M
2N/14W-11Q
2N/14W-14A
2N/14W-12P
2N/14W-13B
2N/13W-18Q
2N/13W-20D
2N/13W-21N
2N/13W-21Q
2N/13W-28L
2N/13W-34D
2N/13W-34M
1N/13W-03F
1N/13W-10C
1N/13W-10P
1N/13W-15L
Wel
1 depth
Monitoring
and
objective
(Perforated
inte
rva
1 ),
in feet
Ambient
170
(70-120)
130
(30-
80)
155
(55-
105)
135
(35-
85)
130
(30-80)
135
(35-
85)
160
(60-
110)
285
(185-235)
Ambient
Not
applicable.
Not
defined on
current water-
leve
l maps
1270
(170-220)
240
(140-190)
200
(100-150)
Ambient
240
(140-190)
175
(75-
125)
195
(95-145)
160
(60-110)
Const i tuents
to be
sampled
Specific conduct
ance
, nutrients,
d i ssol ve
d sol
ids,
toxic organics,
trace elements
Specific conduct
ance
, nutrients,
d i sso 1 ve
d sol
ids,
toxic organics,
trace elements
Specific conduct
ance
, nutrients,
d i ssol ve
d sol
ids,
toxic organics,
trace elements
Sampling
Reason for
frequency
selection
Every 5
Ambient.
yea rs
Every 5
Ambient.
years
Every 5
Ambient.
yea rs
^ A
ppro
xim
ate
va
lue
s.