a concise theory of software development in pictures
TRANSCRIPT

© Alistair Cockburn 2016
1
A Concise Theory of Software Development in Pictures Alistair Cockburn March, 2016 http://alistair.cockburn.us

© Alistair Cockburn 2016
2
To an interpreter unforgiving of error
People ...
every decision has economic consequences Making decisions
and resources are limited.
… they don’t understand which keeps changing … they don’t understand which keeps changing … they don’t understand which keeps changing … they don’t understand which keeps changing
Deciding

© Alistair Cockburn 2016
3
Infinite Organization Survival Career Management
Competitive Cooperative
Open-ended Jazz music
Finite goal-directed
King-of-the-hill wrestling
Poker
Tennis
Chess
Rock-Climbing Theater
Journalism Exploration Software
Development
Business
Product Line Management
IT Systems

© Alistair Cockburn 2016
4
frequency & richness of communication
trust
© Alistair Cockburn 2016
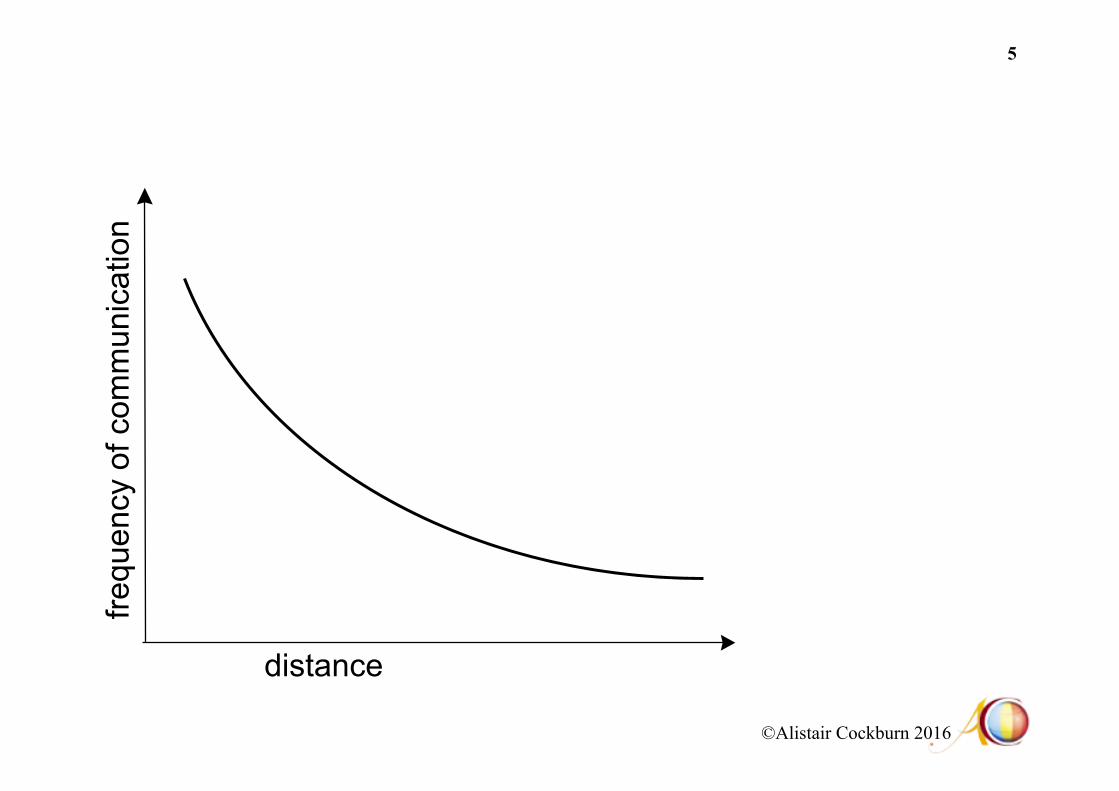
5
distance
frequ
ency
of c
omm
unic
atio
n

© Alistair Cockburn 2016
6
Richness of communication channel
Com
mun
icat
ion
Effe
ctiv
enes
s
2 people on phone
2 people on chat
2 people at whiteboard
Paper (No Question-Answer)
Videotape

© Alistair Cockburn 2016
7
distance
cost
to d
evel
op s
oftw
are

© Alistair Cockburn 2016
8
Cultural power index (nation or organization)
Ease
of c
omm
unic
atin
g ba
d or
unc
omfo
rtab
le n
ews

© Alistair Cockburn 2016
9
Organizational tolerance for ambiguity / uncertainty / flux / concurrency
Productivity
The organizational tolerance determines the set of techniques you can use
The situation may require techniques beyond the organizational tolerance (techniques
using ambiguity uncertainty flux concurrency)

© Alistair Cockburn 2016
10

© Alistair Cockburn 2016
11

© Alistair Cockburn 2016
12
C6 C20 C40 C100
D6 D20 D40 D100
E6 E20 E40 E100
L6 L20 L40 L100
Project Classification Scale:
Number of people coordinated 1 - 6 - 20 - 40 - 100
Comfort
Essential moneys
Life
Discretionary moneys
Criticality
X
X X
X X

© Alistair Cockburn 2016
13
Plan-driven!sweet spot
Time and Effort Invested in Plans
Dam
age
from
!ov
er/u
nder
plan
ning
Agile!sweet spot
Boehm, B.

© Alistair Cockburn 2016
14
Number of people
Communications Load Effectiveness
per person

© Alistair Cockburn 2016
15

© Alistair Cockburn 2016
16
Problem Size
Light methodology
Medium methodology
Heavy methodology # people
needed to
succeed with
project

© Alistair Cockburn 2016
17

© Alistair Cockburn 2016
18

© Alistair Cockburn 2016
19
Tolerance for ambiguity / uncertainty
Prod
uctiv
ity
(usi
ng fl
ux &
unc
erta
inty
)
modern projects
simpler projects
Project requires at least this much productivity to succeed

© Alistair Cockburn 2016
20

© Alistair Cockburn 2016
21
time
Testers 100 lines of code show up for testing
# of design decisions
Decisions being validated / broken
time
Testers 1,000 lines of code show up for testing How long this line of code /
screen / use case / decision sits in the testing queue
How long this line of code / screen / use case / decision sits in the testing queue
Decisions arriving
Example: Arrival at test

© Alistair Cockburn 2016
22
Project 1: Simplify life for the DB designer, make programmers do extra
Project 2: Simplify life for the programmers / tester, make Business Managers do extra
Database designer
Programmer
Programmer
Programmer
Programmer
Programmer
Req’ts
Req’ts
User
Tester
Programmer
Programmer
Programmer
Programmer
Bus. Mgr.
Bus. Mgr. User
User
User
User
Bus. Mgr.

© Alistair Cockburn 2016
23
Delivers nearly no knowledge (or risk reduction)
time
Knowledge comes at the final “moment of truth”
cost
Growth of knowledge with big-bang integration / deployment

© Alistair Cockburn 2016
24
Value
Knowledge / risk reduction
time
Tail
risk value tail Item1 .. … ... item 2 . … .. item 3 .. … . item 4 .. .. . :

© Alistair Cockburn 2016
25 Kano’s Theory of Attractive Quality and Packaging
attributes and they change over time. This perspectiveon quality does not contain any general quality dimen-sions; instead, product attributes are classified into fivecategories according to the theory of attractive quality.
THE THEORY OF ATTRACTIVEQUALITYInspired by Herzberg’s M-H theory in behavioral science,Kano and his coworkers developed the theory of attractivequality. A distinction between satisfaction and dissatisfac-tion was first introduced in the two-factor theory of jobsatisfaction by Herzberg, Bernard, and Snyderman(1959). In essence, the theory posits that the factors thatcause job dissatisfaction are different from the factorsthat cause job satisfaction. The theory of attractive qualityis useful to better understand different aspects of how cus-tomers evaluate a product or offering (Gustafsson 1998).Over the past two decades this theory has gained exposureand acceptance through articles in various marketing,quality, and operations management journals. The
theory of attractive quality has been applied in strategicthinking, business planning, and product development todemonstrate lessons learned in innovation, competitive-ness, and product compliance (Watson 2003).
According to Kano (2001), the theory of attractivequality originated because of the lack of explanatorypower of a one-dimensional recognition of quality. Forinstance, people are satisfied if the packaging of milkextends the expiration date and dissatisfied if the packag-ing shortens the expiration date. For a quality attributesuch as leakage, people are not satisfied if the packagedoes not leak, but they are very dissatisfied if it does.The one-dimensional view of quality can explain therole of expiration but not leakage. To understand therole of quality attributes, Kano et al. (1984) present amodel that evaluates patterns of quality, based on cus-tomers’ satisfaction with specific quality attributes andtheir degree of sufficiency. On the horizontal axis in theKano diagram (see Figure 1) the physical sufficiency ofa certain quality attribute is displayed. The vertical axisshows satisfaction with a certain quality attribute
www.asq.org 9
Customer Satisfaction
Degree of Achievement
Very Satisfied
Very Dissatisfied
Attractive
One-Dimensional
Indifferent
Reverse
Must-Be
Not at All Fully
Figure 1 An overview of the theory of attractive quality.
©20
05, A
SQ
Lofgren 6/22/05 10:41 AM Page 9
Kano

© Alistair Cockburn 2016
26

© Alistair Cockburn 2016
27
mastery
Complicatedness
Shu
Ha
Ri
Kokoro
code-and-deliver
Scrum XP DSDM Lean Kanban
I can’t even tell you
focus on the basics

© Alistair Cockburn 2016
28