a critical item analysis of the qabf: development of a
TRANSCRIPT

Louisiana State UniversityLSU Digital Commons
LSU Doctoral Dissertations Graduate School
2008
A critical item analysis of the QABF: developmentof a short form assessment instrumentAshvind Nand SinghLouisiana State University and Agricultural and Mechanical College
Follow this and additional works at: https://digitalcommons.lsu.edu/gradschool_dissertations
Part of the Psychology Commons
This Dissertation is brought to you for free and open access by the Graduate School at LSU Digital Commons. It has been accepted for inclusion inLSU Doctoral Dissertations by an authorized graduate school editor of LSU Digital Commons. For more information, please [email protected].
Recommended CitationSingh, Ashvind Nand, "A critical item analysis of the QABF: development of a short form assessment instrument" (2008). LSUDoctoral Dissertations. 2624.https://digitalcommons.lsu.edu/gradschool_dissertations/2624

A CRITICAL ITEM ANALYSIS OF THE QABF: DEVELOPMENT OF A SHORT FORM ASSESSMENT INSTRUMENT
A Dissertation
Submitted to the Graduate Faculty of the Louisiana State University and
Agricultural and Mechanical College in partial fulfillment of the
requirements for the degree of Doctor of Philosophy
in
The Department of Psychology
by Ashvind Nand Singh
B.A., Virginia Commonwealth University, 1999 M.A., Louisiana State University, 2005
May 2008
ACKNOWLEDGEMENTS
The encouragement and support of many people contributed to the completion of this
dissertation. I am grateful for the assistance and guidance of my dissertation director and
advisor, Dr. Johnny L. Matson, Ph.D. I wish to thank my committee members, Dr Wm. Drew
Gouvier, Dr. Tracey E. Rizzuto, Dr. Tom E. Davis, III, and Dr. Jianan Wu for their advice and
guidance throughout this study. I would like to give special thanks to Dr. Jie Weiss and Dr.
Michele Mouttapa for their help and guidance regarding the statistical procedures utilized in
this study and to the individuals and staff from Pinecrest Developmental Center in Pinecrest,
Louisiana. I am also grateful to Mr. Ryan Thorson who assisted with data collection and the
reliability and validity checks.
Finally, I extend my deepest gratitude to my mother and father. Without their
encouragement, sacrifice, support, and patience, I would never have been able to reach this goal.
ii

TABLE OF CONTENTS
Acknowledgements .............................................................................................................................. ii
Abstract .................................................................................................................................................... v
Introduction ............................................................................................................................................ 1 History of Intellectual Disabilities .............................................................................................. 1 Definition of Intellectual Disabilities ........................................................................................ 4 Assessment in Intellectual Disabilities ...................................................................................... 8 Behavioral Correlates of Communication .......................................................................... 9 Functional Analysis ............................................................................................................... 10 Brief Functional Assessment ................................................................................................ 11 Difficulties in Assessment ........................................................................................................... 13 Scale Development ............................................................................................................................... 15 Classical Test Theory ................................................................................................................... 15 Factor Analysis .............................................................................................................................. 18 Exploratory Factor Analysis (EFA) .................................................................................. 20 Confirmatory Factor Analysis (CFA) .............................................................................. 25 Scale Development in Intellectual Disabilities ............................................................................ 30 Test Conceptualization .............................................................................................................. 30 Test Construction ......................................................................................................................... 31 Test Tryout .................................................................................................................................... 32 Item Analysis .................................................................................................................................. 33 Test Revision ................................................................................................................................. 34 Questions About Behavioral Function (QABF) .......................................................................... 36 Scope and Development ............................................................................................................. 36 Psychometric Properties and Utility ........................................................................................ 37 Purpose .................................................................................................................................................. 44
Method................................................................................................................................................... 45 Participants .................................................................................................................................... 45 QABF Exploratory Factor Analysis ......................................................................................... 45 Item Selection ................................................................................................................................ 46 QABF Confirmatory Factor Analysis ...................................................................................... 47 Short Form Development and Analysis .................................................................................. 47 Results ................................................................................................................................................... 49 QABF Exploratory Factor Analysis ......................................................................................... 49 Item Selection ................................................................................................................................ 53 QABF Confirmatory Factor Analysis ...................................................................................... 56 QABF-Short Form (QABF-SF) Tryout ................................................................................... 56
iii

iv
QABF-SF Analysis......................................................................................................................... 57 Goodness-of-Fit ...................................................................................................................... 57 Reliability ................................................................................................................................ 58 Social Validity ........................................................................................................................ 60 Discussion ............................................................................................................................................. 62
References ............................................................................................................................................. 70
Vita ........................................................................................................................................................... 77

ABSTRACT
Due to the relative inability of individuals with intellectual disabilities (ID) to provide an
accurate and reliable self-report, assessment in this population is more difficult than with
individuals in the general population. As such, assessment procedures must be adjusted to
compensate for the relative lack of information that the individual can provide and rely more on
the behavioral expression of communication. One method commonly used is the indirect
functional assessment that utilizes behavior rating scales that have been developed to gather
behavioral data in a short time. One of the few empirically derived and psychometrically sound
is the QABF, a 25-item questionnaire designed to rate specific behavioral functions and
maintaining variables. The purpose of this study was to conduct an item analysis to determine
the psychometric properties of the QABF and determine if a short form version could be
developed that is both psychometrically valid and reliable, and clinically useful. Results of the
item selection procedure indicted that the original 25 items could be reduced by ten. Test
tryout procedures showed that the QABF-SF maintained the original five factor structure of the
original while maintaining the high degree of reliability and validity. The QABF-SF appears to
be a useful tool to aid clinicians in the brief functional assessment of behavior in individuals
with ID.
v
INTRODUCTION
History of Intellectual Disabilities
One of the first written accounts of ID dates back to around 1500 B.C. in the therapeutic
papyri of Thebes, in Egypt (Sheerenberger, 1983). The treatment of individuals with intellectual
disabilities (ID) has been typically linked to the current customs and beliefs of the era or culture.
For example, infanticide was common practice in ancient Greece and Rome as children
suspected of developmental delays were often thrown off cliffs (Biasini, Grupe, Huffman, &
Bray, 1999). The belief was that individuals with moderate to severe physical or mental deficits
or handicaps could not hunt, gather, or keep up with the expectations or demands of society.
However, those with mild deficits who could positively contribute to their community with
minimal assistance were usually allowed to live (Sheerenberger, 1983). By the second century
A.D., individuals with disabilities who lived in the Roman Empire were frequently sold and used
for entertainment or amusement. This practice began to decline with the dawning of the
Christian era, but a movement toward humane treatment for individuals with ID was advocated
by all of the early religious leaders such as Jesus, Buddha, Mohammed and Confucius
(Sheerenberger, 1983).
The status and treatment of individuals with ID varied greatly during the Middle Ages
(476 – 1799 A.D.). Although society had developed more humane practices toward the care of
these individuals, there still remained widespread slavery and abandonment (Biasini et al., 1999).
It was not until 1690, when John Locke published An Essay Concerning Human Understanding, in
which he introduced the idea that individual’s were born without innate ideas, that society
began to rethink the notion that individuals with ID were untrainable. Locke’s work
profoundly influenced both the care and training provided to individuals with ID. This was not
the only contribution Locke’s work made to the treatment of individuals with ID because he
1

was also the first to distinguish between ID and mental illness: “Herein seems to lie the
difference between idiots and madmen, that madmen put wrong ideas together and reason from
them, but idiots make very few or no propositions and reason scarce at all” (Doll, 1962).
The evolution of the care and treatment of individuals with ID took a major step with the
works of Jean-Marc-Gaspad Itard and Edouard Seguin (Sheerenberger, 1983). In 1800, Itard was
hired by the Director of the National Institutes for Deaf-Mutes in France to work with a young
boy named Victor. Apparently, Victor had lived his whole life in the woods of south central
France and when captured at the age of 12, was found to be deaf and mute. Itard based his work
with Victor on the ideas set forth by Locke and Condillac who emphasized learning through the
senses. As such, Itard developed a broad-based educational program for Victor to aid him in
developing his senses, intellect, and emotions. After 5 years of training, Victor acquired more
skills and knowledge than many of Itard’s colleagues believed possible, although he still
displayed significant difficulties in language and social interaction. Itard’s work and educational
approach became widely accepted and spurred a new movement in the education of the deaf.
Eventually, the development of this approach led to his work with children with ID. Although
Itard did not personally work with these children, he supervised the work of Seguin
(Sheerenberger, 1983). Seguin’s contribution to the education of children with ID was the
development of a comprehensive educational approach known as the Physiological Method that
assumed a direct relationship between the senses and cognition.
Seguin’s method began with sensory training including vision, hearing, taste, smell, and
hand-eye coordination (Biasini et al., 1999). After a series of sensory instructional training
modules were completed, the curriculum extended to developing basic self care skills and then
onto vocational education that emphasized perception, coordination, imitation, positive
reinforcement, memory, and generalization (Biasini et al., 1999). Seguin moved to the United
2

States in 1850 and became a major force in the education of individuals with ID. In 1876, he
founded an organization known as the American Association on Mental Deficiency, later
becoming the American Association on Mental Retardation. Many of the techniques that
Seguin pioneered have been modified and are still in use today (Biasini et al., 1999).
Two key developments occurred in the United States over the next 50 years that
furthered the education and care movement of individuals with ID: (1) 19 state and 9 privately
operated residential training schools were established (Biasini et al., 1999) and, (2) in 1910
Henry Goddard, Director of Research at the Training School in Vineland, New Jersey, translated
and published an American version of a newly developed intelligence test by French
psychometrist Alfred Binet. The development of the new intelligence test was spurred by the
need to determine which children were eligible for and required special education services. The
original version of the Binet-Simon Individual Tests of Intelligence was intended to distinguish
between subnormal and normal school-aged children and was interpreted in terms of three
levels of intellectual disability from most to least disabled: (1) idiocy; (2) imbecility; and (3)
moronity (Sheerenberger, 1983).
Another development in the advancement of the treatment and care of individuals with
ID was the development of the Vineland Social Maturity Scale in 1935 by Edgar Doll.
Specifically, this scale was developed to assess the adaptive and daily living skills of individuals
suspected of having ID (Doll, 1953). The emergence of these new techniques to identify and
classify individuals with ID gave psychologists and educators hope that it was now not only
possible to identify individuals with developmental delays, but also provide them with
appropriate care and training in residential schools (Biasini et al., 1999). Due to these new
developments, during the early 20th century, residential training schools for individuals with ID
proliferated. Unfortunately, some of this proliferation was due to the naive assumption that
3

4
with proper training individuals with ID could be cured. When these training facilities were
unable to cure the individuals in their care, they became overcrowded and many students were
moved back into society where the focus became special education classes in the community
(Biasini et al., 1999). As a result residential and training facilities, both state and private, became
custodial living centers (Balthazar & Stevens, 1975).
The disillusionment with residential treatment centers in the United States and the
custodial role they began to serve resulted in the founding of advocacy groups such as the
National Association of Retarded Citizens and the President’s Commission on Mental
Retardation in the 1950’s through the 1970’s. Also in the 1970’s a landmark court case, the
Wyatt-Stickney federal court action, helped establish the rights of individuals with ID.
Specifically, this class action suit in Alabama established the right to treatment of individuals
living in residential care facilities, thus making purely custodial care unacceptable. The Wyatt
vs. Stickney case led to several other developments and advances in the care of individuals with
ID. Most notable was the creation of the Education of the Handicapped Act passed by Congress
in 1975, now titled the Individuals with Disabilities Education Act (IDEA). IDEA guarantees
that all children ages 3 to 21 with ID receive appropriate educational services and provides
incentives at the state level for the development and provision of service delivery systems.
Definition of Intellectual Disabilities
The definition of ID has varied greatly over time with early classifications being based on
social competence. However, following the development of standardized intelligence tests and
adaptive scales in the early 1900’s, the definition has become more objective and more focused
(Mathias & Nettlebeck, 1992). In the United States, the elements of the definition of ID were
well accepted by 1900 (Sheerenberger, 1983). These elements included onset in childhood,
significant intellectual or cognitive limitations, and an inability to adapt to the demands of
5
everyday life. In 1910, the American Association on Mental Deficiency proposed a definition that
referred to individuals with ID as feeble-minded, meaning that their development had halted at
an early age or in some way was inadequate thus making it difficult for these individuals to keep
pace with their peers and manage their own lives independently (Committee on Classification,
1910). The Committee defined three levels of impairment: (1) idiot, individuals whose
development is arrested at the level of a 2 year old; (2) imbecile, individuals whose development
is equivalent to that of a 2 to 7 year old at maturity; and (3) moron, individuals whose mental
development is equivalent to that of a 7 to 12 year old at maturity.
According to Yepsen (1941), over the next 30 years the definition of ID focused on three
aspects of development: (1) the inability to learn to perform common acts, (2) deficits or delays
in social development/competence, and (3) low IQ. However, as the services provided to
individuals with ID grew and were increasingly being funded by public money, there was an
increased need for more accurate and clearer set of standards to identify individuals who were
eligible for public services. Thus, it became apparent that new levels needed to be defined and
linked to IQ scores on the newly revised Stanford-Binet intelligence test (Scheerenberger, 1983).
Thus, in 1959, a new classification system of ID was developed by the American Association on
Mental Deficiency. The new definition stated that an individual must demonstrate impaired
adaptive functioning that originated before the age of 16 and consisted of five levels of ID linked
to IQ scores: (1) borderline (IQ of 83-67); (2) mild (IQ of 66-50); (3) moderate (IQ of 49-33); (4)
severe (IQ of 32-16); and (5) profound (IQ of 16 or below). Although this definition covered
three areas, only age of onset and IQ were measurable with existing psychometric techniques as
deficits in adaptive functioning were typically based on subjective interpretations although the
Vineland Social Maturity Scale was available (Scheerenberger, 1983).
In 1973, the definition of ID was revised due to concerns over misidentification,
particularly in minority populations (Grossman, 1973). In the new definition, the classification

of borderline IQ was eliminated. Further, the upper IQ boundary was changed from <85 to ≤70
which significantly reduced the number of individuals who were previously identified as
mentally retarded. In 1977, the definition was again revised and the upper IQ limit was set at 70-
75 to account for measurement error (Grossman, 1977). Thus, IQ scores of 71 through 75 were
only consistent with ID when significant deficits in adaptive functioning were present. The new
definition contributed a new feature to the understanding of ID, that is, impairment in adaptive
functioning (Scheerenberger, 1983). Thus, researchers began focusing on the elements of
adaptive functioning: basic motor and self-help skills; learning; and social adjustment. New
methods for measuring adaptive functioning were developed and two rating scales were
introduced: the AAMD Adaptive Behavior Scale (ABS; Nihira, Foster, Shallhaas, & Leland, 1969)
and the Vineland Adaptive Behavior Scale (VABS; Sparrow, Balla, & Cicchetti, 1984).
Currently, in the Diagnostic and Statistical Manual-IV-Text Revision (APA, 2000)
developmental disability is characterized by three criteria: (1) sub-average intellectual
functioning, (2) significant limitations in adaptive skills, and (3) onset before age 18.
Intellectual functioning is defined by the intelligence quotient (IQ) and is obtained with the use
of one or more standardized administered tests (i.e., Stanford-Binet, Wechsler Intelligence
Scales). Sub-average intellectual functioning is defined as an IQ score of 70 or below, or two
standard deviations below the mean. However, although IQ is a defining factor of intellectual
functioning, there is widespread dissatisfaction with the reliance on measures of intelligence
because of co-variation with socioeconomic factors (Flanagan, Genshaft, & Harrison, 1997).
These concerns added to those of Blatt and Kaplan (1966) who elucidated the problems on
relying too heavily on IQ, thus highlighting the need for the consideration of adaptive behavior.
A limitation in adaptive functioning constitute the second criteria associated with the
diagnosis of ID and refers to an inability to cope with life’s demands typical of someone of the
6

7
same age, background, and community surroundings (APA, 2000). This criterion requires
significant skill deficits in two or more of the following areas: communication, self-care, home
living, social/interpersonal skills, use of community resources, self-direction, functional
academic skills, work, leisure, health, or safety (APA, 2000). Scales such as the Vineland
Adaptive Behavior Scales (VABS) have been designed to assess levels of adaptive functioning
(Sparrow, Balla, & Cicchetti, 1984).
The third criterion required for the diagnosis of developmental disability is onset before
the age of 18. Specifically, the DSM-IV-TR (APA, 2000) states that the age of onset is typically
linked to the etiology and level of intellectual impairment; that is, more severe ID tend to be
recognized earlier than milder disabilities. Further, disabilities associated with syndromes such
as Fragile X are usually diagnosed at birth whereas disabilities with an unknown etiology tend
to be diagnosed later in life (Greenspan, 1999).
For the most part, the different levels of ID are still associated with ranges in IQ scores.
The DSM-IV-TR (APA, 2000) describes four levels of ID: (1) mild (IQ 50-55 to 70); (2) moderate
(IQ 35-40 to 50-55); (3) severe (IQ 20-25 to 35-40); and (4) profound (IQ below 20-25). Mild
ID accounts for approximately 85% of all individuals with ID (APA, 2000; Greenspan, 1999).
Individuals in this range typically develop social and communication skills, have minimal
sensorimotor impairment, and are often indistinguishable from non-disabled individuals.
Although individuals with mild ID usually learn and maintain social and vocational skills, they
may require supervision, guidance, and assistance.
Individuals in the moderate range account for approximately 10% of all individuals with
ID (Greenspan, 1999). These individuals typically acquire communication skills during
childhood and with moderate supervision profit from vocational training and can attend to their
own personal needs. The DSM-IV-TR (APA, 2000) states that individuals with moderate ID
can, with moderate supervision, generally adapt well to life in the community.

The third level of impairment, severe, accounts for approximately 3% to 4% of all
individuals with ID (Greenspan, 1999). Individuals in this range typically do not develop
communication skills during early childhood, but may learn to talk and gain some simple self-
care skills during school-age. These individuals require supervision in most settings (APA,
2000).
The fourth, and most severe, level of ID is the profound range. Individuals with profound
disability account for approximately only 1% of all individuals with ID and their disability often
stems from an identified neurological condition (Greenspan, 1999). Individuals in this range
often have considerable impairment in sensorimotor functioning, communication, and self-care
skills; although these areas may be improved with appropriate training. However, these
individuals generally require highly supervised and individualized care (APA, 2000).
Assessment in Intellectual Disabilities
Many individuals with intellectual disabilities (ID) are non-verbal and must use other
means to communicate or control their environment. Researchers suggest that individuals with
ID who have limited communication skills rely primarily on expressive behavior to
communicate their wants and needs (Dura, 1997; Durand & Carr, 1991). In fact, these limited
skills can lead to communication in the form of socially inappropriate or maladaptive behavior
such as aggression, self-injury, or self-stimulatory behavior (Menolascino, Levitas, & Greiner,
1986). Therefore, aggression, property destruction, self-injury and other socially inappropriate
behaviors may serve a functional purpose for an individual (Carr & Durand, 1985). However, in
order to understand why a maladaptive behavior is occurring, and therefore its functional
purpose, one must identify the contingencies that maintain it (Bandura, 1969; Skinner, 1953). In
order to identify maintaining contingencies of behavior, psychologists typically assess the
antecedents and consequences that are functionally related to it.
8

9
Behavioral Correlates of Communication
Researchers have identified five primary maintaining functions of maladaptive behavior;
these are attention, escape, tangible reinforcement, physical discomfort, and non-social
reinforcement (Carr, 1994; Derby et al., 1992; Lowry & Sovner, 1991; Taylor, Ekadahl,
Romancyzk, & Miller, 1994). For example, an individual may engage in physical aggression in
the form of hitting when he or she wants somebody to interact with them, either in a positive or
negative manner. In this case, the function of the behavior for the individual is to get attention.
In another situation, the same individual may hit to get out of being somewhere or doing
something that they do not like. This individual has learned that if they hit someone, staff will
typically remove them from the environment or stop making the demand. In this situation, the
individual’s hitting is maintained by being allowed to escape a situation or task they do not like.
In another example, when an individual engages in maladaptive behavior and is rewarded by
getting something he or she wants such as a favorite toy, the maintaining consequence of the
behavior is gaining access to the toy. The function of the individual’s behavior is to gain access
to a tangible. Another communicative function of maladaptive behavior is conveying physical
discomfort; this is particularly salient in individuals with ID who often have multiple comorbid
health concerns. For example, sometimes an individual will hit one of their ears repeatedly
because he or she has an earache or are trying to tell you that they are physically sick. Lastly, an
individual may engage in maladaptive behavior for non-social reasons, such as to attenuate pain,
avoid boredom, or provide themselves with some type of stimulation. Currently, there are two
primary assessment methods used to gather information and data regarding the functional
behavior of individuals with ID: 1) functional analysis, and 2) brief functional assessment.
Functional Analysis
Haynes and O’Brien (1990) proposed that a functional analysis should be defined as “the
identification of important, controllable, causal functional relationships applicable to a specified

set of target behaviors for an individual.” Generally, the functional analysis procedure involves
systematically manipulating the antecedents and consequences of behavior and inferring the
function from the resulting rate change (Iwata, Dorsey, Slifer, Bauman, & Richman, 1982). Thus,
functional analysis procedures can be seen as a process to aide clinicians to systematically
identify predictive relationships between events in the environment and the occurrence of target
behaviors such as physical or verbal aggression, pica, self-injury, or property destruction.
The development and introduction of functional analysis is typically attributed to Iwata
et al. (1982) and has been widely used in the research literature to study maladaptive behaviors
in individuals with ID. The procedure for the functional analysis of behavior is fairly simple and
straightforward. It begins with identification of the target behavior. After the target behavior
has been identified, it is operationalized and baseline data are collected and analyzed. The next
step is to conduct an experimental functional analysis. After the experimental analog sessions
are conducted the data are compared with baseline data. The clinician then develops and
implements a behavioral treatment that targets an individual’s maladaptive behavior and uses
skills training to teach the individual functionally alternative adaptive behavior. As such, the
prescribed interventions are typically are based on the consequences of the behavior and do not
the individuals motivation.
The defining feature of functional analysis is the systematic identification of the
environmental determinates of behavior (Iwata, 1994). In effect, the functional analysis
procedure isolates and controls those contingencies the psychologist feels may maintain an
individual’s behavior using standardized procedures (Iwata et al., 1982; Wacker et al., 1990).
The purported advantage of using this type of methodology is that the clinician can use the
results to select the most effective treatment; that is, at least theoretically, based on the function
of an individual’s behavior and the conditions that maintain it. Basing treatment on the function
10

11
of the behavior is important because in order for treatment to be effective, the desired
replacement behavior must serve the same function as the target behavior (Wacker et al., 1990).
When developing a behavioral treatment plan, a problem occurs when the function of
the replacement behavior does not match the function of the original target behavior. In fact,
researchers have suggested that treatments based on a general assessment strategy, such as
functional analysis, is likely to fail if the antecedent and consequent factors that are chosen do
not adequately match those in the natural environment (Sturmey, 1995). Further limiting
functional analysis is fact that a maladaptive target behavior may serve several functions (Gable,
1996) or be maintained by more than one mechanism such as positive and negative
reinforcement (Durand & Carr, 1992; Smith, Iwata, Vollmer, & Zarcone, 1993). These factors
add to the time and cost of implementing the functional analysis procedure and tend to produce
confusing or unclear results. Taking into account these considerations, as well as some of the
ethical implications of eliciting potentially dangerous behavior, it is no wonder that clinicians
are moving past the functional analysis and exploring assessment options that are more cost
effective, and less time and resource consuming, such as the brief functional assessment.
Brief Functional Assessment
Several steps are involved in conducting a brief functional assessment. The first step is
developing an operational definition of the target behavior in observable and measurable terms.
Second, an indirect functional assessment is begun with a structured interview conducted with
those staff and other individuals who spend a significant amount of time with the client (see
O’Neill, Horner, Albin, Storey, & Sprague, 1990). Individuals who can be interviewed include,
but are not limited to, direct care staff, teachers, parents, and friends. Third, rating scales are
used to help determine environmental variables maintaining an individual’s behavior. The goal
of interviews and informal data collection is to develop a hypothesis regarding what function the
behavior serves for the individual and factors that may maintain it.
Fourth, after the indirect assessment has been performed and the data analyzed, the
clinician should have developed several hypotheses as to the function of the target behavior.
However, as the informal assessment utilized indirect assessments, no direct observations of the
target behavior have been conducted. As such, a direct assessment is then usually undertaken;
unless the target behavior is of low frequency and direct observation is not feasible. The goal of
the direct assessment is to clarify environmental variables that may be maintaining the
individuals target behavior and provide other clinically relevant information. This type of
assessment involves analyzing the frequency of the behavior over specific time intervals, time
periods, patterns, and contexts.
Finally, the psychologist looks for correlations among information gathered from the
interviews, data from the rating scales, and direct observations. Often, the combination of the
data will yield possible functions of the target behavior. Based on this information, a behavioral
intervention is designed to target the maladaptive behavior that alters antecedent events that
elicit the behavior (Weeks & Gaylord-Ross, 1981), reinforces appropriate alternative behavior
(Carr & Durand, 1985), or eliminates access to reinforcement via extinction (Iwata, Pace,
Kalsher, Cowdery, & Cataldo, 1990).
Several methods for collecting data during a brief functional assessment have been
identified in the literature. One of the most prominent is called scaling and utilizes behavior
rating scales. Behavior rating scales are a type of rating scale that collects data via a third-party
informant familiar with the individual being assessed to respond to questions about the
individual’s behavior and its possible functions. Questions on the behavior rating scale typically
address observable behavior, rely less on subjective impressions, and are designed to assess
various constructs, skills, deficits, and other observable behaviors. Examples of behavior rating
scales commonly used are the Diagnostic Assessment of the Severely Handicapped-II (DASH-II;
12
13
Matson, 1995a), the Behavior Problems Inventory (BPI; Rojahn, Polster, Mulick, & Wisniewski,
1989), the Aberrant Behavior Checklist (ABC; Aman & Singh, 1986), and the Assessment of Dual
Diagnosis (ADD; Matson & Bamburg, 1998).
Adaptive functioning scales also utilize indirect assessment methods to gather data
during a brief functional assessment. Some common adaptive functioning rating scales are the
Vineland Adaptive Behavior Scale (VABS; Sparrow, Balla, & Cicchetti, 1984) and the Adaptive
Behavior Scale (ABS; Nihira, Leland, & Lambert, 1993). Assessment of social skills excesses and
deficits can also be accomplished using an indirect assessment. One widely used measure is the
Matson Evaluation of Social Skills in Individuals with sEvere Retardation (MESSIER; Matson,
1995b). Rating scales that identify functional variables that maintain problem behavior also
routinely utilize indirect assessment methods and are often used instead of a formal functional
analysis. Two behavior rating scales that are commonly used in a brief functional assessment
include the Motivational Assessment Scale (MAS; Durand & Crimmins, 1988), and the
empirically validated Questions About Behavioral Function (QABF; Vollmer & Matson, 1995).
Difficulties in Assessment
Due to the relative inability of individuals with ID to provide an accurate and reliable
self-report, assessment in this population is more difficult than with individuals in the general
population. As such, assessment procedures must be adjusted to compensate for the relative
lack of information that the individual can provide. In the assessment of individuals with ID,
examiners are forced to rely more heavily on observable behaviors exhibited by the individual
and/or reports of observable behavior. Complicating the assessment of behavior problems
among individuals with ID is the lack of requisite time, training, personnel, or resources
practitioners have to conduct in vivo functional analyses. Thus, the brief functional assessment
has emerged as the assessment method of choice for professionals who work in large hospitals
and not in small research laboratories.

Although less resource consuming than functional analysis, the process of conducting a
brief functional assessment can still be an exhaustive process, depending on the nature and
number of the individual’s behavior problems and the quality of the reinforcement maintaining
them. Thus, even within the brief functional assessment, measures need to be as short as
possible while providing enough data to be clinically useful. For example an individual may
engage in the maladaptive behavior across contexts, or the behavior may serve multiple
functions for the individual depending on the environment. Another concern is the quality of
the data gathered. In order to obtain the most reliable and valid information in less than ideal
circumstances, items chosen for inclusion on any measure must be the best ones to access the
desired information. Added to these constraints are issues of staff training (i.e., clinical
psychologist versus front line staff), patterns of staffing support (i.e., high turnover, staff
coverage, and mandatory overtime) and systems issues related to the provision of care.
14

SCALE DEVELOPMENT
The assessment of individual differences has a very long history dating back to the use of
formal testing procedures for selection and performance appraisal by the Chinese civil service in
2200 B.C. (Bowman, 1989). The system developed by the Chinese eventually became the model
followed by British, French, and German governments of the 19th century. Also, during this time,
the science of testing and measurement gained significant momentum with the rise in interest in
individual differences. Several factors spurred interest in this new science, including the work
of the English naturalist Charles Darwin, the experimental psychological works of Wilhem
Wundt and Hermann Ebbinghaus, the study of intelligence in France by Alfred Binet and
Theodore Simon, and the work of English biologist Sir Francis Galton (Kline, 2005). One of the
seminal events in testing and test development occurred when Binet and Simon were
commissioned by the French minister of public education to develop a test to identify those
children who would not or could not benefit from traditional instruction in the regular school
system (Kline, 2005). Their work resulted in the first formal intelligence test and the
development of formal test theory.
Classical Test Theory
In order to provide an overview of classical test theory, it is first important to introduce
five measurement problems that Crocker and Algina (1986) posit as common to all psychological
assessments and that all test developers must cope with: (1) no single approach to the
measurement of any construct in universally accepted; (2) psychological measurements are
usually based on limited samples of behavior; (3) the measurement is always subject to error; (4)
the lack of well-defined units on the measurement scales poses still another problem; and (5)
psychological constructs cannot be defined only in terms of operational definitions but must
also have demonstrated relationships to other constructs or observable phenomena.
15

Classical test theory is a body of related psychometric theories that predict outcomes of
psychological testing, such as the difficulty of items or the ability of test-takers (Cohen &
Swerdlik, 1998). Generally, the aim of classical test theory is to understand and improve the
reliability of psychological tests. The term classical refers not only to the chronology of these
models but also contrasts with the more recent psychometric theories, generally referred to
collectively as Modern test theory, also referred to as Item Response theory (Kline, 2005).
While there are several types of classical test theories, their common foundation rests on
the assumption that an individual’s observed raw scores (X) are composed of true (T) and error
(E) scores. This definition is formally stated as:
X = T + E
However, classical test theory is never used to analyze individual test scores; rather, the
focus of the theory is on properties of test scores relative to populations of people (Kline, 2005).
Classical test theory is concerned with the relations between the three variables X, T, and E in
the population. These relationships are used to say something about the quality of test scores
and, thus, of the test itself (Crocker & Algina, 1986). In this regard, the most important concept
within test theory is that of reliability. The reliability of the observed test score X, which is
denoted as , is defined as the ratio of true score variance to the observed score variance
:
Because the variance of the observed scores can be shown to equal the sum of the
variance of true scores and the variance of error scores, this is equivalent to:
16

17
This equation, which formulates a signal-to-noise ratio, has intuitive appeal for
statisticians and test developers (Kline, 2005). The appeal is that as the reliability of test scores
becomes higher, the proportion of error variance in the test scores becomes lower and vice versa.
The reliability is equal to the proportion of the variance in the test scores that we could explain
if we knew the true scores. The square root of the reliability is the correlation between true and
observed scores.
However, reliability is not, as is often suggested in textbooks, a fixed property of tests,
but a property of test scores relative to a particular population (Kline, 2005). This is because
test scores will not be equally reliable in every population. For example, the reliability of test
scores will be lowered by restriction of range. Thus, IQ-test scores that are highly reliable in the
general population will be less reliable in a population of college students. Further, test scores
are perfectly unreliable for any given individual because the true score is a constant at the level
of the individual, which implies it has zero variance, so that the ratio of true score variance to
observed score variance, and hence reliability, is zero. The reason for this is that, in the Classical
test theory model, all observed variability in an individual’s scores is random error by definition.
Thus, Classical test theory is relevant only at the level of populations and not at the level of
individuals (Crocker & Algina, 1986).
Reliability cannot be estimated directly because that would require one to observe the
true scores, which according to Classical test theory is impossible (Cohen & Swerdlik, 1998;
Kline, 2005). However, estimates of reliability can be obtained by other means. One way of
doing this is by constructing a parallel test or using parallel test forms. A parallel test is a test
that, for every individual, yields the same true score and the same observed score variance as the
18
original test (Crocker & Algina, 1986; Lord, 1959). The estimation of reliability by the use of
parallel tests is cumbersome because parallel tests are very hard to come by and the method is
rarely used. Instead, researchers use a measure of internal consistency known as Cronbach's
alpha (Cohen & Swerdlik, 1998; Crocker & Algina, 1986; Kline, 2005). Cronbach's alpha can be
shown to provide a lower bound for reliability under rather mild assumptions (Cronbach, 1951).
Thus, the reliability of test scores in a population is always higher than the value of Cronbach's
alpha in that population. Researchers have found that this method of estimating reliability to be
more empirically feasible and, as a result, it is very popular. As noted previously, the exercise of
Classical test theory is performed to arrive at a suitable definition of reliability. Reliability is
supposed to say something about the general quality of the test scores in question (Crocker &
Algina, 1986). The general idea is that, the higher the reliability, the better the test. Although
Classical test theory does not say how high reliability is supposed to be, generally a value over
.80 is deemed acceptable while a value over .90 is good (Kline, 2005). Values between .70 and
.80 are seen as mediocre but still acceptable and values below .70 are considered bad (Kline,
2005).
By far, Classical test theory is the most influential theory of test scores in the social
sciences (Crocker & Algina, 1986; Kline, 2005). However, in the field of psychometrics, the
theory has been superseded by the more sophisticated models in Item Response theory.
However, Item Response theory models have been very slow to catch on in mainstream research.
One of the main reasons for the slow acceptance and lack of wide use of Item Response theory is
the lack of availability of user-friendly software. For example, Item Response theory is not
included in standard statistical packages, such as SPSS.
Factor Analysis
A common procedure used in the development of tests that measure individual
differences is the factor analysis. This procedure has its origins in the study of human
intelligence and was devised as a method for comparing the outcomes of objective tests and to
construct matrices to define correlations between these outcomes and finding the factors that
are responsible for these results (Thompson, 2004). Historically, the development of factor
analysis within the field of psychology is typically credited to Charles Spearman who discovered
that school children's scores on a wide variety of seemingly unrelated subjects were positively
correlated. This finding led him to postulate that a general mental ability, or g, underlies and
shapes human cognitive performance. His postulate now enjoys broad support in the field of
intelligence research, where it is known as the g theory (Thompson, 2004).
In the late 1940’s, Raymond Cattell expanded on Spearman’s idea of a two-factor theory
of intelligence after performing his own tests and factor analysis. He used a multi-factor theory
to explain intelligence and address alternate factors in intellectual development, including
motivation and psychology (Cattell, 1950). Cattell also developed several mathematical
methods for adjusting psychometric graphs, such as his scree test and similarity coefficients and
lead to the development of his theory of fluid and crystallized intelligence. Cattell was a strong
advocate of factor analysis and believed that all theory should be derived from research and the
use of empirical observation and objective testing to study human intelligence (Lohman, 1989).
Since the pioneering work of Spearman and Cattell, researchers have continued to use the factor
analysis procedure to develop and refine both theories regarding individual differences and the
tests that are used to measure them.
The basic hypothesis of the factor analysis procedure is that within any given domain of
human performance there exist a small number of common factors that influence the numerous
surface attributes of an individual, that is, attributes that can be observed and measured (Kim &
Mueller, 1978a). For example, in the domain of mental abilities, tests could be developed that
measure different kinds of attributes such as addition problems, spelling, or memory; each one of
19

these test represent a surface attribute. A cornerstone of this basic hypothesis with regard to
factor analysis and surface attributes is that there exist internal attributes, the unobservable
characteristics of individuals that differ between individuals in degree and are more
fundamental that surface attributes (Kim & Mueller, 1978a). A set of surface attributes
measured by a given test is referred to as a battery of surface attributes. Within the surface
attribute of mental ability, internal attributes could be numerical, verbal, or performance ability.
While internal attributes cannot be directly measured, they are reflected when one
obtains a measure of the surface attribute. These internal attributes are often referred to as
factors. Within internal attributes, or factors, there are two types: common and specific.
Common factors are those internal attributes that affects more than one surface attribute in the
selected battery. For example, if the selected battery of surface attributes within a test includes
more than one that is influenced by verbal ability (e.g. both a spelling and reading test) then
verbal ability is a common factor. Specific factors, on the other hand, only influence one of the
surface attributes within the battery. While there may be a number of specific factors for any
given surface attribute, their influences can be viewed as being combined into a single specific
factor. The essential principle is that internal factors affect surface attributes in a systematic
manner (Gorsuch, 1990). Thus, the mathematical procedures of the factor analysis are utilized
to identify and clarify the nature of this relationship. Typically during scale development
researchers will use two types of factor analysis: exploratory and confirmatory.
Exploratory Factor Analysis (EFA)
Generally, the EFA is used to discover the factor structure of a measure and examine its
internal reliability. EFA is often recommended when researchers have no hypotheses about the
nature of the underlying factor structure of their measure. The EFA has three basic decision
points: (1) choosing an extraction method, (2) choosing a rotation method, and (3) deciding the
20
number of factors. In a recent PsychINFO search, over 1700 studies were found that used EFA
procedures over a two year period (Costello & Osborne (2005). However, while the EFA
presents the norm in literature, it is a complex procedure with few absolute guidelines and a
variety of options (Costello & Osborne, 2005). Adding to this confusion is that EFA options
vary across software packages, and in most cases, these options are not very well defined.
Further, study design, data properties, and the question of interest all have a bearing on which
procedure will yield the maximum benefit (Costello & Osborne, 2005). Literature suggests that
there are four primary issues that should be considered when determining the best EFA
procedure: 1) method of extraction, 2) number of factors to retain for rotation, 3) orthogonal vs.
oblique rotation, and 4) adequate sample size.
The default method of extraction of many popular statistical packages, including SPSS
and SAS, is the Principle Components Analysis (PCA). However, statisticians disagree on the
utility of PCA, as it is not a true method of factor analysis due to the partition of shared variance,
and when it should be used (Bentler & Kao, 1990). Some argue that the use of PCA should be
restricted in favor of a true factor analysis method (Snook & Gorsuch, 1989). However, others
argue that there is almost no difference between PCA and factor analysis, or that PCA is the
preferable method of analysis (Velicer & Jackson, 1990). The choice of extraction method is
often left up to the researcher, although given that PCA is the default method of extraction in
statistical packages, PCA is the most commonly used method of extraction seen in the literature
(Costello & Osborne, 2005).
Besides PCA, there are several other factor analysis extraction methods available. For
example, SPSS has five in addition to PCA: unweighted least squares, generalized least squares,
maximum likelihood, principal axis factoring, alpha factoring, and image factoring. However,
information regarding the relative weakness and strengths of each of these extraction methods is
21

scarce (Costello & Osborne, 2005). Complicating matters further, there are no exact names for
several of these methods; it is often hard to figure out which method is being described in many
textbook or journal articles; and the availability of specific methods within software packages is
sometimes hard to determine. Recently, Fabrigar, Wegener, MacCallum and Strahan (1999)
argued that if the data being analyzed are relatively normally distributed, the Maximum
Likelihood (ML) extraction method is the best choice because “it allows for the computation of
a wide range of indices of the goodness-of-fit of the model [and] permits statistical significance
testing of factor loadings and correlations among factors and the computation of confidence
intervals.” (p. 277). If the assumption of normality of the data is violated, these authors
recommend one of the principle factor methods; in SPSS a procedure called “Principle Axis
Factors (PAF)” (Fabrigar et al., 1999). In general, literature suggests that ML or PAF will give
the best results, depending on whether the data are generally normally distributed or not
(Costello & Osborne, 2005).
The second issue concerns the number of factors to retain. Both underextraction and
overextraction of the factors to be retained can have deleterious effects on the results (Costello
& Osborne, 2005). The most common approach to deciding the number of factors in common
statistical packages is to retain all factors with eigenvalues greater than 1.0 and to then generate
a scree plot, a two dimensional graph with factors on the x-axis and eigenvalues on the y-axis.
Eigenvalues represent the variance accounted for by each underlying factor. They are not
represented by percentages but scores that total to the number of items. For example, a 12-item
scale will theoretically have 12 possible underlying factors; each factor will have an eigenvalue
that indicates the amount of variation in the items accounted for by each factor. Eigenvalues are
typically arranged in a scree plot in descending order:
22

Factors
Eigenvalues
From the scree plot above, it is evident that the first two factors account for most of the
variance and have the highest eigenvalues, thus the remaining factors all have small eigenvalues.
However, there is broad consensus among psychometric researchers that this is among the least
accurate methods for selecting the number of factors to retain (Velicer & Jackson, 1990). There
are alternative tests for factor retention available, including the scree test, Velicer’s MAP
criteria, and parallel analysis, however, they are not available in the most frequently used
statistical software packages and must be calculated by hand (Costello & Osborne, 2005).
Thus, researchers rely on the default method found in most software packages; that is,
eliminating those factors with eigenvalues less than 1.0.
Once an initial solution is obtained and the number of factors for retention has been
determined, the next decision is the method used for rotation. The goal of factor rotation is to
maximize high loadings and minimize low loadings so that the simplest possible structure is
achieved; in other words, to mathematically simplify and clarify the data structure (Child, 1990).
Thus, rotation serves to make the output more understandable and is usually necessary to
facilitate the interpretation of factors. The sum of eigenvalues is not affected by rotation, but
rotation will alter the eigenvalues and percent of variance explained by particular factors and
will change the factor loadings. Since alternative rotations may explain the same variance but
23

have different factor loadings, and since factor loadings are used to intuit the meaning of factors,
different meanings may be ascribed to the factors depending on the rotation, a problem often
cited as a drawback to factor analysis (Child, 1990). As with extraction methods, there are a
variety of choices. However, there are two basic types of rotation: orthogonal and oblique. In
orthogonal rotation, the factors are assumed to be uncorrelated with one another; this is the
default setting in most statistical packages. These orthogonal methods produce factors that are
uncorrelated and include: varimax, quartimen, and promax rotations. Oblique rotation derives
factor loadings based on the assumption that the factors are correlated.
According to conventional wisdom, researchers in the social sciences are advised to use
orthogonal rotation because it produces more easily interpretable results (Costello & Osborne,
2005). Ideally, after the researcher has rotated the factor loadings a clearer picture of the
relationship between the internal factors and the surface attribute should emerge (Kim &
Mueller, 1978b). The researcher then knows the factor structure of their test, or construct, and
can then label the factors that contribute the most variance to an individual’s performance on
the surface attribute being measured. Orthogonal rotation output is only slightly simpler than
that of an oblique rotation. In SPSS output, the rotated factor matrix is interpreted after
orthogonal rotation. However, the substantive interpretations of orthogonal and oblique
rotations are essentially the same (Costello & Osborne, 2005).
The last issue within the choice of EFA procedure appropriateness concerns sample size.
After recently reviewing articles listed in PsychINFO that reported using some form of principle
components or exploratory factor analysis over the past two years, Costello and Osborne (2005)
suggest that the best determinant of subject size is the ratio of subjects to items. These authors
also found that strict rules regarding sample size for EFA have largely disappeared. Other
researchers have suggested that adequate sample size is partially determined by the nature and
24
availability of the data (Fabrigar et al, 1999). Generally, researchers agree that the stronger the
data, the smaller the sample can be for accurate analysis (Mulaik, 1990) and that a factor with
three or fewer items is generally weak and unstable (Costello & Osborne, 2005).
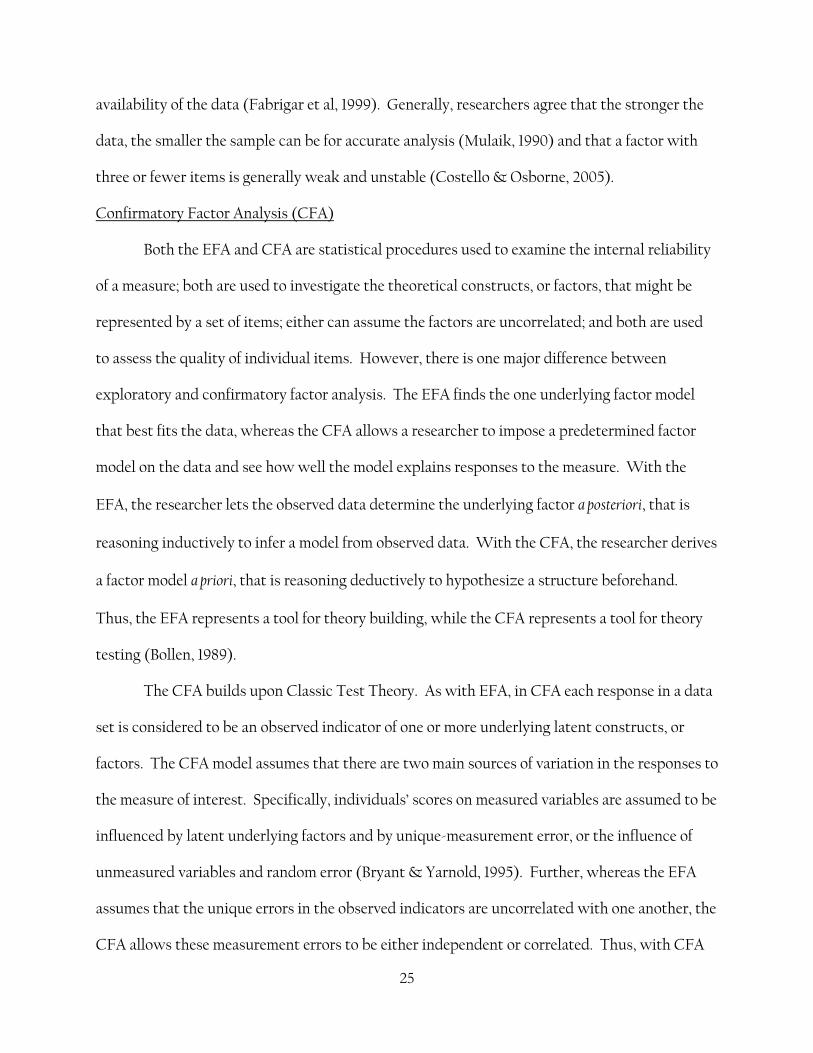
Confirmatory Factor Analysis (CFA)
Both the EFA and CFA are statistical procedures used to examine the internal reliability
of a measure; both are used to investigate the theoretical constructs, or factors, that might be
represented by a set of items; either can assume the factors are uncorrelated; and both are used
to assess the quality of individual items. However, there is one major difference between
exploratory and confirmatory factor analysis. The EFA finds the one underlying factor model
that best fits the data, whereas the CFA allows a researcher to impose a predetermined factor
model on the data and see how well the model explains responses to the measure. With the
EFA, the researcher lets the observed data determine the underlying factor a posteriori, that is
reasoning inductively to infer a model from observed data. With the CFA, the researcher derives
a factor model a priori, that is reasoning deductively to hypothesize a structure beforehand.
Thus, the EFA represents a tool for theory building, while the CFA represents a tool for theory
testing (Bollen, 1989).
The CFA builds upon Classic Test Theory. As with EFA, in CFA each response in a data
set is considered to be an observed indicator of one or more underlying latent constructs, or
factors. The CFA model assumes that there are two main sources of variation in the responses to
the measure of interest. Specifically, individuals’ scores on measured variables are assumed to be
influenced by latent underlying factors and by unique-measurement error, or the influence of
unmeasured variables and random error (Bryant & Yarnold, 1995). Further, whereas the EFA
assumes that the unique errors in the observed indicators are uncorrelated with one another, the
CFA allows these measurement errors to be either independent or correlated. Thus, with CFA
25
one can parcel out the error variance that variables share as a result of common methods of
assessment to examine relationships between variables independent of both unique and
correlated measurement error (Bryant & Yarnold, 1995).
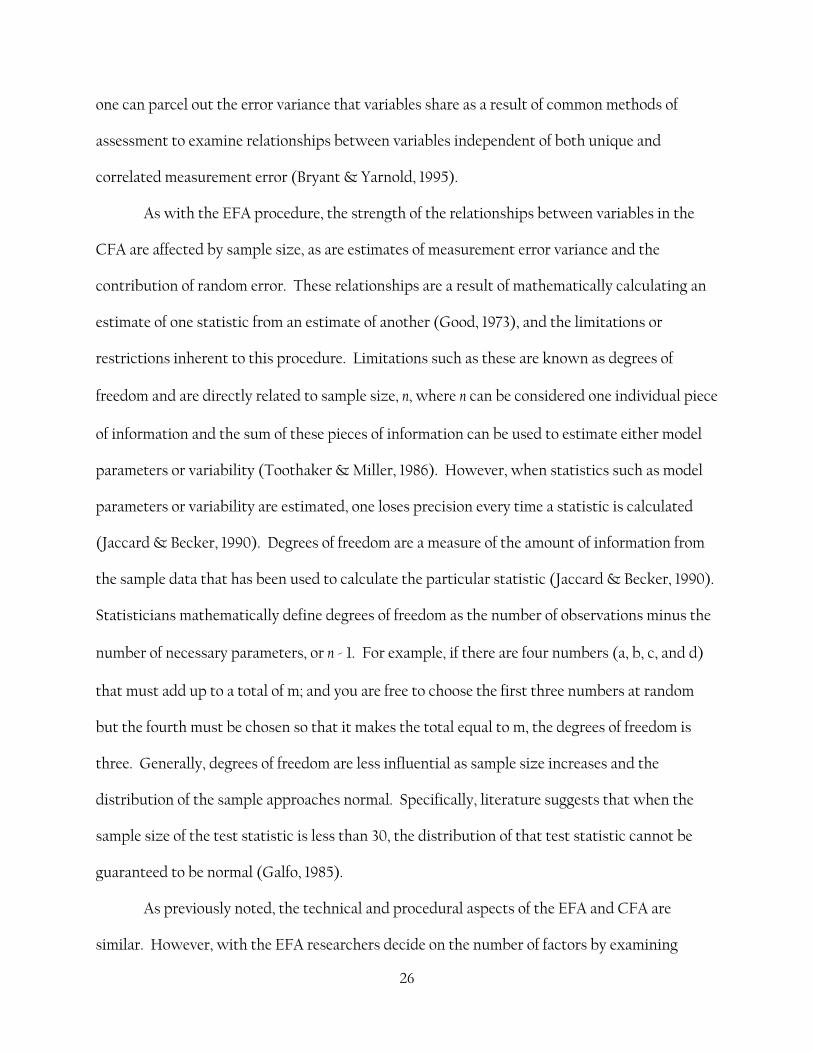
As with the EFA procedure, the strength of the relationships between variables in the
CFA are affected by sample size, as are estimates of measurement error variance and the
contribution of random error. These relationships are a result of mathematically calculating an
estimate of one statistic from an estimate of another (Good, 1973), and the limitations or
restrictions inherent to this procedure. Limitations such as these are known as degrees of
freedom and are directly related to sample size, n, where n can be considered one individual piece
of information and the sum of these pieces of information can be used to estimate either model
parameters or variability (Toothaker & Miller, 1986). However, when statistics such as model
parameters or variability are estimated, one loses precision every time a statistic is calculated
(Jaccard & Becker, 1990). Degrees of freedom are a measure of the amount of information from
the sample data that has been used to calculate the particular statistic (Jaccard & Becker, 1990).
Statisticians mathematically define degrees of freedom as the number of observations minus the
number of necessary parameters, or n - 1. For example, if there are four numbers (a, b, c, and d)
that must add up to a total of m; and you are free to choose the first three numbers at random
but the fourth must be chosen so that it makes the total equal to m, the degrees of freedom is
three. Generally, degrees of freedom are less influential as sample size increases and the
distribution of the sample approaches normal. Specifically, literature suggests that when the
sample size of the test statistic is less than 30, the distribution of that test statistic cannot be
guaranteed to be normal (Galfo, 1985).
As previously noted, the technical and procedural aspects of the EFA and CFA are
similar. However, with the EFA researchers decide on the number of factors by examining
26
output from a principal components analysis. With the CFA, researchers must specify the
number of factors a priori, the principle difference between the EFA and the CFA (Kim &
Mueller, 1987b). That is, the CFA requires that a particular factor structure be specified in
advance and the researcher indicates which items load on which factor while the EFA allows all
items to load on all factors. Another difference between the two procedures is that the CFA
provides goodness-of-fit indices of the hypothesized factor structure to the observed data and
researchers typically use maximum likelihood to estimate factor loadings, whereas with the EFA
Maximum Likelihood (ML) is only one of a variety of estimators used (Lawley & Maxwell,
1971). Finally, the CFA allows the researchers to specify correlated measurement errors,
constrain loadings or factor correlations to be equal to one another, perform statistical
comparisons of alternative models, test second-order factor models, and statistically compare
the factor structure of two or more groups.
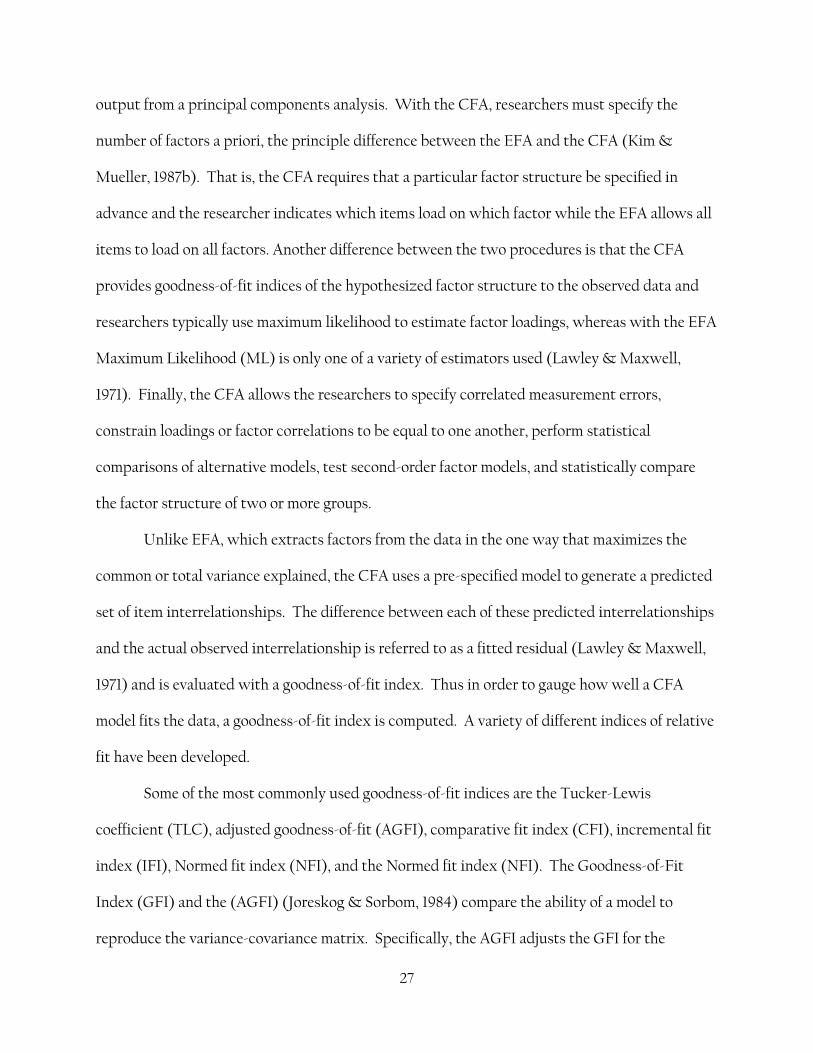
Unlike EFA, which extracts factors from the data in the one way that maximizes the
common or total variance explained, the CFA uses a pre-specified model to generate a predicted
set of item interrelationships. The difference between each of these predicted interrelationships
and the actual observed interrelationship is referred to as a fitted residual (Lawley & Maxwell,
1971) and is evaluated with a goodness-of-fit index. Thus in order to gauge how well a CFA
model fits the data, a goodness-of-fit index is computed. A variety of different indices of relative
fit have been developed.
Some of the most commonly used goodness-of-fit indices are the Tucker-Lewis
coefficient (TLC), adjusted goodness-of-fit (AGFI), comparative fit index (CFI), incremental fit
index (IFI), Normed fit index (NFI), and the Normed fit index (NFI). The Goodness-of-Fit
Index (GFI) and the (AGFI) (Joreskog & Sorbom, 1984) compare the ability of a model to
reproduce the variance-covariance matrix. Specifically, the AGFI adjusts the GFI for the
27

number of degrees of freedom expended in estimating model parameters. Bentler and Bonnett
(1980) proposed a Normed Fit Index (NFI), which compares model fit to that of a model for the
same data presuming independence of the measured or observed variables. Despite its wide use,
the NFI has been shown to underestimate when the sample size is small. As a result, Bentler
and Bonnett (1990) proposed the Comparative Fit Index (CFI), which takes sample size into
account. Some researchers have suggested that the CFI should be the fit statistic of choice
(Byrne, 1998). Another measure of goodness-of-fit is the Root Mean Square Residual (RMSR)
that measures the average size of the residuals generated by the particular model and is used to
compare the fit of two or more different models from the same data (Lawley & Maxwell, 1971).
RMSR represents the absolute value of the average fitted residuals for a given specified model.
As noted previously, fitted residuals are the difference between the actual correlations, or
covariances, among the observed indicators and the correlations predicted by a particular model
(Lawley & Maxwell, 1971). Steiger and Lind (1980) focused on estimated population fit in their
proposed root mean square error of approximation (RMSEA). The root mean-square residual
(RMR) evaluates the average residual value for the variance-covariance matrix.
The various fit indices outlined above provide a collection of information about
competing model being considered in SEM analyses. As some fit indices evaluate different
aspects of fit, it is important to evaluate model fitness on multiple fit statistics as to ensure that
judgments will not be an artifact of analytic choice (Byrne, 1998). Further, as Byrne (1998)
emphasized, the assessment of model fit must be based on multiple criteria that take into
account theoretical, statistical, and practical consideration. Overall, despite variations in the
specific mathematical formulas, most of these comparative fit indices except the RMSR,
RMSEA, and the RMR, basically reflect how well the given factor model fits the data and share a
common feature of ranging between zero and one, with higher values indicating better fit.
28

29
Regarding RMSR, RMSEA, and the RMR, the closer these values are to zero, the better the fit of
the model.
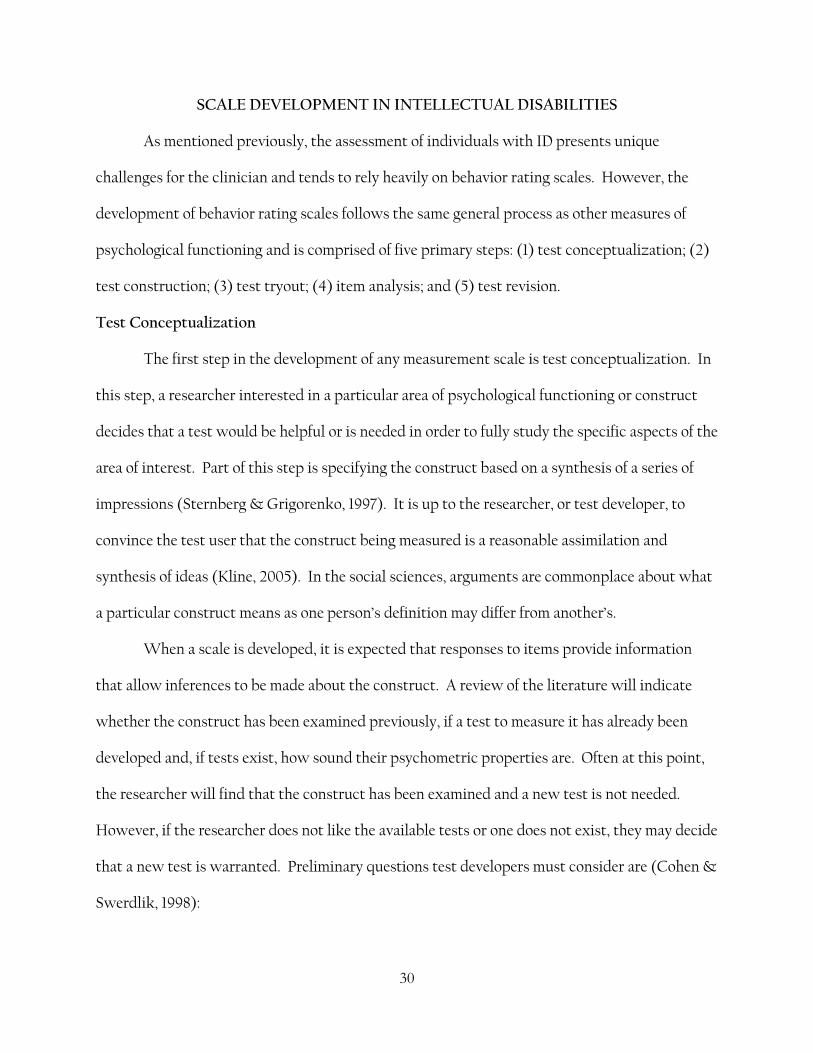
SCALE DEVELOPMENT IN INTELLECTUAL DISABILITIES
As mentioned previously, the assessment of individuals with ID presents unique
challenges for the clinician and tends to rely heavily on behavior rating scales. However, the
development of behavior rating scales follows the same general process as other measures of
psychological functioning and is comprised of five primary steps: (1) test conceptualization; (2)
test construction; (3) test tryout; (4) item analysis; and (5) test revision.
Test Conceptualization
The first step in the development of any measurement scale is test conceptualization. In
this step, a researcher interested in a particular area of psychological functioning or construct
decides that a test would be helpful or is needed in order to fully study the specific aspects of the
area of interest. Part of this step is specifying the construct based on a synthesis of a series of
impressions (Sternberg & Grigorenko, 1997). It is up to the researcher, or test developer, to
convince the test user that the construct being measured is a reasonable assimilation and
synthesis of ideas (Kline, 2005). In the social sciences, arguments are commonplace about what
a particular construct means as one person’s definition may differ from another’s.
When a scale is developed, it is expected that responses to items provide information
that allow inferences to be made about the construct. A review of the literature will indicate
whether the construct has been examined previously, if a test to measure it has already been
developed and, if tests exist, how sound their psychometric properties are. Often at this point,
the researcher will find that the construct has been examined and a new test is not needed.
However, if the researcher does not like the available tests or one does not exist, they may decide
that a new test is warranted. Preliminary questions test developers must consider are (Cohen &
Swerdlik, 1998):
30

31
1. What is the test designed to measure? 2. What is the objective of the test? 3. Is there a need for the test? 4. Who will use the test? 5. Who will take the test? 6. What content will the test cover? 7. How will the test be administered? 8. What is the ideal format of the test? 9. Should more than one form of the test be developed? 10. What special training will be required for administering or interpreting the test? 11. What types of responses will be required by test takers? 12. Who benefits as the result of an administration of this test? 13. Is there any potential harm as the result of an administration of the test? 14. How will meaning be attributed to scores on the test?
Test Construction
When a researcher decides that the construct of interest has not been adequately
measured or examined, the second step in the process is test construction. This step begins
with scaling, or the process of setting rules for assigning numbers in measurement. During
scaling, the researcher must decide what scale values will be assigned to different amounts of the
trait, attribute, or characteristic being measured. Historically, L. L. Thurston is credited for
being at the forefront of the efforts to develop methodologically sound scaling methods during
his work to adapt psychophysical scaling methods to the study of psychological variables such
as attitudes and values (Bock & Jones, 1968; Thurston, 1959).
Test developers talk about different types of scales as a function of various
characteristics. For example, scales can be categorized along a continuum of level of
measurements. Scales can also be categorized in other ways such as the performance on a test as
a function of age (i.e., age scale), or performance as a function of grade (i.e., grade scale).
Further, a scale may be described in other ways such as one-dimensional versus multi-
dimensional, or comparative versus categorical. Test developers must design a measurement
method in a manner they believe is best suited to the way they have conceptualized the
construct and how it should be measured.

Essentially, a test taker is assumed to have more or less of a specific trait as a function of
their test scores, that is, the higher or lower the score the more or less of the characteristic the
individual possesses. There are several methods for determining the numbers assigned to
different responses. However, researchers most often use rating scales to evaluate behavior in
the field of ID. One of the most frequently used rating scales is the Scale developed by Rensis
Likert in 1932 (Allen, 1957). The Likert-type scale consists of a series of declarative statements
of which the subject is asked whether they agree or disagree with each statement and how
strongly. This type of scale has been used by researchers for over 50 years and is explained by
Likert (1932) in his article, “A Technique for the Measurement of Attitudes,” in which he
reported very satisfactory reliability data and that results from his scales compared favorably
with those obtained by the Thurston Scale.
Once the scale of the test has been determined, the researcher must next develop the test
item pool. The first step in item development regarding behavior rating scales for use with
individuals with ID is to identify behaviors that are of particular concern to clinicians, parents,
teachers, and caregivers. Typically, this can be done by using a survey of health practitioners, a
review of literature on specific behavioral functions and their behavioral correlates or associated
behaviors, behavior descriptions, and relevant association guidelines (i.e. American Association
on Mental Retardation, American Psychological Association). This form of item generation will
usually yield about twice as many items that will appear in the final version of the scale, but all
are necessary in order to develop a test that is both reliable and valid.
Test Tryout
After the researcher has developed the initial item pool, the items must be tested. The
testing should be conducted on individuals similar in critical respects to the individuals for
whom the test is being developed. An important consideration in test tryout is how many
32

33
individuals should be used in the initial tryout. Although there are no specific rules, some
researchers have recommended that there be no fewer that five individuals per test item while
some have suggested that ten individuals per item is preferable (Cohen & Swerdlik, 1998).
Generally, the more individuals involved in the tryout the better because it lessens the role of
chance in subsequent statistical and factor analyses (Floyd & Widaman, 1995).
In addition to trying out the test on individuals as similar as possible to the target
individuals, the test should be tried out in conditions as similar as possible for to those for
which it was designed. Thus, if a test is designed to be given by clinicians to care takers of
individuals who reside in an inpatient facility, this is where the test should be tried out. Trying
out the test under similar conditions allows the researcher to better evaluate items, examiners
and examinee’ reactions during the testing session, how well the test instructions match the
situation, and how well the items are written to the particular conditions under which the test
is to be used (Crocker & Algina, 1986).
Item Analysis
The fourth step in test development after test tryout is item analysis. The process of item
analysis is an important step because the goal of test construction is to develop a test of
minimum length that yields scores with the necessary reliability and validity for its intended
use. Although there are many statistical procedures that can be used to conduct an item
analysis, many of these procedures are not relevant to the development of a behavior rating scale.
The primary method used to develop behavior rating scales is the factor analysis.
The term factor analysis is used to describe a class of mathematical procedures designed
to identify specific variables, or factors, that are typically attributes, characteristics, or
dimensions on which people may differ. A factor analysis can be used to get both convergent
and discriminatory evidence of construct validity (Cohen & Swerdlik, 1998) and is conducted
34
either on an exploratory or confirmatory basis. According to Floyd and Widaman (1995), an
EFA typically entails “estimating, or extracting factors; deciding how many factors to retain; and
rotating factors to an interpretable orientation” while in a CFA, “a factor structure is explicitly
hypothesized and is tested for its fit with the observed covariance structure of the measured
variables.”
The factor analysis procedure is designed to determine what the common factors are that
account for item variance. Essentially, the factor analysis is a measurement estimate of the
correlation between items and the factors, these correlations are called factor loadings. When
conducting a factor analysis, the researcher looks for those test items that correlate highly with
the factor of interest. Typically, when examining the results of a factor analysis, the researcher
looks for items with a factor loading of .80 or higher. As factor analysis procedures are highly
complex and mathematically challenging, the procedure is a common component of standard
computer-based statistical software packages, such as SPSS.
For example, if an item related to the factor of aggression has a loading of .0, the item is
not correlated in any way with aggression and the item would not be retained for the next
version of the test. However, if the item has a loading of .9, then the item is highly correlated
with aggression and would be retained as a test item. Once the researcher has identified those
test items that load highly onto the factor, that is those items that account for the most variance,
a CFA is conducted to examine how well the final test structure measures and represents the
construct of interest. Results of the CFA indicate to the researcher if the test has enough items
to adequately represent the factor and if the item scores yield the necessary information to be
considered a reliable and valid measure of the construct being measured.
Test Revision
Typically during item analysis vast amounts of data are generated about the test items
and the proposed test itself. However, as the primary method of item analysis for the

development of behavior rating scales is the factor analysis, much of the data that can be
generated will not be. In the case of behavior rating scales, test revision generally entails
determining if the items chosen for inclusion adequately represent the construct of interest.
Other issues regarding the chosen items are their readability (i.e., ease of reading and
understanding for the test administrator); adequate factor loadings; specificity of instructions
for administrators, raters, and for interpretation; and overall test utility. During this phase,
researchers may want to re-examine their item pool and substitute items that may be more
representative or rewrite items that may be difficult to understand. After revision, the
researcher must return to step three and tryout the proposed test again. After tryout, another
item analysis is conducted and data analyzed.
After the test has been revised and tried out for the second time, or more, the researcher
may decide that the test is in its final form. At this point, the researcher can develop the test
norms from the data and the test will be said to have been standardized on the second sample
(Cohen & Swerdlik, 1998). Standardization can be seen as the “process employed to introduce
objectivity and uniformity into test administration, scoring, and interpretation” (Robertson,
1990). Essentially, the standardization sample represents the performance of the group of
individuals against whom the examinees’ performance will be compared. It is important that
the standardized sample group is representative of the population on those variables that may
affect test performance. Once the test items have been finalized and the test has been
standardized, it is ready for the final step of cross-validation, the revalidation of a test on a
different sample of test takers.
35

QUESTIONS ABOUT BEHAVIORAL FUNCTION (QABF)
One of the few empirically derived and psychometrically sound behavior rating scales
used in the brief functional assessment of behavior is the QABF, a 25-item questionnaire
designed to rate specific behavioral functions and maintaining variables on a Likert-type scale of
0, never occurs, to 3, occurs often (Vollmer & Matson, 1995).
Scope and Development
The QABF was developed in 1995 in response to the limitations inherent in the
functional analysis procedure (Vollmer & Matson, 1995). Questions in the QABF are designed
to address and identify common behavioral functions of individuals with ID found in the
research literature and clinical practice. Although the QABF is similar in structure to the
Motivation Assessment Scale (MAS; Durand & Crimmins, 1988), it addresses a higher number
of behavioral functions and is comprised of five subscales: (1) attention; (2) escape; (3) non-
social; (4) physical; and (5) tangible. Each behavioral function has five corresponding items on
the scale that are rated by informants with respect to how often a behavior occurs in a particular
context.
The development of the QABF followed the common test development procedures
described previously. First, the researchers identified their construct of interest, specifically
behavioral function. Second, a comprehensive literature review regarding behavioral function
and expressions of communicative behavior was conducted to identify potential test items.
Third, the items were piloted on a representative sample of individuals the test was being
designed for. Fourth, the results of the test tryout, the item analysis, were examined using a
factor analytic procedure. The factor analysis revealed and determined the five factors, or
subscales, presently found in the QABF. Further analyses narrowed the item pool and the
revised scale was tried out. The second administration yielded the finalized QABF-SF.
36

37
Psychometric Properties and Utility
In 1996, Matson et al. presented the initial psychometric data for the QABF at the 22nd
Annual Convention of the Association for Behavior Analysis. The initial sample pool was
comprised of 462 individuals living in a residential state training center for individuals with ID.
Participants ranged in age from 13 to 86 years and predominantly functioned within the severe
to profound range of ID. Behaviors examined during the initial tryout and evaluation of the
QABF included typical behaviors exhibited by individuals with ID such as self injury,
aggression, and property destruction. Both internal reliability and validity data were assessed.
The initial psychometric analysis yielded coefficient alpha and Guttman split-half reliability
coefficients of 0.86 and 0.91, respectively. Further, an exploratory analysis with varimax
rotation yielded the five factors seen in the final version with these factors accounting for 74.5%
of the variance. The results of this study showed that the QABF could be a potentially useful
tool in the brief functional assessment of challenging behavior in individuals with ID.
Although the initial psychometric data on the QABF was promising, further evaluation
was needed. In 1999, Matson, Bamburg, Cherry and Paclawskyj conducted a validity study on
the QABF examining the utility of the scale to predict treatment success for self injury,
aggression, and stereotypies. The published study was comprised of two smaller studies with
the first designed to establish the percentage of individuals whose maladaptive behavior could
be ascribed to a clear behavioral function. In Experiment 1,398 individuals with moderate to
profound ID from a developmental center for individuals with ID in Louisiana were
administered the QABF.
For analysis purposes, participants were separated into three groups depending on their
identified or target maladaptive behavior: (1) self injury (N = 118); (2) aggression (N = 83); and(3)
stereotypies (N = 197). In the self-injury group (Group 1), 78.3% were Caucasian, 21.7% were

38
African American, while 53.6% were male and 46.4% female; 6.6% of these individuals
functioned within the severe range of ID while 93.4% were within the profound range. Group 2,
the aggression group, was comprised of 66.7% Caucasians and 33.3% African Americans; 56.8%
were male while 43.2% were female. 3.9% of individuals in group 2 functioned within the severe
range of ID while 96.1% functioned within the profound range. Lastly, Group 3 was comprised
of 67.1% Caucasians and 32.9% African Americans with 72.7% being male and 27.3% female. Of
this group, 4.5% were within the severe range while the remaining 95.5% within the profound
range. Results of Experiment 1 indicated that the QABF could clearly identify behavioral
functions, defined as subscales with a minimum score of 4 of 5 possible endorsements on a
subscale with no other subscales containing significant endorsements, for 84% of the total
sample (Matson et al., 1999). Specifically, the QABF was able to identify behavioral functions in
83% of individuals in Group 1, 74% in Group 2, and 93.3% in Group 3.
Experiment 2 in the Matson et al. (1999) study was designed to assess the utility of the
QABF predictions of behavioral function for selecting effective treatments. In this study, 180 of
the participants from Experiment 1 were selected at random and divided into a 30-member
treatment group and a 30-member control group for each of the three behaviors examined in
Experiment 1. Individuals in the treatment group had behavioral treatment plans driven by the
QABF analysis and those in the control group had standard treatment protocols consisting
primarily of interrupting, blocking, and redirection. Results of this study indicated that the
behavior plans derived from the QABF significantly reduced the frequency of maladaptive
behavior in the treatment group versus the control groups. Specifically, individuals in the self
injury group experienced a 66% decline in the frequency of self injury in the treatment group
versus 21% in the control group, a 59% decrease in aggression was observed in the second
treatment group versus 19% in the aggression control group, and a 54% decrease in stereotypies
was seen in the treatment group versus a 15% decrease in the control group.
Also in 1999, Applegate, Matson, and Cherry used the QABF to evaluate the functional
variables that affect severe problem behaviors in adults with ID. This study included 417
individuals with severe to profound ID who resided at a developmental training center in
Louisiana who exhibited self-injury, stereotypy, aggression, pica, or rumination at least once
every two weeks. Participants were separated into groups corresponding to their maladaptive
behavior for the purposes of data collection and analysis. Results of this study showed that high
frequency behaviors such as self injury, stereotypy, pica, and rumination seem to serve a
predominantly non-social function whereas low frequency behaviors such as aggression are
maintained by more externally maintained factors. These results further support the utility of
the QABF for assessing behavioral function and allows for the identification of a number of
behavioral antecedents within the five subscales.
In 2000, Paclawskyj, Matson, Rush, Smalls, and Vollmer conducted a two-part
experiment to further examine the psychometric properties of the QABF. Specifically, this
study was designed to look at the test-retest, inter-rater, and internal consistency of the QABF.
In Experiment 1, the authors included 34 individuals with severe and profound ID to examine
the test-retest properties of the scale. Further, an additional 27 individuals were included to
assess inter-rater reliability. Target behaviors of interest in this portion of the experiment were
self injury, aggression, property destruction, tantrums/verbal aggression, stereotypy, pica,
stealing, and elopement. To assess the stability of the individual QABF items over time, the
authors conducted three measures of reliability: Spearman rank-order correlation coefficients;
total agreement between items upon separate administration percentages; and Cohen’s Kappa,
where appropriate. Results showed that the Spearman rank-ordered correlations were high and
ranged from .646 to 1.0 with 76% of items exceeding the minimal acceptable of 0.80. Total
percent agreement was found to be high with 96% of the items exceeding the minimum 80% and
39

ranged from 69.57% to 95.95%. Finally, Cohen’s Kappa reliability coefficients ranged from .642
to 1.0 with 83% exceeding the minimum value of 0.70.
To assess the stability over time for the QABF as a whole, the Pearson product-moment
correlation coefficient was computed and found to be highly reliable (range = 0.795-0.990, p <
.01). Inter-rater reliability of the QABF was determined by using the same statistics as for the
test-retest analysis. Results of the Spearman rank-order correlation ranged from -0.095 to 1.0,
with 52% of items exceeding the minimum of 0.80; thus, slightly lower than the teat-retest
results. Total agreement was also slightly lower, ranging from 69.57% to 95.65%, with 56% of
items exceeding 80% agreement. Cohen’s Kappa values were also found to be slightly lower and
ranged from 0.427-0.921, with 41% of items exceeding a minimum of 0.70. Finally, the Pearson
product-moment correlations were found to be acceptable for each subscale and the total score
(range = 0.79-0.987, p < .01).
Experiment 2 in this study included 243 additional participants to examine the internal
reliability of the QABF and conduct a second EFA. Again, individuals in this sample functioned
within the severe to profound range of ID. Target behaviors examined in this phase of the study
included self injury, aggression, property destruction, tantrums/verbal aggression, stereotypy,
pica, stealing, elopement, and rectal digging. To assess the internal consistency of the QABF, the
authors calculated coefficient alpha for the individual subscales and the scale as a whole. Also,
the Spearman-Brown statistic was calculated to assess the degree of consistency between halves
of the test. Results of the coefficient alpha was very high for each subscale (range = 0.900-0.928),
but lower for the scale as a whole (0.601). The calculated Spearman-Brown statistic was found
to be 0.600. However, this low correlation was expected as the QABF was not designed to
measure a homologous construct over the entire scale, but rather to measure a heterogeneous
grouping of five functions of behavior. Results of the second EFA yielded five factors that
40

41
corresponded to the subscales on the QABF and replicated the results of Matson et al. (1996).
Therefore, the results of the two experiments in this study provided further support for the use
of the QABF to identify possible behavioral functions in individuals with ID and the five
subscale structure of the scale.
In an extension study of the QABF, Matson et al. (2001) examined the use of the QABF
to identify the behavioral function of feeding problems in individuals with predominately
profound ID. In this study, participants were 125 individuals at a residential developmental
training center in Louisiana who displayed feeding problems such as food stealing, pica,
rumination, food refusal, and other mealtime problem behaviors such as self injury and
aggression. Participants were screened using the Screening Tool of fEeding Problems (STEP;
Matson & Kuhn, 2001), a 25-item informant based measure that consists of 23 items and five
subscales used for the identification of feeding problems among individuals with ID. Results of
this study provide evidence that behavioral function varies across feeding problems and
indicates that the QABF may also be useful in differentiating the function of feeding problems.
Although this was a preliminary investigation and further research is needed to establish the
diagnostic and treatment utility of the QABF to assess feeding problems, these results
demonstrate that the QABF may be a useful tool in the analysis of other classes of behavior
problems.
Other authors have also investigated the psychometric properties of the QABF in
settings outside of the United States. Nicholson, Konstantinidi, and Furniss (2006) replicated
and extended the findings of Matson and colleagues with regard to the psychometric properties
of the QABF in a sample of 40 individuals in the north of England. Individuals in this study
were 28 males and 12 females aged between 10 and 26 years residing in four residential schools
for individuals with autism and/or severe learning disabilities and challenging behavior, In this

42
study, the QABF was completed on 118 challenging behavior displayed by the individuals, the
behaviors included aggression, property destruction, and self injury. Results of this study found
that the levels of inter-rater reliability for both individual items and the scale as a whole were
high, that inter-rater reliability of subscale scores was higher than those reported for other
comparable rating scales. The authors also found that the internal consistency was high for all
subscales of the QABF and for the scale as a whole. Finally, the results of the factor analysis
yielded five factors that corresponded clearly with those on the QABF.
Recently, Singh et al. (2006) adapted the QABF for use with individuals with serious
mental illness who engage in maladaptive behavior, and assessed the psychometric
characteristics of the new scale (Questions About Behavioral Function in Mental Illness; QABF-
MI). In this study, the authors evaluated a sample of 135 adults with serious mental illness from
three inpatient psychiatric hospitals. Results of factor analyses provided a conceptually
meaningful five-factor solution: physical discomfort; social attention; tangible reinforcement;
escape; and non-social reinforcement. Congruence between the five factors derived with the
QABF-MI and the corresponding factors in the original QABF was perfect. The authors also
assessed the reliability of the QABF-MI. The inter-rater reliability ranged from .96 to .98 and
Pearson r test-retest reliability ranged from .86 to .99. Further, Coefficient alpha ranged from
.84 and .92, thus indicating substantial internal consistency of each of the five factors. The
results of this study indicate that the QABF-MI has robust psychometric properties and may be
useful as a screening tool for determining the nature of the variables that maintain maladaptive
behavior exhibited by individuals with serious mental illness. Although further examination is
needed, these results provide further support for the use of the QABF to evaluate the behavioral
function of individuals and extend its use to the area of mental illness.
Based on a review of the literature, the psychometric properties of the QABF have been
well established and replicated several times across different settings with similar results. It

appears that the QABF is a highly reliable and valid instrument for the assessment and
identification of behavioral function in individuals with a range of ID and a variety of
challenging behaviors. There appears to be no other scale in the literature that assesses
behavioral function that is as psychometrically sound, valid, reliable, or clinically useful.
43

PURPOSE
Given the lack of time and resources faced by most professionals in clinical settings
discussed previously, it is imperative that assessment measures be as brief as possible. Briefer
assessments are also desirable when a measure forms only one part of a battery of assessments,
and the overall time demands on the clinician can easily become burdensome. However, briefer
measures must be as, if not more, valid and reliable than the original and provide the clinician
with the necessary information and data to aide in assessment and treatment selection.
Obviously, this is a difficult balance to reach. Researchers have clearly demonstrated the utility
of brief functional assessment measures to achieve these tasks primarily using the QABF. Thus,
the purpose of this study was to attempt to develop a short form of the QABF with high validity
and reliability while maintaining the intent of the measure to accurately and reliably identify the
function of problematic behavior.
44

45
METHOD
Participants
Data for this study was obtained from 589 individuals with varying degrees of ID and
maladaptive behavior problems who reside at Pinecrest Developmental Center (PDC), a
residential training center for individuals with ID in Louisiana. Specifically, data consisted of
demographic information and raw QABF scores obtained during routine annual clinical
assessments. Individuals in this sample were between the ages of 19 and 85 (M = 47.31, SD =
13.54), of whom 319 (54.2%) were male and 270 (45.8%) female. There were 466 (79.1%)
Caucasians, 121 (20.5%) African Americans, and 2 (0.3%) Hispanics. Six (1.0%) individuals
were diagnosed with mild mental retardation, 16 (2.7%) moderate, 67 (11.4%) severe, and 500
(84.9%) diagnosed with profound mental retardation. QABF data from these individuals were
randomly divided using SPSS to obtain two samples on which to conduct exploratory and
confirmatory factor analyses.
QABF Exploratory Factor Analysis
After randomly selecting approximately 50% of the total sample, QABF data from 304
individuals were used to conduct an EFA utilizing the PAF method of extraction. This sample
size was sufficient to meet and exceed the subject-to-item ratio of five to one typically viewed as
necessary for deriving a suitable factor solution (Arrindell & van der Ende, 1985; Kass & Tinsley,
1979). The subject-to-item ratio for this EFA was just over twelve to one. The EFA explored the
structure of the components and item loadings of the original QABF. This sample consisted of
168 (55.3%) males and 136 (44.7%) females of which 241 (79.3%) were Caucasian, 61 (20.1%)
African American and 2 (0.7%) Hispanic. These individuals ranged in age from 20 to 85 (M =
47.51, SD = 14.33). Four (1.3%) individuals were diagnosed with mild mental retardation, 11 (3.6)
moderate, 29 (9.5%) severe, and 260 (85.5%) profound.

Item Selection
The goals of the item selection procedure were to reduce the length of the QABF while,
(a) preserving the content of all five factors measured by the QABF, (b) retaining a minimum of
three items per scale, (c) maintaining significant reliability estimates, (d) providing a factor
structure in which goodness-of-fit indices met acceptable standards, and (e) retaining the
original context of each of the five QABF factors. In order to meet these goals in the selection of
items, the following guidelines were used:
1. Items that best measure the intended construct as inferred by the size of its factor
loading on the EFA and its respective corrected item-total correlation.
2. Items that have minimal cross-loadings.
3. Items that have minimal correlated uniqueness, particularly with regard to other items in
the same subscale. In cases where two items within the same subscale had significant
correlated uniqueness, only one of the two items was retained.
4. Items that met a subjective evaluation of content and clinical relevance. For example,
small drops in scale reliability were sometimes sacrificed if a different item set provided
greater practical use or predictive power. The items were scrutinized by a group of 10
behavior analysts with experience in working with this population. Cronbach’s alpha
was calculated for each item and agreement regarding inclusion or exclusion and was
generally high with item coefficient alpha values ranging between .9763 and .7855.
5. Sufficient items in each subscale to maintain a sufficient coefficient alpha estimate of
reliability.
Data gathered during the item selection process allowed for an a priori calculation of the
validity and reliability of the proposed short form. Initial analyses showed that the QABF-SF
46

was expected to maintain the five factor structure and high reliability of the original measure.
Mean internal consistency reliability estimates were calculated across the 5-item subscales of
the original QABF, as was a Cronbach’s alpha estimate for each of the 3-item subscales and the
QABF-SF as a whole.
QABF Confirmatory Factor Analysis
QABF data from the remaining 285 individuals were used to conduct a CFA using EQS
6.1 to determine whether the factor structure required modification. The subject-to-item ratio
used to conduct the CFA was above the five to one ratio suggested; the subject to item ratio in
this analysis was just over eleven to one. The CFA was conducted to confirm the factor
structure indentified by the EFA and, if possible, refine the model using a separate sample of
participants. This sample was comprised of 151 (53.0%) males and 134 (47.0%) females who
were 78.9% (225) Caucasian and 21.1% (60) African American. Of these individuals, 2 (0.7%)
were diagnosed with mild mental retardation, 5 (1.8%) moderate, 38 (13.3%) severe and 240
(84.2%) profound. These individuals ranged in age from 19 to 82 (M = 47.10, SD = 12.65).
In order to identify items to be considered for exclusion, the LaGrange multiplier was
used. The LeGrange multiplier is a mathematical modification index within EQS 6.1 used to
identify variables that worsen model fit. After items were identified for removal, another CFA
was conducted and the goodness-of-fit indices examined. The following goodness-of-fit indices
were used to assess the degree of fit between the proposed model and the sample data: χ2,
Bentler-Bonett Normed Fit Index (NFI), Comparative Fit Index (CFI), Standardized Root
Mean-Square Residual (RMR), and Room Mean-Square Error of Approximation (RMSEA).
Short Form Development and Analyses
After items were selected according to the guidelines outlined previously, 75 individuals
were chosen for test tryout; these individuals were randomly selected from the 175 individuals
47

48
who currently receive an annual QABF at PDC and who were not included in the original 589
participants used to analyze the QABF and develop the short form. These 75 individuals ranged
in age from 19 to 77 (M = 46.33, SD = 12.47). Thirty-seven (49.3%) were male and 38 (50.7%)
female while 60 (80%) were Caucasian and 15 (20%) African American. Two (2.7%) of these
individuals were diagnosed with moderate mental retardation, 9 (12%) severe, and 64 (85.3%)
profound.
Following the above discussed item selection guidelines, ten items were identified for
elimination. Following test construction procedures, the shortened version of the QABF was
administered to the group of 75 randomly chosen individuals described previously. The number
of participants selected for participation in the QABF tryout is in accordance with the suggested
subject-to-item ratio of five to one (Arrindell & van der Ende, 1985; Kass & Tinsley, 1979). Data
from the tryout administration were examined using the multivariate statistical software EQS
6.1 in order to examine the goodness-of-fit properties of the data as they relate to the proposed
five factor model and obtain validity and reliability estimates of the short form version of the
QABF.

RESULTS
QABF Exploratory Factor Analysis
In order to examine the constructs that the QABF is purported to measure and explore
item-fit within these constructs an EFA using SPSS 11.5 was undertaken on data from 304
individuals randomly selected from the 589 participants in this study. A principle component
procedure utilizing varimax rotation was used to analyze the original 25-items on the QABF.
This analysis extracted five factors with eigenvalues greater than 1.0 that accounted for 73.9% of
the total item variance. Eigenvalues for each of the components were 6.717, 3.705, 3.277, 2.498,
and 2.272, respectively. Table 1 presents the rotated sums of squares loadings and percentage of
variance explained by each component.
Table 1. EFA Rotated Sums of Squares Loadings (N = 304).
Component % of Variance Explained Cumulative % of Variance
1 15.78 15.78
2 15.33 31.11
3 14.65 45.76
4 14.10 59.86
5 14.02 73.88
A summary of the rotated principle components and item loadings appears in Table 2.
These results are highly consistent with other exploratory investigations of the psychometric
properties of the QABF (Matson et al., 1996; Paclawskyj et al., 2000; Nicholson, 2006; Singh et
al., 2006).
49

Table 2. EFA Principle Components and Item Loadings of the 25-item QABF (N = 304).
Item Component
1 2 3 4 5
24 .895 .045 .074 -.046 .010
14 .892 .087 .027 -.010 .024
19 .890 .089 .032 .003 -.025
4 .888 .051 .103 -.074 .037
9 .816 .013 .033 -.056 .087
22 .088 .867 .009 -.183 .026
17 .135 .859 -.028 -.175 .012
7 .044 .852 .050 -.098 .120
12 .051 .849 .119 -.165 .145
2 -.015 .800 .091 -.049 .193
21 .118 -.002 .892 -.094 .128
11 .096 .093 .882 -.131 .090
16 .072 .047 .868 -.010 .102
1 .095 .074 .834 -.196 .162
6 -.070 .030 .705 .056 .046
23 -.083 -.199 -.110 .859 -.127
3 -.029 -.209 -.035 .817 -.157
8 .053 -.163 -.132 .793 -.162
18 -.025 -.014 -.080 .788 -.070
(table continued)
50

13 -.100 -.098 .022 .767 -.131
15 .040 .076 .114 -.101 .871
25 .007 .074 .052 -.191 .867
5 .019 .093 .066 -.187 .832
20 .018 .014 .144 -.128 .775
10 .060 .280 .147 -.036 .682
To illustrate the similarities between extraction methods, specifically PCA and Principle
Axis Factoring, a second EFA was conducted using the Principal Axis Factor procedure. This
second analysis also extracted five factors with eigenvalues greater than 1.0. These factors
accounted for 67.7% of the total item variance and eigenvalues for each of the components were
6.407, 3.430, 2.986, 2.182, and 1.920, respectively. Table 3 presents the rotated sums of squares
loadings and percentage of variance explained by each component.
Table 3. EFA Rotated Sums of Squares Loadings (N = 304).
Component % of Variance Explained Cumulative % of Variance
1 14.71 14.71
2 14.13 28.84
3 13.52 42.35
4 12.69 55.04
5 12.66 67.70
Table 4 presents the rotated principle components using the Principal Axis Factor
method of extraction. These results are highly consistent with those using PCA extraction.
51

Table 4. EFA Principle Axis Factoring and Item Loadings of the 25-item QABF (N = 304).
Item Component
1 2 3 4 5
24 .873 .046 .073 -.048 .012
14 .867 .087 .028 -.012 .025
19 .866 .089 .033 .001 -.022
4 .866 .052 .102 -.074 .038
9 .753 .021 .039 -.059 .081
22 .088 .842 .011 -.186 .031
17 .133 .831 -.025 -.177 .019
12 .052 .822 .120 -.169 .147
7 .047 .811 .050 -.107 .124
2 -.007 .740 .090 -.065 .192
21 .115 .000 .887 -.093 .128
11 .095 .093 .870 -.129 .092
16 .072 .048 .828 -.013 .106
1 .094 .076 .828 -.194 .163
6 -.050 .028 .596 .034 .059
23 -.082 -.194 -.108 .860 -.126
3 -.031 -.205 -.037 .787 -.160
8 .045 -.164 -.128 .745 -.167
18 -.028 -.034 -.080 .703 -.086
(table continued)
52

13 -.096 -.110 .009 .687 -.140
25 .007 .077 .059 -.191 .849
15 .040 .081 .119 -.102 .849
5 .021 .098 .074 -.189 .793
20 .019 .031 .150 -.135 .696
10 .059 .264 .149 -.066 .602
To illustrate the significance of the rotational procedure after the extraction is
performed, an unrotated analysis was conducted. The results of the unrotated percentages of
explained variances are presented in Table 5.
Table 5. EFA Eigenvalues and Unrotated Sums of Squares Loadings (N = 304).
Component Eigenvalues % of Variance Explained Cumulative % of Variance
1 6.717 26.87 26.87
2 3.705 14.82 41.69
3 3.277 13.11 54.80
4 2.498 9.99 64.79
5 2.272 9.09 73.88
Item Selection
After following the item selection procedure outlined previously, 10 items were
identified for removal. The result was a 15-item version of the QABF. Items selected for
retention are presented in Table 6 while items not selected for retention appear in Table 7.
53

Table 6. Retained Items for the Short Form.
Short
Form Item
Number
QABF
Item
Number
Item
1 1 Engages in the behavior to get attention
2 3 Engages in the behavior as a form of ‘self-stimulation’
3 5 Engages in the behavior to get access to items such as preferred toys, food,
or beverages
4 8 Engages in the behavior even if he/she thinks no one is in the room
5 11 Engages in the behavior to draw attention to him/herself
6 12 Engages in the behavior when he/she does not want to do something
7 14 Engages in the behavior when there is something bothering him/her
physically
8 15 Engages in the behavior when you have something he/she wants
9 16 Engages in the behavior to try to get attention from you
10 17 Engages in the behavior to try to get people to leave him/her alone
11 19 Engages in the behavior because he/she is physically uncomfortable
12 22 Does he/she seem to be saying ‘leave me alone’ or ‘stop asking me to do this’
when engaging in the behavior?
13 23 Does he/she seem to enjoy the behavior, even if no one is around?
14 24 Does the behavior seem to indicate to you that he/she is not feeling well?
15 25 Does he/she seem to be saying ‘give me that (toy, food, item)’ when engaging
in the behavior?
54

55
Table 7. Items Not Retained for the Short Form.
QABF Item
Number Item
2 Engages in the behavior to escape work or learning situations
4 Engages in the behavior because he/she is in pain
6 Engages in the behavior because he/she likes to be reprimanded
7 Engages in the behavior when asked to do something (get dressed, brush teeth,
work, etc.)
9 Engages in the behavior more frequently when he/she is ill
10 Engages in the behavior when you take something away from him/her
13 Engages in the behavior because there is nothing else to do
18 Engages in the behavior in a highly repetitive manner, ignoring his/her
surroundings
20 Engages in the behavior when a peer has something he/she wants
21 Does he/she seem to be saying “come see me” or “look at me” when engaging in the
behavior?
As noted earlier, the item selection process allowed for an a priori calculation of the
validity and reliability of the proposed short form. Analyses showed that the QABF-SF was
expected to maintain the five factor structure and high reliability of the original measure. With
a mean internal consistency reliability estimate of α= 0.914 across the 5-item subscales of the
original QABF, a Cronbach’s alpha estimate predicted the 3-item subscales would show a mean
internal consistency of α = 0.905. Slight reductions in internal consistency are not necessarily

56
problematic when the measure is designed to assess a broad domain using few items. Boyle
(1991) recommends modest reliabilities of between α= 0.65 to 0.75 when the construct being
measured is broad. As the short form was composed of items that showed high factor loadings
and not items chosen at random, it was expected that internal consistency reliability estimates
of the subscales of the 15-item QABF-SF be similar to those of the original QABF.
QABF Confirmatory Factor Analysis
To further explore and cross validate the five factor structure of the QABF, a CFA was
undertaken on data from the 285 participants not selected for use in the EFA using EQS 6.1.
Then, the LaGrange multiplier was used to identify items for exclusion to improve goodness-of-
fit and another CFA was run. This procedure was conducted twice in an attempt to examine
possible modifications by removing items that worsen model fit and thus improve goodness-of-
fit indices. Fit indices for each of the models tested are presented in Table 7. The final model
shows an excellent fit between the model and the data, where χ2 (df = 90) = 200.547, NFI = .921,
CFI = .955, RMR = .167, and RMSEA = .066.
Table 8. Fit Indices for Each Model Tested for the CFA (N = 285).
Model Step χ2 df p NFI CFI RMR RMSEA
Initial model 576.447 275 .000 .879 .933 .150 .062
Items 6, 2, 13, 9, and 10 removed 360.219 170 .000 .906 .948 .153 .063
Items 21, 7, 18, 4, and 20 removed 200.547 90 .000 .921 .955 .167 .066
QABF-Short Form (QABF-SF) Tryout
Following test construction procedure, the 15-item QABF-SF was tested. The QABF-SF
was administered by trained researchers to frontline staff regarding the problem behaviors of 75

randomly selected individuals from the 175 individuals who are currently administered a QABF
on an annual basis. The number of participants in this step met the suggested subject-to-item
ratio of five to one (Arrindell & van der Ende, 1985; Kass & Tinsley, 1979).
QABF-SF Analysis
To examine the goodness-of-fit properties of the data as they relate to the proposed five
factor model and obtain validity, and reliability of the short form version of the QABF, a CFA
was conducted using EQS 6.1.
Goodness-of-Fit
Consistent with current practice, the Maximum-Likelihood (ML) estimation procedure
was used to determine goodness-of-fit properties of the 5-factor model of the QABF-SF using
data from all 75 participants of the tryout. Parameter characteristics and change indices of the
proposed short form were evaluated for model and criterion validity using EQS 6.1. Estimations
of model fit were high χ2(80) = 154.103, p < .01, Bentler-Bonett Normed Fit Index (NFI) = .824,
Comparative Fit Index (CFI) = .904, while estimates of error were fairly low, Standardized Root
Mean-Square Residual (RMR) = .091, and Root Mean-Square Error of Approximation (RMSEA)
= .112. Table 8 presents the model fit indices for the original, 15-item model and shortened forms
of the QABF.
Table 9. Fit Indices for the QABF and QABF-SF
Model χ2 df p NFI CFI RMR RMSEA
Original QABF 576.447 275 .000 .879 .933 .150 .062
15-Item Model 200.547 90 .000 .921 .955 .167 .066
QABF-SF 154.103 80 .000 .842 .904 .091 .112
57

Figure 1 presents the five factor solution and item loadings of the QABF-SF. These five
factors were labeled, as on the original QABF: Factor 1, Attention; Factor 2, Escape; Factor 3,
Non-Social; Factor 4, Physical; and Factor 5, Tangible. Each of the items in Factor 1 (Attention)
focused on attention seeking as the motivation for the target behavior. The three items in Factor
2 (Escape) all related to a desire to refrain from some activity. Factor 3 (Non-Social
Reinforcement) items were all related to a tendency to engage in a target behavior in the absence
of social reward, thus measuring a tendency to use a target behavior to seek stimulation and/or
avoid boredom. Factor 4 (Physical Discomfort) items focused on illness or physical discomfort
as the motivation for target behavior. Factor 5 (Tangible Reinforcement) items were all related
to seeking a tangible item such as food or drinks or toys.
Reliability
Internal Consistency
To assess the internal consistency of the QABF-SF, coefficient alpha for each subscale
and the test as a whole was computed using data from all 75 of the individuals who participated
in the QABF-SF tryout. The values of Cronbach’s alpha calculated for each subscale were
generally high. Subscale coefficient alpha values were .9243 for attention, .9103 for escape, .8351
for non-social, .9383 for physical, and .7907 for tangible. Alpha for the QABF-SF as a whole was
somewhat lower and calculated as .5888.
Test-Retest
The test-retest properties of the QABF-SF were examined in 29 randomly chosen
individuals from the pool of 75 who participated in the evaluation of the QABF-SF. Retest data
for these individuals was collected with the same respondent two weeks after the initial
administration of the QABF-SF. Pearson Product Moment Correlations for subscale scores were
.980 for attention, .977 for escape, .986 for non-social, .952 for physical, and .836 for tangible.
58

QABFSF - Q1
QABFSF - Q6
QABFSF - Q11
Attention*
0.89
0.45
0.94* 0.34
0.86*
0.52
QABFSF - Q2
QABFSF - Q7
QABFSF - Q12
Escape*
0.83
0.56
0.93* 0.36
0.88*
0.48
0.02*
QABFSF - Q3
QABFSF - Q8
QABFSF - Q13
Non-Social*
0.68
0.74
0.83* 0.56
0.89*
0.46
-0.09*
QABFSF - Q4
QABFSF - Q9
QABFSF - Q14
Physical*
0.94
0.34
0.93* 0.38
0.89*
0.46
0.13*
QABFSF - Q5
QABFSF - Q10
QABFSF - Q15
Tangible*
0.73
0.68
0.62* 0.78
0.91*
0.42
0.12*
-0.40*
0.09*
0.33*0.03*
-0.29*
-0.02*
E15*
E1*
E6*
E11*
E2*
E7*
E12*
E3*
E8*
E13*
E4*
E9*
E14*
E5*
E10*
Figure 1. QABF-SF Confirmatory Factor Analysis (N = 75).
59

All of these correlations were significant at the 0.01 level. Spearman Rank Order Correlations
between the sets of subscale scores provided by the same rater two weeks apart were calculated
for each subscale were .966 for attention, .949 for escape, .972 for non-social, .952 for physical,
and .836 for tangible. All of these correlation coefficients were significant at the 0.01 level.
Interrater
Interrater properties of the QABF-SF were calculated using the same correlation
coefficients used to examine test-retest reliability. Data from two respondents regarding the
function of maladaptive behavior in 38 individuals were analyzed. Subscale Pearson correlations
were .932 for attention, .933 for escape, .955 for non-social, .927 for physical, and .815 for
tangible. With respect to Spearman correlations, subscale scores were .792 for attention, .870
for escape, .909 for non-social, .840 for physical, and .815 for tangible. These correlation
coefficients were all significant at the 0.01 level.
Social Validity
An analysis of items designed to measure social validity showed that frontline staff liked
the format, seemed to think that the QABF-SF could provide the treatment team with good
information, and be useful as part of a brief functional assessment. Questions used to assess
social validity and response data are presented in Table 10.
Table 10. Social Validity Questions and Responses (N = 142).
Yes No
1. Do you like the format of the QABF-SF?
(length and time of administration)
128 14
(table continued)
60

61
2. Do you think that the QABF-SF provides the team with good
information?
119 23
3. Do you think that the QABF-SF could be useful as part of a brief
functional assessment?
125 17

DISCUSSION
Given increasing demands on clinicians to do more with fewer resources, a need for
efficient methods of assessment has emerged. This need is pervasive throughout the entire
healthcare industry and has significantly impacted the way that we take care of people. Within
the field of behavioral psychology in ID, the need is for brief functional behavior assessment
tools. Researchers and practitioners have acknowledged that the costs of conducting lengthy
functional analog assessments characterized by applied behavior analysis far outweigh any
potential benefits. As such, brief assessment methods have been developed for use by clinicians
in settings outside the research laboratory. The literature regarding the use of brief functional
behavior assessment shows that these assessments provide as much reliable and valid
information regarding the maintaining consequences of a behavior as long and sometimes
ethically questionable analog assessments.
The QABF (Vollmer & Matson, 1995) is a rating scale that is extensively used in the
behavior analytic literature as a method of developing hypotheses for the functions of
maladaptive behavior in individuals with intellectual disability. In several studies, it has proven
to have fairly robust psychometric properties, including reliability and validity. The present
study was designed to determine if a shorter form of this rating scale (i.e., QABF-SF) would have
similar psychometric properties as the original QABF.
The first part of this study examined the five constructs, or behavioral functions, that the
QABF is purported to measure and explored item-fit within these constructs. An EFA was
employed to examine the underlying factor structure of the QABF. Given the rather large
sample pool, it was feasible in this study to randomly select approximately 50% of the data for
this purpose. The EFA procedure is designed to find the one underlying factor model that bests
fits the data. To do this, the researcher must make several important decisions including
62

choosing the method of extraction, number of factors to retain, type of rotation, and sample size.
In this study, two different methods of extraction were used to illustrate the similarities
between methods. Theoretically, if the factor structure is strong, that is if several items are
highly correlated and seem to measure the same attribute, then the method of extraction will
not produce differing results. Conversely, if the factor structure is weak and the items of
interest seem to be measuring different attributes then the method of extraction will yield
different results. In this study, the factor structure held across extraction methods.
As discussed previously, the most common method of deciding how many factors to
retain is to examine the eigenvalues and keep those factors with an eigenvalue over 1.0.
Although statisticians argue that this method is not as accurate as others, it is the most widely
employed method for deciding how many factors to retain. The initial EFA conducted on the
QABF supported a five factor solution of the 25 items, with 5 items loading on each factor. The
next decision concerns the type of rotation method. The purpose of rotation is to
mathematically maximize high loadings while minimizing low loadings to yield the simplest
and, therefore, the most interpretable factor structure. In essence, the rotation procedure
simplifies the output of the analysis and facilities the interpretation of the factor loadings.
The most common type of rotation method employed by statistical packages is the
orthogonal method as conventional wisdom advises researchers to use this rotation method
because it produces more easily interpretable results (Costello & Osborne, 2005). In this study,
the result of the orthogonal rotation was compared to the unrotated result to highlight the
purpose and function of the rotation procedure. Results show that the percentage of variance in
the unrotated solution was more variable than in the rotated solution. Thus, although the
rotated solution explained the same overall percentage of variance in the data as the unrotated
solution, the rotated solution affected the percentage of variance explained by each factor given
63

that the goal of the rotation procedure is to mathematically clarify and simplify the factor
structure. Therefore, although each factor may not have been equally represented in the data, as
evident by the percentage of variance explained by each factor in the unrotated solution,
rotating the factor solution clarified the nature of the factor structure and the factor loadings.
The last decision the researcher has to make concerns sample size. The number of participants
in each stage of this study was sufficient to meet or exceed recommendations found in the
literature and was not a concern.
Data generated during the EFA of the QABF was used in the subsequent item selection
procedure. The goals of the item selection procedure were to preserve the content of all five
factors measured by the QABF, retain a minimum of three items per scale, maintain significant
reliability estimates, provide a factor structure in which goodness-of-fit indices met acceptable
standards, and retain the original context of each of the five QABF factors. After examining the
results of the EFA, ten items were selected for removal, with the remaining items forming the
QABF-SF.
In order to examine the item fit of the 25-item QABF, cross validate its five factor
structure, and determine if any model modifications were necessary, a CFA was undertaken
with the remaining data not used in the EFA. Although the EFA and CFA are both used to
investigate the theoretical constructs that might be represented by the data, the CFA is used to
evaluate how well the data fits into a predetermined factor model. Thus, while the EFA is used
to build a theory, the CFA is used to test a theory. To test model fitness, the CFA procedure
incorporates several goodness-of-fit indices that, although mathematically different, basically all
reflect how well the given factor model fits the data with higher values indicating better fit.
The results of the initial CFA indicated that the original five factor model of the QABF fit
well with the data as all fit indices were within acceptable limits. After utilizing the LaGrange
64

multiplier designed to mathematically identify items that may worsen model fit, five items, one
per factor, were selected for removal and another CFA was undertaken. The results of this
second CFA indicated that removing five items slightly improved model fitness across all
goodness-of-fit indices. Subsequently, the 20 remaining items were subject to the LaGrange
multiplier in an effort to further improve model fit. Results of the second LaGrange multiplier
procedure suggested five more items, one per factor, which could be eliminated in order to
improve model fitness. After these items were removed, the 15 remaining items were subjected
to a third CFA in order to examine model fitness. The results of this third CFA showed that
removal of the five suggested items also improved model fitness as goodness-of-fit indices were
all improved. Given that a factor becomes unstable with fewer than three items, no further
model fitness analyses were conducted.
The second part of this study examined the factor structure, goodness-of-fit, reliability,
and validity of the 15-item QABF-SF. To examine the model fit of the QABF-SF a CFA was
conducted on the data gathered during the QABF-SF tryout. The results of this CFA indicated
that the five factor structure and item loadings of the QABF-SF were consistent with those of
the original QABF. Goodness-of-fit indices of the original QABF were all within acceptable
limits and showed good model fit with the data. Results of the CFA on the original QABF after
ten items had been removed during the model modification process showed excellent model fit
with χ2(90) = 200.547, p < .01, Bentler-Bonett Normed Fit Index (NFI) = .921, Comparative Fit
Index (CFI) = .955, while estimates of error were fairly low with the Standardized Root Mean-
Square Residual (RMR) = .167, and Room Mean-Square Error of Approximation (RMSEA) =
.066. Results of the CFA conducted on the QABF-SF also showed good model fit, although some
of the indices were lower than expected. Specifically model fit indices were, χ2(80) = 154.103, p <
.01, the NFI = .824, CFI = .904, RMR = .091, and RMSEA = .112. Although these values were lower
65

than estimated during the model modification process, they were all still within acceptable
ranges and show that the model fit of the QABF-SF is highly comparable to the initial model of
the QABF.
Overall, results of the CFA on the QABF-SF showed that the short form retained the five
factor structure of the original measure and that these five factors accurately reflected the data
regarding the function of maladaptive behavior exhibited by individuals with ID. Hence,
attention, escape, non-social reinforcement, physical discomfort, and access to a tangible can be
interpreted as distinct functional aspects of an individual’s behavior. Thus, the QABF-SF retains
the intent of the QABF, to accurately identify the function of maladaptive behavior among
individuals with ID.
Data from the CFA were also used to examine the reliability and validity of the QABF-
SF. Results showed that, although the internal consistency reliability of the QABF-SF was not
as high as estimated a priori, with a mean α = 0.8575 across the five subscales of the 15-item short
form, sufficient reliability was retained for the QABF-SF to be considered useful in clinical and
research settings. It should be noted that, consistent with the original, the internal consistency
of the QABF-SF as a whole was lower than the mean of the subscales. However, this was
expected given that both measures are designed to tap five unrelated variables (Paclawskyj et al.,
2000). Other reliability estimates of the QABF-SF showed that the short form also retained the
high degree of both test-retest and interrater reliability of the original QABF.
Social validity data that were also gathered during the QABF-SF tryout showed that,
overall, frontline staff liked the format of the shortened measure, seemed to think that the
QABF-SF could provide useful clinical information, and be useful as part of a brief functional
assessment of behavior in individuals with ID. Of the frontline staff questioned, 14 (9.9%) did
not like the format of the QABF-SF, 23 (16%) did not think that the QABF-SF would provide the
66

team with good information, and 17 (12%) did not think that the QABF-SF could be useful as
part of a brief functional assessment. Although these rejection rates were low, it was useful to
determine possible reasons that staff did not like the QABF-SF. Regarding the QABF-SF, staff
cited the time of day and shift that staff was asked to respond (i.e., morning vs. night), personal
beliefs about individuals with ID, knowledge of behavioral assessment principles and
techniques, and experience with the rating scale development process.
Given the often complex nature of maladaptive behavior exhibited by individuals with
ID, the QABF-SF can be clinically useful in providing a starting point in the development of a
behavioral support plan. Traditionally, one of the first steps when designing a behavioral
intervention is to develop a hypothesis regarding the function that the behavior serves for the
individual. The QABF-SF fulfills this role as an aid to clinicians in developing this hypothesis.
However, the QABF-SF remains a clinical screening instrument and is it likely that second order
assessments may be needed as indicated in confirming or disconfirming the possible function(s)
of maladaptive behaviors that individuals with ID engage in. For example, if the function of a
particular behavior such as physical aggression seems to be escape, it is critical to ask what the
nature of the escape behavior is, in what context(s) it occurs, and what maintains the behavior.
The answers to questions such as these will assist behavioral psychologists develop functionally
equivalent replacement behaviors to teach the individual while examining more closely some of
the environmental and systemic factors that may be helping to maintain the individual’s
behavior.
The current findings should be considered in light of several limitations. First, the
samples consisted primarily of individuals diagnosed with severe to profound ID. Thus, the
current analysis cannot determine whether or not the factor structure would differ among
individuals with mild to moderate levels of ID. Second, the relatively small number of
67

participants in the QABF-SF tryout limits the model reliability and thus results concerning the
reliability of the QABF-SF should be interpreted with caution. Future investigations conducted
with larger sample sizes are needed to replicate these results and expand upon the present
findings. Third, it should be noted that the use of modification indices to guide the CFA
analyses, specifically the LeGrange multiplier, increases the probability of these findings being
influenced by chance. Fourth, the relative lack of other psychometrically sound measures of
behavioral function also limits the conclusions regarding the construct validity of this measure.
The results of the current study generated a number of future directions for research and
theoretical implications. While the present study is offered to show an example of how
researchers are continually refining measurement procedures in an effort to better tailor our
treatments, additional psychometric and normative data are needed before the QABF-SF should
be used clinically. These investigations should include studies that further examine the
construct, convergent, and discriminant validity of the QABF-SF. Other studies also need to be
conducted to determine effects of shortening one measure in a battery affects responder
compliance and the overall reliability and validity of the data collected. In addition, the validity
and clinical utility of the QABF-SF should be further assessed by determining whether the five
factor model structure of this measure is related to critical outcomes and improved quality of life
indices such as improved behavioral functioning, coping skills, and social functioning. Finally,
the sensitivity of the QABF-SF to the type of ID and severity of behavioral problems during the
course of a prescribed treatment should be examined.
In summary, there is a growing need for a simple, reliable screening tool to help identify
the function(s) of maladaptive behavior exhibited by individuals with intellectual disabilities.
Literature on other methods of behavioral assessment, such as analog functional analysis, shows
that the benefit of engaging in such an endeavor does not outweigh costs in time and resources.
68

69
Direct observation, while a cornerstone of behavioral assessment, sometimes has limited
applicability especially in situations where the behavior of concern is low in frequency. Thus,
behavior rating scales have become one of the most widely used methods of collecting data
about the possible function of an individual’s behavior. The QABF-SF seems to be a tool that
can be used as an alternative to the QABF when assessment time, staff knowledge, and limited
resources must be maximized.

REFERENCES Allen, E.L. (1957). Techniques of attitude scale construction. New York: Appleton, Century and
Crofts. Aman, M.G, & Singh, N.N. (1986). Aberrant Behavior Checklist (ABC). East Aurora, NY:
Slosson Educational Publications, Inc. American Psychiatric Association (2000). Diagnostic and statistical manual of mental disorders
(4th ed., text revision). Washington, DC: Author. Andrich, D. (1982). An index of person separation in latent trait theory, the traditional KR.20
index, and the Guttman scale response pattern. Education Research and Perspectives, 9, 95-104.
Applegate, H., Matson, J.L., & Cherry, K.E. (1999). An evaluation of functional variables
affecting severe behavior problems in adults with mental retardation by using the Questions About Behavioral Function Scale (QABF). Research in Developmental Disabilities, 20, 229-237.
Arrindell, W., & van der Ende, J. (1985). An empirical test of the utility of the observations-to-
variables ratios in factor and component analysis. Applied Psychological Measurement, 9, 165-178.
Bandura, A. (1969). Principles of behavior modification. NY: Holt, Rinehart and Watson, Inc. Balthazar, E. E., & Stevens, H. A. (1975). The emotionally disturbed, mentally retarded: A
historical and contemporary perspective. Englewood Cliff, NJ: Prentice-Hall. Bentler, P.M. (1990) Comparative fit indices in structural models, Psychological Bulletin, 107,
238–246. Bentler, P.M., & Bonnett, D.G. (1980) Significance tests and goodness of fit in the analysis of
covariance structures, Social and Behavioral Sciences, 19, 16. Bentler, P.M., & Kano, Y. (1990). An empirical-test of the utility of the observation-to-variables
ratio in factor and components-analysis. Applied Psychological measurement, 9, 165-178. Biasini, F. J., Grupe, L., Huffman, L., & Bray, N. W. (1999). Mental retardation: A symptom and a
syndrome. In S. D. Netherton & D. Holmes (Eds.) Child and adolescent psychological disorders: A comprehensive textbook (pp. 6-23). New York: Oxford University.
Blatt, B., & Kaplan, F. (1966). Christmas in purgatory: A photographic essay on mental
retardation. Boston: Allyn & Bacon. Bock, R.D., & Jones, L.V. (1968). The measurement and prediction of judgment and choice. San
Francisco: Holden-Day.
70

Bollen, K.A. (1989). Structural equations with latent variables. New York: Wiley. Boyle, G.J. (1991). Does item homogeneity indicate internal consistency or item redundancy in
psychometric scales? Personality and Individual Differences, 12, 291-294. Bowman, M.L. (1989). Testing individual differences in ancient China. American Psychologist,
44, 576-578. Bryant, F.B., & Yarnold, P.R. (1995). Principal-components analysis and exploratory and
confirmatory factor analysis. In L.G. Grimm and P.R. Yarnold (Eds.). Reading and understanding multivariate statistics. Washington DC: American Psychological Association.
Byrne, B. (1998). Structural Equation Modeling with LISREL, PRELIS, and SIMPLIS: Basic
applications and programs. NJ: Lawrence Erlbaum. Carr, E.G. (1994). Emerging themes in the functional analysis of problem behavior. Journal of
Applied Behavior Analysis, 27, 393-399. Carr, E.G., & Durand, V.M. (1985). Reducing behavior problems through functional
communication training. Journal of Applied Behavior Analysis, 18, 111-126. Cattell, R.B. (1950). Personality. New York: McGraw-Hill. Child, D. (1990). The essentials of factor analysis (2nd ed.). London: Cassel Educational Limited. Cohen, R.J., & Swerdlik, M.E. (1998). Psychological testing and assessment: An introduction to
tests and measurement (4th ed.). London: Mayfield Publishing Company. Committee on Classification of Feeble-Minded. (1910). Journal of Psycho-Asthenics, 15, 61-67. Costello, A.B., & Osborne, J.W. (2005). Best practices in exploratory factor analysis: Four
recommendations for getting the most from your analysis. Practical Assessment, Research & Evaluation, 10, 1-9.
Crocker, L.M., & Algina, J. (1986). An introduction to classical and modern test theory.
Belmont, CA: Wadsworth Group/Thomson Learning. Cronbach, L.J. (1951). Coefficient alpha and the internal structure of tests. Psychometrika, 16,
297-334. Derby, K.M., Wacker, D.P., Sasso, G., Steege, M., Northup, J., Cigrand, K., & Asmus, J. (1992).
Brief functional assessment techniques to evaluate aberrant behavior in an outpatient clinic: A summary of 79 cases. Journal of Applied Behavior Analysis, 25, 713-721.
Doll, E.A. (1953). The measurement of social competence: A manual for the Vineland Social
Maturity Scale. Washington, DC: Educational Test Bureau.
71

Doll, E.A. (1962). Trends and problems in the education of the mentally retarded: 1800-1940. American Journal of Mental Deficiency, 72, 175-183.
Dura, J. (1997). Expressive communicative ability, symptoms of mental illness and aggressive
behavior. Journal of Clinical Psychology, 53, 307-318. Durand, V.M. & Carr, E.G. (1991). Functional communication training to reduce challenging
behavior: Maintenance and application in new settings. Journal of Applied Behavior Analysis, 24, 251-264.
Durand, V.M., & Carr, E.G. (1992). An analysis of maintenance following functional
communication training. Journal of Applied Behavior Analysis, 25, 777-794. Durand, V. M., & Crimmins, D. B. (1988). Identifying variables maintaining self-injurious
behavior. Journal of Autism and Developmental Disorders, 18, 99-117. Embretson, S. & Reise, S. (2000). Item response theory for psychologists. Mahwah, NJ:
Erlbaum. Fabrigar, L.R., Wegener, D.T., MacCallum, R.C., & Strahan (1999). Evaluating the use of
exploratory factor analysis in psychological research. Psychological Methods, 4, 272-299.
Flanagan, D. P., Genshaft, J. L., & Harrison, P. L. (Eds.). (1997). Contemporary intellectual
assessment: Theories, tests, and issues. NY: Guilford. Floyd, F.J., & Widaman, K.F. (1995). Factor analysis in the development and refinement of
clinical assessment instruments. Psychological Assessment, 7, 227-236. Gable, R.A. (1996). A critical analysis of functional assessment: Issues for researchers and
practitioners. Behavioral Disorders, 22, 36-40. Galfo, A.J. (1985). Teaching degrees of freedom as a concept in inferential statistics: An
elementary approach. School Science and Mathematics, 85, 240-247. Good, I.J. (1973). What are degrees of freedom? American Statisticians, 27, 227-228. Gorsuch, R.L. (1990). Common factor analysis versus component analysis: Some well and little
known facts. Multivariate Behavioral Research, 25, 33-39. Greenspan, S. (1999). What is meant by mental retardation? International Review of
Psychiatry, 11, 6-18. Grossman, H.J. (1973). Manual on terminology in mental retardation (1973 rev Ed.).
Washington, DC: American Association on Mental Deficiency.
72

Grossman, H.J. (1977). Manual on terminology in mental retardation (1977 rev Ed.) Washington, DC: American Association on Mental Deficiency.
Haynes, S.N., & O’Brien, W.H. (1990). Functional analysis in behavior therapy. Clinical
Psychology Review, 10, 649-668. Iwata, B.A. (1994). Functional analysis methodology: Some closing comments. Journal of
Applied Behavior Analysis, 27, 413-418. Iwata, B., Dorsey, M., Slifer, K., Bauman, K., & Richman, G. (1982). Toward a functional analysis
of self-injury. Analysis and Intervention in Developmental Disabilities, 2, 3-20. Iwata, B.A., Pace, G., Kalsher, M., Cowdery, G., & Cataldo, M. (1990). Experimental analysis
and extinction of self-injurious escape behavior. Journal of Applied Behavior Analysis, 23, 11-27.
Jaccard, J., & Becker, M.A. (1990). Statistics for the behavioral sciences. (2nd Ed.). Belmont, CA:
Wadsworth. Joreskog, K. G., & Sorbom, D. (1984). LISREL VI: Analysis of linear structural relationships by
the method of maximum likelihood Chicago, IL: National Educational Resources. Kass, R., & Tinsley, H. (1979). Factor analysis. Journal of Leisure Research, 11, 120-138. Kline, T.B. (2005). Psychological testing: A practical approach to design and evaluation.
London: Sage Publications, Inc. Kim, J.O., & Mueller, C.W. (1978a). Introduction to factor analysis: What it is and how to do it.
Newbury Park, NY: Sage. Kim, J.O., & Mueller, C.W. (1978b). Factor analysis: Statistical methods and practical issues.
Newbury Park, NY: Sage. Lawley, D.N. and Maxwell, A.E. (1971). Factor analysis as a statistical method. London:
Butterworth and Co. Likert, R. (1932). A technique for the measurement of attitudes. Archives of Psychology, 140, 5-
53. Lohman, D.F. (1989). Human intelligence: An introduction into advances in theory and research.
Review of Educational Research, 59, 333-374. Lord, F.M. (1959). Tests of the same lengths do have the same standard error of measurement.
Educational and Psychological Measurement, 19, 233-239. Lord, F.M. (1980). Applications of item response theory to practical testing problems. Mahwah,
NJ: Erlbaum.
73

Lord, F.M., & Novik, M.R. (1968). Statistical theories of mental test scores. Reading, MA: Addison-Wesley.
Lowrey, M. & Sovner, R. (1991). The functional significance of problem behavior: A key to
effective treatment. Habilitative Mental Healthcare Newsletter, 10, 59-62. Mathias, J. L., & Nettlebeck, T. (1992). Validity of Greenspan’s models of adaptive and social
intelligence. Research in Developmental Disabilities, 13, 113-129. Matson, J. L. (1995a). The Diagnostic Assessment for the Severely Handicapped-II. Baton
Rouge, LA: Scientific Publishers Inc. Matson, J.L. (1995b). The Matson Evaluation of Social Skills for Individuals with Severe
Retardation (MESSIER). Baton Rouge, LA: Disability Consultants, LLC. Matson, J. L., & Bamburg, J. W. (1998). Reliability of the Assessment of Dual Diagnosis (ADD).
Research in Developmental Disabilities, 19, 89-95. Matson, J.L., & Kuhn, D.E. (2001). Identifying feeding problems in mentally retarded persons:
Development and reliability of the Screening Tool of fEeding Problems (STEP). Research in Developmental Disabilities, 21, 165-172.
Matson, J.L., Bamburg, J.W., Cherry, K.E., & Paclawskyj, T.R. (1999). A validity study on the
Questions About Behavioral Function (QABF) Scale: Predicting treatment success for self-injury, aggression, and stereotypies. Research in Developmental Disabilities, 20, 163-176.
Matson, J.L., Mayville, S.B., Kuhn, D.E, Sturmey, P., Laud, R.B., & Cooper, C.L. (2001). The
behavioral function of feeding problems as assessed by the Questions About Behavioral Function (QABF). Research in Developmental Disabilities, 26, 399-408.
Matson, J.L., Vollmer, T.R., Paclawskyj, T.R., Smiroldo, B.B., Applegate, H.R., & Stallings, S.
(1996). Questions About Behavioral Function (QABF): An instrument to assess functional properties of problem behaviors. Poster presented at the 22nd Annual Convention of the Association for Behavior Analysis, San Francisco, CA.
Menolascino, F.J., Levitas, A., & Greiner, C. (1986). The nature and types of mental illness in the
mentally retarded. Psychopharmacology Bulletin, 22, 1060-1071. Muliak, S.A. (1990). Blurring the distinctions between component analysis and common factor
analysis. Multivariate Behavioral Research, 25, 53-59. Nicholson, J., Konstantinidi, E., & Furniss, F. (2006). On some psychometric properties of the
Questions About Behavioral Function scale (QABF). Research in Developmental Disabilities, 27, 337-352.
74

Nihira, K., Foster, R., Shellhaas, M., & Leland, H. (1969). AAMD Adaptive Behavior Scale. Washington, DC: American Association on Mental Deficiency.
Nihira, K., Leland, H., & Lambert, N. (1993). AAMR adaptive behavior scale residential and
community (2nd edition): Examiner’s manual. Austin, TX: PRO-ED. O’Neill, R.E., Horner, R.J., Albin, R.W., Storey, K., & Sprague, J.R. (1990). Functional analysis of
problem behavior: A practical assessment guide. Sycamore, IL: Sycamore. Paclawskyj, T.R., Matson, J.L., Rush, K.S., Smalls, Y., & Vollmer, T.R. (2000). Questions About
Behavioral Function (QABF): A behavioral checklist for functional assessment of aberrant behavior. Research in Developmental Disabilities, 21, 223-229.
Robertson, G.J. (1990). A practical model for test development. In C.R. Reynolds & R.W.
Kamphaus (Eds.). Handbook of psychological and educational assessment of children: Intelligence & achievement (pp. 62-85). New York: Guilford.
Rojahn, J., Polster, L. M., Mulick, J. A., & Wisniewski, J. J. (1989). Reliability of the Behavior
Problems Inventory. Journal of the Multihandicapped Person, 2, 283-293. Sheerenberger, R.C. (1983). A history of mental retardation. Baltimore: Brookes Publishing Co. Singh, N.N., Matson, J.L., Lancioni, G.E., Singh, A.N., Adkins, A.D., McKeegan, G.F., & Brown,
S.W. (2006). Questions About Behavioral Function in Mental Illness (QABF-MI): A behavior checklist for functional assessment of maladaptive behavior exhibited by individuals with mental illness. Behavior Modification, 30, 739-751.
Skinner, B.F. (1953). Science and human behavior. NY: Macmillan. Smith, R.G., Iwata, B.A., Vollmer, T.R., & Zarcone, J.R. (1993). Experimental analysis and
treatment of multiply controlled self-injury. Journal of Applied Behavior Analysis, 26, 183-196.
Snook, S.C., & Gorsuch, R.L. (1989). Principal component analysis versus common factor
analysis: A Monte Carlo study. Psychological Bulletin, 106, 148-154. Sparrow, S., Balla, D., & Cicchetti, D. (1984). Vineland Adaptive Behavior Scales. Circle Pines,
MN: American Guidance Service. Sternberg, R.J. & Grigorenko, E.L. (1997). Are cognitive styles still in style? American
Psychologist, 52, 700-712. Steiger, J.H. & Lind, J.C. (1980). Statistically-based tests for the number of common factors.
Paper presented at the annual Spring Meeting of the Psychometric Society in Iowa City, IA.
75

76
Sturmey, P. (1995). Analog baselines: A critical review of the methodology. Research in Developmental Disabilities, 12, 269-284.
Taylor, J.C., Ekadahl, M.M., Romancyzk, R.G., & Miller, M.L. (1994). Escape behavior in task
situations: Task versus social antecedents. Journal of Autism and Developmental Disabilities, 24, 331-344.
Thompson, B. (2004). Exploratory and confirmatory factor analysis: Understanding concepts
and applications. Washington DC: American Psychological Association. Toothaker, L.E., & Miller, L. (1996). Introductory statistics for the behavioral sciences. (2nd
Ed.). Pacific Grove, CA: Brooks/Cole. Thurston, L.L. (1959). The measurement of values. Chicago: University of Chicago. Van der Linden, W.J. & Hambleton, R.K. (Eds.) (1997). Handbook of modern item response
theory. NY: Springer. Velicer , W.F., & Jackson, D.N. (1990). Component analysis versus common factor analysis:
Some further observations. Multivariate Behavioral Research, 25, 231-251. Vollmer, T.R, & Matson, J.L. (1995). User’s guide: Questions About Behavioral Function
(QABF). Baton Rouge, LA: Scientific Publishers, Inc. Wacker, D.P., Steege, M.W., Northup, J., Sasso, G., Berg, W., Reimers, T., Cooper, L., Cigrand,
K., & Donn, L. (1990). A component analysis of functional communication training across three topographies of severe behavior problems. Journal of Applied Behavior Analysis, 23, 417-429.
Weeks, M., & Gaylord-Ross, R. (1981). Task difficulty and aberrant behavior in severely
handicapped students. Journal of Applied Behavior Analysis, 14, 449-463. Yepsen, L. (1941). Defining mental deficiency. American Journal of Mental Deficiency, 46, 200-
205.

VITA
Ashvind Nand Singh was born in Auckland, New Zealand, and moved to the United
States at the age of 11. Ashvind went to the Virginia Commonwealth University and received a
Bachelor of Science with Honors in psychology in 1999. He is currently enrolled in the clinical
psychology doctoral program at Louisiana State University, working under Dr. Johnny L.
Matson. His research and clinical areas of interest include forensic psychology, mindfulness,
psychopharmacology, and neurocognition.
77