a critical review of the manufacturin sectog r in …
TRANSCRIPT
I N T - 1 4 1 4
CONS/95/3 30 June 1995 ORIGINAL; ENGLISH
ECONOMIC COMMISSION FOR LATIN AMERICA AND THE CARIBBEAN Subregional Headquarters for the Caribbean
CARIBBEAN DEVELOPMENT AND COOPERATION COMMITTEE
/(tí 0 rrv,-,̂
A CRITICAL REVIEW OF THE MANUFACTURING SECTOR IN TRINIDAD AND TOBAGO
Prepared by Hayc^^^OTe^'
The author is a Consultant to the ECLAC Subregional Headquarters for the Caribbean. The views expressed in this paper are those of the author and do not necessarily reflect those of the Organization.

n
w
The comments of Messrs. Lancelot Busby, Trevor Marker and
Swinburne Lestrade of the ECLAC Subregional Headquarters for the
Caribbean and the research assistance of Ms. Sandra Fonteneile are
acknowledged.
OÍÍ51.IUTECA CEPAL

«
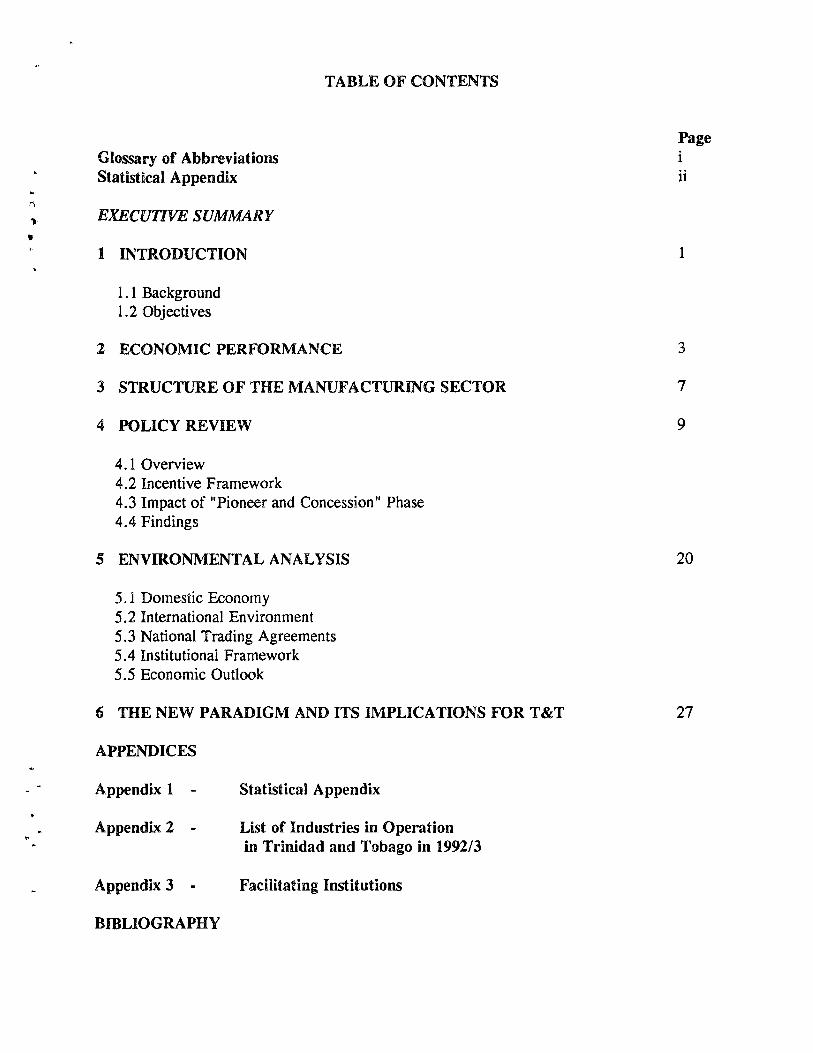
TABLE OF CONTENTS
Page Glossary of Abbreviations i Statistical Appendix ii
EXECUTIVE SUMMARY
1 INTRODUCTION 1
1.1 Background
1.2 Objectives
2 ECONOMIC PERFORMANCE 3
3 STRUCTURE OF THE MANUFACTURING SECTOR 7
4 POLICY REVIEW 9
4.1 Overview 4.2 Incentive Framework 4.3 Impact of "Pioneer and Concession" Phase 4.4 Findings
5 ENVIRONMENTAL ANALYSIS 20
5.1 Domestic Economy 5.2 International Environment 5.3 National Trading Agreements 5.4 Institutional Framework
5.5 Economic Outlook
6 THE NEW PARADIGM AND ITS IMPLICATIONS FOR T&T 27
APPENDICES
Appendix 1 - Statistical Appendix
Appendbc 2 - List of Industries in Operation
in Trinidad and Tobago in 1992/3
Appendix 3 - Facilitating Institutions
BIBLIOGRAPHY

H r *
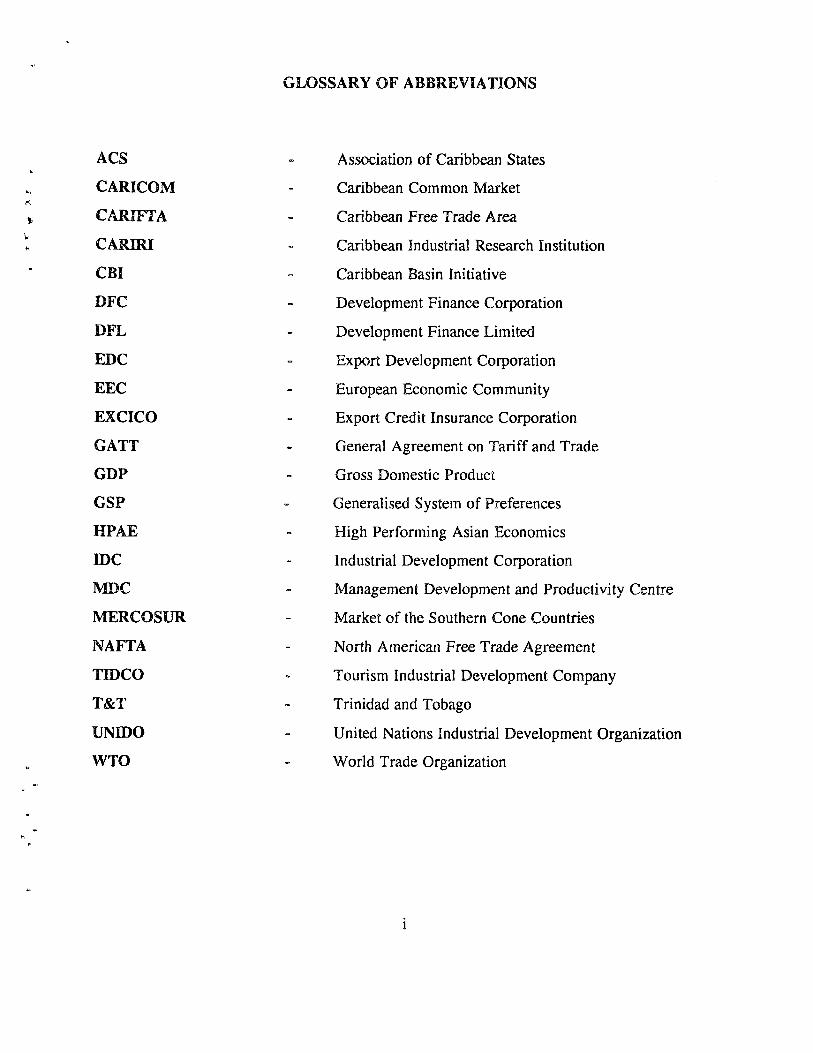
GLOSSARY OF ABBREVIATIONS
n
V
ACS
CARICOM
CARIFTA
CARIRI
CBI
DFC
DFL
EDC
EEC
EXCICO
GATT
GDP
GSP
HPAE
IDC
MDC
MERCOSUR
NAFTA
TIDCO
T&T
UNIDO
WTO
Association of Caribbean States
Caribbean Common Market
Caribbean Free Trade Area
Caribbean Industrial Research Institution
Caribbean Basin Initiative
Development Finance Corporation
Development Finance Limited
Export Development Corporation
European Economic Community
Export Credit Insurance Corporation
General Agreement on Tariff and Trade
Gross Domestic Product
Generalised System of Preferences
High Performing Asian Economics
Industrial Development Corporation
Management Development and Productivity Centre
Market of the Southern Cone Countries
North American Free Trade Agreement
Tourism Industrial Development Company
Trinidad and Tobago
United Nations Industrial Development Organization
World Trade Organization

•K »
STATISTICAL APPENDIX
•i t
V
Table 1
Table 2
Table 3
Table 4
Table 5
Table 6
Table 7
Table 8
Table 9
Gross Domestic Product, 1968-1979 (Constant 1970 prices)
Gross Domestic Product, 1982 - 1993 (Constant 1985 prices)
Manufacturing Value Added : Growth Rates
Gross Domestic Product: % Contribution
Sectoral Contribution to Employment
Manufacturing Exports
Gross Capital Formation - % Contribution
Structure of Manufacturing Output
Manufacturing Gross Domestic Product - % Contribution
11


EXECUTIVE SUMMARY
In accordance with the terms of reference provided this report critically reviews the performance of the manufacturing sector in Trinidad and Tobago between 1950 and 1994. It analyses how the sector has performed and why. in the context of incentive measures and facilitating mechanisms which have been in place for over 40 years. It identifies the constraints and challenges which the sector faces, and the prerequisites for its survival in the new economic environment.
The primary objectives ofindustrialiiaiion in Trinidad and Tobago were identified in the First, Second and Third Five-year plans. They were:
Í (1) to diversify the country's structure of production; V (2) to achieve a greater level of employment;
(3) to make the country more self-reliant; and (4) to increase export earnings.
In order to facilitate the achievement of these objectives three phases of the industrialization strategy were implemented, viz import-substitution, resource- based and export-oriented. These were characterized by the granting of incentives and concessions, the establishment of industrial estates, the creation of facilitating institutions, large inflows of foreign capital and injection of state equity and lastly, by the opening up of the economy. Yet, the economy remains dominated by activity in the petroleum sector. The structure of production has not been significantly altered nor have the national economic objectives been achieved.
In determining how the sector has performed, the report assesses its performance from available data, and in light of the stated economic objectives. The focus therefore is on its economic performance. This aspect of the study however was constrained by the inaccessibility of certain data because of the cessation of
^perations of the Industrial Development Carpüration. J^
A general conclusion is that the sector has under-performed and has not met its expectations. Despite this finding, from a policy standpoint, the sector remains critical for growth and sustained development in the T& T economy. Today however, the sector faces increasing competition. Globalization and technical change abroad .economic adjustment at home and world trade trends have contrived to create a more competitive international environment in which there is greater emphasis on the development and spread of technology as a means of improving the position of local firms on the international market.
In this environment the report finds that the major constraints which the sector faces can be identified as:
(1) a lack of competitiveness; and (2) a lack of correspondence between the structures of international demand and the structures
of production and export.
The prime task facing the sector therefore is the transformation of its production structure by improving \ its competitiveness and empowering it to respond to the emerging global and local contexts. This cannot be ^ accomplished simply by picking winners" but must be founded in an analysis and determination of the conditioning factors which will provide windows of opportunity for the sector.
The creation of an enabling environment of transparent competitive markets, the building of strategic \ alliances, an effective system of networks and linkages and the development of small and medium-sized en terprises are some of the ways in which the performance of the sector can be enhanced. In addition the ¡ experience of a number of countries in Latin America point to a greater potential for success in the production i of intermediate rather than final consumer goods.
In terms of the strategic options open to firms in the non-oil manufacturing sector ofT&T, they are classified into short arid long term. In the shorter term the existing production structure will be the base for
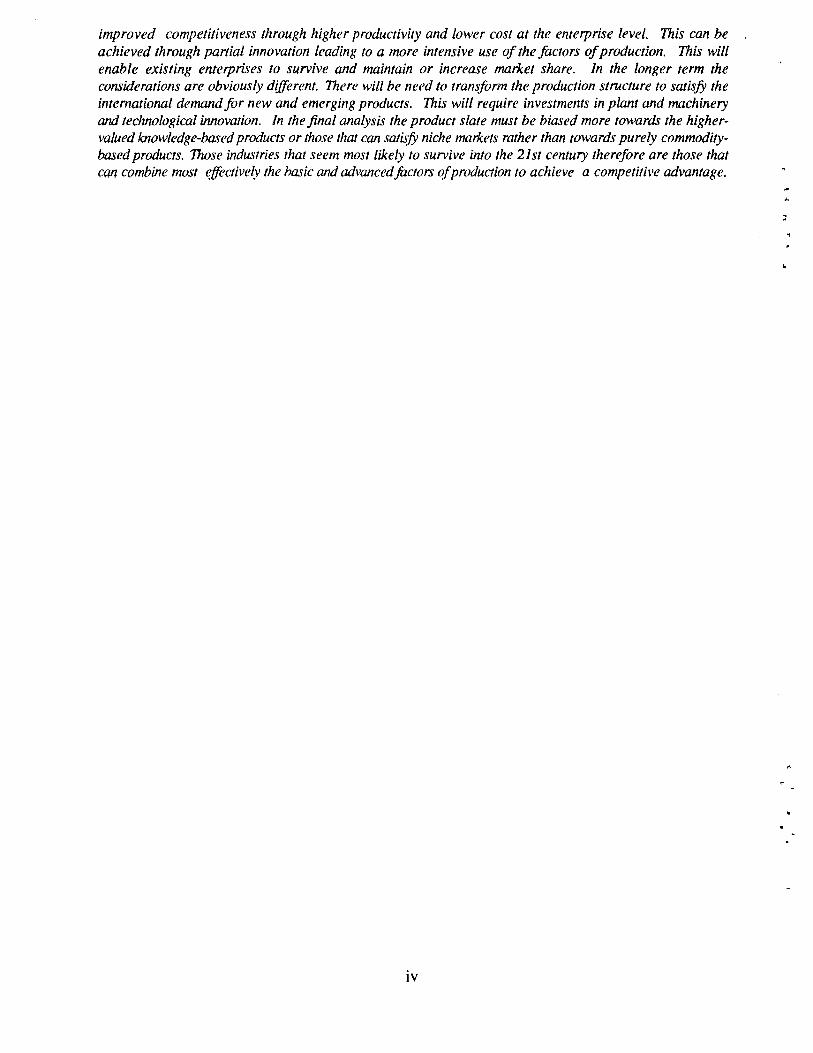
improved competitiveness through higher productivity and lower cost at the enterprise level. This can be achieved through partial innovation leading to a more intensive use of the factors of production. This will enable existing enterprises to survive and maintain or increase market share. In the longer term the considerations are obviously different. There will be need to transform the production structure to satisfy the international demand for new and emerging products. This will require investments in plant and machinery and technological innovation. In the final analysis the product slate must be biased more towards the higher-valued knowledge-based products or those that can satisfy niche markets rather than towards purely commodity-based products. Those industries that seem most likely to survive into the 21st century therefore are those that can combine most effectively the basic and advancedfactors of production to achieve a competitive advantage.
IV
1. INTRODUCTION
1.1 Background
Prior to the attainment of political independence in 1962, the manufacturing' sector had been identified as the basis for the modernization and diversification of the economy of Trinidad and Tobago (T&T). Its success, however, depends on the effective implementation of an industrialization strategy. Since 1950 several phases of this strategy have been developed and implemented. The general objectives of these were identified in the First, Second and Third Five-year plans. They were, not necessarily in order of priority, to diversify and modernize the country's structure of production, increase the level of employment, make the economy more self-reliant and less dependent on petroleum and increase export earnings.
The strategy was developed and implemented in three phases:
(1) import-substitution industrialization, (1950-1973) (2) resource-based industrialization, (1974-1982) and (3) export-led industrialization, (1983-present)
The first two were characterized by the granting of incentives and concessions to potential investors. These included income tax holidays and the establishment and provision of industrial sites on liberal terms. Despite these and other facilitating mechanisms such as promoting institutions, infrastructural and financial sector development, the manufacturing sector did not perform as expected. It failed to transform the basic structure of the economy and to create the necessary domestic linkages so important for generating employment and developing self-reliance.
The level of perfonnance can be attributed in part to the inefficiencies created by the indefinite period of effective protection granted to the sector through the Negative List. Protectionism, by its nature, fosters industries that might never be able to survive without it or "grow up". This was the case and the majority of the enterprises so established were not able to compete in the international market. Other reasons advanced are the small and uneconomic size of the domestic market and the narrow concentration of the sector especially during the import-substituting phase.
In the second phase the emphasis shifted to resource-based industrialization, specifically the establishment of petroleum-based industries at Point Lisas. These industries were export-oriented and based on indigenous resources. They were relatively capital intensive and increased the dependence, albeit indirectly, of the economy on petroleum and imported technology.
1 In tills paper, the inaiiufactui-Uig secloi- i-efci-s to iioei-üU tiiaiuifuctiiring activity. It inrludcs all other nianufactuiing activities excluding steel and sugar refilling. Sugar refining is considered in tiie GDP accounts under Agriculture.
The third phase which commenced in 1983 coincides with the on-going process of structural adjustment. It is based on a more vigorous export-led strategy to enhance the performance of the sector. This phase also coincides with significant international economic developments. The most important of these are the global trends of free trade, liberalization of markets and the formation of mega-trading blocs. These have created a more competitive international environment. The question that this poses for the manufacturing sector of Trinidad and Tobago is whether it can compete ín this environment and importantly, what are the pre-requisites for its survival in the 21st century.
1.2 Objective
The paper seeks to assess whether the non-oil manufacturing sector has a role to play in the future of the economy of T&T, and how it can play that role most efficiently. The assessment is based on a critical review of its historical performance and an identification of what will be required for its effectiveness in the future.
r .
2. ECONOMIC PERFORMANCE
The economic performance of the manufacturing sector is measured primarily in terms of its growth, contribution to GDP^, employment, exports and gross capital formation between 1968 and 1993. Its capacity utilization and competitiveness are also explored in a limited way.
In real terms, manufacturing output grew by 55.4% from $126.6mn in 1968 to $196.7mn in 1973 (Table 1). This rate slowed to 40% between 1973 and 1979 as value added moved from $196.7mn to $275.4mn. However, in the period between 1982 and 1993, the sector recorded growth of 20.4%, from $1614.5mn to $1285.7mn (Table 2). Within the sector, all the sub-sectors, with the exception of textiles, garments and footwear registered significant increases over the period 1968-1973 (Table 3). In this period the most significant growth was in assembly type and related industries, which grew by 97%. Between 1973 and 1979, wood and related products experienced the most significant growth (88.5%). This trend of positive sub-sectoral growth was reversed significantly between 1982 and 1993. Most of the sub-sectors with the exception of chemicals and miscellaneous manufacturing recorded negative growth between 1982 and 1986. The greatest decline was in wood and related products. From 1986 to 1993, textile and garments, and assembly type and related industries also experienced major declines which were attributed to increased competition caused by trade liberalization and the general downturn in economic activity.
The slowdown in growth coincided with the declining fortunes of the petroleum sector which still has a significant impact on the overall level of economic activity. Petroleum production and refinery throughput began to decline from 1978. This led to a decrease in real value added in the petroleum sector. As growth in oil revenues began to taper off, this had an adverse effect on the ability of the government to drive activity in the non-oil manufacturing sector. As a result, growth in the non-oil economy also began to slow dov/n after 1981. This chain of events is evidence of inability of the manufacturing sector to cushion or compensate for fluctuations in the fortunes of the dominant petroleum sector. This problem was heightened by the reliance of the manufacturing sector on the internal market.
At constant prices, the manufacturing sector in Trinidad and Tobago contributed 8.2% to GDP in 1968 of which food, drink and tobacco accounted for 3.1% (Table 4). The contribution increased to 11.3% in 1973. In that year, food, drink and tobacco again accounted for most of the sector's value added (4.1%) while textiles and garments and miscellaneous manufactures contributed the least (0.6%). By 1993, the sector's contribution to GDP fell to 8.0%, with the food, drink and tobacco sub-sector contributing 3.7%.
At the level of the sub-sectors, the food, drink and tobacco sub-sector contributed the most to the sector's value added over the period. Assembly-type and related industries was also a significant contributor, increasing from 1.7% in 1968 to 3.6% in 1979. After 1979,
^ Due to the uiun uilabiljty iif a cciiiNisteiii set of data series in one base year, the GDP ijj constant teniis had to be broken up into 1970 & 1985 pri ifs .
the contribution of this sub-sector decliiied reaching a mere 1.2% in 1993. Chemicals and non-metallic minerals, emerged as the second most important sub-sector to food, drink, and tobacco in terms of its contribution to GDP after 1988. Up to 1992, miscellaneous manufactures and wood related products contributed the least to GDP but, by end-1993, textiles, garments and footwear assumed this position, contributing a mere 0.2% to total GDP. This compares to a high of 0.9% in 1970.
The relative performances of the individual sub-sectors have resulted in changes in the structure of production of the manufacturing sector over the period mainly at the level of the leading sub-sector. In the mid-sixties when the sector was growing rapidly it was dominated by the assembly-type and related industries which experienced a decline in the 1980's. Thereafter, the food, drink and tobacco sub-sector assumed dominance which it has maintained since, followed by chemicals and non-metallic minerals.
The share of manufacturing employment in total employment was 17.7% in 1968 (Table 5). Comparatively, in that year, the contribution of the services sector was 59.7%, and export agriculture, 22.6%. By 1977, the share of manufacturing declined to 13.2%, agriculture to 14.5% while services increased to 66.9%. In that year, the sub-sector textiles, garments and footwear contributed the most (3.5%) to employment in the manufacturing sector, while miscellaneous manufacturing contributed the least (0.6%). By 1993, the share of manufacturing employment fell further to 9.7%, with food, drink and tobacco contributing the most (3.1%) while the textile, garment, footwear sub-sector had declined to 0.8%. A number of factors contributed to this decline. Chief among these were the fiscal incentives which encouraged capital intensive industries, the provision of duty free inputs and the existence of over-valued exchange rates which encouraged the substitution of imported capital goods for local labor. In general the policy initiatives did not lead to the kind of employment gains originally envisaged as a measure of success of the sector. Finally, within the last 5 years the implementation of trade liberalization has had a further negative impact on employment in the manufacturing sector due to the closure of many firms, so did the emphasis on production for export which tended to the utilization of the most advanced, most productive and usually more capital intensive technologies.
The share of manufacturing exports^ in total exports by value has trebled since 1976, rising from 10.6% to 34.3% in 1993 (Table 6). The relatively small ratio in the earlier years reflects the import substitution bias of the strategy of the period. In 1976, manufactured goods accounted for 56.4% of non-oil exports. By 1993, this increased significantly to 80.8%. Between 1976-1993, the export of chemicals dominated manufacturing exports, moving from 5.7% to 16.9%. In terms of destination, within recent times, the export of chemicals to the extra-regional market has increased marginally in relation to intra-regional markets. The export of chemicals to extra-regional markets increased by 14% between 1989 and 1993 while to the CARICOM market it increased by 114%. The bias is favor of the CARICOM market is a direct result of the protection provided therein. With respect to manufactured goods (namely wood, textile, metals) extra-regional exports increased by 52.5% while exports to CARICOM increased by 70% over the same period.
Maiiiifacturiiig cxpuils uro (U-tliu'il ii.siiig tin- SI TC.' I'lassitiratiiin and excliiilt's Tooil siiicr tlir level of aggregation does not allow a separation ui'agricultural products from processed foods.
Over the years, the manufacturing sector has not made a significant contribution to gross capital formation (Table 7). The largest contribution has come from the services sector. It has consistently exceeded 50%, peaking at 61.5% in 1982. Between 1968 to 1989 petroleum, the dominant economic sector, accounted for more than 25% of gross capital formation, which was as high as was 37,7% in 1973. In 1989 it was 31.5%. Comparatively gross capital formation by both the agricultural and sugar sectors were relatively small. The contribution of the manufacturing sector was 9.5% in 1968 and increased to 13.5% in 1989. Within the sector, assembly-type and related industries accounted for the greatest proportion of gross capital formation except for 1973, when food, drink and tobacco was the leading sub-sector.
While capacity utilization is an important measure of sectoral performance in the manufacturing sector in T&T, there is limited data available for this statistic at the firm and sectoral levels. At the sectoral level data derived from a sample survey"* undertaken by the IDC in 1987 revealed the existence of considerable excess capacity. Capacity utilization in the manufacturing sector then averaged around 45%, ranging from 25% in printing, publishing and packaging to 57% in the food, beverage and tobacco sub-sectors. Investment and export data between 1987 and 1993 suggest that this excess capacity had been utilized to meet the initial increase in export demand. However a number of firms have ceased to operate since 1987, implying that at the firm level there might have been a greater level of capacity utilization in the last 5 years. The indexes of productivity and employment (1977 = 100) also lead implicitly to a similar conclusion. For all industries (except oil and sugar), the productivity index increased to 364.6 in 1993 while the index of employment declined to 68.0.
Boamah and Campbell (1992) suggest that the relative unit labor costs (RULC)'' is one of the more commonly used indicators of international cost and/or price competitiveness. The others are the real exchange rate and the real effective exchange rate. The RULC they argue provides a measure of a country's relative ability to sell its tradeable output of goods and services, its export or external competitiveness. A rise in a country's RULC would suggest a loss in external competitiveness and vice-versa.
Using the index of real wages in manufacturing instead of the index of real weekly earnings, Boamah and Campbell calculated that between 1975 to 1995 the RULC for T «fe T grew by 3.6%. The growth was 16.5%, 17.8% and minus 7.8% for the successive five year interval of 1975-80, 1981-85 and 1986-90. The marked movement in the last period is attributed to the devaluation in the currency which reduced real wages. And, the downward movement in the exchange rate since should lead to a further improvement in the level of external competitiveness of the manufacturing sector. This can be supported by the behavior of export volumes which showed a systematic decline from 1975 to 1983 and began to show a discernible upward trend between 1987 and 1990 and beyond.
The sanip'e s u n e y coiicciiti-aU'rf on iinius bciirtltiiig from tlu- various tiirciilivrs ailiiiiiiisierfd by t!ie IDC. Tliis represented more than of 90% of tiriiis ill the sector.
Best (1980)
in the context of the attainment of the overall economic objectives therefore the manufacturing sector has not performed satisfactorily. While the sector grew, it failed to diversify the economy. Trinidad and Tobago is still heavily dependent on petroleum which contributes over 25% to GDP and remained the primary engine of growth. Real output of the manufacturing sector has not displayed consistent growth, rather it has fluctuated. This fluctuation coincided with changes in the fortunes of the petroleum sector reinforcing the view that the manufacturing sector has failed to emerge as an independent and dynamic sector. The sector also failed to generate the kind and quantity of employment gains originally envisaged. Although some gains were made in its contribution to exports, a large percentage of this increase was to the CARICOM market in which there is a degree of protection and which can be viewed as an extension of the domestic market. The reasons for this relatively poor performance are also indirectly related to the structure of incentives which were given to the industry since 1950. These are discussed more fully in Chapter 4.
3. STRUCTURE OF THE MANUFACTURING SECTOR
One of the most important structural weaknesses of the economy of T&T is its acute dependence on a single commodity, namely petroleum. This is evidenced by an analysis of the sectoral composition of GDP over time. In constant prices, the petroleurn sector coa^buted 26.7% to GDP in 1968. While the contribution of the sector declined to 14.5% in 1^79, adversely affected by relatively low oil prices and declining production leyels,, its contribution rebounded to 24.6% in 1993 on the strength of improved international prices. Comparatively, the manufacturing sector contributed 8.2% to GDP in 1968 and agriculture (excluding sugar) 1.9%. The contribution of manufacturing increased to 12% in 1979 but fell to 8% in 1993. On the other hand agriculture has remained relatively constant at 2.8% in 1968 and 2.2% in 1993. The production base therefore is basically unchanged. The manufacturing sector is relatively small and production activity is dominated by petroleum.
Within this overall structure of production, the evolution of the structure of the manufacturing sector is instructive. Several points need to be noted in this regard. Firstly, the "plantation" history of the economy has been decisive in shaping the structure (and organization) of the manufacturing industry. The dominance of the sugar plantation interest helped to determine the initial directions in which industrial diversification proceeded i.e the development of sugar by-products, and food processing with a significant sugar input. Secondly, the structure which evolved after 1950 was partially influenced by Lewis's policy prescription for development, though the path actually followed was based on the import-substitution model in preference to an export-led strategy. Finally, its growth has been influenced by the ability of the economy to attract and hold foreign capital. This is evidenced by the high level of foreign ownership among 'pioneer' firms during the first phase of industrialization. It also had implications for the type of productive technology utilized.
In 1940 there was already a fledgling residentiary sector which was further stimulated by the closure of the economy during World War 11, and the high incomes associated with the boom conditions of the U.S. military presence. Appendix 2 gives a list of the industries in operation in 1942/43.
In the immediate post-war period, the organized manufacturing industries were based on sugar processing. By 1953, sugar and its by-products alone accounted for 33% of gross manufacturing output. The production of food, beverage and tobacco as a whole accounted for 72% of gross manufacturing output. Clothing and footwear accounted for 6%, much of it originating in small business (Farrell 1979). This lack of diversification of the manufacturing sector in the eariy 1950s was a direct legacy of colonial policy towards industrialization. This policy did not actively support a wide range of manufacturing activity.
Thereafter, a different structure of production emerged in the sector, as a result from a more pro-active strategy. By the end of the 1960s, as a result of the "industrialization by invitation" strategy, the manufacturing sector had expanded its operations into food processing, textiles, garments, furniture, building materials and household and consumer durables. These enterprises were mainly foreign owned and utilized foreign expertise and technology. The sector began to demonstrate early features of dualism, comprising both capital-intensive heavy industries producing steel, cement and automobile assembly and labor-
intensive light industries producing food, beverages, electronic appliances, textiles and wood products.
The analysis of the non-oil manufacturing sector reveals that its structure of production like that of the wider economy has not changed significantly. Food, beverage and tobacco, while not always the leading sub-sector has contributed most to manufacturing value added over the past four decades. In 1968, this sub-sector contributed 37.7% to manufacturing value added (Table 8) and by 1993, its contribution rose to 46%. On the other hand, wood and related products and miscellaneous manufactures which contributed the least (5.1%) to value added in 1968 accounted for 3.9% in 1993, only marginally better the textiles, garments and footwear which declined from 9.7% in 1968 to 3.0% in 1993. The relative contributions of the other sub-sectors were almost the same.
The relative contributions of oil-based and non-oil manufacturing activities have also fluctuated. In 1968, oil-based activity was the more dominant accounting for 55%, but by 1992 there was a reversal as non-oil manufacturing activity accounted for 68.7% of the contribution of overall manufacturing to GDP. This is shown in Table 9.
The dualistic structure which began to emerge in the 1960s became institutionalized in the 1970s. This was partly due to the type of incentives provided to 'kick start' the sector then. This resulted in the establishment of a number of relatively small firms producing for the protected local market. These firms displayed either monopolistic or oligopolistic characteristics because of the inability of the market to support more than a few producers, and as is inherent in small economies. They imported most of their raw materials and failed to create the backward linkages as envisaged in the development plans. Later, as the government implemented the 'resource-based' strategy, larger export based firms which utilized more capital intensive technology were established.
The ownership pattern also reflects the different phases of the strategy. The basic import substitution model founded on the strategy on 'industrialization by invitation' facilitated the inflow of foreign investment and ownership. This was followed by the implementation of the resource-based strategy characterized initially by extensive state ownership. Today, as the sector seeks to restructure and the private sector re-emerges as the engine of growth, the state is divesting its interests and private investment, local and foreign, is shaping the pattern of ownership.
4. POLICY REVIEW
4.1 Overview
"Industrialization by Invitation" was an operational model of development put forward for the entire Caribbean in the 1950s by William Arthur Lewis (1950). The model rested on the theoretical argument that the case for rapid industrialization was over-population of the land. Not only was agriculture unable to absorb the excess labor supplies but technical progress was also reducing the actual numbers in agriculture. Lewis suggested that the Caribbean islands develop an export trade in manufacturing while increasing agricultural productivity. The manufacturing sector he argued further, should be based on foreign expertise and capital which must be enticed by fiscal incentives and a relatively low real wage.
Since 1950 T&T has, employed several industrial strategies and variants of the Lewis approach to modernize and diversify its economy. Three distinct strategies or phases of industrial strategy can be identified:
(1) import-substitution industrialization (1950-1973); (2) resource-based industrialization (1974-1982); and (3) export-promoting industrialization (1983-present).
In the late 1950s, the strategy was based on import substitution supported by incentives and concessions. This strategy was an operational feature of the Puerto Rican model and was a variation of the original Lewis's proposition. It was aimed at reducing the dependence of the economy on the agricultural and petroleum sectors while promoting greater self-reliance.
In the second period (1974-1982), an additional feature of the strategy was the establishment of resource based industries. This resulted in the dualistic nature of the sector. On the one hand were the import substituting firms, small, relatively labor intensive and catering primarily for the protected local market. On the other were mainly state-owned enterprises which were larger, export oriented and more capital intensive.
In the third period (1983-present), there is evidence of further shift in policy toward a more market-led, export oriented strategy. This period is also characterized by economic adjustment and, other policies to enhance the competitiveness of the sector are actively promoted.
4.2 Incentive Framevs'orli
ne Early Years: 1950-1973

In Trinidad and Tobago, the official (colonial) response to the growing demand for an active policy to foster industrialization was the appointment in 1947 of a committee (Shaw Committee). This committee recognized:
"..Jbe important part which the expansion of existing industries and the addition of new ones(could)play in equating the Colony's import and export value..." (St. Cyr, 1981).
It thus proposed a number of incentives to industry, among them were:
• release of foreign exchange for purchase of plant and machinery; • duty free import of plant and equipment; • protective tariffs; • removal of barriers to exports by the conclusion of agreements with foreign
governments; • exemption from income tax; • assistance in obtaining raw materials for the manufacture of products for
export.
The legislative base for the implementation of these recommendations was laid in 1950 with the enacting of the Aid to Pioneer Industry Ordinance and the Income Tax (in Aid of Industry) Act.
The Aid to Pioneer Industry 0rdinance(1950)® was an Ordinance:
"...to encourage the establishment and development of new industries in the colony and to make provision for the granting of certain relieffrom customs duty and income tax to persons establishing factories in connection with such industries and for the purpose incidental to or connected with any of the foregoing purposes..."
This Ordinance gave to pioneer^ industries, duty free concessions on imports of capital equipment, exemptions from payment of income tax for 5 years, unlimited carryover of losses, and tax free distribution of profits.
The Income Tax (in Aid of Industry) Act (1950)'was primarily to:
"...make provision for relief from income tax in aid of certain industries and the provision of workmen's home..."
6
14
See Chapter 33, Oi cliimnce 11». 3 of 1950. See also aiiieii(liiu iit.s of 1952/53,1956 and 1961.
A pioneer iiulusti-}' is one tvliirh hiu not been conducted in T&T on a conunerciul scale, or at all, or any iiidustry for wlilch there is favorable prospects for fuiilier development (Section 3(1) of the Ordinance). Cabinet may declare more than one pioneer manufacturer in l elalion to any one pi.ineer iiidusti-y (Section 4).
.See Chapter 33. Nos. 2 and 12 and Amendment No. 48 of 1955
10
This Act as amended in 1955 permitted the accelerated depreciation of capital in the post tax free period for pioneer manufacturers. In order to gave special encouragement to cement production, the Cement Industry Development Ordinance of 1951 was also passed, the first of a number of ordinances specially designed to encourage and protect large investments.
The early industrial promotion policies of the colonial administration were criticized by Eric Williams as inadequate. After attainment of office in 1956, Williams set about to implement an alternative programme which was fully articulated in the First, Second and Third Five-Year Development Plan of the period 1958 to 1973.
In the First Plan (1958-1962) the government stated its intention to
"...promote the manufacturing sector through the investment of public capital and skill. These industries will not be those based on the processing and preparation of our domestic resources, but also those attracted by the advantageous position with regard to fuel supply, and others producing consumer goods for local and West-Indian consumption..."
An Industrial Development Corporation (IDC) was to be set up which
"...will be Government's agent in the execution of industrial policy charged with industrial promotion, creating the atmosphere where industrialist wouldfeel welcome to enter and encourage to expand.."
And, special incentives were also to be offered to create parity with the countries where industries were already established.
Critical pieces of legislation gave effect to the policy. Act no. 11 of 1958^ established the Industrial Development Corporation. The local industry was protected against unfair practices by the Trade Ordinance of 1958 and the Customs Duties (Dumping and Subsidies) Ordinance of the same year. The principle of "no taxation of the means of production" was further advanced by the Customs '"(Amendment) Ordinance, Act. no. 2 of 1959 under which Section 49a granted exemption of customs duty on raw materials for industry. There also followed, as was the case for the cement industry in 1951, a series of special ordinances designed to give protection to especially large investments e.g. the Nitrogenous Fertilizers Industry (Development) Ordinance (1958), the Lube Oil and Greases Development Ordinance(1961), the Petrochemicals Industry Development Act(1962) and the Tyre Manufacturing Industry Development Act(1967).
After 1970, a new dimension was added to the industrialization strategy with increasing emphasis being placed on small business sector. The Government, through
9
10
IDC (EstabUsluiiciiO Oi-tliiiaiici- No. 11, Miiy 31,1958. The IDC (IM not begin operations untU 28 February 1959. It also took over the functions of the Iloicl Development Corporation wiiich had been set up in 1956.
Finns to wliicli only duly exemption was given were called "assisted" firms while finiis receiving tax exemptions were called "pioneer" firms.
1Í
the IDC, introduced in 1970, an incentives program to encourage the development of small business. This programme included: loans, provision of factory shells, technical assistance, training subsidy, the construction of facilities for commercial activity, a capital grant programme for Tobago.
A number of institutions were established to assist with the implementation of the industrial strategy. The principal among them were the Management Development and Productivity Center (1965), the Development Finance Corporation (1970), the Small Business Division of the IDC (1970), the Caribbean Industrial Research Institute (1971) and the Bureau of Standards (1972). (See Appendix 3)
Before 1970 however, it was evident that the strategy of import substitution had not achieved its primary economic objectives mainly because of the non-economic size of the local market. This led to a modification of the strategy, notably, the emphasis on the regional export market facilitated by the formation of the Caribbean Free Trade Area (CARIFTA) in 1968. This was reflected in the Third Plan which stated that
"... rapid expansion of export of manufactures for the CARIFTA market and increasingly for wider regional and world markets...".
It was reinforced by the establishment of the scheme for the Harmonization of Fiscal Incentive to Industry within CARIFTA. Further protection was provided by an amendment to the Customs Act" which established higher rates of import duty for goods of non-common market regional origin.
The foundation for industrial development was therefore laid between 1950 and 1973 by the provision of a range of incentives, the establishment of promoting institutions and other facilitating mechanisms. Despite this, the objectives of industrialization were not achieved. This could be attributed to the inefficiencies which developed as a result of the dominant inward looking strategy with its bias towards industries based on import substitution rather than exports. As a result, manufacturers served primarily the small and non-economic domestic market. This was facilitated by the virtual closure of the economy from external competition through quantitative restrictions and led to production inefficiencies.
Vne Boom Years : 1974-19S2
During the boom years, the development of the non-oil manufacturing sector continued to be promoted by incentives, tariff and non-tariff barriers. However, as a result of the shortcomings of the strategy of the previous period, the government initiated a shift in strategy in 1973. It was based on the establishment of export oriented energy based industries (steel, fertilizers, and methanol). It represented an attempt to break the traditional pattern of production and diversify further the manufacturing sector, by adding value locally to the most abundant indigenous resource
15 Sec the Crusfoms (Aim-minient) Act of 1973.
12

This second major initiative therefore was the "resource-based industrialization" strategy. It involved substantial government participation, either in wholly owned or joint venture enterprises. This strategy retained the basic principle of diversification away from a dependence on primary production in the petroleum sector.
In 1975'^ measures were also introduced to facilitate Government's participation in industrial and commercial enterprises. The projects targeted for investments were principally technology and skill intensive in the petrochemical sector with output geared for the export market. This was a further stimulus to the manufacturing sector through increased state investment from the surpluses of the oil boom.
While in this period limited diversification was achieved, the strategy did not achieve the desired change to the structure of production nor make the economy more self reliant. The "monocrop" syndrome was still a dominant feature of the country's overall production structure and the objective of sustained economic growth was not realized. As a result, developments in the external environment continued to have a severe impact on the economy, particularly after 1983 when the decline in the fortunes of the petroleum industry began to set in.
The adjustment period: 1983-present
By the early 1980s, the economy was facing major difficulties as a result of the collapse of oil prices. In 1982 the government reiterated its commitment to "create a business climate conducive to exports and to take action supportive of private sector initiative to diversify foreign exchange earnings". This led to a reassessment of the development strategy which was undertaken by means of appraisal which examined:
(1) whether the country should continue to allocate to the energy based industrial sector, national resources in the same proportion as before; and
(2) what more effective measures could be devised to develop the non-oil sector and diversify the export trade of the country.
This caused another major shift in the industrialization effort and was based on a re-orientation of the manufacturing sector towards the international market. It signaled the era of the export thrust and coincided with the period of significant economic adjustment and reform in which the private sector, local and foreign, is expected to become the engine of growth.
14 Govfi-nmciit's policy toward foi'i'Ign iiivcMtiiiciit was firsi uiitiiiied in tiie 3rd Five yi-ar plan. In iliis plan ilic govenuiient articulated tlie view tiiat the control of tiie economy was a political and psyciiological "iinpei-ative" and that greater national control should be exercised over the "commanding heights" of the economy. To tSUs end, the government began a programme of the acquisition of foi-eign assets in ail sectors.
13
At the sectoral level, policies were introduced to improve resource allocation and encourage the adoption of a more export-oriented, market-led approach by the private sector. The exchange rate was adjusted first in 1985 on a two-tier basis, unified in 1987 and adjusted again in 1988. Since 1993 it has floated. Beginning in 1989, there was the liberalization of exchange and trade regimes. Export licensing requirements were dropped for certain activities including manufacturing. In 1991, the negative list was reduced by removing 78 items or 40% of production weighted non-oil manufacturing goods and in 1992 it was dismantled. These quantitative restrictions have been replaced by tariffs.
A number of other actions have been taken over the last ten (10) years. At the institutional level a "one-stop" facility was established to reduce bureaucratic delays in the administration of incentives and to provide other forms of assistance such as facilitating access to capital and credit. In 1984, an Export Development Corporation (EDC) was established. The legislation framework was also revamped to facilitate investment in the manufacturing sector. The Finance Act (1966) was amended to provide increased export allowance, for tax deductible promotional expenses and to introduce market development grants. The Foreign Investment Act of (1990) repealed the Aliens' Landholding Act to provide a more liberal regime for foreign investment. And in 1988, Free Zone legislation was enacted to foster the development of new export industries in a liberalized regime.
In order to assist with financing the expansion in the manufacturing sector, a number of export credit financing facilities were established. These facilities provided mainly pre-shipment financing for the purchase of raw materials and intermediate goods. Further support for the export thrust has come through the Business Expansion and Industrial Restructuring (BEIRL) Project which is intended to promote development and/or restructuring of private manufacturing or service firms (except primary producers of oil and agricultural products) especially to enter and compete in export markets. It is being implemented with support from the World Bank.
4.3 Impact of "Pioneer and Concession" Phase
The impact of the "pioneer and concession" phase of industrialization in T&T is presented here as an example of the overall impact of the industrialization strategy. The impact analysis is based on the performance of most firms that were established between 1950 and 1973, and the data utilized is largely what was available at the IDC.
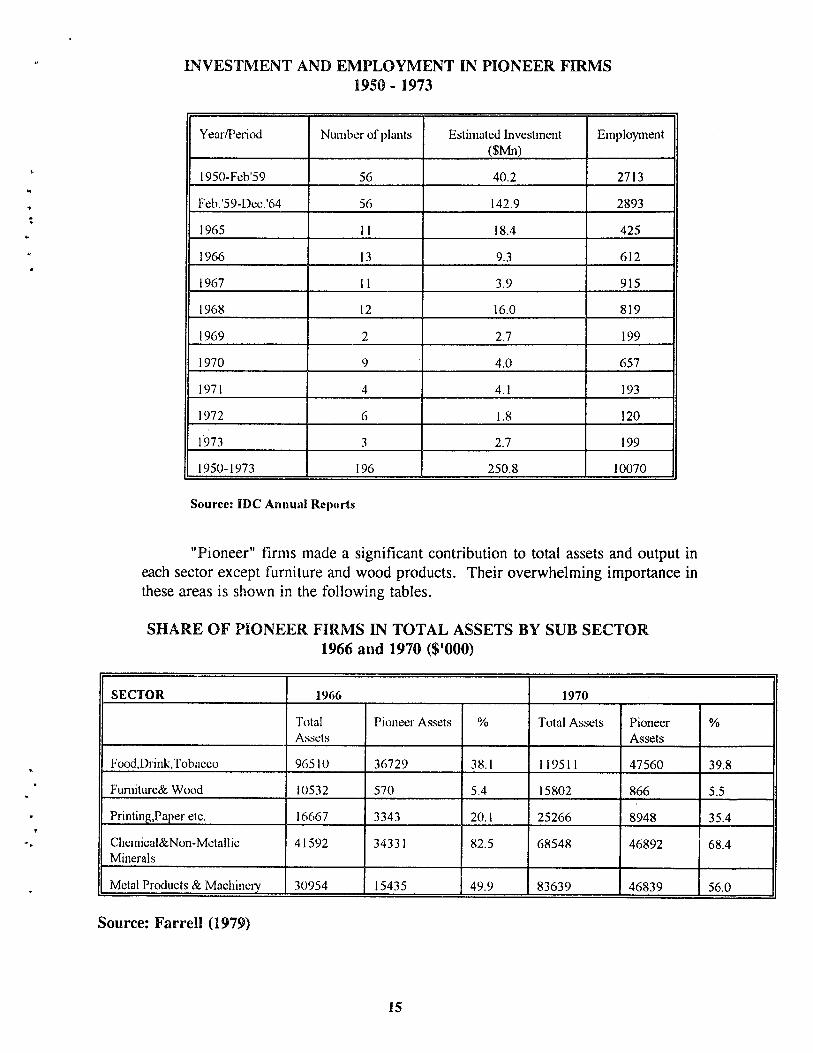
Prior to the establishment of the IDC in 1958, 56 firms with an investment of $40.2mn and employment of 2,713 received "pioneer" status. Over the period 1950-1973 about 196 firms with a total investment of $250.8mn and employment of 10,070 were promoted through the grant of "pioneer" status. The data in the table below shows that after 1968 the number of firms granted this status declined significantly. Many subsidiaries of large multinationals such as Nestles, Bata, Lever Bros., Dunlop as well as firms in petroleum and chemicals, e.g. Texaco and W.R. Grace, started their operations in Trinidad and Tobago under "pioneer" status.
14
INVESTMENT AND EMPLOYMENT IN PIONEER FIRMS 1950 - 1973
Year/Period Number of plants Estimated Investment ($Mn)
Employment
1950-Feb'59 56 40.2 2713
Feb.'59-Dec.'64 56 142.9 2893
1965 11 18.4 425
1966 13 9.3 612
1967 11 3.9 915
1958 12 16.0 819
1969 2 2.7 199
1970 9 4.0 657
1971 4 4.1 193
1972 6 1.8 120
1973 3 2.7 199
1950-1973 196 250.8 10070
Sourcc: IDC Annual Reports
"Pioneer" firms made a significant contribution to total assets and output in each sector except furniture and wood products. Their overwhelming importance in these areas is shown in the following tables.
SHARE OF PIONEER FIRMS IN TOTAL ASSETS BY SUB SECTOR 1966 and 1970 ($'000)
SECTOR 1966 1970
Total Assets
Pioneer Assets % Total Assets Pioneer Assets
%
Food,Drink,Tobacco 96510 36729 38.1 119511 47560 39.8
Fumiture& Wood 10532 570 5.4 15802 866 5.5
Printing,Paper etc. 16667 3343 20.1 25266 8948 35.4
Chemical&Non-Metallic Minerals
41592 34331 82.5 68548 46892 68.4
Metal Products & Machinei-y 30954 15435 49.9 83639 46839 56.0
Source: Farreil (1979)
15

SHARE OF PIONEER FIRMS IN TOTAL OUTPUT BY SUB-SECTOR
SEC1OR 1966 1970
Total Value Added
Pioneer Value Assets
% Total V.A Pioneer V.A %
Food, Driiik and Tobacco 28,992 11,513 39.7 53,369 20,651 38.7
Furniture and Wood 5,306 246 4.6 8,324 420 5.0
Paper, Printing and Publishing 7,421 1,303 17.6 13,113 2,935 22.4
Chemicals& Non-Metallic Minerals
12,398 8,435 68.0 22,377 14,420 64.4
Metal Products& Machinéis 13,786 5,820 42.2 37,856 19,358 51.1
Source: Farrell (1979)
A further dis-aggregation of the data also shows that among these "pioneer" firms, foreign ownership was dominant. They accounted for 62.5% of the assets of "pioneer" firm in 1966 and 55.4% in 1970.
CONTRIBUTION OF FOREIGN PIONEER FIRMS TO PIONEER ASSETS BY SUB-SECTOR
1966 and 1970 ($'000)
S E C i O R 1966 1970
Total Pioneer Assets
Foreign Pioneer Assets
% Total Pioneer Assets
Foreign Pioneer Assets
%
Food, Drink & Tobacco 36,729 34,779 94.7 47,560 41,589 87.4
Furniture & Wood 570 n.a n.a 866 n.a n.a
Paper, Printing etc. 3,343 2,976 89.0
8,948 8,055 90.0
Chemicals & Non Metallic Minerals
34,331 30,675 89.4
46,892 39,804
84.9
Metal Products & Machineiy 15,435 9,643 62.5
46,839 25,942 55.4
Source: Farrell (1979)
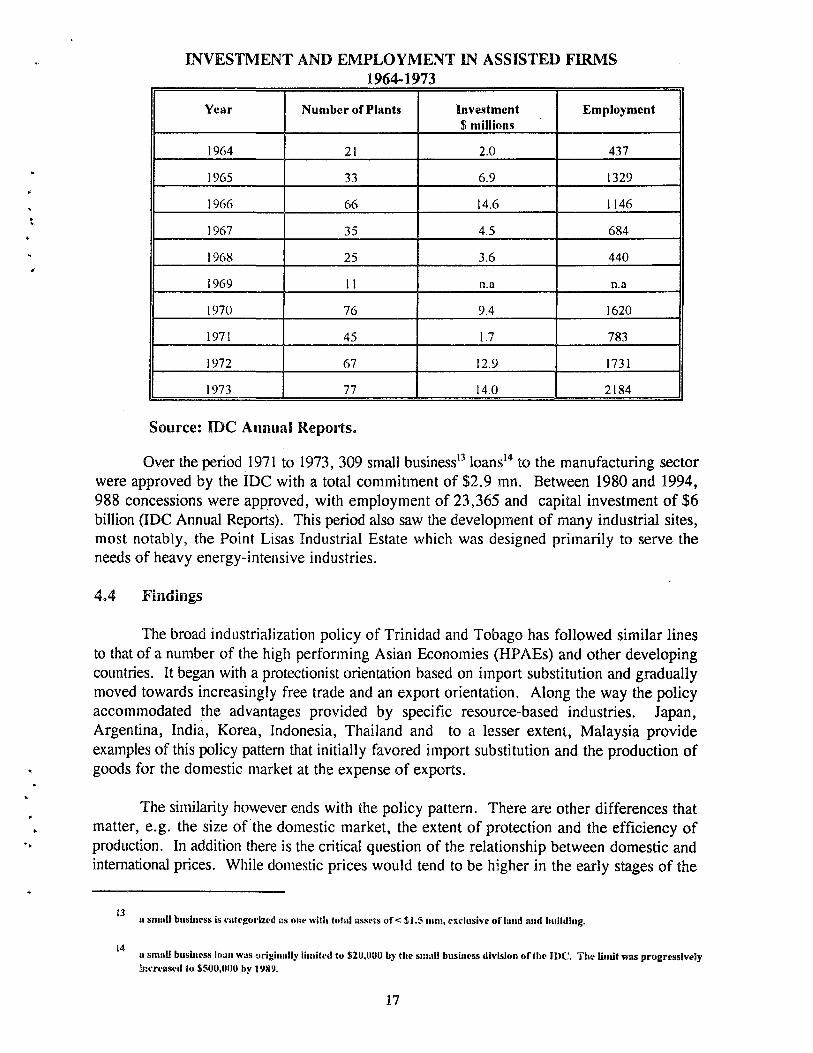
Other firms which were not classified as "pioneer" were assisted through import-duty concessions for equipment and raw materials. Between 1964 and 1973, 456 firms benefitted from their concessions. Investment and employment data for these "assisted" firms for the period 1964 to 1973 are presented below.
16
INVESTMENT AND EMPLOYMENT IN ASSISTED FIRMS 1964-15 >73
Year Number of Plants Investment S millions
Employment
1964 21 2.0 437
1965 33 6.9 1329
1966 66 14.6 1146
1967 35 4.5 684
1968 25 3.6 440
1969 11 n.a n.a
1970 76 9.4 1620
1971 45 1.7 783
1972 67 12.9 1731
1973 77 14.0 2184
Source: IDC Annual Reports.
Over the period 1971 to 1973, 309 small business'^ loans'" to the manufacturing sector were approved by the IDC with a total commitment of $2.9 mn. Between 1980 and 1994, 988 concessions were approved, with employment of 23,365 and capital investment of $6 billion (IDC Annual Reports). This period also saw the development of many industrial sites, most notably, the Point Lisas Industrial Estate which was designed primarily to serve the needs of heavy energy-intensive industries.
4.4 Findings
The broad industrialization policy of Trinidad and Tobago has followed similar lines to that of a number of the high performing Asian Economies (HPAEs) and other developing countries. It began with a protectionist orientation based on import substitution and gradually moved towards increasingly free trade and an export orientation. Along the way the policy accommodated the advantages provided by specific resource-based industries. Japan, Argentina, India, Korea, Indonesia, Thailand and to a lesser extent, Malaysia provide examples of this policy pattern that initially favored import substitution and the production of goods for the domestic market at the expense of exports.
The similarity however ends with the policy pattern. There are other differences that matter, e.g. the size of the domestic market, the extent of protection and the efficiency of production. In addition there is the critical question of the relationship between domestic and international prices. While domestic prices would tend to be higher in the early stages of the
13
14
a small business is categorizct! as one willi íoíal asseis of < $1.5 nun, exclusive of laud ami liiilliliiig.
a siiiaU business loan was originally limüed to $20,000 by ilie siiiail business division o f ihe IDC.'. The Uniit was progressively ñiicreaseil to $500,000 by 1989.
17

industrialization process outlined, in the HPAEs in particular, they were closer to international prices than other developing countries. A World Bank Research Report (1993) suggests one reason for this is that nominal tariff rates adjusted for the presence of non-tariff barriers are lower in the HPAEs than in most other developing countries. In such circumstances it is argued that competition begins at an earlier stage and the countries are better prepared for export expansion.
Of course a critical success factor in those countries is their superior export performance based on a greater trade orientation facilitated by the appropriate public policy measures. The HPAEs for example have a consistently higher ratio of total trade to GDP than the countries of sub-Saharan Africa, South Asia and Latin America and the Caribbean,
In the case of Trinidad and Tobago the data suggests that a manufacturing sector has emerged and grew, nurtured by a series of policy measures between 1950 and present. It is equally fair to conclude however that the industrialization strategy did not work as anticipated, particularly in terms of achieving the defined economic objectives. The analyses reveals a number of shortcomings in the sector. Five major shortcomings are discussed hereunder:
I) The strategy failed to transform the economy from its dependence on petroleum. By end-1994 the petroleum sector still maintained its position as the dominant productive sector with the greatest influence on economic activity. It accounted for 25% of real GDP, marginally down from 1968 when it accounted for 27%. It contributed approximately 25% to the current revenue of the central government and more than 50% to export earnings. Petroleum therefore, continues to have the greatest single impact on the fiscal and external balances;
ii) In an economy that is characterized as having a labor surplus, one of the objectives of industrialization is employment generation. The strategy however, was biased in facilitating the growth of more capital than a labor intensive industries. Incentives favored the establishment of heavy industries such as steel, cement and automobiles. In addition, the foreign investment component ensured the introduction of relatively more capital intensive and less easily transferable technologies. The available data shows that whereas between 1950 and 1975 the average investment per job was approximately $25,000 in "pioneer" industries, between 1980 and 1990, the average investment per job in firms in receipt of concessions was approximately $250,000;
iii) The import-substitution emphasis particularly on the early years, has limited the extent of backward linkages within the economy. In fact, over the years there has been no appreciable decrease in the percentage of raw materials and intermediate goods'"* (inputs into industry) in total imports. This was 19.1% in 1970, declined to 13.2% in 1980, (at a time when total imports rose
15 Excludes construction materials and fuel.
18
significantly on account of the increase in imports of construction materials) but by 1990 increased to 24.9%;
iv) While the strategy has given rise to an emergent set of exporting industries, only a few are competing in world markets. Trinidad and Tobago industry still suffers from a lack of marketing capability and inadequate product quality in particular. These weaknesses continue to hamper the entry of non-oil exports into important extra-CARICOM markets where demanding products and service standards are the norm;
v) At the micro level, because of market size and orientation, firms have not been able to achieve significant economies of scale in production, a vital pre-condition for competitiveness and export expansion. They tend therefore to be relatively less efficient producers. This is a self-reinforcing condition because unless there is a market re-orientation firms are trapped in a situation where they will never be able to achieve the significant economies of scale required to enable them to be internationally competitive.
Additionally the growth achieved through industrialization has tended to be neither self-sustaining nor consistent. Activity in the sector has been induced more by market interventions rather than by natural market forces. Once those interventions cease there is no real basis for the continuation of the related activities. The collapse of a number of "protected" activities as a result of trade liberalization and the closure of a number of "pioneer" and "assisted" firms upon expiration of their status is evidence of this.
19

S. ENVIRONMENTAL ANALYSIS
The relevant aspects of the environment for this study were identified as the domestic economy, international developments and national trading arrangements. These are analyzed in turn.
5.1 Domestic Economy
After a period of rapid economic growth in the 1970's, the domestic economy contracted sharply as it adjusted to reduced domestic oil production and the decline in the price of oil in the early 1980's. In response to the changed economic circumstances, the government initiated a number of measures to address the imbalances in the economy. These included a currency devaluations in 1985 and 1988, the introduction of a floating exchange rate in 1993, comprehensive tax reform programme; restructuring, divestment and liquidation of a number of State enterprises; relaxation of exchange control measures and reform and liberalization of the trade regime to enhance productive efficiency and international competitiveness.
The trade reform programme resulted in the virtual elimination of quantitative restrictions on non-petroleum manufactures and their replacement by a tariff based system. Tariffs have now become the main element of protection to local products. The rate of tariffs are to be reduced over time and by 1998, the maximum tariff on imports is expected to be 20 percent.
Overall the reform measures created a more liberalized, market-led economy and resulted in a resurgence of economic growth. In 1994 the domestic economy grew by 4%. This was led by the acceleration of activity in the petroleum and petrochemical sector and a slow recovery in the non-oil sector.
5.2 International Developments
Major international economic developments have a significant impact on the domestic economy. One such development is the globalization of the world economy and the emergence of mega-trading blocs. The latter serves as a counterpoint to the more dominant theme of global trade liberalization. The formation of EEC, NAFTA, ACS, MERCOSUR are manifestations of these trends. In addition, on 1 January 1995, the results of the Uruguay Round of Trade Agreements came into force. This, together with the restructuring of trade through World Trade Organization, will lead to an acceleration of the process of trade liberalization. Yet another significant development is the dismantling of Communism and the entry of countries from the former Communist bloc into the world trading system.
These global changes in trading arrangements and world trade have placed additional pressure on developing countries. They must become more efficient and competitive in export markets if they are to survive.
20

5.3 National Trading Arrangements
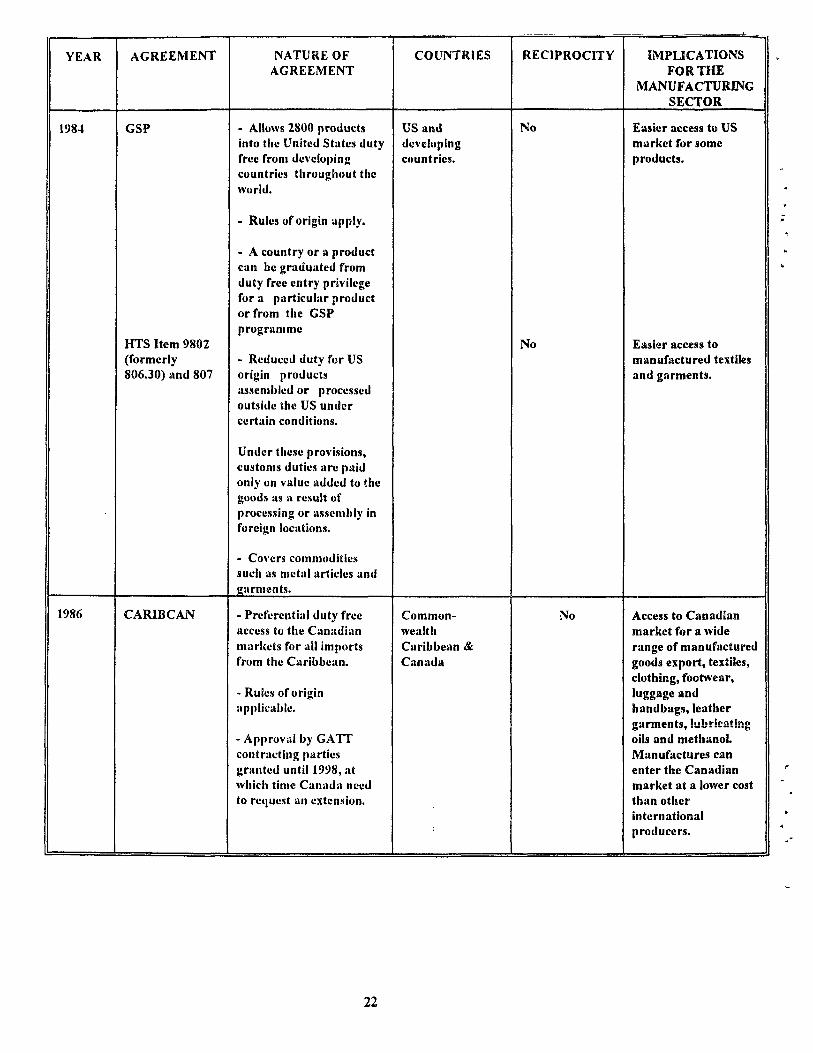
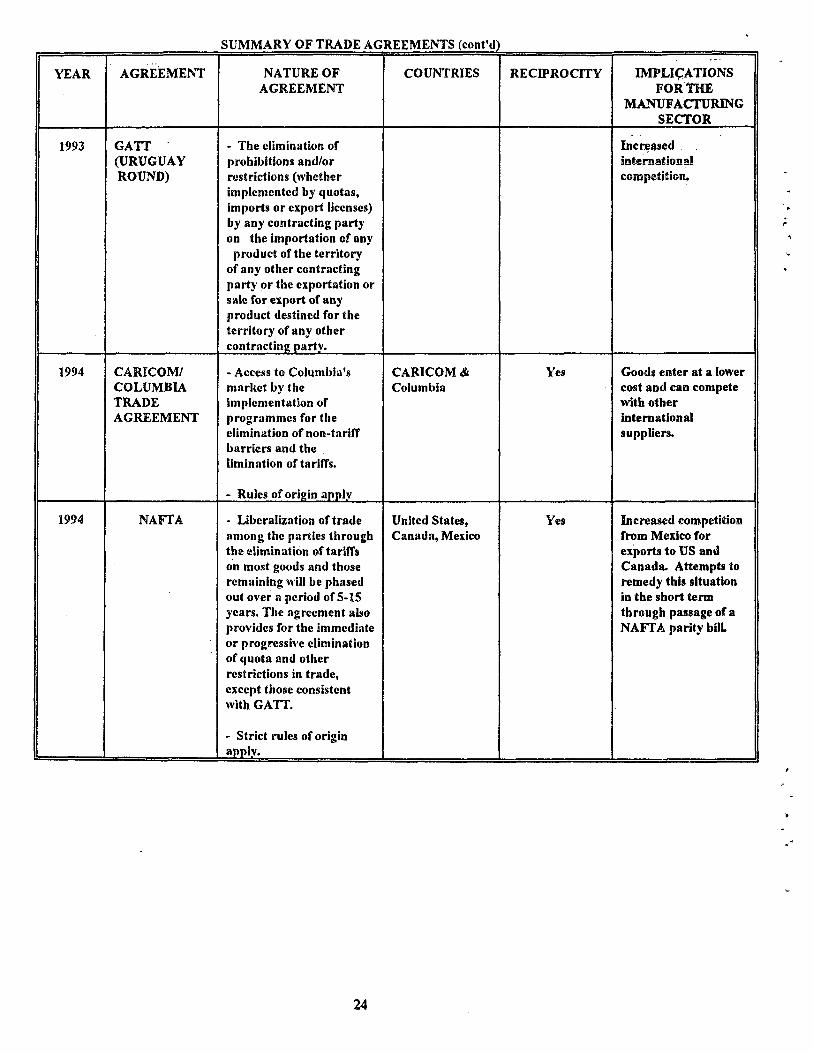
An integral part of the economic infrastructure of T&T is the bilateral and multilateral trading arrangements to which this country is a signatory. Many of these provide benefits to the manufacturing sector in terms of access to markets and can be used to expand exports or act as a buffer against the negative effects of some of the international developments referred to earlier. The following table provides a summary of the trade agreements. A brief description is presented of the access provided and the implications for the non-oil manufacturing sector arising from these agreements and NAFTA to which T&T is aspiring to be signatory.
Basically the agreements such as CARICOM and CBI provide easier access through lower duty to the respective markets for manufactured goods. Other arrangements such as GSP and a number of the bi-lateral agreements also provide duty free access to specific iteins. Entry to NAFTA will provide T&T manufactured goods with even greater access to the large North American market. This is seen as a major advantage in the pursuit of export expansion.
SUMMARY OF TRADE AGREEMENTS
YEAR AGREEMENT NATURE OF AGREEMENT
COUNTRIES RECIPROCITY IMPLICATIONS FOR THE
MANUFACTURING SECTOR
1973 CARICOM - Eliininatkm t>f import dutivs & (juantitativii; restrictions goods of menilivr countries. No export duties apply.
- Common external tariff to n»n-nieml)cr countries.
- Rules of origin apply
Barbados, Guyana, Jamaicii, Trinidad & Tobago, Antigua & Barbados, Belize, Dominica, Grenada, Montserrat, St. Kitts and Nevis, St. Lucia and St. Vincent and the Grenadines.
Yes Expansion of the domestic market. Manufactured goods enter the CARICOM market at a lower tariff. Therefore, these goods can compete with international exporters.
1984 CBI - Duty free entry to the US for a iiroad range of products from CBI beneficiary countries.
Caribbean basin countries (which includes Trinidad and Tobago) and
No With a few exceptions i.e textiles and garments, apparel, canned tuna.
- Strict rules of origin apply
the United States of America.
petroleum and petroleum products, foot^vear, leather and certain plastic items, manufactured goods can enter the US market at a lower cost than other international exporters.
SUMMARY OF TRADE AGREEMENTS (cont'd)
2i
YEAR AGREEMENT NATURE OF AGREEMENT
COUNTRIES RECIPROCITY IMPLICATIONS FOR THE
MANUFACTURING SECTOR
1984 GSP
HTS Item 9802 (formerly 806.30) and 807
- Allows 2800 products into the United States duty free from developing countries throuj>liout the world.
- Rules of origin apply.
- A country or a product can be graduated from duty free entry privilege for a particular product or from the GSP programme
- Reduccd duty for US origin products assembled or processed outside the US under certain conditions.
Under these provisions, customs duties arc paid only on value added to the goods as a result of processing or assembly in foreign locations.
- Covers commodities such as metal articles and garments.
US and developing countries.
No
No
Easier access to US market for some products.
Easier access to manufactured textiles and garments.
1986 CARIBCAN - Preferential duty free access to the Canadian markets for all imports from the Caribbean.
- Rules of origin applicable.
- Approval by GATT contracting parties granted until 1998, at which time Canada need to request an extension.
Common-wealth Caribbean & Canada
No Access to Canadian market for a wide range of manufactured goods export, textiles, clothing, footwear, luggage and handbags, leather garments, lubricating oils and methanol. Manufactures can enter the Canadian market at a lower cost than other international producers.
22

SUMMARY OF TRADE AGREEMENTS (cont'd)
YEAR AGREEMENT NATURE OF AGREEMENT
COUNTRIES RECIPROCITY IMPLICATIONS FOR THE
MANUFACTURING SECTOR
1989 TRINIDAD AND TOBAGO PARTIAL SCOPE AGREEMENT
- Granting of tariff prcfcrcnccs and the elimination or reduction of non-tariff barriers on a wide range of products.
- Ruics of origin appiy.
Trinidad and Tobago and Venezuela
Yes Access to the Venezuela market for a wide range of goods. These enter at a lower cost and can compete with other internationat suppliers.
1990 LOMEÍV - Duty free access and free of quantitative restrictions to the community for 99.2% of imports originating in the ACP.
- Spccial rum and banana protocol.
- Stabex - funds for the stabilization of export earnings.
- Hnancial and technical cooperation
Africa, Caribbean and Pacific and the European Economic Community
No Can compete with other international producers because goods enter market at a lower cost
1991 CARICOM/ VENEZUELA
- Duty free access to a wide range of products and a phased reduction of the duties applicable on others.
- Rules of origin appiy.
CARICOM & Venezuela
No. But parties agree that CARICOM wiU grant most ffavorednation treatment in the application of customs tariff in rcspect of all imports from Venezuela,
Can compete with other international producers because goods enter market at a lower cost.
23
SUMMARY OF TRADE AGREEMENTS (cont'd)
YEAR AGREEMENT NATURE OF AGREEMEW
COUNTRIES RECIPROCITY IMPLIÇATIONS FOR THE
MANUFACTURING SECTOR
1993 GATT (URUGUAY ROUND)
- The elimination of prohibitions and/or restrictions (whether implemented by quotas, imports or export licenses) by any contracting party on the importation of any
product of the territory of any other contracting party or the exportation or sale for export of any product destined for the territory of any other contracting party.
Increased international, competition.
1994 CARICOM/ COLUMBIA TRADE AGREEMENT
- Access to Columbia's market by the implementation of programmes for the elimination of non-tarifT barriers and the limination of tariffs.
- Rules of origin apply
CARICOM & Columbia
Yes Goods enter at a lower cost and can compete with other international suppliers.
1994 NAFTA - Liberalization of trade among the parties through the elimination of tariffs on most goods and those remaining will be phased out over a period of S-IS years. The agreement also provides for the immediate or progressive elimination of quota and other restrictions in trade, except those consistent with GATT.
- Strict rules of origin apply.
United States, Canada, Mexico
Yes Increased competition from Mexico for exports to US and Canada. Attempts to remedy this situation in the short term through passage of a NAFTA parity bill
24

5.4 Institutional Frameworic
The established institutional structure displays a wide spectrum of agencies empowered to discharge various duties and responsibilities related to industrial sector development in general, and non-traditional export promotion in particular. Prior to the establishment of the Tourism industrial Development Company (TIDCO) in 1994, the primary agencies were the Export Development Corporation (EDC) and the Industrial Development Corporation (ÍDC). in addition, there is the Ministry of Industry Enterprise and Tourism, the Export Credit Insurance (EXCICO), Development Finance Limited (DFL) formerly the Development Finance Company (DFC), and administrative and regulatory agencies such as the Customs and Excise Division and the Central Bank.
Industrial promotion in general and the implementation of industrial policy was, for over three decades, concentrated in the IDC. It administered the complex incentive regime, developed industrial estates and provided loans to small investors. Subsequently, two commercially oriented agencies were establishment to promote investment and export, the EDC and DFC.
The EDC provided a range of services to support the development of non-traditional exports including the certification of exporters and discriminating marketing information. The DFC provided medium to long financing to emerging industrial enterprises.
Other institutions are:
e The Free Zone Company (FZC) which is responsible for promoting and regulating duty free zones for export industries;
® The Bureau of Standards (TTBS) and the Caribbean Industrial Research Institute (CARIRI) which undertake quality certification, testing and research;
• The Institute of Business (lOB) at the University of the West Indies (UWI), St. Augustine and ROYTEC offer management education and technical training respectively.
Under the programme for the rationalization of public sector institutions which support the country's development thrust, the DFC was privatized and transformed into the DFL. The IDC and EDC were wound up and most of their functions absorbed in the newly created TIDCO. The responsibility for guaranteeing loans and providing technical assistance to small investors was entrusted to the Small Business Development Company Limited (SBDC) which was established in 1990.
5.5 Economic Outlook
The economic outlook for Trinidad and Tobago is conditioned by the Government's Medium Term Policy Framework (MTPF): 1995-1997. The medium term policy agenda has as its key elements:
25

• continuing fiscal discipline supplemented by appropriate monetary and financial policies
® intensified reliance on the private sector for incremental investment and growth; and
• the promotion of the export sector as the primary source of growth and employment.
Real GDP which grew by 4% in 1994 is targeted to increase by 2.2% in 1995, 2.5% in 1996, and 3.1% in 1997. This growth is based on a continued expansion in real output in the petroleum and petrochemical sectors and a substantial strengthening of the recovery of the non-oil sector. The latter is projected to expand by 3.1 % over the medium term. This is based on the implementation of a mix of policy measures led by the liberalization of the trade and foreign exchange regimes.
Notwithstanding the anticipated increase in imports associated with the expansion in economic activity, the trade balance is expected to remain in surplus. The external current account is also expected to show surpluses between 1.1% and 1.9%. And, net official international reserves are projected to increase from US$261.9 at end - 1994 to US$504 by end - 1997. The gross official reserves are projected to increase from US$354.4 mn at end - 1994 to US$496.8 mn by end -1997. This will result in an increase from approximately 2.7 months import cover at end - 1994 to 3.1 months cover by end 1997.
At the policy level, the complete liberalization of the trade and foreign exchange regimes will continue to be the major pillars of Government's medium term trade reform programme. Complementary to the measures associated with those initiatives, Government will continue to promote trade and investment through the establishment of strategic relationships with major trading partners. These will be aimed specifically at encouraging foreign private sector investment, and access to external markets.
For the medium term therefore, while there will be continued reliance on the petroleum and petrochemical sectors, the Government is pursuing the policy initiatives that are expected to lead to the attainment of consistent growth in the non-oil sector. This is considered critical to the sustainable development of economy, leading to increased employment and greater self-reliance.
26

6. THE NEW PARADIGM AND ÍTS IMPLICATIONS FOR TRINIDAD & TOBAGO
Over the past four decades or so the non-oil manufacturing of T&T has "under-performed". The review of its performance points to an "effectiveness gap" which would only widen if it is not addressed properly and urgently and in conformance to the new paradigm for economic survival.
Policy makers over the years have identified a critical role for the sector in the processes of economic development and sustainable development in Trinidad and Tobago. But, at the same time, the sector has faced a number of constraints to its effectiveness. Two major ones which can be identified are:
a) a lack of competitiveness; and
b) a lack of correspondence between the structures of international demand and the structures of production and export.
In the face of these, the prime task facing the sector is the transformation of its production structure by improving its competitiveness. It must strive to attain a high and rising level of productivity in the industries in which its firms compete. This is both the major challenge as well as an opportunity. Implicit in this task is that in the shorter term, at least, the desired path is to build on the base of existing production structures. The task of developing entirely new production structures is considered a longer term undertaking requiring investments in machinery and equipment. Put another way, the challenge is the development/transformation of a sector which responds to the emerging global and local contexts. We seek now to determine what is required to rise to that challenge.
"Picking winners" is a risky business, and we subscribe to the view, albeit disputed in some quarters, that there is no authority or body, public or private, capable of establishing production priorities a priori. Rather, the approach preferred here is to analyze and determine the conditioning factors of external and internal origins which will provide the largest windows of opportunities for manufacturing activities in general and which will build on the existing structures.
Open-economy strategies, such as those applicable to T&T, dictate that changing production patterns and growth potential are more associated with exports, with greater
27

emphasis on the development and spread of technology as a means for improving the position of local firms on the international market. In this context, a country's, and indeed a firm's, possibilities of entering and competing in international markets is largely determined by its ability to keep up with international trends in technology. In the case of T&T, we must also recognize that, because of the constraint of size, there is often one firm in the sub-sector.
Globalization and technical change abroad and, economic adjustment and a reorientation of economic development at home are leading inevitably to a reshaping of the structure of the manufacturing sectors of all nations. Globalization in particular, decouples the firm from the factor endowment of a single nation. Together with world trade trends, globalization and technical change are undermining the traditional forms of specialization and are creating new market opportunities for a number of commodities. In response to the intensification of international competitiveness, coupled with the development and growing dissemination of information technologies, the absorption of technical change has become a permanent and acceptable feature of a wide array of goods and services. And, what counts in the current competition between nations is the quality of the goods and services produced and the caliber of human resources involved in such production.
Commodity-based economies and products are tending to be less competitive and, as the importance of knowledge grows, there is a corresponding decline in competitive advantage based on natural resources, low wages and unskilled labor. The competitive advantages demanded by the world market today are based more on intelligence, technical change, innovation, and intellectual added value. Competitiveness therefore now depends not so much on comparative advantages in terms of wages or natural resources as on the quality of human resources and the capacity for the incorporation of technology. Competitiveness also recognizes the difference between basic factors of production which include natural resources, climate, location, unskilled and semi-skilled labor, and debt capital on the one hand, and on the other, advanced factors such as modem digital data communications infrastructure, highly educated personnel including graduate engineers and computer scientists and research institutes in sophisticated disciplines. These advanced factors which are built upon the basic factors are now the more significant ones for competitive advantage.
Competitiveness also requires the enabling environment of transparent competitive markets readily open to the various economic agents. And, in the particular case of manufactured consumer goods, these have also become "design-intensive" as an increasing use of information technologies is called for in their design, manufacturing and marketing. Indeed, as the parameters of industrial competitiveness evolve towards higher demands in terms of quality, design and satisfaction of clients' needs, exporters are increasingly faced with the need to produce goods at international levels of price and quality, and to comply with the rules of international competition.
So, for example, compliance with ISO 9000 for the European market and EN 29000 for the United States and Japan is a sine qua nou for exports to those countries.
28
Strategic business alliances between national firms and international leaders in technology or with access to large consumer markets is one means of gaining a better place in the international market. Alternatively, in order to be strategically placed relative to the market^ national firms may consider relocating either all or part of their production activity abroad. Major oil producing countries have long since adopted this strategy in respect of their refining operations. This approach begs the case for being able to compete successfully, through both exporting and foreign investment, in certain industries. Competing internationally may involve exports and/or locating some company activities abroad. The latter can entail shifting less productive activities to other nations or performing selected activities abroad (such as service or modifying the product to satisfy local needs) that support greater penetration of foreign markets.
Today, a decided advantage in production and export activity is also derived from the concept of networks. This occurs and is most efficient when activities form an integrated network or circuit of links comprising suppliers, production, transport, imports, distribution, marketing, financing, legal and other administrative and support services including R&D. The competitiveness of a product will depend on the efficiency of each of these links and the depth of the network which can comprise local and international components, and is extremely beneficial in the case of small and medium-sized enterprises (SMEs).
Small and medium-sized enterprises themselves pose exciting opportunities in the light of recent trends in the direction of the flexibility of the processes of production and smaller optimum scales of production particularly in high technology areas. A large number of industries are no longer scale-sensitive and small scale may well be an advantage now, making the marginality of supply by comparison with world demand theoretically a favorable factor. It may be of significant advantage to those who have or can develop favorable positions or niches in the market. SMEs generally speaking tend to be more dynamic from the standpoint of productive organization and technological than larger enterprises. There is ample evidence of large companies which have restructured by downsizing or right sizing. In simple terms many have moved from being large to medium or smaller sized enterprises to improve their competitiveness. In addition they represent an important sphere for dealing with the problem of unemployment and are more likely to develop internal production linkages.
The strengthening of linkages within the production system is another key aspect of the internal conditions which can contribute to improved competitiveness. The obvious links between agriculture and industry as well as between the natural resources, services and other sectors are essential building blocks in this regard and should be exploited.
The experience of a number of Latin American countries point to the fact that intermediate goods have a relatively greater capacity for competitiveness and in fact registered a more favorable performance in the 1980s. This sector is described as being
closer to the final consumer and profit margins tend to be larger and increasing vis a vis the consumer goods sector for example.
This is evidenced by the cases of Argentina, Brazil, Chile and Colombia where the exports of intermediate manufactured goods doubled between 1982 and 1990.
The well documented experiences of Latin America are equally instructive with regard to the evidence of elements in the environment of firms which have promoted innovation as part of their productivity and competitiveness strategies. Among the elements identified are: availability of natural resources, activities which were originally based on the use of natural resources but subsequently acquired their own level of competitiveness, problems typical of the region which call for specific technological solutions and the need to adapt international technological advances to the specific circumstances of Latin America.
The conditioning factors and experiences outlined above lead to certain strategic options for the non-oil manufacturing sector in T&T. Logically these can be classified into the shorter term survival options and the longer term transformation options. In the shorter term the obvious and over-riding concern is survival with increased market share being another key objective. In this limited time horizon the existing production structure will be the base for improved competitiveness mainly through higher productivity and lower cost at the enterprise level. In order to achieve this there must be partial innovation through adaptation in the production and organization of work leading to a rationalization and more intensive use of the factors of production.
In the longer terin the considerations are different and have implications at the enterprise and sector levels. Here the major concern is the transformation of the production structure to one that is consistent with the structure of international demand, for example to satisfy the demand for imports required for the manufacture of fibers, the new ceramic materials, plastics, etc. The emphasis will shift towards adding new export products and exploring new markets. It may result in a change in the sectoral structure of production through investment in machinery and equipment and technological innovation. The product slate must be biased towards the higher- valued knowledge-based products or those that can satisfy niche markets. In other words firms must gear themselves to choose a position within an industry and develop a sustained! com.petitive advantage relative to their competitors.
These are the basic requirements for the future survival of the non-oil manufacturing sector of T&T. Competitive exports for which there is an effective demand are likely to survive, the others may not. In terms of an over-riding mission, we conclude that firms must improve productivity in existing industries by raising product quality, adding desirable features, improving product technology, or boosting production efficiency. Then, they can move on to new and emerging products.
30

1,
APPENDICES

APPENDIX 1
STATISTICAL APPENDIX

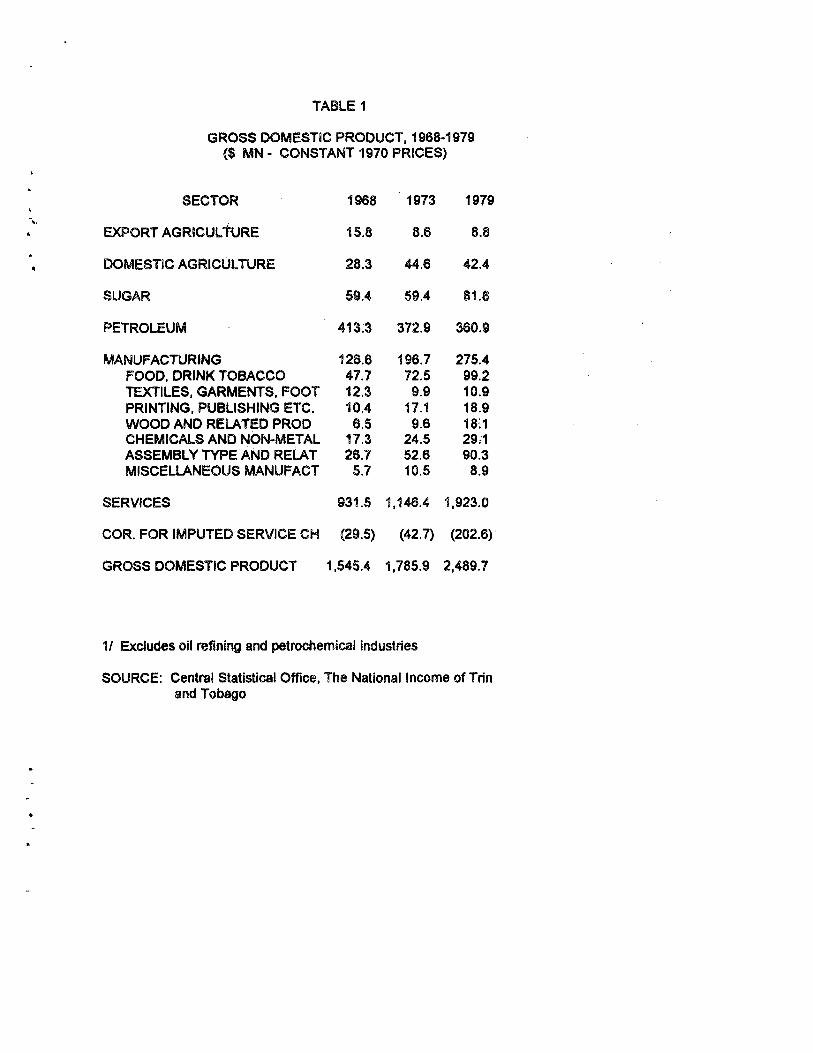
TABLE 1
GROSS DOMESTiC PRODUCT, 1968-1979 ($ MN - CONSTANT 1970 PRICES)
SECTOR 1968 1973 1979
EXPORT AGRlCULtURE 15.8 8.6 8.8
DOMESTIC AGRICULTURE 28.3 44.6 42.4
SUGAR 59.4 59.4 81.8
PETROLEUM 413.3 372.9 360.9
MANUFACTURING 128.6 196.7 275.4 FOOD, DRINK TOBACCO 47.7 72.5 99.2 TEXTILES, GARMENTS, FOOT 12.3 9.9 10.9 PRINTING, PUBLISHING ETC. 10.4 17.1 18.9 WOOD AND RELATED PROD 6.5 9.6 18:1 CHEMICALS AND NON-METAL 17.3 24.5 29:1 ASSEMBLY TYPE AND RELAT 26.7 52.6 90.3 MISCELLANEOUS MANUFACT 5.7 10.5 8.9
SERVICES 931.5 1,146.4 1,923.0
COR. FOR IMPUTED SERVICE CH (29.5) (42.7) (202.6)
GROSS DOMESTIC PRODUCT 1,545.4 1,785.9 2,489.7
1/ Excludes oil refining and petrochemical industries
SOURCE: Central Statistical Office, The National Income of Trin and Tobago
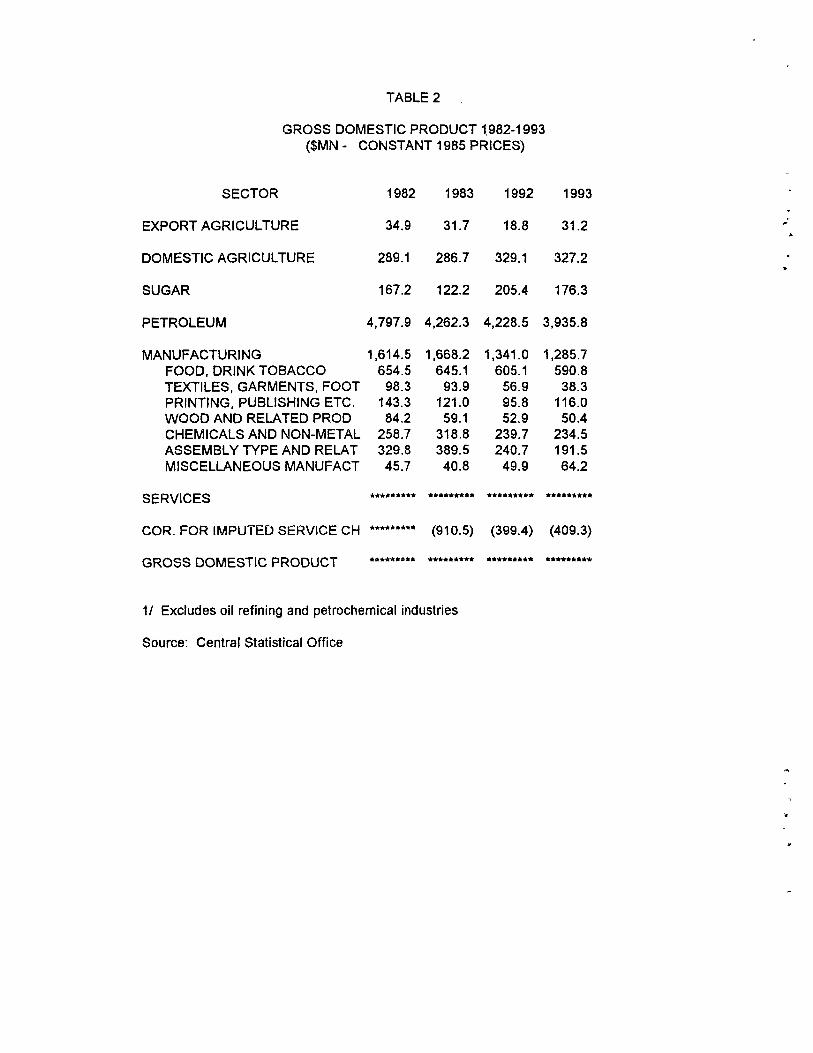
TABLE 2
GROSS DOMESTIC PRODUCT 1982-1993 ($MN - CONSTANT 1985 PRICES)
SECTOR 1982 1983 1992 1993
EXPORT AGRICULTURE 34.9 31.7 18.8 31.2
DOMESTIC AGRICULTURE 289.1 286.7 329.1 327.2
SUGAR 167.2 122.2 205.4 176.3
PETROLEUM 4,797.9 4,262.3 4,228.5 3,935.8
MANUFACTURING 1,614.5 1,668.2 1,341.0 1,285.7 FOOD, DRINK TOBACCO 654.5 645.1 605.1 590.8 TEXTILES, GARMENTS, FOOT 98.3 93.9 56.9 38.3 PRINTING, PUBLISHING ETC. 143.3 121.0 95.8 116.0 WOOD AND RELATED PROD 84.2 59.1 52.9 50.4 CHEMICALS AND NON-METAL 258.7 318.8 239.7 234.5 ASSEMBLY TYPE AND RELAT 329.8 389.5 240.7 191.5 MISCELLANEOUS MANUFACT 45.7 40.8 49.9 64.2
SERVICES * * * * * * * * * * * * * * * * * * * * * * * * * * *
COR. FOR IMPUTED SERVICE CH (910.5) (399.4) (409.3)
GROSS DOMESTIC PRODUCT * * * * * * * * * * * * * * * * * * * * * * * * * * * * * * * * * * * *
1/ Excludes oil refining and petrochemical industries
Source: Central Statistical Office
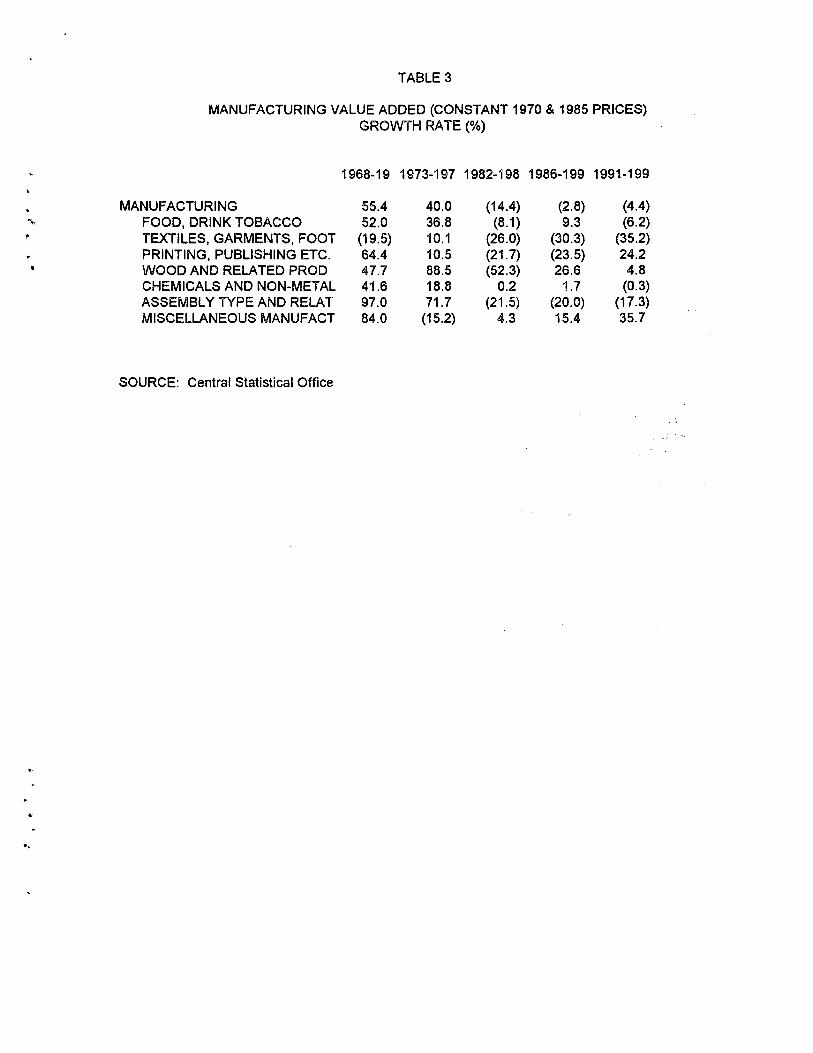
TABLE 3
MANUFACTURING VALUE ADDED (CONSTANT 1970 & 1985 PRICES) GROWTH RATE (%)
1968-19 1973-197 1982-198 1986-199 1991-199
% MANUFACTURING 55.4 40.0 (14.4) (2.8) (4.4) FOOD, DRINK TOBACCO 52.0 36.8 (8.1) 9.3 (6.2)
# TEXTILES, GARMENTS, FOOT (19.5) 10.1 (26.0) (30.3) (35.2) PRINTING, PUBLISHING ETC. 64.4 10.5 (21.7) (23.5) 24.2
« WOOD AND RELATED PROD 47.7 88.5 (52.3) 26.6 4.8 CHEMICALS AND NON-METAL 41.6 18.8 0.2 1.7 (0.3) ASSEMBLY TYPE AND RELAT 97.0 71.7 (21.5) (20.0) (17.3) MISCELLANEOUS MANUFACT 84.0 (15.2) 4.3 15.4 35.7
SOURCE: Central Statistical Office
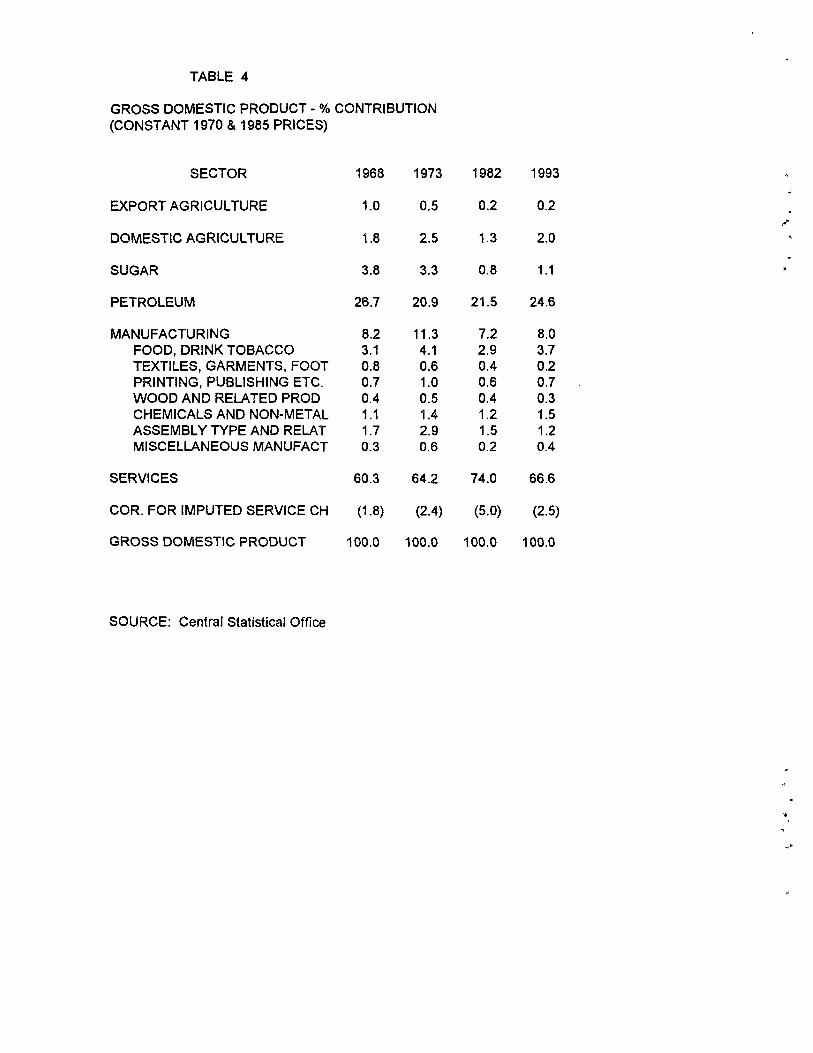
TABLE 4
GROSS DOMESTIC PRODUCT - % CONTRIBUTION (CONSTANT 1970 & 1985 PRICES)
SECTOR 1968 1973 1982 1993
EXPORT AGRICULTURE 1.0 0.5 0.2 0.2
DOMESTIC AGRICULTURE 1.8 2.5 1.3 2.0
SUGAR 3.8 3.3 0.8 1.1
PETROLEUM 26.7 20.9 21.5 24.6
MANUFACTURING 8.2 11.3 7.2 8.0 FOOD, DRINK TOBACCO 3.1 4.1 2.9 3.7 TEXTILES, GARMENTS, FOOT 0.8 0.6 0.4 0.2 PRINTING, PUBLISHING ETC. 0.7 1.0 0.6 0.7 WOOD AND RELATED PROD 0.4 0.5 0.4 0.3 CHEMICALS AND NON-METAL 1.1 1.4 1.2 1.5 ASSEMBLY TYPE AND RELAT 1.7 2.9 1.5 1.2 MISCELLANEOUS MANUFACT 0.3 0.6 0.2 0.4
SERVICES 60.3 64.2 74.0 66.6
COR. FOR IMPUTED SERVICE CH (1.8) (2.4) (5.0) (2.5)
GROSS DOMESTIC PRODUCT 100.0 100.0 100.0 100.0
SOURCE: Central Statistical Office
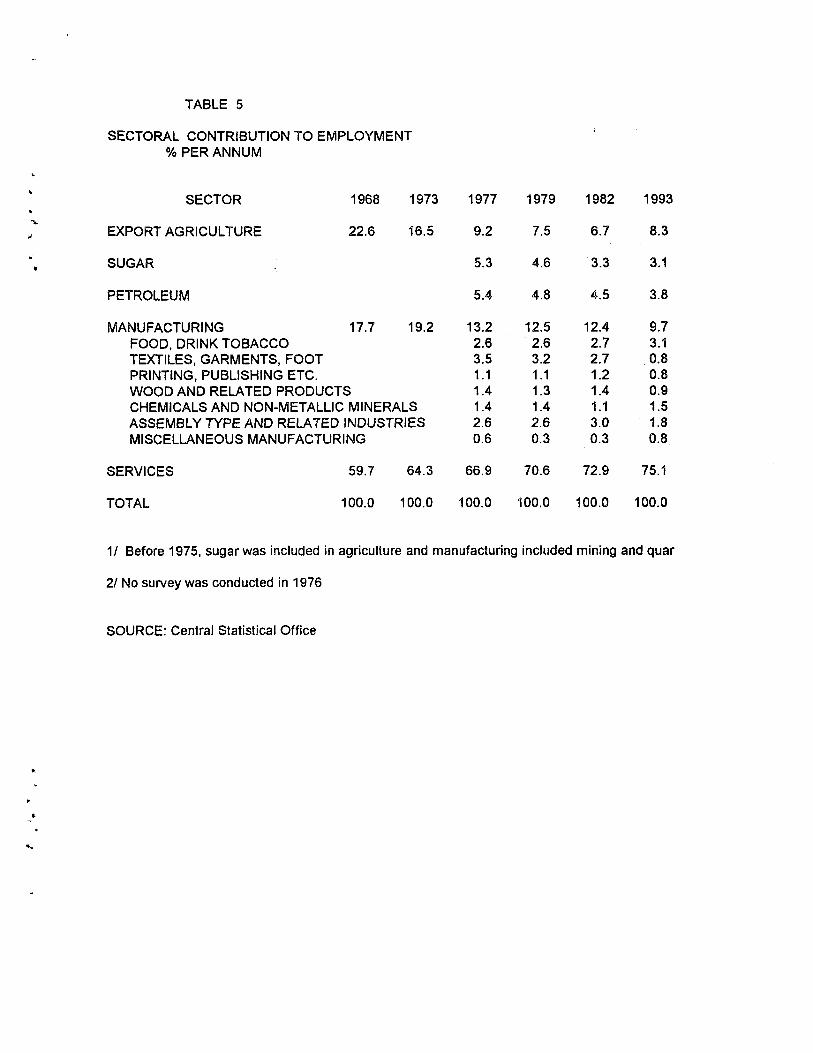
TABLE 5
SECTORAL CONTRIBUTION TO EMPLOYMENT % PER ANNUM
SECTOR 1968 1973 1977 1979 1982 1993
EXPORT AGRICULTURE 22.6 16.5 9.2 7.5 6.7 8.3
SUGAR 5.3 4.6 3.3 3.1
PETROLEUM 5.4 4,8 4.5 3.8
MANUFACTURING 17.7 19.2 13.2 12.5 12.4 9.7 FOOD. DRINK TOBACCO 2.6 2.6 2.7 3.1 TEXTILES, GARMENTS, FOOT 3.5 3.2 2.7 0.8 PRINTING, PUBLISHING ETC. 1.1 1.1 1.2 0.8 WOOD AND RELATED PRODUCTS 1.4 1.3 1.4 0.9 CHEMICALS AND NON-METALLIC MINERALS 1.4 1.4 1.1 1.5 ASSEMBLY TYPE AND RELATED INDUSTRIES 2.6 2.6 3.0 1.8 MISCELLANEOUS MANUFACTURING 0.6 0.3 0.3 0.8
SERVICES 59.7 64.3 66.9 70.6 72.9 75.1
TOTAL 100.0 100.0 100.0 100.0 100.0 100.0
1/ Before 1975, sugar was included in agriculture and manufacturing included mining and quar
2/ No survey was conducted in 1976
SOURCE: Central Statistical Office

TABLE 6
MANUFACTURING EXPORTS - % contribution
Section 1976.0 1982.0 1992.0 1993.0
0 Food 7.2 2.3 4.7 5.7 1 Beverage & Tobacco 0.7 0.5 1.4 1.9 2 Crude Material 0.3 0.2 0.2 0.2 3 Mineral Fuels 1/ 81.0 84.4 64.2 57.6 4 Oils & Fats 0.1 0.0 0.1 0.2 5 Chemicals 5.7 6.4 15.3 16.9 6 Manufactured Goods(wood,texti 1.3 2.1 10.9 12.6 7 Machinery & Transport Equip. 2.1 3.4 1.2 2.8 8 Misc. Manufactured goods 1.5 0.5 1.9 2.0 9 Misc. Transactions & Commodi 0.1 0.2 0.1 0.1 TOTAL ( 5- 8) 10.6 12.4 29.3 34.4 TOTAL ( 0- 9) 100.0 100.0 100.0 100.0
1/EXCLUDES UP.A
SOURCE: Central Statistical Office
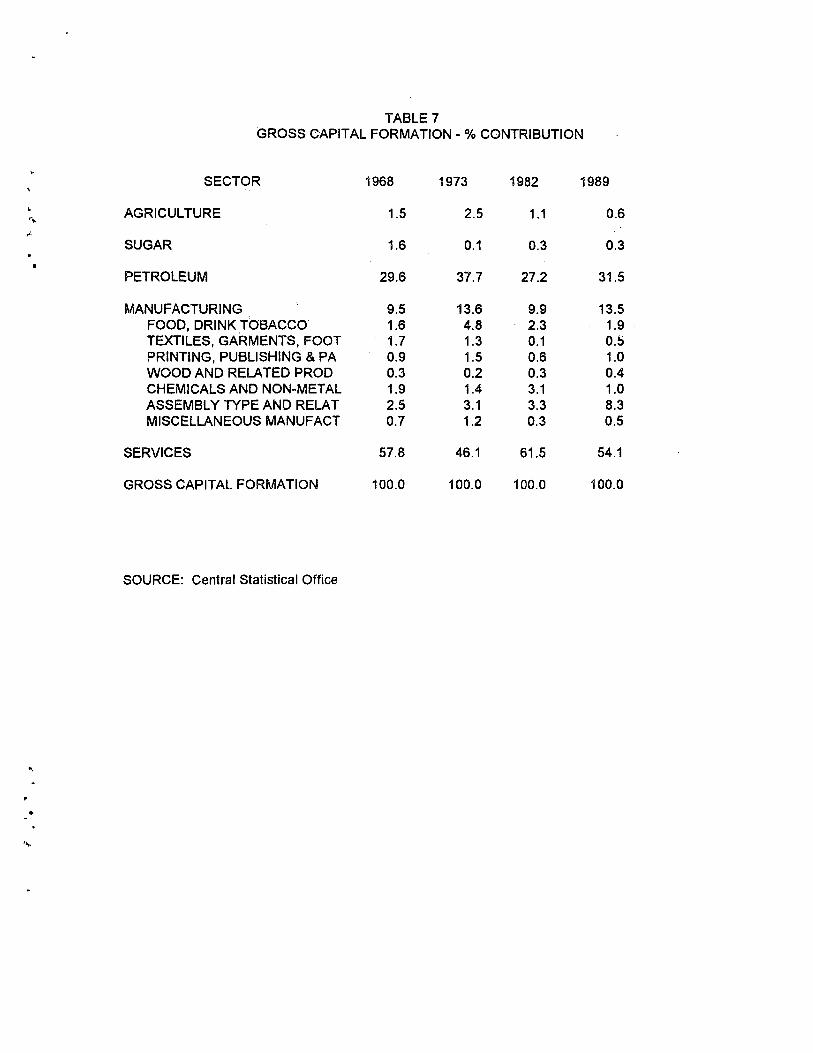
TABLE 7 GROSS CAPITAL FORMATION - % CONTRIBUTION
SECTOR 1968 1973 1982 1989
AGRICULTURE 1.5 2.5 1.1 0.6
SUGAR 1.6 0.1 0.3 0.3
PETROLEUM 29.6 37.7 27.2 31.5
MANUFACTURING 9.5 13.6 9.9 13.5 FOOD, DRINK TOBACCO 1.6 4.8 2.3 1.9 TEXTILES, GARMENTS, FOOT 1.7 1.3 0.1 0.5 PRINTING, PUBLISHING & PA 0.9 1.5 0.6 1.0 WOOD AND RELATED PROD 0.3 0.2 0.3 0.4 CHEMICALS AND NON-METAL 1.9 1.4 3.1 1.0 ASSEMBLY TYPE AND RELAT 2.5 3.1 3.3 8.3 MISCELLANEOUS MANUFACT 0.7 1.2 0.3 0.5
SERVICES 57.8 46.1 61.5 54.1
GROSS CAPITAL FORMATION 100.0 100.0 100.0 100.0
SOURCE: Central Statistical Office
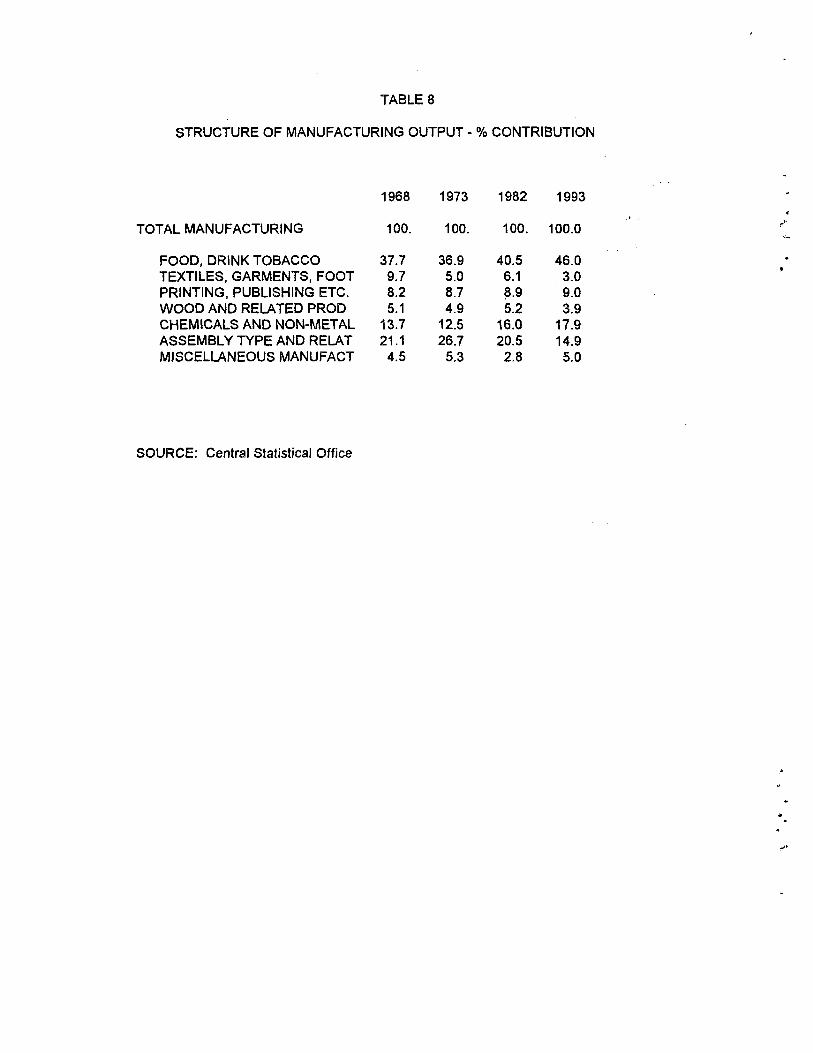
TABLE 8
STRUCTURE OF MANUFACTURING OUTPUT - % CONTRIBUTION
1968 1973 1982 1993
TOTAL MANUFACTURING 100. 100. 100. 100.0
FOOD, DRINK TOBACCO 37.7 36.9 40.5 46.0 TEXTILES, GARMENTS, FOOT 9.7 5.0 6.1 3.0 PRINTING, PUBLISHING ETC. 8.2 8.7 8.9 9.0 WOOD AND RELATED PROD 5.1 4.9 5.2 3.9 CHEMICALS AND NON-METAL 13.7 12.5 16.0 17.9 ASSEMBLY TYPE AND RELAT 21.1 26.7 20.5 14.9 MISCELLANEOUS MANUFACT 4.5 5.3 2.8 5.0
rf
SOURCE: Central Statistical Office
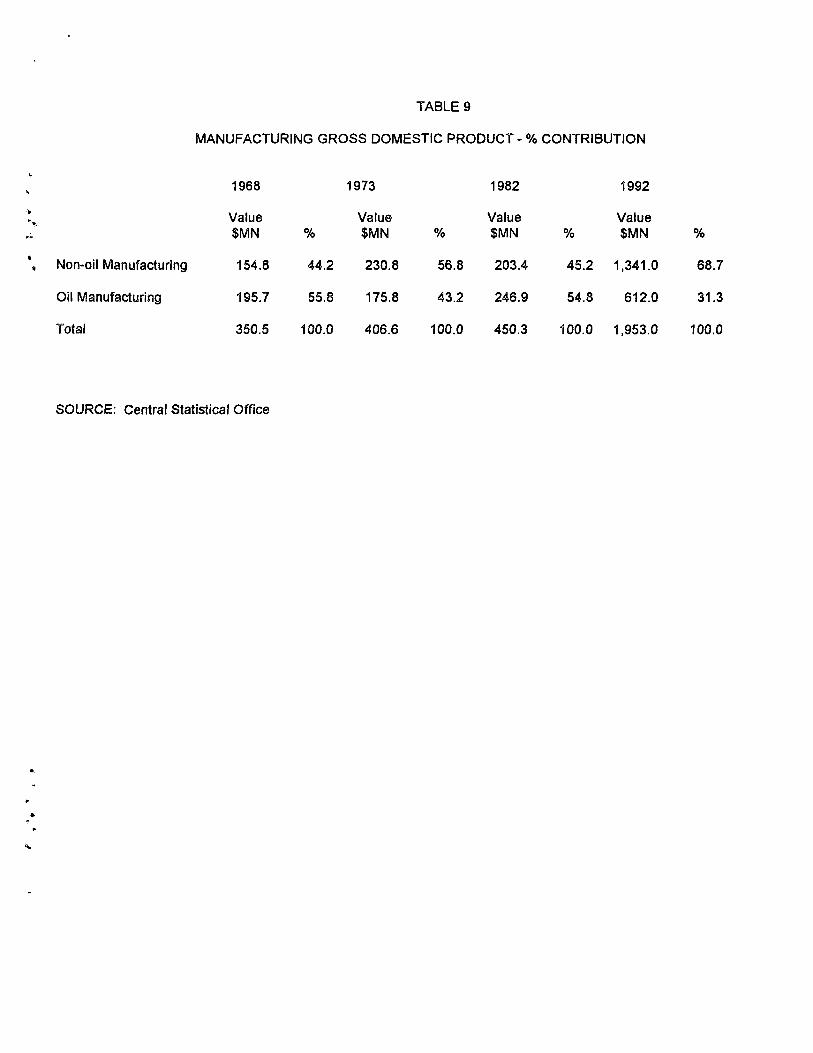
TABLE 9
MANUFACTURING GROSS DOMESTIC PRODUCT - % CONTRIBUTION
V 1968 1973 1982 1992
> Value Value Value Value $MN % $MN % $MN % $MN %
*, Non-oil Manufacturing 154.8 44.2 230.8 56.8 203.4 45.2 1,341.0 68.7
Oil Manufacturing 195.7 55.8 175.8 43.2 246.9 54.8 612.0 31.3
Total 350.5 100.0 406.6 100.0 450.3 100.0 1,953.0 100.0
SOURCE: Central Statistical Office

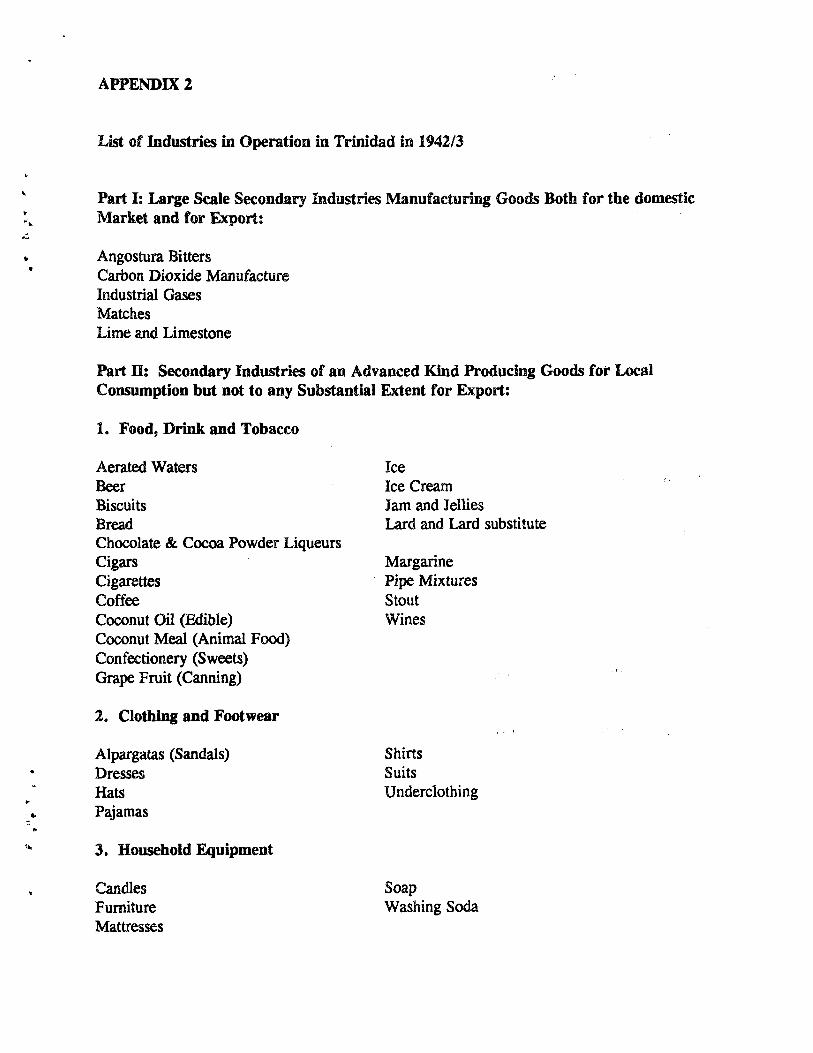
APPENDIX 2
List of Industries in Operation in Trinidad in 1942/3
Part I: Large Scale Secondary Industries Manufacturing Goods Both for the domestic Market and for Export:
Angostura Bitters Carbon Dioxide Manufacture Industrial Gases Matches Lime and Limestone
Part II: Secondary Industries of an Advanced Kind Producing Goods for Local Consumption but not to any Substantia! Extent for Export:
lo Food, Drink and Tobacco
Aerated Waters Beer Biscuits Bread Chocolate & Cocoa Powder Liqueurs Cigars Cigarettes Coffee Coconut Oil (Edible) Coconut Meal (Animal Food) Confectionery (Sweets) Grape Fruit (Canning)
2. Clothing and Footwear
Ice Ice Cream Jam and Jellies Lard and Lard substitute
Margarine Pipe Mixtures Stout Wines
Alpargatas (Sandals) Dresses Hats Pajamas
3. Household Equipment
Shirts Suits Underclothing
Candles Furniture Mattresses
Soap Washing Soda
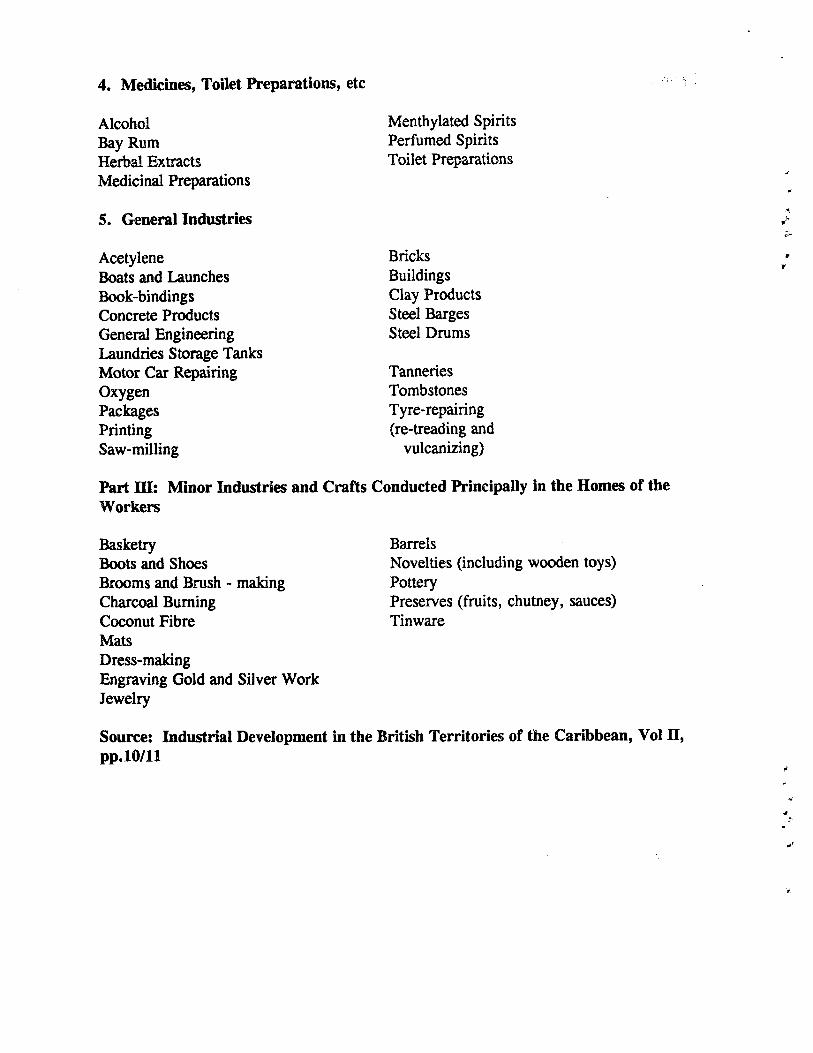
4. Medicines, Toilet Preparations, etc
Alcohol Bay Rum Herbal Extracts Medicinal Preparations
5. General Industries
Acetylene Boats and Launches Book-bindings Concrete Products General Engineering Laundries Storage Tanks Motor Car Repairing Oxygen Packages Printing Saw-milling
Menthylated Spirits Perfumed Spirits Toilet Preparations
Bricks Buildings Clay Products Steel Barges Steel Drums
Tanneries Tombstones Tyre-repairing (re-treading and
vulcanizing)
Part n i : Minor Industries and Crafts Conducted Principally in the Homes of the Workers
Barrels Novelties (including wooden toys) Pottery Preserves (fruits, chutney, sauces) Tinware
Basketry Boots and Shoes Brooms and Brush - making Charcoal Burning Coconut Fibre Mats Dress-making Engraving Gold and Silver Work Jewelry
Source: Industrial Development in the British Territories of the Caribbean, Vol H, pp.10/11
í.
(
APPENDIX 3
FaciHtating Institutions
The Industrial Development Corporation (IDC) was the government's principal agency established in law (1959) both to formulate industrial policy, as well as to stimulate, facilitate and undertake industrial development in the country. It identified, developed, and promoted industrial investment opportunities. The Corporation also managed the government's fiscal incentives to the Industrial and Tourism sectors. It was wound up in 1994.
Tlie Management Development and Productivity Center (MDC), originally called the Productivity Center,was developed with the assistance from UNDP/UNIDO. It began operation in 1965. Its main function was to promote productivity by providing training in management, public utilities and transport services etc., applying modern management techniques and providing up-to-date documentation on these and developing advisory and consultant services for industrial and other enterprises. It was wound up in 1994.
The Development Finance Corporation (DFC) was established in 1970 to take over the IDC's function of providing medium and long term finance for the development of industry and tourism. It provides both loan and equity for industrial (or hotel development) to local investors or joint-venture projects. In 1992 it was restructured into the DFL.
The Caribbean Industrial Research Institute (CARIRI) was established in 1970 with the assistance of UNDP under Act 19 of 1971. Its main mission was to:
• locate and transfer appropriate technology to Trinidad and Tobago industry; • provide laboratory -based consultancy and testing services; • provide product and process development
The Bureau of Standards (TTBS) was established under Act No. 38 of 1972. The Act articulates the Bureau's mission as follows: "To improve the quality of life in Trinidad and Tobago by ensuring that goods and services produced and/or used in the country satisfy criteria for good performance as established by the Bureau."

I
•t.
BIBLIOGRAPHY
Andic, Fuat. "Fiscal Incentives: Á Brief Survey": Social and Economic Studies: ISER, UWI -March 1968:
Best, L. "International Co-operation in the Industrialization Process - The Case of Trinidad and Tobago", in UNIDO: Industry 2Q00 - New Perspectivei: Collected Background Papers, Vol.6 1980: 153-299.
Boamah D. and Campbell T. "Some Analytical Issues Affecting International Competiveness in the Caribbean" Central Bank of Barbados 1992
Bobb, Euric. "Manufacturing Industry - Its Performance and Prospects". 1980.
De Castro, Steve. "Tax Holidays for Industry. Why we have to abolish them and how to do it": New World 8 (1973).
Farrell, Terrence W. "The Structure and Performance of the Manufacturing Industry in Trinidad and Tobago" PHD Thesis. University of Toronto, 1979.
Farrell, Terrence W. "An Assessment of the Macro-Economic Consequence of Trinidad and Tobago's Energy-Based Development Strategy". Paper presented at the Conference, EirsI National Energy Conference Trinidad and Tobago in the World of Energy. Claxton Bay, Trinidad and Tobago, 1993.
GATT Secretariat. The Results of the Uruguay Round of Multilateral Trade Negotiations. Geneva: GATT Secretariat, 1994.
Government of Trinidad and Tobago. First Five Year Plan, 1958 - 1962: Port of Spain: GOTT, 1958.
Government of Trinidad and Tobago: Second Five Year Plan, - 1964-1968: Port of Spain: GOTT, 1964.
Government of Trinidad and Tobago: Third Five Year Plan - 1969 - 1973: Port of Spain: GOTT, 1969.
Howard, Michael. "Industrialization and Trade Policy in Barbados": Social Economic Studies 10 (1) 1991: 53 -92 .
Lara, Vito. "The Perfonnance of the Industrial Sector". January 1988.
Lewis, W. A. "Industrialization of the British West Indies": Caribbean Economic Review 2(1) 1950.

Panagides, Stahis. "Manufacturing Development in a Small Country Economy: The case of Cyprus": Social and Economic Studies: ISER, UWI, 1968.
Pantin, D. "The Effects of the Trade Liberalization on the Manufacturing Sector". 1987. Photocopy.
Planning Associates Limited. Industrial Potential Survey in Trinidad and Tobago, Trinidad: Planning Associates Limited, 1986.
1
Porter, M. E. The Competitive Advantage of Nations. The Free Press: New York 1990. /
St. Cyr, Eric. "Industrial Development Strategies in the Caribbean": The Case of Trinidad and Tobago, Trinidad and Tobago Institute of the West Indies/UWI, St. Augustine, Trinidad and Tobago 1981.
UNECLAC: Changing Production Patterns With Social Equity. Santiago, Chile, 1990.
US Department of Commerce, Caribbean Basin Initiative - 1991 Guide books. US Department of Commerce, 1991.
United Nations Economic Commission for Latin America and the Caribbean (UN ECLAC). The North American Free Trade Agreement and the Question of Eligibility of Caribbean Countries. UN ECLAC, 1994.
World Bank. The Caribbean Common Market: Trade Policies and Regional Integration in the 1990s. Washington D.C.: Worid Bank, 1990.
World Bank. Business Expansion and Industrial Restructuring Project. Washington D.C.: World Bank, 1991.
World Bank. Trinidad and Tobago Policy Agenda for Sustained Development. Washington D.C.: World Bank, 1992.
Worid Bank Research Report. The East Asian Miracle: Economic Growth and Public Policy, Washington DC: World Bank, 1993.