a cross-cultural comparison of cell phone interface design
TRANSCRIPT

A Cross-Cultural Comparison of Cell Phone Interface Design Preferences from
the Perspective of Nationality and Disability
Ira Jhangiani
Thesis submitted to the Faculty of the Virginia Polytechnic Institute and State University
in partial fulfillment of the requirements for the degree of
Master of Science in
Industrial and Systems Engineering
Dr. Tonya L. Smith-Jackson, Chair Dr. Brian M. Kleiner, Member
Dr. Maury A. Nussbaum, Member Dr. Robert C. Williges, Member
August 31st 2006 Blacksburg, Virginia
Keywords: Cross-cultural studies, Disability culture, Cell phone interfaces, Product Interactive Focus groups, Design preferences
© 2006, Ira Jhangiani

A Cross-Cultural Comparison of Cell Phone Interface Design Preferences from the Perspective of Nationality and Disability
Ira Jhangiani
ABSTRACT
A cell phone is an electronic communication device that helps break down the distance
barriers between people, with added mobility advantages. For some users a cell phone is more than a communication device; it may be used as a fashion accessory, and for some the cell phone is needed to seek help in emergency situations. The cell phone market has been expanding globally over the past decade, with approximately 423 million sold globally in the year 2002 (Kiljander & Johanna, 2003). According to the CIA World Factbook (2006), the UK has more cell phones than people. The global expansion of cell phone companies may impose problems to cell phone users, since unlike the personal computer industry the cell phone industry has no standard interface, and manufacturers have the freedom to gradually improve the user interface (Kiljander & Johanna, 2003). For a user interface to be well accepted by a target population it is necessary to identify and explore the underlying design preferences. User interfaces of new technology may lead to anxiety and delayed technology acceptance, especially for users with disabilities. Even though the need for users participating in the design process has been realized, users with disabilities are not always included in the design process (Newell & Gregor, 2001). This study followed a participatory design process, to compare and contrast the cell phone interface design preferences of users from two different nations, including users with no apparent disability and users with visual disabilities.
A study was conducted to identify possible relationships between national culture, disability culture and design preferences of cell phone interfaces. The theoretical framework used to guide this study was Hofstede’s (1991) five dimensional cultural model. Various studies have explored cross-cultural interface design and found some relationship of these cultural dimensions with interface design components (Choi et. al., 2005; Marcus, 1999; Marcus and Gould, 2001).
This study included 13 product interactive focus groups, with a total of 69 participants, 34 in India and 35 in the United States, of the age group 19-50 years. There were 4 units of analyses in this research study. This included a control group of users without any apparent disability and a disability group with a visual disability of legal blindness. The two countries, India and the United States, were selected for this comparative study because of their diverse cultural backgrounds and the rapid expansion of cell phone usage which they are witnessing. The four units of analyses differed in their cultural dimensions. There were no significant correlations found on Design preferences of cell phone features based on Choi et at. (2005)’s study on mobile services with Hofstede (1990)’s cultural dimensions. However the relationships of some these features with the underlying cultural dimensions were found when group level analysis instead of the individual level of analysis was undertaken. Differences were also found in the ratings of the hardware attributes between disability groups and differences in usability ratings were found based on nationality and disability groups. The content analysis of the focus group sessions provided an insight to the preferences on cell phone interface components and the gave a better understanding of the mobile/cell phone culture in the two countries. These results are summarized to provide guidelines for designing cross-cultural user interfaces that are nationality specific and disability specific. A pyramid model for a holistic process of designing cell phones for users with disabilities integrated the findings of this thesis and Jordon (2002)’s pleasurability framework is proposed in the conclusion section of this thesis.

DEDICATION
I dedicate this thesis to my Family, my grandmother (Mrs. Vimla S. Jhangiani) my parents (Mr. Dilip Jhangiani and Mrs. Rita Jhangiani)
and my brother (Rohit Jhangiani).
My grandmother is my source of inspiration and my achievements today are due to the love, encouragement and support my family has given me.

iv
ACKNOWLEDGEMENTS
I extend my sincere acknowledgements and would like to thank my advisory committee, Dr. Smith-Jackson, Dr. Williges, Dr. Kleiner and Dr. Nussbaum for their guidance during this journey of my Masters thesis. I express my gratitude and appreciation, especially to Dr. Smith-Jackson for her patience, guidance, undeterred support and constant encouragement throughout my Masters Degree program. She has been a true professor, teacher, advisor and mentor to me and has instilled in me the love for the field of cultural ergonomics. I would like to extend my gratitude to Dr. Williges for his guidance, invaluable feedback and suggestions for my thesis work, as well as his service on my committee even after his retirement. I also would like to acknowledge Dr. Nussbaum for establishing my base in statistics and helping me design and refine my research for this thesis. I would also like to thank Dr. Kleiner for assisting me with my search for relevant literature and providing useful opinions about cross-cultural studies. I express my gratitude to Kei Tomioka from Toshiba Corporation for funding my Travel to India for data collection and providing the cell phones for my research. I also extend my appreciation to William Holbach and Hal Brackett from the Assistive Technologies Department for encouraging me throughout my thesis work and for sponsoring me for one year of graduate school. Special thanks to my parents: my father, for encouraging me to pursue graduate school and financially supporting me; my mother, for being involved at all the stages of my thesis work, from recruiting, data collection, transcription and proof-reading. The completion of my thesis would not have been successful without them. Also thank my brothers, Rohit and Kartik for all their help in scheduling and conducting focus groups in India. My sincere thanks to all the individuals who helped me in overcoming the challenge of recruiting the unique population for my study, by scheduling and organizing the focus groups sessions with participants with disabilities. I thank David Baquis, the Accessibility Specialist at the US Access Board in Washington DC, Kellie Hightower-Spruil, the Director of Community Outreach Raleigh Lions Clinic, Raleigh NC and Mr. Hemant Patil, the Rehabilitation Officer at the National Association of the Blind, Mumbai, India. I owe my thanks to my friends in Blacksburg, Darshan, Prakriti, George and Marshal; I appreciate all their help in conducting focus groups. I also would like to thank Arul for proofreading my thesis document and Young Seok Lee who has been helpful to me as a colleague. I also would like to thank my family of friends in the US. I thank Siddharth, for being my support system in the US, a source of inspiration and motivation throughout my thesis work, and also for playing a critical role in the data collection of my study. My roommates, Sampada and Nipa, for always being there for me when I needed them. My friends Vijayeta, Shweta, Karishma, Alok and Dipti for sharing the adventure of the exciting journey of studying abroad.
I also thank all the staff members from the ISE department, in particular Lovedia Cole and Teresa Coalson for their help in all the official formalities for my graduate degree. And last but not the least I express my gratitude to all the participants for their invaluable input for this research project.

v
TABLE OF CONTENTS
LIST OF FIGURES................................................................................................................VII
LIST OF TABLES .................................................................................................................VII
LIST OF APPENDICES ...................................................................................................... VIII
CHAPTER 1. INTRODUCTION ............................................................................................ 1 1.1 Background Information ................................................................................................1 1.2 Problem Statement .........................................................................................................3 1.2 Research Purpose ...........................................................................................................5
1.2.1 Primary purpose ......................................................................................................5 1.2.2 Secondary Purpose ..................................................................................................5
1.3 Research Questions ........................................................................................................ 5 1.4 Document Overview .......................................................................................................6
CHAPTER 2. LITERATURE REVIEW ................................................................................. 7 2.1 Product Design ...............................................................................................................7 2.2 User-Centered Design ....................................................................................................7
2.2.1 Accessibility and Usability.......................................................................................7 2.3 Design for All..................................................................................................................9 2.4 Globalization ................................................................................................................10
2.4.1 Culture and its Dimensions ...................................................................................11 2.4.2 Measuring Cultural Dimensions............................................................................14
2.5 Disability Culture .........................................................................................................17 2.5.1 Prevalence of Disabilities......................................................................................18 2.5.2 Disability Legislation ............................................................................................20 2.5.3 Design for People with Disabilities.......................................................................22 2.5.4 User Sensitive Inclusive Design.............................................................................23
2.6 Culture-Oriented Interface Design ................................................................................24 2.6.1 History of culture-oriented interface design..........................................................27 2.6.2 Mapping Cultural Dimensions to Interface Design...............................................28 2.6.3 Cross-Cultural Studies of Mobile Devices............................................................31 2.6.4 Cell Phone Interaction Research Model................................................................32 2.6.5 Cell Phone Interface Components..........................................................................33 2.6.5 Mapping interface components to cultural dimensions.........................................35
2.7 Choice of National Cultures ..........................................................................................40
CHAPTER 3. RESEARCH OBJECTIVE .............................................................................. 43
CHAPTER 4. METHODS ...................................................................................................... 45 4.1 Research Design............................................................................................................45
4.1.1. Context Variables..................................................................................................47 4.1.2 Control Variables ...................................................................................................47 4.1.3 Data Collection Method: Focus Groups.................................................................47 4.1.4 Sample Size Estimation........................................................................................48
4.2 Independent Variables..................................................................................................48 4.2.1 Disability Group....................................................................................................49 4.2.2 Nationality Group..................................................................................................49
4.3 Cell Phone Interface General Evaluation ......................................................................50

vi
4.3.1 Task Specific Evaluation.......................................................................................52 4.4 Dependent Variables .....................................................................................................54
4.4.1 Cultural Dimension Scores....................................................................................55 4.4.2 Cell Phone Interface Ratings.................................................................................55 4.4.3 Hardware Ratings..................................................................................................56 4.4.4 Post-Task Software Usability Ratings...................................................................58 4.4.5 Interface Design Preferences................................................................................59
4.5 Participants ...................................................................................................................59 4.5.1 Recruitment of Participants ...................................................................................60
4.6 Equipment and Apparatus ...........................................................................................60 4.7 Procedure for Data Collection.......................................................................................61
4.7.1 Procedure during the Product Interactive Focus Group .........................................62 4.8 Summarizing Independent and Dependent Variables ...................................................64 4.9 Revisiting Research Questions......................................................................................64 4.10 Cross-Cultural Research Methods and Data Analysis ...............................................66
4.10.1 Quantitative Data Analysis...................................................................................66 4.11 Qualitative Data Analysis...........................................................................................68
4.11.1 Data Analysis Techniques of Focus Groups ........................................................69
CHAPTER 5. DATA ANALYSIS AND RESULTS.............................................................. 75 5.1 Participant Demographics ...........................................................................................75 5.2 Primary Data Analysis and Results .............................................................................78
5.2.1 Data Analysis of Cultural Dimension Scores.........................................................80 5.2.2 Explanation of Differences in Cultural Dimension Scores ....................................85
5.3 Comparison of Cell Phone Hardware Ratings ..............................................................86 5.4 Comparison of Software Usability Ratings.................................................................92
5.4.1 Placing a Call ........................................................................................................94 5.4.2 Storing a Number ..................................................................................................94 5.4.3 Changing the Ringtone..........................................................................................96 5.4.4 Sending a Text Message........................................................................................98
5.5 Data Analysis of Cell Phone Interface Feature Ratings ................................................99 5.5.1 Relationship between Interface Ratings and Cultural Dimensions ......................102
5.6 Qualitative Data Analysis Results...............................................................................105 5.6.1 India Legally Blind Participants...........................................................................106 5.6.2 United States Legally Blind Participants .............................................................110 5.6.3 India Control Group .............................................................................................113 5.6.4 United States Control Group ................................................................................118
CHAPTER 6. DISCUSSIONS AND CONCLUSIONS ...................................................... 123 6.1 Research Questions Answered ....................................................................................123 6.2 Differences across the Legally Blind Disability Groups.............................................125 6.3 Differences between India and United States ............................................................126 6.4 Disability Culture Revisited ........................................................................................127 6.5 Limitations of the Current Study...............................................................................128 6.6 Guidelines for Cross-National Studies ........................................................................129
6.6.1 Technical Issues ...................................................................................................129 6.6.2 Recruitment of Participants ..................................................................................129
6.7 Guidelines for Studies including People with Disabilities.........................................130 6.8 Future Work ..............................................................................................................130 6.9 Proposed Research Model ...........................................................................................131

vii
REFERENCES...................................................................................................................... 135
LIST OF FIGURES
Figure 1 : Hofstede (1980; 1997) Dimension Scores for India and United States.............................15 Figure 2: A snapshot of a Western website: http://www.bbc.co.uk/..................................................25 Figure 3: A screen shot of an Arabic website http://news.bbc.co.uk/hi/arabic/news/........................26 Figure 4: Steps to Map UI to Cultural Dimensions............................................................................28 Figure 5: Interaction Phases of User’s Cognitive Activity ................................................................32 Figure 6: Research Model of Cell Phone Interaction with Interface Components ............................35 Figure 7: Data Matrix assigning participants to Independent Variables ............................................49 Figure 8: Startup menu of cell phone .................................................................................................50 Figure 9: Cell Phone Screen shot of Icons and Corresponding Labels ..............................................51 Figure 10: Screen shot of Cell phone Secondary Information ...........................................................51 Figure 11: Screen Shot of Cell Phone Interface Feedback.................................................................52 Figure 12: Procedure for Data Collection …………………………………………………………..62 Figure 13: Data Analysis Steps for Focus Group Transcripts............................................................70 Figure 14: Levels of Code in the Cell Phone Interface and corresponding Atlas.ti...........................72 Figure 15: Overview Grid format for focus group comparisons........................................................73 Figure 16: Overview Grid to Compare the Units of Analysis............................................................74 Figure 17: Cell Phone Model Owned by Users (in Percentages).......................................................77 Figure 18: Graph Showing the Mean Dimension scores for 4 cultural groups..................................82 Figure 19: Interaction effect of IDV Dimension index ......................................................................84 Figure 20: Graph of Mean Ratings of Cell Phone Hardware Attributes ............................................87 Figure 21: Graph Comparing Means Scores of Interface Ratings for Disability×Country Interaction Groups ..............................................................................................................................................101 Figure 22: Pyramid Model for Cell phone Design adopted from Jordon (2000) ............................132
LIST OF TABLES
Table 1: Critical mobile phone attributes that showed a correlation with cultural dimensions from Choi et al.,’s (2005) Study ...................................................................................................................4 Table 2: Summary of Hall’s (1973;1976) Constructs for Intercultural Communication ...................12 Table 3: Design Implications of Hofstede’s Cultural Dimensions ....................................................30 Table 4: Cell Phone User Interface Components ...............................................................................34 Table 5: Cell Phone features and correlated cultural dimensions ......................................................39 Table 6: Comparison Chart of United States and India Source: CIA-The World Fact Book (2005) 41 Table 7: Factor Levels and Types ......................................................................................................46 Table 8: Order of Tasks Used for Each Focus Group ........................................................................53 Table 9: Summary of Tasks with the Related Cultural Dimensions ..................................................54 Table 10: Summary of Mean Dimension Scores and Standard Error from VSM 94.........................55 Table 11: Summary of Mean Ratings and Standard Deviations of Interface Ratings .......................56 Table 12: Mean and Standard Deviations of Cell Phone Hardware Ratings .....................................57 Table 13: Summary of Independent and Dependent Measures..........................................................64 Table 14: Summary of the Focus Group Sessions Conducted ...........................................................75 Table 15: Summary of participant demographics ..............................................................................76

viii
Table 16: Internal consistency Reliabilities (coefficient alpha) for Five Hofstede’s VSM 94 dimensions..........................................................................................................................................79 Table 17: Summary of Dimension Scores and Standard Error of VSM 94 .......................................81 Table 18: Ranking of the Cultural Groups in terms of Dimension Scores ........................................81 Table 19: MANOVA results of Dimensions, Disability and Country Effects...................................82 Table 20: Summary of Significant effects of Cultural Dimensions with Disability and Country Sources ...............................................................................................................................................83 Table 21: Mean and Standard Deviations of Cell Phone Hardware Ratings .....................................88 Table 22: Summary of Mean Ratings and Standard Deviations of Interface Ratings .....................100 Table 23: ANOVA significant effects on the Mean Ratings of Cell phone Interface Features .......102 Table 24: Correlation Co-efficients of Cultural Dimensions with Interface Ratings ......................105
LIST OF APPENDICES
Appendix A: Value Survey Module 94 Questionnaire ....................................................................140 Appendix B: Demographic Questionnaire .......................................................................................145 Appendix C: Contact Information of Institutes/Agencies for the Visually Impaired ......................147 Appendix D: Action Sequences of Tasks.........................................................................................148 Appendix E: Interface Rating Questionnaire ...................................................................................150 Appendix F: INFORMED CONSENT FORM ................................................................................153 Appendix G: IRB Amendment.........................................................................................................156 Appendix H: Hardware Features......................................................................................................157 Appendix I: Software Usability Ratings ..........................................................................................160 Appendix J: Dimension scores of Combined Country and Disability groups ................................161 Appendix K: Summary of Overview Grids......................................................................................162

1
CHAPTER 1. INTRODUCTION
1.1 Background Information
The globalization trend of the industrial era has strengthened cross-cultural communication
among different nations (Rose, 2005). Globalization is the general process of worldwide economic,
political, technological and social integration as defined by the Localization Industry Primer
(Aykin, 2005). The primer mainly addresses the business issues associated with making a product
global. In the current international market, it is important to overcome the barriers of language and
culture, which have created boundaries across nations. Diverse audiences from different countries,
different disability groups, and different religions speak different languages, have different values
and beliefs and therefore have different perceptions and expectations from products. The current
trend of globalization has lead to wide diversity among users of the same product; therefore for a
product to be successful in the global market it must accommodate as much diversity as possible.
During the past decade there has been a consistent increase in the number of studies on cross-
cultural issues, encompassing similarities and differences between cultures. This increased interest
has been inspired by various factors such as the opening of previously sealed international borders,
large migration streams, the globalization of the economic market, international tourism, increased
cross-cultural communications and technological innovations such as new means of
communications (Vijver & Leung, 1997), particularly mobile technologies and the Internet.
Around the world, people are starved for contact and communication with friends and
family, a near-universal human trait that helps to explain the mobile phone’s popularity. Another
reason behind this popularity is that mobile phone services (and devices) are becoming more and
more reliable, extensive and affordable. Mobile phone technologies are now in the hands of almost
31% or 2 billion people (Motorola, 2006) of the 6.47 billion people on this planet (“Population
Reference Bureau Statistics”, 2006). The penetration of these technologies is increasing very
rapidly with around 779 million (“Gartner Press Release”, 2005) mobile phones sold every year and

2
expected to reach over 1 billion units per year sold by 2009. These numbers are a clear indicator of
the growth and reach of mobile phones. “India has a middle class that is larger than the population
of the United States. It is a booming market," according to Eric Miscoll, Chief Operating Officer
for EMS Industry Researcher Technology Forecasters (Carbone, 2005). The latest data from March
2006 indicates that India is the fastest growing mobile market in the world with over 5 million new
users added per month bringing the total to over 90 million users (“Telecom Regulatory Authority
of India Press Release”, 2006). However this represents only about 8% of India’s estimated total
population (“Population Reference Bureau Statistics”, 2006). The corresponding US data from
December 2005 shows that there are 207 million mobile users in the US (“CTIA Semi Annual
Wireless Industry Survey”, 2006).
A survey conducted by India's leading telecommunications magazine, Voice and Data,
found 45 million people owned mobile phones in India, compared with 44 million who had land
lines (Indian mobiles overtake land lines, 2004). According to another recent report from Telecom
Regulatory Authority of India (TRAI): India has about 44 million mobile connections and about 43
million landlines. By 2007, the country is slated to have 200 million phone connections of which,
about 150 million will be wireless. The rural market in India is also good business proposition for
cellular operators and handset manufacturers as the mobile phone penetration is very low in this
area (Gupta, 2005). Remote rural areas that have no source of telecommunication, which have been
previously skipped by the fixed line networks can be connected to the world with the penetration of
wireless mobile networks. The numbers of mobile phones are overtaking landline phones. They
already comprise about 43 percent of all U.S. phones, according to the International
Telecommunication Union, up from 37 percent in 2000. Meanwhile, the number of U.S. landline
phones has dropped by more than 5 million, or nearly 3 percent, since 2000, the Federal
Communications Commission reported in June (Carrol, 2003). India and the United States are
considered as mature or advanced markets for mobile phone usage because of their early adoption
of mobile services and the rapid increase in the number of users. Moreover, the size of the

3
population with disabilities in each of the countries is significantly large for any company that plans
to diversify to penetrate the global market.
In the early days of mobile phones, when they were used only to make and receive calls, the
design issues for the mobile phone interface were relatively very simple. Today, however, design
issues are far more complex, for example the small screen sizes of mobile phones can create
problems for users, in particular for users with disabilities. Therefore, there is a need for acceptable
user interfaces that enable a better, more enhanced use of the limited screen size and yet provide
high levels of usability. The evolution of mobile phones with the inclusion of functions such as text
messaging, e-mail, phonebooks have made it a complex device. Therefore designing this interface
has become a more challenging task. Design of mobile phones for people with disabilities has an
additional challenge.
According to estimates of the World Health Organization, there are 600 million people in
the world living with disabilities, that is around 10% of the world’s population (Jenkins, 2004).
Developing products for people with disabilities is a socially worthwhile activity since the provision
of a usable product can make enormous differences to the educational opportunities, quality of life
and employment possibilities for people with disabilities (Newell, 1995). Moreover, this population
can be considered as a target market for a company considering global expansion. This population
has special needs and requirements, which are not the same as the needs of people without
disabilities. The user-centered design approach has been modified and termed as User-Sensitive
Inclusive Design in order to include this population in the design and development of a product
(Newell & Gregor, 2001). This approach emphasizes that the designers need to pay special attention
to the ethical issues that arise when users with disabilities are included in the design process.
1.2 Problem Statement
Designing products for a global audience involves more than the mere translation of the
interface features. In fact, it requires a deeper understanding of the special needs of the target
cultures. Due to the rapid expansion of the mobile phone industry in India and the United States,

4
this study will focus on these two countries. There have been some studies that have concentrated
on the invisible influence of culture on the design of websites (Marcus, 1999). Some studies have
also incorporated the role of culture in mobile phone services (Choi et al., 2005). The study by
Choi et al. (2005) determined some attributes of mobile phone services using qualitative methods of
in-depth interviews in Korea, Japan, and Finland. Using a qualitative method, this study found 11
critical attributes of mobile data services that showed a clear correlation with characteristics of the
user’s culture. These attributes are summarized in Table 1.
Table 1: Critical mobile phone attributes that showed a correlation with cultural dimensions from Choi et al.,’s (2005) Study
Cell phone attribute
Minimal steps or key strokes Secondary information about contents
Variety of contents Logical ordering of menu items
Clear menu labeling Efficient layout or space usage
Variety of Font sizes Variety of Font colors
Large Amount of Information within a screen Various options for contents
Cell phones and mobile devices have different interface design challenges due to their
limited screen size and different input mechanism as compared to websites, which are mainly
viewed on larger (desktop or laptop) screens. These devices have different usability concerns as
well. Also a person with a disability has different concerns and needs compared to a person without
a disability. So in designing assistive technology for a global market it is important to include the
target population in the design process. This study is focused on comparing the design of cell
phone interfaces for different cultures, where culture may be defined by disability or nationality.
5
1.2 Research Purpose
This research study was grounded in the belief that culture is a discernible variable that
influences the usability and preferences of product interfaces. The aim of this research was to
identify the cultural influence on design preferences of a cell phone interface for users with visual
disabilities and no apparent disability.
1.2.1 Primary purpose
The main objective of this study was to identify the influence of national culture, which is
defined by cultural dimensions in the design of cell phone interfaces for users with and without
disabilities. The study also focused on the role of disability in the design preferences of cell phone
interfaces. This study compares and summarizes differences in cell phone interface design
preferences between two national cultures, India and United States also categorized on the basis of
disability.
1.2.2 Secondary Purpose
The secondary purpose of this research was to investigate whether culture, which is
currently defined by nations (as well as other factors), can also be defined by disability. Therefore
the comparison of interface design preferences was made across disability groups as well as
nationality groups.
1.3 Research Questions
This study was designed to answer the following questions:
• What are the differences in cultural values between users with (and without) disabilities
across the two countries? Do these differences justify the presence of a disability culture?
• Are preferences for interface design features driven more by a nationality culture, disability
culture or a blend of both?

6
• What are the differences between cultural groups in preferences of cell phone hardware
features and usability ratings of tasks?
• What are the bases of the differences in interface design preferences between nationality or
disability cultural groups?
1.4 Document Overview
The remaining body of this paper is divided into six main chapters – the literature review,
methodology, research objective, data analysis and results and discussion and conclusion,
respectively. The literature review section examines the current literature for information relevant
to this study. This chapter begins by exploring cultural dimensions and then applying these theories
to designing cell phone user interfaces. In the methods chapter of this paper, the research design for
the study is explained. The research design is followed by a description of the variables and
measurements, an overview of the participants, and a description of all of the materials and
equipment involved in this cross cultural study. The methodology chapter is concluded with a
detailed description of the procedures and data analysis techniques followed. Following the
methods chapter, the next chapter reports the results of hypotheses tested for the study. The results
are divided into quantitative data analysis and qualitative. After the results chapter, the discussion
and conclusion chapter provides a detailed description of the results and findings of this study.

7
CHAPTER 2. LITERATURE REVIEW
2.1 Product Design
Designing products to fit the target user population has always been a challenge for product
designers. The more complex the device, the greater is the design challenge to make the full range
of facilities accessible and usable to the widest possible user base (Benyon et al., 2001). Human
factors issues within product design are being taken increasingly seriously in the industry (Jordon,
2000). When users and customers are considered to be an integral part of the product design
process, different techniques such as user-centered design and participatory design have been
developed.
2.2 User-Centered Design
The User-Centered Design methodology enables product/interface developers to focus on
the users as the heart of the design process (Newell & Gregor, 2001). User involvement in the
design process results in products that are more likely to provide what the users need and want
(Oshlyyansky et al., 2004). This approach has been extensively used by usability engineers and
human factors engineers, and they emphasize the participation of the end users in the design
process. According to Smith-Jackson et al. (2003), to design for usability, accessibility and to apply
universal design designers must capture user-centered requirements to ensure that the product is
designed for the target group.
2.2.1 Accessibility and Usability
Accessibility is an umbrella term for all parameters that influence human functioning in the
environment, thus defining accessibility as an environmental quantity (Iwarsson & Stahl, 2003).
Providing accessibility means removing barriers that prevent people with disabilities from
participating in substantial life activities, including the use of services, products, and information.
With increasing attention to accessibility issues extensive research is focused on providing
more on accessible environments and products. The accessibility dimension in technology is

8
concerned with building information technology hardware, software and services in such a way that
they do not create barriers and exclude people from their use. A word often used in parallel with
accessibility is Usability (Iwarsson & Stahl, 2003). The concept of usability implies that a person
should be able to use (i.e. to move around), be in and use the environment on equal terms with other
people. Accessibility can be approached as a subset of usability. In the context of user interfaces,
Usability means designing an interface that is effective, efficient, and satisfying. According to
Nielson (1992), usability of a product is the extent to which a product is intuitive and easy to use.
The five main features of usability are:
• Learnability (ease-of learning)
• Efficiency (high productivity)
• Memorability (easy to remember procedures)
• Errors (low error rates)
• Satisfaction (Subjective satisfaction or pleasantness of product)
In this context of usability, accessibility means designing a user interface to be effective,
efficient, and satisfying for more people in more situations. However, satisfaction is much less an
issue with accessibility. Accessibility is more concerned with making interfaces perceivable,
operable, and understandable (Henry, 2002).
Accessibility is a necessary precondition for usability. However, usability is not based only
on compliance with official norms and standards; it is mainly subjective in nature taking into
account user evaluations and subjective expressions of the degree of usability (Henry, 2002).
Compliance with accessibility guidelines sometimes sidelines usability. Regulations have
contributed to improving accessibility of technology, and regulation compliance is becoming the
objective in designing products and interfaces for users with disabilities, even though usability must
be the most important objective for accessibility technologies (Takagi et al., 2004). Instead of
focusing only on the technical aspects of accessibility, it is important to recognize that usability is

9
also an important aspect of accessibility. If 'usable accessibility' is consciously addressed by
designers, it will help to clarify the difference between what meets minimum accessibility standards
and what is usable by people with disabilities (Henry, 2002).
2.3 Design for All
Design for All1, Design for Diversity (Gregor & Newell, 2001), Universal Design2 and
Inclusive Design are terms that are used interchangeably for designing to cater to the broadest
possible range of abilities, skills, requirements and preferences. This brings to mind user
populations that belong to different cultures, genders, language and disabilities. The scope of
Universal Design is broad and complex mainly due to the issues pertaining to diverse user
requirements. The Design for All movement has been very valuable in raising the profile of
disabled users of products, and has laid down some important principles. The Universal Design
Center at NC State University is the premier institute that developed the seven principles of
Universal Design, which are listed as follows:
1. Equitable Use: The design is useful and marketable to people with diverse abilities. 2. Flexibility in Use: The design accommodates a wide range of individual preferences
and abilities. 3. Simple and Intuitive Use: Use of the design is easy to understand, regardless of the
user's experience, knowledge, language skills, or current concentration level. 4. Perceptible Information
The design communicates necessary information effectively to the user, regardless of ambient conditions or the user's sensory abilities.
5. Tolerance for Error The design minimizes hazards and the adverse consequences of accidental or unintended actions.
6. Low Physical Effort The design can be used efficiently and comfortably and with a minimum of fatigue.
7. Size and Space for Approach and Use Appropriate size and space is provided for approach, reach, manipulation, and use regardless of user's body size, posture, or mobility.
1 Design for All, Barcelona Spain 2 Universal Design Center, NC State University, USA
10
The use of the term universal design, however has some inherent risks (Newell & Gregor,
2001). This is due to the fact that designing a product that fits all possible users is a near impossible
task, due to the variability in user preferences.
Providing access to people with a certain type of disability can make the product
significantly more easy to use by people without disabilities, however sometimes impossible to use
by people with a different type of disability. For example a cell phone with a audio display allows
the Blind to use this technology, an audio display can be useful for people without disabilities while
driving. A large print cell phone will be useful for users with low vision, however of no use for the
totally blind. Moreover, according to Benyon et al., (2001), poor design can disable even an abled
user, therefore some design implications for people with disabilities could also be applicable to
users without disabilities. It is the role of the designer to ensure that the concept of universal design
enhances, not hinders the usability and accessibility of the product. Universal design principles are
also considered as guidelines to develop interfaces for a global audience.
2.4 Globalization
In an increasingly global marketplace product designers are faced with the challenge to offer
usable products and services to an enormous variety of users. With companies seeking to diversify
into the global market, product designers need to have an insight about the numerous factors that
contribute to the differences in users’ requirements. Localization of a product to the target market is
the customization of a product to suit its target market. This is sometimes just a superficial process
such as translation of the language on the interface (Oshlyyansky et al., 2004). This can lead to
frustration, increased training time and sometimes the rejection of the product (Oshlyyansky et al.,
2004). Translation is a necessary, but not sufficient step in the design of a culture specific product,
and culture is more than just a language and it must be taken into consideration in creating globally
used products or product that are localized to suit a specific culture (Nelsien, 1996). The following
section describes some of the many ways in which culture is defined.

11
2.4.1 Culture and its Dimensions
Before talking about how culture influences interface design, it is important to identify what
culture actually means. Traditionally, the term culture has been used to describe a group of people
who have certain aspects of life in common. Many definitions of culture have been formulated by
cultural anthropologists. However there is no agreement on a specific definition for culture.
Contemporary anthropologists define culture as “an ideational system referring to what humans
learn, not what they do and make” (Keesing, 1981, p.68). Culture can also be defined as “the fabric
of meaning in terms of which human beings interpret their experiences and guide their action”
(Geertz, 1973, p.145). Cultural differences in values and beliefs distinguish societies’ behavior and
attitude from one another.
Hall (1973, 1976) emphasized that non-verbal language is important for intercultural
communication. Hall (1973, 1976) introduced the concepts of chronemics, proxemics and context
in intercultural communication theory (Gould, 2005). Chronemics are explained on the basis of two
ways of how time is organized. The first is the subjective division of time into technical, formal
and informal systems and the second is the connection of time with activity. Technical time is the
underlying physical context of time, which is used to divide time into units (Gould, 2005). For
example the phases of the moon, sunrise or solstices can all be used to divide time into units.
Formal time is the conventional system of time, which is based on technical time. The formal time
system of measurement helps people plan, schedule and manage time. Informal time involves
culturally different perceptions of the rate at with time passes. For example, “I will see you in 5
minutes” will have a different meaning in South Asia and a different meaning in the United States.
For a person from South Asia this would mean that it is reasonable to show up within an hour, and
for a person from the United States it means that they need to hurry to show up (Gould, 2005). The
second way in which time is organized is based on the connection of time and activity. This leads
to the aspects of monochronic and polychromic time. In monochronic societies, people do only one
12
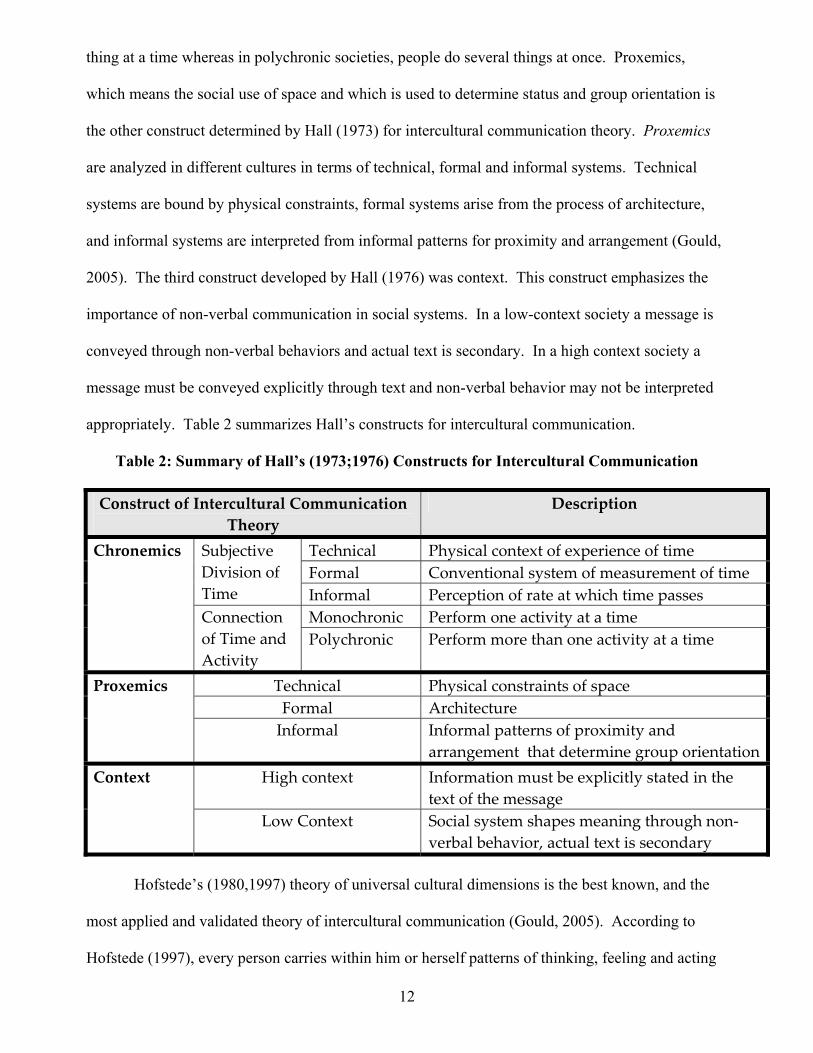
thing at a time whereas in polychronic societies, people do several things at once. Proxemics,
which means the social use of space and which is used to determine status and group orientation is
the other construct determined by Hall (1973) for intercultural communication theory. Proxemics
are analyzed in different cultures in terms of technical, formal and informal systems. Technical
systems are bound by physical constraints, formal systems arise from the process of architecture,
and informal systems are interpreted from informal patterns for proximity and arrangement (Gould,
2005). The third construct developed by Hall (1976) was context. This construct emphasizes the
importance of non-verbal communication in social systems. In a low-context society a message is
conveyed through non-verbal behaviors and actual text is secondary. In a high context society a
message must be conveyed explicitly through text and non-verbal behavior may not be interpreted
appropriately. Table 2 summarizes Hall’s constructs for intercultural communication.
Table 2: Summary of Hall’s (1973;1976) Constructs for Intercultural Communication
Construct of Intercultural Communication Theory
Description
Technical Physical context of experience of time Formal Conventional system of measurement of time
Subjective Division of Time Informal Perception of rate at which time passes
Monochronic Perform one activity at a time
Chronemics
Connection of Time and Activity
Polychronic Perform more than one activity at a time
Technical Physical constraints of space Formal Architecture
Proxemics
Informal Informal patterns of proximity and arrangement that determine group orientation
High context Information must be explicitly stated in the text of the message
Context
Low Context Social system shapes meaning through non-verbal behavior, actual text is secondary
Hofstede’s (1980,1997) theory of universal cultural dimensions is the best known, and the
most applied and validated theory of intercultural communication (Gould, 2005). According to
Hofstede (1997), every person carries within him or herself patterns of thinking, feeling and acting

13
which are learned throughout his or her lifetime. A person’s childhood and upbringing have
significant effects on the development of these patterns. Hofstede (1997) suggested the fact that
culture is always shared with people who live or lived within the same social environment where it
was learned. The definition of culture that was formulated by Hofstede (1997, p.4) is “the
collective programming of the mind which distinguishes the members of one group or category of
people from another.”
In the definition of culture, groups or categories of people refers to people that are in contact
with each other or that have something in common (e.g. nationality, gender, religion, ethnicity).
Hofstede (1980, 1997) provided empirical analyses that support national cultures. Hofstede (1980,
1997) administered a survey for IBM employees of over 50 different countries around the world and
came to the same conclusion - that different nationality cultures have the same issues but vary in the
way they approach them. However this study has explored the two predominant boundaries of
culture: disability and nationality. The issues of “dimensions of culture” have been developed
because these were constructs that could be measured respectively between cultures. A dimension
is an aspect of a culture that can be measured with respect to other cultures (Hofstede, 1997).
Hofstede identified the following dimensions that form a model for differences among national
cultures that have been defined as 1) Power distance 2) Individualism vs Collectivism 3) Feminity
vs Masculinity 4) Uncertainty Avoidance and 5) Long Term Orientation.
Power distance is measured on the basis of inequality in the society. It is defined as the
extent to which the less powerful people in society accept and expect that power is unequally
distributed (Hofstede, 1997).
Individualism represents a preference for a loosely-knit social framework where people are
expected to look out for their own interests take care of themselves, whereas collectivism indicates
an inclination toward a tightly-knit social framework where people expect their companions to look
out for their welfare and where personal goals are subordinated to those of the group (Hofstede,
1997).

14
Masculinity measures the degree to which a culture separates gender roles. Masculine
cultures accept traditional and distinct gender roles, and are mostly male-dominated societies. A
feminine culture does not separate traditional gender roles. Hofstede (1997) focuses on the
traditional assignment of assertiveness, competition, and toughness to masculine roles, and feminine
roles of orientation to home and children, people, and tenderness, in a masculine culture. However
feminine cultures tend to break down these distinctions and overlap gender roles. Masculinity refers
to the relative desire of material success and assertive behavior versus quality of life and modest
behavior.
Uncertainty avoidance can be defined as the extent to which the members of a culture feel
threatened by uncertainty, ambiguity and the unknown, along with the eagerness to avoid these
situations (Hofstede, 1997). People in a high uncertainty avoidance culture perceive uncertainty as
dangerous and show a low tolerance for risk and tend to reject new and unusual ideas (Choi et al.,
2005). On the other hand, a culture that has low uncertainty avoidance can deal well with
vagueness and its members can be characterized as risk-takers.
Long term orientation focuses on the degree to which the society embraces, or does not
embrace, long-term devotion to traditional or forward- thinking values. High Long-Term
Orientation indicates that the country prescribes to the values of long-term commitments and
respect for tradition (Hofstede, 1997). This dimension was discovered by Micheal Bond in the
1980’s while he administered a questionnaire called the Chinese Value Survey in 23 countries, and
was added to the model and increased the number of dimensions to five (Gould, 2005).
2.4.2 Measuring Cultural Dimensions
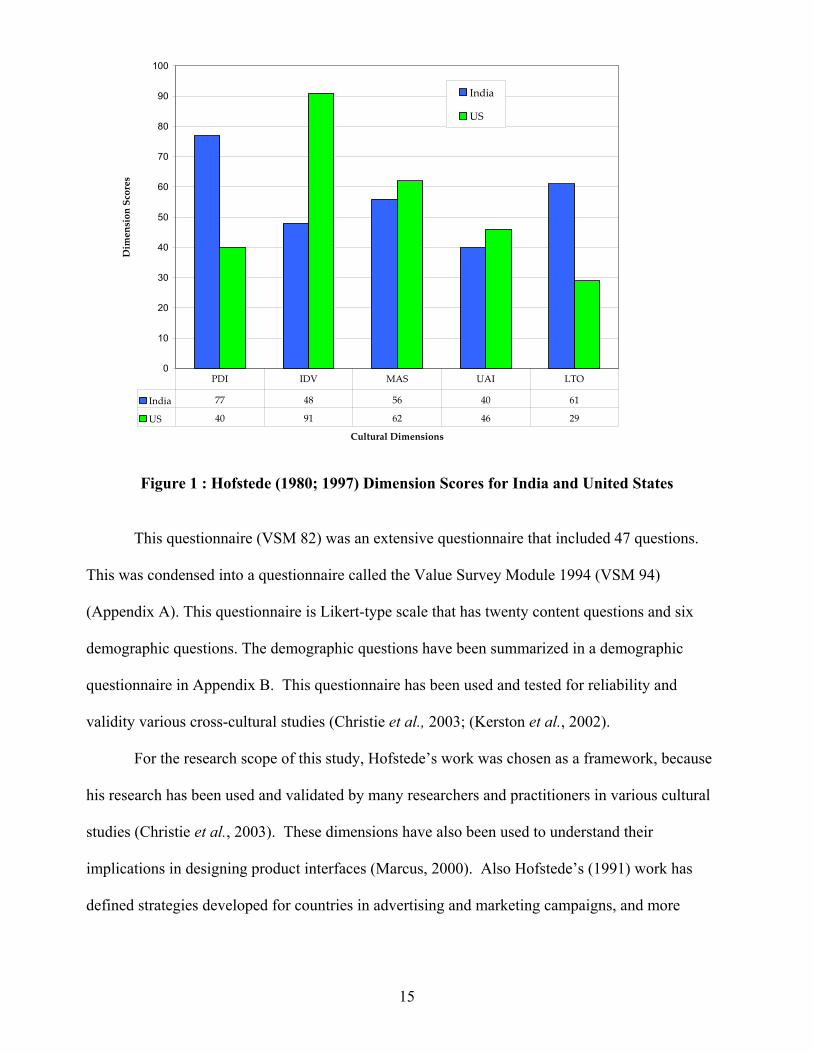
Hofstede (1980, 1997) summarized these dimensions into index scores based on a
questionnaire he used to survey IBM employees. The questionnaire he used was called the Value
Survey Module 1982 or the VSM 82. Figure 1 shows a comparison of the Index scores of IBM
employees in India and the US from the VSM 82.
15
0
10
20
30
40
50
60
70
80
90
100
Cultural Dimensions
Dim
ensi
on S
core
s
India
US
India 77 48 56 40 61
US 40 91 62 46 29
PDI IDV MAS UAI LTO
Figure 1 : Hofstede (1980; 1997) Dimension Scores for India and United States
This questionnaire (VSM 82) was an extensive questionnaire that included 47 questions.
This was condensed into a questionnaire called the Value Survey Module 1994 (VSM 94)
(Appendix A). This questionnaire is Likert-type scale that has twenty content questions and six
demographic questions. The demographic questions have been summarized in a demographic
questionnaire in Appendix B. This questionnaire has been used and tested for reliability and
validity various cross-cultural studies (Christie et al., 2003; (Kerston et al., 2002).
For the research scope of this study, Hofstede’s work was chosen as a framework, because
his research has been used and validated by many researchers and practitioners in various cultural
studies (Christie et al., 2003). These dimensions have also been used to understand their
implications in designing product interfaces (Marcus, 2000). Also Hofstede’s (1991) work has
defined strategies developed for countries in advertising and marketing campaigns, and more

16
recently in product design practices (Jordon, 2000). The availability of instruments to measure
these cultural dimensions also led to the choice of this framework.
Cultural dimensions were measured using the VSM 94 questionnaire developed by
(Hofstede, 1994). The Values Survey Module 1994 (VSM 94) is a 26-item questionnaire developed
for comparing culturally determined values of people from two or more countries or regions. It
allows scores to be computed on five dimensions of national or regional culture, on the basis of four
questions per dimension: for this, it needs 5 x 4 = 20 questions. The remaining six questions are
demographic relating to gender, age, education level, job type, present nationality, and nationality at
birth. Research has shown that the answers to the 20 content questions vary substantially between
nationality groups (Hofstede, 1994).
However, answers to the 20 content questions will also be influenced by other
characteristics of the respondents, such as gender, age, level of education, occupation, kind of work,
and year that the survey was administered (Hofstede, 1994) and other factors such as type of
disability. Therefore, comparisons of countries or regions should as far as possible be based on
samples of respondents who were matched on all criteria other than nationality or region. They
should be matched on any criterion (other than nationality) that can be expected to affect the
answers. The formulae for index calculation and the VSM 94 questionnaire can be referenced in
Appendix A.
2.4.2.1 Limitations of VSM 94
When samples of respondents of the same nationality but with different occupations or
different employers are compared (matched on criteria other than occupation or employer), the
same dimensions were not found (Hofstede, 1994). The responses to most of the questions do vary
somewhat from one occupation to another, and sometimes from one employer to another. The
scores will also vary from one individual to another (Hofstede, 1994). If the questionnaire is used
to compare responses from individuals, from respondents with different occupations or employers,

17
or from respondents belonging to any category other than nations or regions, the answers should be
examined question by question and not combined into these five dimensions.
The following section discusses a unique aspect of culture which is integrated into the lives
of people with disabilities, also termed as disability culture.
2.5 Disability Culture
According to Fine and Asch, 74% of Americans with disabilities feel a common identity
with one another and 45% of them see themselves as part of a minority, with a particular group
consciousness belonging to a specific group (Peters, 2000). Peters (2000) argues that disability
culture not only exists, but is also a thriving concept and lived experience in the hearts and minds of
many people with disabilities. According to Peters (2000), Bragg contended that in order for people
with disabilities to claim a disability culture and therefore, a cultural identity, several requirements
must be satisfied:
(1) a common language;
(2) a historical lineage that can be traced textually (through archives, memorials and
distinctive media/press publications);
(3) evidence of a cohesive social community;
(4) political solidarity;
(5) acculturation within the family at an early age (and/or in segregated residential schools and
clubs);
(6) generational or genetic links;
(7) pride and identity in segregation from others.
Based on these requirements Peters (2000) provides a solid theoretical foundation to claim
that people with disabilities have a group identity, which can be termed as disability culture. They
share a common history of oppression and a common bond of resilience (Brown, 2001). They
generate art, music, literature, and other expressions of their lives and their culture, infused from

18
their experience of disability. Disability culture is a set of artifacts, beliefs, expressions created by
people with disabilities to describe their own life experiences. People with disabilities are also
members of different nationalities, religions, colors, professional groups, and so on (Brown, 2001).
Also, no matter what the disability or location of the person with the disability, s/he has encountered
oppression because of their disability. Brown (2001) states that disability culture in the Southwest
of the U.S. may be very different from that Northeast U.S. or Europe or Asia, but they all will have
some similarities. However, for a person to identify with a disability culture depends on when the
disability was acquired and whether the presence of the disability has been accepted or not. These
studies provide some theoretical foundation to the present study and served as an important
foundation in the formulation of the research questions of this paper.
2.5.1 Prevalence of Disabilities
Unfortunately data are lacking on many aspects of statistics of the population with
disabilities in the developing world. According to estimates of the United Nations, about 10% of
the world’s population is has some form of disability. According to estimates of the World Health
Organization, there are 600 million people in the world living with disabilities, that is around 10%
of the world’s population (Jenkins, 2004). A recent (1997) projected estimate for world blindness
points to some 45 million blind, and an additional 135 million are visually disabled or have low
vision (Thylefors, 1998). According to Vanderheiden (1990), estimating the number of individuals
with a disability is a difficult task. Disability estimates depend on the definition of a disability, and
the source of the data. Many data sources may be available, which may lead to data overlap
between sources that results in too may estimates. Another reason that leads to inaccurate estimates
is due to the fact that sources classify data based on the type of disability, therefore those with more
than one disability may be classified more than once (Vanderheiden, 1990). Also disability
statistics may be not be reliable since the definition of disability is not consistent across all nations.
According to India’s Census data (2001) there are 21.9 million people with disabilities
(visual impairment, hearing impairment and locomotor) in India. The 2001 Census figures show

19
that the highest percentage (48.5) of people with disabilities is in the visual impairment category
(Disability News and Information Service, n.d). According to other sources it is estimated that the
population with disability in India is approximately over 90 million, of these 12 million are blind,
28.5 million are with low vision, 12 million are with speech and hearing defects, 6 million
orthopaedically handicapped, 24 million mentally retarded, 7.5 million mentally ill, 1.1 million
leprosy cured (Voices for all: Definition of Disability, 2003).
The National Sample Survey Organization (NSSO) conducted a survey of disability in 1991.
In this survey people were classified as “disabled” if they had less than 40% “normal” functions and
concentrated primarily on physical disabilities. The concept of “normal functions” was not clearly
defined. The findings of this survey included:
• 9% of rural households and 7% of urban households have at least one person with disability
(average household size was 5.8 people).
• 1.9% of the Indian population had severe or profound physical disabilities.
• 12% of the disabled people identified had multiple disabilities.
• 80% of people with disabilities live in rural areas.
• 4% of children aged 0-4 years living in rural areas and 3.3% of those in urban areas had a hearing
loss.
The U. S. Census data (2000) indicated that 53 million Americans have some type of
disability ("Disability status ", 2000). Also 10.8 million people have a sensory disability involving
sight or hearing. Newell and Gregor (1997) estimated the distribution of certain disabilities within
the United States as:
- 1 in 10 have a hearing impairment, and 1 in 125 are deaf
- 1 in 100 have a visual disability, 1 in 475 have legal blindness, and 1 in 2000 have total blindness
- 1 in 250 are wheelchair users
- 20% of the population has difficulty performing basic physical activities
- 7.5% are unable to walk, lift, read, or hear without help

20
Whatever statistics are adopted, it is a fairly safe assumption that individuals with
disabilities constitute a large minority group in India and the United States and around the world.
This population estimate indicates the size of the untapped market that can be targeted by a
company that designs and manufactures assistive technologies for low vision. . The legal
obligations are governed by the disability legislation in every country that protects the rights of
people with disabilities. Understanding the design needs also need attention to the legislation for
people with disabilities in a country.
2.5.2 Disability Legislation
Different countries have different laws and regulations to protect the rights of their
population with disabilities. These differences can be more significant between developed and
developing countries.
The Americans with Disabilities Act (ADA) was the initial legislation that brought
accessibility issues into public focus (Americans with Disabilities Act Technical Assistance
Program, 2001). Title 2 of the ADA, passed in 1990, required services and communications
products to be accessible to those with disabilities ("The Americans with Disabilities Act," 1990).
If the services or communications products were not already compliant, manufacturers had to make
“reasonable accommodations” to demonstrate an effort towards compliance. After the passage of
the ADA, the Federal Communications Commission passed the Telecommunications Act of 1996.
Within the Act is the provision that all telecommunications equipment be designed to be accessible
by those with disabilities (Telecommunications Act of 1996, 1996). Telecommunications
equipment includes, but is not limited to, cellular telephones, personal computers, residential
telephones, etc. In 1998, Congress amended the Rehabilitation Act to require Federal agencies to
make their electronic and information technology accessible to people with disabilities. Inaccessible
technology interferes with an individual's ability to obtain and use information quickly and easily.
Section 508 was enacted to eliminate barriers in information technology, to make available new
opportunities for people with disabilities, and to encourage development of technologies that will

21
help achieve these goals. The law applies to all Federal agencies when they develop, procure,
maintain, or use electronic and information technology (Section 508: 508 Law, 2002).
In India the “Persons with Disabilities (Equal Opportunities, Protection of Rights and Full
Participation) Act, 1995” (PWD) came into force on February 7, 1996. This law was an important
landmark and is a significant step in the direction of ensuring equal opportunities for people with
disabilities and their full participation in nation-building. The Act provides for both preventive and
promotional aspects of rehabilitation like education, employment and vocational training, job
reservation, research and manpower development, creation of a barrier-free environment,
rehabilitation of persons with disability, unemployment allowance for the disabled, special
insurance scheme for the disabled employees and establishment of homes for persons with severe
disability (Disability India Network, n.d.).
2.5.2.1 Definition of Disability
There is no single, universally accepted definition of disability. The World Health
Organization (WHO) manual defines a disability as any restriction or lack (resulting from an
impairment) of ability to perform an activity in the manner or within the range considered normal
for a human being (Voices for all: Definition of Disability, 2003)
Under the ADA (Americans with Disabilities Act 1990), a person is disabled if s/he:
• has a physical or mental impairment that substantially limits one or more major life activity;
• has a record of such impairment; or • is regarded as having such an impairment. Persons with disabilities (PWDs) in India are defined as persons who have lost not less than
forty percent of any ability as certified by a medical authority. The Persons with Disabilities (Equal
Opportunities, Protection of Rights and Full Participation) Act, 1995 identifies the following four
categories of disability.
22
1. Locomotor disability: Disability of the bones, joints of muscles leading to substantial
restriction of movement of the limbs due to any form of cerebral palsy.
2. Hearing impairment: The PWD Act defines hearing disability as “loss of sixty decibels or
more in the better ear in the conversational range of frequencies”. A person is considered as
having a severe hearing disability when the person cannot hear at all, or hear only loud
sounds. In India, surveys on hearing disabilities are conducted only for people who are 5
years old and above.
3. Mental Retardation: Defined as “a condition of arrested or incomplete development of a
person’s mind” in the PWD Act.
4. Low vision / no vision: Low vision or no vision is a total absence of visual function even
after treatment or standard refractive correction. A person who has low vision or no vision
uses appropriate assistive devices or is potentially capable of using vision. In this study
participants that were legally blind/ partially sighted were recruited and they reported their
disability by self report.
The current research study was focused on the population with visual disabilities since is
one of the more prevalent disabilities.
2.5.3 Design for People with Disabilities
People with disabilities have traditionally had lower levels of education and employment
and higher levels of poverty when compared to others within society, due to inequalities related to
access. The easy access and use of information through the use of information appliances or
telecommunication devices can increase access to employment by allowing those with disabilities to
use their cognitive skills, rather than physical skills (Langton & Ramseur, 2001). Designing for the
disabled population is not just an ethical approach to design but also important for business.
Handicapitalism (a term coined by Johnnie Tuitel, a lecturer with a disability), describes the
realization in business that people with disabilities are not charity cases or regulatory burdens, but

23
can be on the contrary profitable marketing targets (Prager, 1999). This population represents a
growing target market to which new services can be provided (Emiliani, 2001). Mainstream
companies, from financial services to cell phone makers, must go beyond what is mandated by law
and rapidly tailor products to attract people with disabilities (Prager, 1999). There is not only a
moral and legal obligation to provide access to products and services, but also a growing awareness
in the industry that people with disabilities and elderly people can no longer be considered as an
insignificant minority.
Including users with disabilities in the design process, is termed as User Sensitive Inclusive
Design, which has been adopted in this research.
2.5.4 User Sensitive Inclusive Design
Involvement of people with disabilities in the design process has been a new experience for
all design consultancies. To understand these users’ requirements, designers must meet with users
with disabilities to discuss their needs and preferences, and study how they would use these devices
if they had access to them. Undoubtedly designers consider their opinion very useful and valuable.
Soares and Kirk (2000) believed that although this sounds simplistic, it is not simple to do.
According to Dong et al., (2002) people with disabilities are expert users as they always look
beyond the product features to detect potential problems. These problems and design issues may not
arise easily when a person without a disability is attempting to design a product for a person with a
disability.
This user-centered design approach has been extended to the ‘User Sensitive Inclusive
Design’ approach (Newell & Gregor, 2001). User Sensitive Inclusive Design is an attitude of the
mind, which differs from simply and mechanistically applying a set of “design for all” guidelines.
The designers need to pay special attention to the ethical issues that arise when users with
disabilities are included in the design process. These ethical issues may include getting the
informed consent approval from the users and ensuring that the users comfortable in the
environment to communicate their thoughts easily since they may not be able to do so because of

24
their disability. Ethical issues were minimized first by getting an approval from the Institutional
Review Board for this study and requesting the participants for informed consent. Accommodations
such as large print forms and assistance with form filling was provided to all the participants that
requested it.
The next section is a discussion on the role of culture in design of interfaces.
2.6 Culture-Oriented Interface Design
“There is no denying that culture influences human-product interaction” (Hoft, 1996 p.25).
Concrete or overt factors that one can clearly observe are just surface features of an interface. They
are tangible, straightforward and easily observable elements (Yeo, 1996). Many guidelines such as
the one by Fernandez (1995) have been formulated for interface design elements that are dependent
on language, presentation formats, graphical symbols and so forth. An example of this is the
difference in date formats in Europe and United States. In Europe, the date format is
DD/MM/YYYY, whereas in the US the date format is MM/DD/YYYY.
Cultural elements can be deeply embedded in a society and people might not be aware of them.
These are covert factors that deal with elements that are intangible (Yeo, 1996). Colors, for
instance, have different connotations in various cultures. The color white in most European
countries is associated with purity, cleanliness and peace. In China, however, white is associated
with death. A white dove to represent freedom and peace might not convey the message intended.
One of these intuitive cultural factors is the flow of information. An example from Russo & Boor
(1993) is the arrangement of icons on a screen. In America and the UK a series of icons would be
organized from left to right and from top to bottom. Focus is placed in the top left hand corner of
the screen. An example of this can be seen in Figure 2 which is a snapshot of the website
http://www.bbc.co.uk/, which would be counter-intuitive for Arabic and Chinese users because
written information does flow left to right and not right to left or top to bottom. An example of this
can be seen in Figure 3, which is a screen shot of the website http://news.bbc.co.uk/hi/arabic/news/

25
for Arabic users In another example, explained by Sukaviriya & Moran (1990), some Asian scripts
have no upper or lowercase letter writing. Under these circumstances, a function to change case
would be completely useless. It would be irrelevant to user expectations and, to the extent that it
complicates the interface, such a function would most likely be cumbersome.
Figure 2: A snapshot of a Western website: http://www.bbc.co.uk/

26
Figure 3: A screen shot of an Arabic website http://news.bbc.co.uk/hi/arabic/news/
It was important to examine the existing literature for designing global interfaces, in order to
avoid misinterpretation of the meaning intended by developers and to avoid offending the target
culture (Yeo, 1996). However there has not been much research on identification of the invisible
cultural influence on human-machine interface design. Cultural influence is invisible since it
cannot be directly observed and quantified, but must be inferred from the values and beliefs of the
society. In fact, culture has a strong effect on what users look for in a systems interface and how
they perceive such interfaces (Choi et al., 2005).
Some research was explored in the area of an increasingly important issue: the Cultural User
Interface (CUI) (Yeo, 1996). The CUI is a user interface that is intuitive to a particular culture. It
takes advantage of the shared or common knowledge of a culture, which could be defined by
country boundaries, language, cultural conventions, ethnicity, shared activities or workplace (Yeo,
1996). Although the term CUI is not used frequently, the concept remains the same for many. The
computer, ubiquitous as it is nowadays, requires an extra effort on redesigning its interface to be
compatible with other cultures. “To successfully build bridges between worlds, user interface

27
designers must increase their awareness of cross-cultural differences, and make changes to the
traditional software development process. As computer markets become more international, the
research and design community must think about user interfaces in more global terms that include
cultural awareness.” (Russo & Boor, 1993, p. 343). In designing software for a global audience,
increase global acceptance of software products will be increased and therefore will increase the
user’s effectiveness, efficiency and satisfaction with the product. A truly intuitive cross-cultural
software should reflect the cultural orientation of its users and accommodate user’s cultural
differences (del Galdo & Nielsen, 1996), concerning interface design preferences as well as the
attitude towards software technology. According to (Barber & Badre, 1998), Culturability is a term
used to emphasize the importance of the relationship between culture and usability. Culturability,
has implications in the usability aspects of software design. It is important that Usability is re-
defined in terms of a cultural context, as what is "user friendly" for one culture can be vastly
different for another culture.
As discussed earlier, there have been some studies that suggest that people with disabilities
have their own culture. Moreover, some studies have suggested the need to incorporate a culture’s
values and beliefs into the design of the interface. Since research in the area of cross-cultural
studies in interface design for users with disabilities remains unexplored this paper was an attempt
to open the interface design community to this untapped dimension.
2.6.1 History of culture-oriented interface design
According to Gould (2005), Stewart and Bennett believed that cultural values and
communication style arise from the process of human perception. Screen layout and expectation of
interaction depend on values and assumptions of culture. Fernandez (1995) introduced the problem
of translating cultural symbols, taboos and aesthetics into interface design. Barber and Badre
(1998) introduced the term cultural marker to define an interface element that has a cultural
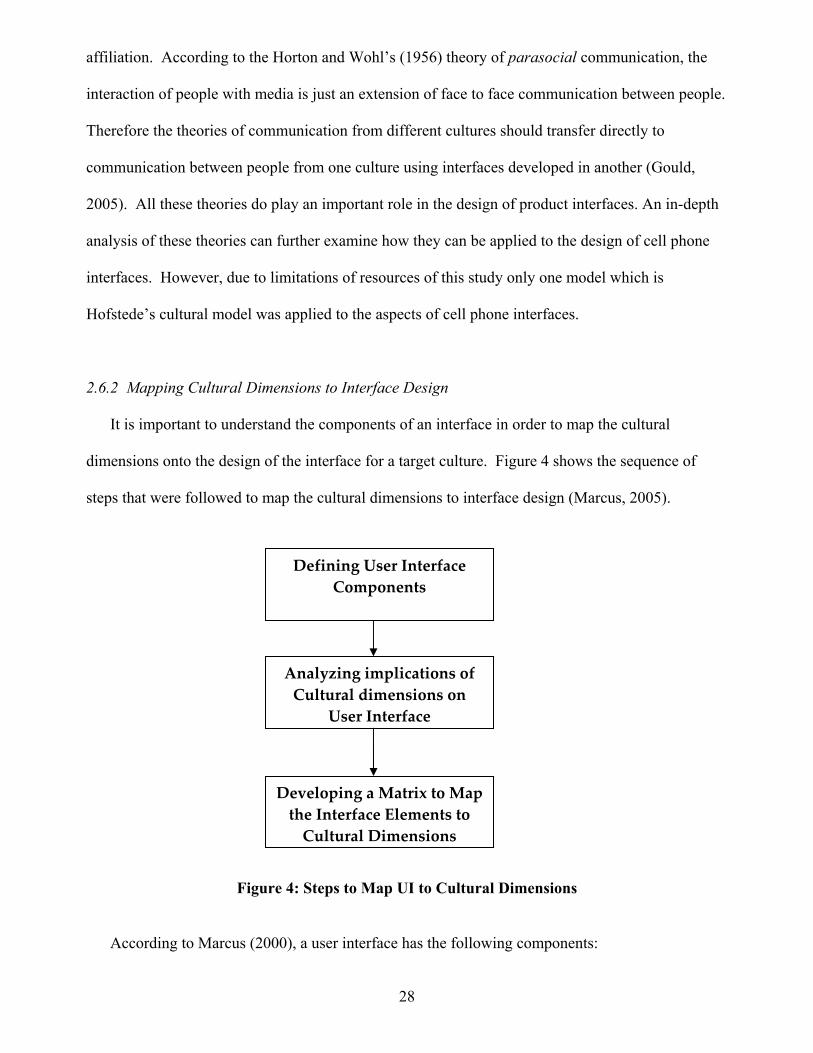
28
affiliation. According to the Horton and Wohl’s (1956) theory of parasocial communication, the
interaction of people with media is just an extension of face to face communication between people.
Therefore the theories of communication from different cultures should transfer directly to
communication between people from one culture using interfaces developed in another (Gould,
2005). All these theories do play an important role in the design of product interfaces. An in-depth
analysis of these theories can further examine how they can be applied to the design of cell phone
interfaces. However, due to limitations of resources of this study only one model which is
Hofstede’s cultural model was applied to the aspects of cell phone interfaces.
2.6.2 Mapping Cultural Dimensions to Interface Design
It is important to understand the components of an interface in order to map the cultural
dimensions onto the design of the interface for a target culture. Figure 4 shows the sequence of
steps that were followed to map the cultural dimensions to interface design (Marcus, 2005).
Figure 4: Steps to Map UI to Cultural Dimensions
According to Marcus (2000), a user interface has the following components:
Defining User Interface Components
Analyzing implications of Cultural dimensions on
User Interface
Developing a Matrix to Map the Interface Elements to
Cultural Dimensions

29
1) Metaphors: Metaphors are fundamental concepts that are communicated through different
mediums such as words, images, sounds and tactile experiences. This element of the user
interface helps users understand how to interact with the system using a known concept in
the real world.
2) Mental Models: Mental models are structures or organization of data, functions, tasks and
roles. They are cognitive structures of concepts and procedures that users refer to when
selecting relevant system goals (Rosson and Carroll, 2002). Examples of mental models are
content, function, media and task hierarchies (Marcus, 2005)
3) Navigation: Navigation involves movement through the mental models, through content and
tools. Examples of navigation are menus, dialogue boxes, control panels, icons etc that
enable this movement (Marcus, 2005).
4) Interaction: Interaction includes input output techniques, feedback and status displays. This
includes detailed behavior characteristics of keyboards, keypads, mice, or microphones for
input; headsets, hands-free or loudspeakers for output; using drag and drop for selection and
action sequences (Marcus, 2005).
5) Appearance: It includes perceptual attributes such as visual, auditory and tactile
characteristics of the interface. Examples include choices of colors, fonts, animation, sound
cues and verbal cues (Marcus, 2005).
Marcus & Gould (2000) have studied how website user interfaces are affected by the
underlying cultural dimensions of the society. The design implications for each of Hofstede’s
(1980; 1997) cultural dimension for user interface design is summarized in Table 3.

30
Table 3: Design Implications of Hofstede’s Cultural Dimensions
Power-distance Collectivism vs. individualism
• Access to information: highly structured (high PD) vs. less-highly (low PD) structured.
• Hierarchies in mental models: tall (high) vs shallow (low).
• Focus on expertise, authority, experts, certifications, official stamps (high) • Importance given to leaders vs. citizens, customers, or employees (high) • Importance of security and restrictions or barriers to access: explicit, enforced, frequent restrictions on users (high) vs. transparent, integrated, implicit freedom to roam (low).
• Motivation based on personal achievement: maximized (expect the extra-ordinary) for individualist cultures vs. underplayed (in favor of group achievement) or collectivist cultures. • Rhetorical style: controversial/
argumentative speech and tolerance or encouragement of extreme claims(Ind.) vs. subdued hyperbole and controversy(Col).
• Prominence given to youth and action (Ind.) vs. aged, experienced, wise leaders (Col.)
• Underlying sense of social morality: emphasis on truth( Ind) vs. relationships (Col.). • Emphasis on change: what is new and
unique (Ind) vs. tradition andhistory(Col.) Femininity vs. masculinity. Uncertainty avoidance
• Traditional gender/family/age distinctions (Mas)
• Work tasks, roles, and mastery, with quick results for limited tasks(Mas) • Navigation oriented to exploration and control (Mas). • Attention gained through games and competitions (Mas). • Graphics, sound, and animation used
(Mas). • Blurring of gender roles (Fem) • Mutual cooperation, exchange, and
support, (rather than mastery and winning) (Fem)
• Attention gained through poetry, visual Aesthetics, and appeals for unifying values (Fem)
• Simplicity, with clear metaphors, limited choices, and restricted amounts of data (high).
• Attempts to reveal or forecast the results or implications of actions before users act (high) • Navigation schemes intended to prevent users from becoming lost (high). • Redundant cues (color, typography, sound, etc.) to reduce ambiguity (high) • Less control of navigation; for example, links may open new windows leading away from the original location (low) • Mental models and help systems might focus on understanding underlying concepts rather than narrow tasks. (low) • Coding of color, typography, and sound to maximize information (multiple links without redundant cueing) (low) • Complexity with maximal content and
choices (low)

31
Long- vs. short-term orientation dimensions
• Content focused on practice and practical value (LTO). • Patience in achieving results and goals (LTO). • Content focused on truth and certainty of beliefs (STO). • Rules as a source of information and credibility (STO). • Desire for immediate results and achievement of goals (STO).
A deeper understanding of the relationship of the user interface components with the cultural
dimensions is sought by specifying the interface components of the product to be designed for the
target market. Firstly the components of the cell phone interface were identified. The dependence
of these specific interface components on the underlying cultural dimensions was the next step to
reach the goal of mapping the dimensions to the components.
2.6.3 Cross-Cultural Studies of Mobile Devices
Handy/ Händi (pronounced "Hendi") in Germany, mobile phone in the UK, mobile in India,
and cell phone in the United States are the terms used to refer to one and the same device
(Answers.com, n.d.). Besides these differences in the language and terminology for the same
device used in these countries, the cell phone interface preferences may also differ between these
countries. These differences are governed by the cell phone service provider schemes in each
country (free incoming or minute charges), the laws enforced for cell phone usage (in public places,
or while driving) and the kind of technology cell phone used (GSM, CDMA etc.), that may differ in
every country. Mobile device interfaces are more difficult to design due to their limited screen size,
consequently there is limited research in this field. In a cross-cultural study of mobile devices,
Sarker & Wells (2003) discovered many factors affecting the acceptance of mobile devices,
including cultural origin affecting the pattern of use. Similarly, different cultures accepted and
adopted different modes of mobile communication (SMS for example) (Sarker & Wells, 2003).
Another cross-cultural study of learning methods of cell phones (Honold, 1999) provides guidelines

32
for the type of user manuals, German and Chinese cell phone users may prefer. However there
were studies found examining the cross-cultural aspect of interface design for users with
disabilities.
2.6.4 Cell Phone Interaction Research Model
The interaction between the users and the device is through the device’s interface. Most
cross-cultural user interface designs focus on how to present information appropriately in different
cultures (Ito & Nakakaoji, 1996). This interaction with the cell phone interface consists of four
phases of cognitive activity. The model is derived from the basic model of cognitive activity that
has been described by Ito & Nakakaoji, (1996). The block diagram of the model applicable to cell
phone interaction for this study can be seen in Figure 5.
Figure 5: Interaction Phases of User’s Cognitive Activity
This model in Figure 5 has been described by Kim & Lee (2005). In this model the
dependency on culture increases as the stages progress. These phases are described as follows:
1) Perception: The affordance perception phase when users identify what the system has to
offer by viewing the initial presentation on the screen. This is the first phase of the cognitive
activity and where the user perceives what affordance the system has to offer, and then goes
on to check the applicability of the affordance to the task at hand. The user will first
perceive the start up view of the cell phone interface.
2) Navigation (Applicability Check): This phase is where the users validate their choice of
actions (Ito & Nakakaoji, 1996). Culture affects the users’ attitude in this phase. In this
Perception [1]
Navigation [2]
Execution [3]
Confirmation [4]

33
phase the user will enter the menu structure in order to search for a specific item or a menu
which will lead to the completion of the task goal.
3) Execution: This third phase of the activity is where the users enact their action plan (Ito &
Nakakaoji, 1996). The users have to follow a certain path in order to achieve the ultimate
goal. For example sending an SMS or looking up a number in the phone book.
4) Confirmation: The user performs a task with the expectation of confirmation whether the
task has been completed or not.
This model is further analyzed to list specific cell phone user interface elements in the following
section.
2.6.5 Cell Phone Interface Components
According to Ketola & Roykkee (2001), mobile handsets or cell phones can be observed
from two points of view, the point of view of design and that of a user. From the design point of
view, a cell phone is an interactive system. An interactive system is a combination of hardware and
software components that receive input from and communicate output to a human user in order to
support his or her performance or a task, according to ISO 13407 (Ketola & Roykkee, 2001). The
cell phone can also be viewed as an information appliance from the point of view of the user. An
information appliance is designed to perform a specific activity, such as music, photography or
writing and has the ability to share information (Ketola & Roykkee, 2001). In this study they
proposed that the cell phone user interface has three components:
• User Interface
• Service Interface
• External Interface
The cell phone usability is dependent on all three of these interfaces. If any one of these
interfaces is poorly designed or is temporarily dysfunctional, it affects the users’ performance and
perceived ease of use of the other interfaces (Ketola & Roykkee, 2001) . Table 4 summarizes the UI

34
components proposed by Ketola and Roykkee (2001), along with items that correspond to each of
these components.
Table 4: Cell Phone User Interface Components
Interface Category
Items
User Interface
Input tools (functionality, industrial and mechanical design)
Navigation tool, Softkeys, Keypad/keyboard, Specialkeys (Power, Call management, Voice)
Display Icons, Indicators, Language, Familiarity, Localization
Audio, Voices Ringing tones, Quality, Interruption
Ergonomics Touch and feeling, Slide, one-hand operating Balance, Weight, Size
Detachable parts SIM card, Battery, Snap-on(Color) cover
Communication method
Radio link, Bluetooth, Infrared, Cable
Applications Fun, Utility, Usability
External interface
User Support Local help, Manuals, Documentation
Accessories Charger. Hands-free sets, Loopset, External keyboard
Supporting software PC software, Downloadable applications
Service Interface
Services Availability, Utility, Interoperability

35
2.6.5 Mapping interface components to cultural dimensions
Cell phone interface features are analyzed on the basis of the interaction model by Ito &
Nakakaoji, (1996) and cell phone interface components by Ketola and Roykkee (2001), in the
previous sections. UI components for each interaction phase are listed in the Figure 6. These
components have been summarized from the research papers by Kim & Lee (2005) and Choi et al.
(2005).
Figure 6: Research Model of Cell Phone Interaction with Interface Components
These cell phone UI components are mapped to specific attributes of the cell phone interface
described by Kjeldskov & Stage (2004). Each attribute is described below along with its
relationship with the cultural variables. This relationship is summarized from the cross-cultural
study of websites by Marcus & Gould (2000). A description of the cell phone attributes and their
relationship with Hofstede (1991)’s dimensions is provided in the following section.
1) Minimal Steps or Keystrokes: This feature of the cell phone indicates that to search for the
desired function while navigating through the menu, the task would require few/minimal steps
to search for desired contents. According to (Hofstede, 1997) a highly uncertainty avoidant
culture is one that has a low tolerance for uncertainty and ambiguity. Therefore the feature can
be related to a high uncertainty avoidant score, since the subjects prefer to avoid ambiguity and
would prefer minimal steps or keystrokes to execute the desired function.
Perception [1]
Navigation [2]
Execution [3]
Confirmation [4]
• Labels • Icons • Menu layout • Touch and
feel
• Number of steps
• Number of ways to access
• Number of items
• Menu depth
• Feedback • Secondary
information

36
2) Secondary information about contents is a feature of the cell phone where the menu
provides information (such as help) about each function. This can again be related to highly
uncertainty avoidant cultures since they prefer to avoid situations with which they are unfamiliar
(Hofstede, 1997). Therefore this feature can be related to uncertainty avoidance. The user will
be asked if s/he prefers to have secondary information displayed at all times or would like to
see(or hear) it only when asked for.
3) Variety of Contents (additional features): The cell phone provides a variety of additional
features, such as movie ratings, weather, restaurants etc. A culture that has high power distance
accepts large distances in social hierarchies and prefers limited choices on the interface
(Marcus, 2005). This feature can be related with a culture that has a low PDI distance score.
4) Clear Menu Labeling: The menu is clearly labeled with text labels below icons. As
explained earlier, a culture that is highly uncertainty avoidant prefers not to encounter
unfamiliar situations. Therefore this feature can be correlated with a high UAI score.
5) Efficient screen space utilization: The small screen space must be used optimally and
efficiently. The screen could display one icon (or menu function) at a time or all at one instance.
The former can be related to low UAI scores and the latter to a high UAI score since this feature
ensures that ambiguity of the interface is reduced considerably.
6) Large amount of information within a screen: A large amount of information in the form
of icons or menu items will be available at one instance. This feature of the interface which
provides information of the variety of options available (Marcus, 2005), avoids ambiguity and
is therefore related to a high UAI score. A culture that is highly long term oriented, emphasizes
patience(Marcus, 2005), and therefore does not need many options at one instance therefore a
low LTO score is related to the preference for this feature.
7) Personalizable interface (concept of Profiles): The phone options of ringer tones, volume
etc. can be changed according to the profiles selected. This feature can be related to a high IDV

37
score, since highly individualistic cultures are oriented to individual goals vs group goals
(Marcus, 2005).
8) Familiar interface: The interface of the cell phone must be similar to previously used cell
phones. A familiar interface avoids ambiguity and a radically new interface would increase
uncertainty. Therefore it can be related to a high UAI score
9) Using default folders: Storing messages in default folders such as (my messages, my
pictures etc.) vs personalizing folder names. This feature is more oriented to the group
achievement vs an individual achievement. By using default and not personalized folders, the
SMS (messages), MMS or pictures taken from the camera, can be accessed by more than one
individual. This feature can be correlated to a low IDV score since it favors the achievement of
the individual’s goals.
10) Using hotkey, softkey, shortcut functions: The functions that are assigned to the softkeys
can be accessed in one keystroke. This feature is correlated with high uncertainty avoidant
cultures, since they would prefer situations which are less ambiguous. A shortcut cut key will
reduce the ambiguity in the interface and lead to the desired menu or item in just one keystroke.
Moreover, since a highly masculine culture has clear and distinct gender roles, according to
(Marcus & Gould, 2000) a highly masculine culture prefers quick results for limited tasks. The
use of softkeys on a cell phone interface can be related to MAS, since its use has a distinct clear
functionality.
11) Programmable softkeys: The softkeys should not have fixed assigned functions but should
be programmable by the user. This feature allows more user control over the cell phone
interface. Since masculine cultures accept distinct gender roles and individualistic cultures focus
on individual goals, programmable functions can be related to low MAS scores and high IDV
scores.

38
12) Group SMS: Providing a function for sending a message (SMS), MMS or email to
members of an assigned group. A collectivist culture prefers an interface that emphasizes on
relationships (Marcus & Gould, 2000), therefore this feature can be related to low IDV scores.
13) Variety of Fonts and Font Sizes: This feature on the cell phone interface will allow the
user to select from a variety of fonts and font sizes. This feature provides a variety of options,
which is preferred by cultures that have low power distance (Marcus, 2005). Selecting fonts
allows the achievement of individual goals of personalizing the interface. This feature can be
correlated with (negatively) PDI and (positively) IDV scores.
14) Appearance of phone body: The feature of the cell phone refers to the ergonomics of the
cell phone body. It includes aspects of aesthetic appeal and touch and feel of the cell phone. As
discuss previously feminine cultures emphasize on the aesthetics of the interface, therefore this
feature can be (negatively) correlated to the MAS scores.
All these features and the corresponding cultural variables are summarized in Table 5.
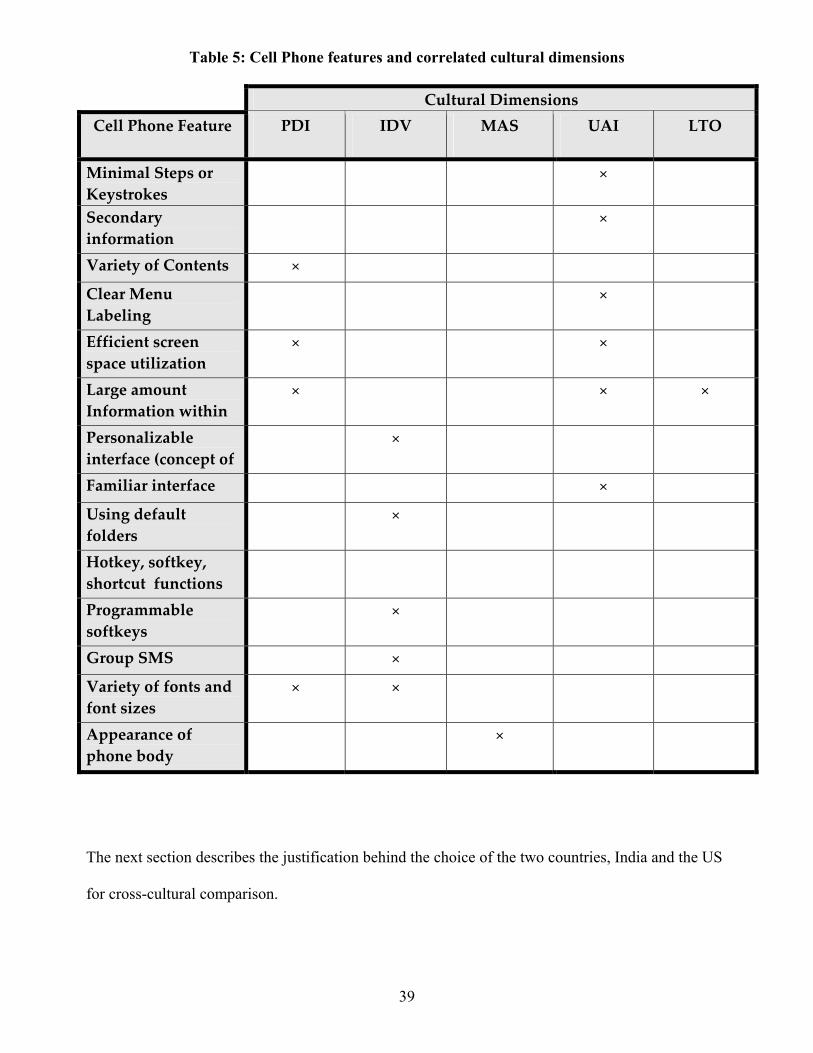
39
Table 5: Cell Phone features and correlated cultural dimensions
Cultural Dimensions Cell Phone Feature PDI IDV MAS UAI LTO
Minimal Steps or Keystrokes
×
Secondary information
×
Variety of Contents × Clear Menu Labeling
×
Efficient screen space utilization
× ×
Large amount Information within
× × ×
Personalizable interface (concept of
×
Familiar interface × Using default folders
×
Hotkey, softkey, shortcut functions
Programmable softkeys
×
Group SMS × Variety of fonts and font sizes
× ×
Appearance of phone body
×
The next section describes the justification behind the choice of the two countries, India and the US
for cross-cultural comparison.

40
2.7 Choice of National Cultures
Two nations (India and the United States) were selected for this cross-cultural research using
a systematic sampling procedure. Systematic sampling, a procedure “in which cultures are selected
in a systematic, theory-guided fashion” (Vijver & Leung, 1997), is recommended for the selection
of cultures in cross-cultural comparative studies where cultural variation is significantly different
for meaningful comparisons. Cultures are chosen in such a way that they represent different values
and cultural dimensions. Since this study correlates Hofstede’s cultural dimensions with cell phone
interface design preferences; it would be relevant to use systematic sampling in the selection of
cultures which exhibit significant differences in Hofstede’s cultural dimensions. The United States
and India have been chosen based on the results of earlier studies which have confirmed significant
cultural differences among these countries in practically all of Hofstede’s cultural dimensions
(Hofstede, 1980; Hofstede & Bond, 1984 & 1988; Trompenaars, 1992). In addition, each of the
countries chosen for this research has different traditions, history and economic development.
India is predominantly a Hindu country, with 82.4% of its one billion population adhering to
Hinduism. In the United States, Christianity is the predominant religion, with 85.3% of its
population embracing it while other major religions are Judaism (2.1%) and Islam (1.9%). These
differences in religion between the two countries may be one of the reasons for differences in
cultural values. Hindi is the official language of India, spoken by about 30% of the population. The
Indian Constitution also recognizes 17 regional languages. English is an associate language for
many official purposes. English is the official language in the United States. India has a
parliamentary form of government based on universal adult franchise. The executive authority is
responsible to the elected representatives of the people in Parliament for all its decisions and
actions. The United States has a constitution-based federal republic, with a strong democratic
tradition. The political system of a country has a role in the formation of cultural values and
dispositions of its people.

41
India is ranked 12th among the world’s largest economies, with a per capita income of
$3100 (for 2003). The United States of America has the largest economy in the world with per
capita income of $34,870 and it is the home for 153 of the 500 world’s largest corporations. All
these factors influence the values and beliefs and hence the culture of the nation. The differences in
these two nations are summarized in Table 6.
Table 6: Comparison Chart of United States and India Source: CIA-The World Fact Book (2005)
Sr.No. Parameters USA INDIA 1. Median age (2005) total: 36.27 years
male: 34.94 years female: 37.6 years
total: 24.66 years male: 24.64 years
female: 24.67 years 2. Religion Protestant 52%, Roman
Catholic 24%, Mormon 2%, Jewish 1%, Muslim 1%,
other 10%, none 10% (2002)
Hindu 80.5%, Muslim 13.4%, Christian 2.3%, Sikh 1.9%,
other 1.8%, unspecified 0.1% (2001 )
3. Language English 82.1%, Spanish 10.7%, other Indo-
European 3.8%, Asian and Pacific island 2.7%, other
0.7% (2000 census)
English has an associate status Hindi is the national language and primary tongue of 30% of the people; there are 14 other
official languages: India (2001) 4. Literacy
Definition: age 15 and over can read
and write
Total population: 97%
male: 97% female: 97% (1999 est.)
total population: 59.5%
male: 70.2% female: 48.3% (2003 est.)
5. Population (2005) 295,734,134 1,080,264,388 6. Population growth
rate (2005 est.) 0.92 % 1.4%
7. GDP- PPP (2004)
$11.75 trillion $3.3 trillion
8. GDP- Per capita (2004)
$40,100 $3,100
9. Labor Force(incl. Unemployed-
2004)
$147.4 million $482.2 million
10. Unemployment Rate (2004)
5.5% 9.2 %
11. Internet Users (2002/2003)
159 million 18.5 million
12. Cell Phone Users(2003)
158,722,000 26,154,400

42
Besides these economic, political, religious and language differences, India and the United
States, significantly differ on 3 of the 5 cultural dimensions of Hofstede’s (1990) model which has
been previously discussed in the this section. Therefore, India and the United States were chosen
as the focus of the cross cultural comparison in this research using the systematic sampling
procedure (Vijver & Leung, 1997). An additional reason for the choice of these two nations was the
convenience and possibility of data collection by the author of this paper, in the respective
countries.

43
CHAPTER 3. RESEARCH OBJECTIVE
The use of cell phones has spread across the globe and the role of cultural differences in
design of user interfaces has emerged as a critical issue. Cultural factors that play an important role
in the design of mobile phones have not yet been explored extensively. Only a few authors such as
Choi et al. (2005), and Honold (1999) have addressed these issues. The role of culture in the design
of cell phones for people with disabilities is a new dimension of culture oriented product design that
has not been examined till date. This study was an attempt to address this unexplored dimension of
product/ interface design. Even though this study mainly focused on the cell phone design
preferences, some results may be used in general interface design.
Brown (2001) stated that disability culture in the Southwest of the U.S. may be very
different from that of Northeast U.S. or Europe or Asia; however, they all will have some
similarities. This study first examines the presence of a disability culture, in two different countries.
At this stage the disability groups in the United States and India were compared for differences in
values and beliefs, using the Value Survey Module 94 (VSM94) (Appendix A). This research
further explored how selected attributes of cell phone interfaces as perceived by users with visual
disabilities and no apparent disabilities differed among countries. The two countries for this
comparative study were selected based on parameters such as economic status, cultural differences
and cell phone prevalence and an expanding market. India and United States were selected also
since they have different political structures, stages of economic development and cultural
dimensions. This study was an extension of the research project that involved gathering of cell
phone design preferences of users with disabilities in the Germany and UK markets, conducted by
Drs. Smith-Jackson and Nussbaum. In this study, focus groups were organized, and participants
were questioned about their preferences for cell phone attributes. The results of this study were
used to develop product-specific guidelines to assist user interface designers in the inclusive design
of cellular telephones. The present study delivers a cross-cultural comparison of cell phone design

44
preferences from the perspective of nationality and disability. Cell phone interface design
preferences which are disability specific and country specific are summarized at the end of this
study. Some guidelines for conducting cross-cultural research are also provided in the conclusion
section.

45
CHAPTER 4. METHODS
4.1 Research Design
A mixed methods approach using qualitative and quantitative data analyses techniques was
adopted in the current study. This study was designed to answer the following questions:
• What are the differences in cultural values between users with (and without) disabilities
across the two countries? Do these differences justify the presence of a disability culture?
• Are preferences for interface design driven more by a nationality culture, disability culture
or a blend of both?
• What are the differences between cultural groups in preferences of cell phone hardware
features and usability ratings of tasks?
• What are the differences in interface design preferences between nationality or disability
cultural groups?
The hypotheses corresponding to the above research questions are listed as follows:
1. Hypotheses on the Cultural Dimensions 1.A The cultural dimension scores on the VSM 94 for users with disabilities will differ from those without disabilities, within the same nationality group. 1.B The cultural dimension scores for disability groups in India will differ from those in the United States. 2. Hypothesis on the Cell phone Hardware Attributes The Hardware Attributes of the Cell Phone will be rated differently by the Nationality groups, Disability group and the interaction of Nationality × Disability groups. 3. Hypotheses on the Software Attributes and Tasks 3.A The group with higher uncertainty avoidance will have higher ratings on all the tasks. 3.B The group with a low individualism (therefore collectivist) score will rate significantly higher on the task sending an SMS.

46
3.C The group with a high individualism score will have a significantly higher score on the overall usability rating on the task of setting the ring-tone. 3.D The Overall Software Usability Attributes will be rated significantly different by the Nationality groups, Disability group and the interaction of Nationality × Disability groups. 3.E The General Features of the use of the cell phone features will be rated significantly different by the Nationality groups, Disability group and the interaction of Nationality× Disability groups. 4. Hypotheses on Cell Phone Interface Ratings 4.A The cell interface feature preferences will be rated significantly different by the Nationality groups, Disability groups and the interaction of Nationality × Disability groups. 4.B The scores of the interface preferences will be related to the corresponding group cultural dimension score. 4.C The scores on the ratings questionnaire will be correlated with the corresponding individual level cultural dimension score. 5. Hypothesis on the User Requirements and Design Preferences of Cell phone Interface Components: There will be differences in the user requirements of cell phone interfaces based on Nationality groups, Disability groups and the interaction of Nationality × Disability groups.
This study was a 2×2 between subjects design. The main factors were Nationality (N) and
disability (D) type. Detailed information about the levels and types of these factors is provided in
Table 7.
Table 7: Factor Levels and Types
Factor Name Levels Type
Disability
Group(D)
Control(no apparent disability),
Legal Blindness
Between-Subjects,
Fixed Effects
Nationality Group
(N)
United States, India Between Subjects,
Fixed Effects
Subjects S1…….S69 Between Subjects,
Random Effects

47
4.1.1. Context Variables
Since culture is a global concept and is not meaningful as an explanatory variable, it should
be replaced by its constituents (Vijver & Leung, 1997). These constituents are referred to as
context variables (Vijver & Leung, 1997) or cultural dimensions. These are variables that are used
to validate an interpretation of cross-cultural differences (Vijver & Leung, 1997). The context
variables used in this study were Power Distance, Individualism, Uncertainty Avoidance,
Masculinity and Long Term Orientation. These context variables are not shown in the data matrix,
since the culture group cannot be assigned to any cultural variable by the experimenter. These
variables were determined by the response in the instrument VSM 94, which has been discussed in
the previous section. For data analysis purposes these variables are considered as the dependent
variables.
4.1.2 Control Variables
Control variables were monitored to evaluate potential extraneous influences. These
variables include demographics such as age, gender, nationality, country of birth, presence of
disability and when it was acquired. More specifics were asked to provide a detailed cultural
background, these include amount of time spent overseas, country of birth for each parent. These
questions have been summarized in the demographic questionnaire in Appendix B.
4.1.3 Data Collection Method: Focus Groups
One of the most widely used research tools in social sciences are in-depth group interviews,
also called focus groups (D. W. Stewart & Shamdasani, 1990). A focus group involves 6-8
individuals who discuss a topic under the topic of interest under the supervision of a moderator,
who promotes the interaction between participants and ensures that the discussion does not digress
from the topic of interest (D. W. Stewart & Shamdasani, 1990). One of the advantages of using
focus groups as an research tool is that it produces a very rich body of data that is expressed in the
respondent’s own words, which in turn minimizes the artificiality of responses. Through focus

48
groups a researcher can identify shared and common knowledge. This makes focus groups- a data
collection technique sensitive to cultural variables, therefore it is often used in cross- cultural
research (Kitzinger, 1995). Focus groups have been successfully used in various user centered
design studies. In the current study product interactive focus groups were the primary research tool
to gather data. Product interactive focus groups, which allow participants to interact with products
during the discussion, were conducted in India and the United States. Product interactive focus
groups were coupled with tasks and questionnaires in order to gather data that was used for the
cross-cultural comparison. Product interactive focus groups are an efficient method previously used
to generate product related discussions (Y. S. Lee et al., 2006; Young Seok Lee et al., 2004;
Mooney et al., 2002; Smith-Jackson et al., 2003). Focus groups for each of the disability types
(without any apparent disability and with legal blindness) were held in India and the United States.
A total of 13 focus groups, 6 in India and 7 in the United States were conducted. As mentioned
before, 6 participants were recruited for each group, however some participants did not show up for
the focus group, therefore the samples size for each of the groups was not equal.
4.1.4 Sample Size Estimation
The minimum number of respondents per country or region to be used in comparisons is 20
(Hofstede, 1997). This study included 2 disability types and 2 nationality groups with a total of 18
participants recruited in each cell. The number seems to be reasonable as it is close to the ideal
number of 20, for the cross cultural comparison. Therefore, a total of 36 participants were recruited
in India and 36 in the United States, however since a few of the participants did not show up for the
focus groups, the final number of participants was 34 in India and 35 in the United States.
4.2 Independent Variables
The independent variables used in this study were disability group and nationality group.
The levels of these independent variables are described below in Figure 7.

49
Main Factor Disability Group (D)
Levels Legal Blindness
No Apparent Disability
United States
S1….S18 S19….S36
(Country) (C) India
S37...S54 S55 ...S72
Figure 7: Data Matrix assigning participants to Independent Variables
4.2.1 Disability Group
The two levels of the independent variable disability group are:
• Control group (with no apparent disability)
• Legal Blindness/Partially Sighted
Participants with disabilities or no apparent disability were included based on self-reports.
Legal blindness is defined as visual acuity of 20/200 or less in the best eye with corrective lenses.
Eighteen participants were recruited for the visual disability and control group, in India and the
United States, on the basis of self report (Appendix B).
4.2.2 Nationality Group
The two nationality groups (two levels of country variable) are India and United States.
These two nationalities are the basis of the cross-cultural comparison. The detailed comparison of
cultural dimensions and other economic factors for these two nations is given in the literature
review section.
Before discussing the dependent variables used in this study, the cell phone test model,
manufactured by Toshiba was evaluated. Screenshots of the interface of the cell phone were
evaluated for their underlying dimensions. Some tasks were also analyzed when broken down into
constituent steps.

50
4.3 Cell Phone Interface General Evaluation
Figure 8 is a screen shot of the cell phone interface. It clearly indicates that the screen space
is utilized efficiently, since it includes a large number of icons. Since it displays a large number of
icons at one instance, it reflects high uncertainty avoidance. This screen displaying a large number
of icons, avoids uncertainty since it reflects immediate results and completion of goals (Marcus &
Gould, 2000).
Figure 8: Startup menu of cell phone

51
Figure 9 indicates that each icon has a label indicating its function on the screen, which again
prevents ambiguity in the interface.
Figure 9: Cell Phone Screen shot of Icons and Corresponding Labels
Figure 10 shows that there is secondary information about every function selected. This is
another feature that reflects highly uncertainty avoidant cultures.
Figure 10: Screen shot of Cell phone Secondary Information

52
After completion of a task the interface provides information about what was done by the
system as a feedback. This can be seen in Figure 11. This feature has a strong relationship with the
uncertainty avoidant dimension, since it does reduce ambiguity of the outcome of the action
performed by the system.
Figure 11: Screen Shot of Cell Phone Interface Feedback
All the features discussed above reflect a high degree of uncertainty avoidance since a
considerable amount of secondary information is present at all times and feedback is provided at all
times.
4.3.1 Task Specific Evaluation
The legally blind groups and the control groups performed the following tasks scenarios:
Turn on the phone
• Calling a number (without using the phone book) • Storing a phone number • Sending a text message (SMS) • Setting the ringer sound
The names and phone numbers used in the scenarios were adapted for each country so that
the scenarios were compatible with common names and phone numbers used in the respective
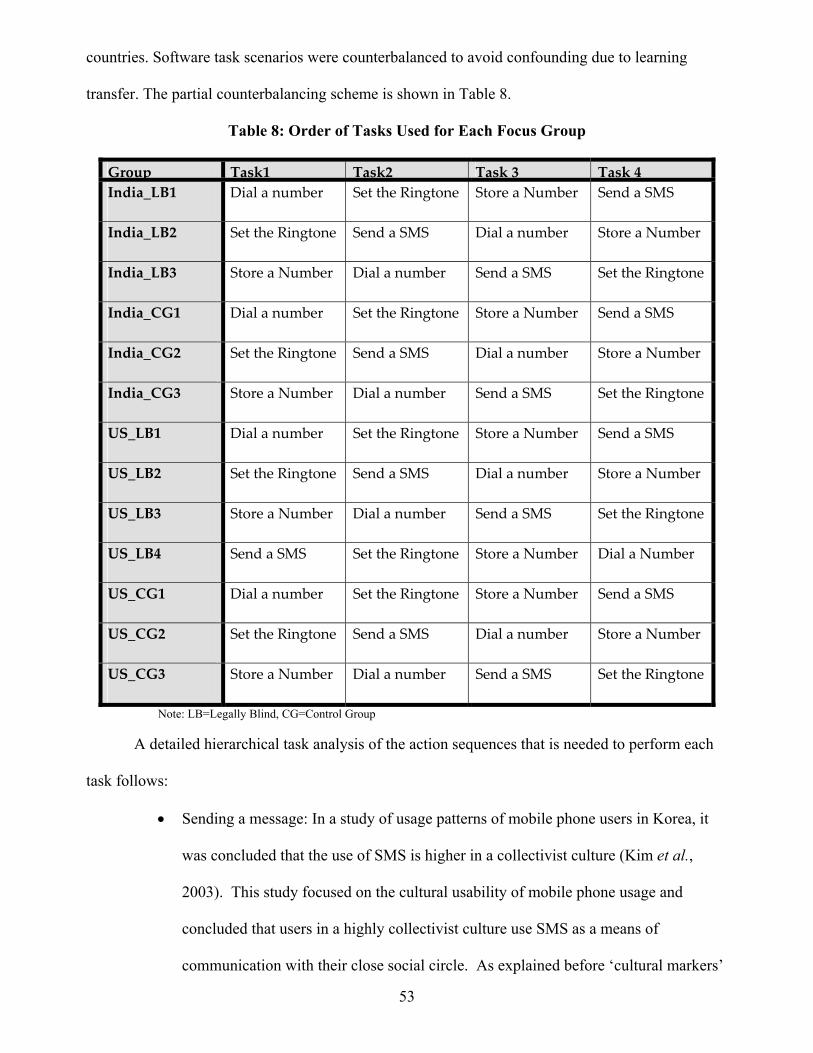
53
countries. Software task scenarios were counterbalanced to avoid confounding due to learning
transfer. The partial counterbalancing scheme is shown in Table 8.
Table 8: Order of Tasks Used for Each Focus Group
Group Task1 Task2 Task 3 Task 4 India_LB1 Dial a number Set the Ringtone Store a Number Send a SMS
India_LB2 Set the Ringtone Send a SMS Dial a number Store a Number
India_LB3 Store a Number Dial a number Send a SMS Set the Ringtone
India_CG1 Dial a number Set the Ringtone Store a Number Send a SMS
India_CG2 Set the Ringtone Send a SMS Dial a number Store a Number
India_CG3 Store a Number Dial a number Send a SMS Set the Ringtone
US_LB1 Dial a number Set the Ringtone Store a Number Send a SMS
US_LB2 Set the Ringtone Send a SMS Dial a number Store a Number
US_LB3 Store a Number Dial a number Send a SMS Set the Ringtone
US_LB4 Send a SMS Set the Ringtone Store a Number Dial a Number
US_CG1 Dial a number Set the Ringtone Store a Number Send a SMS
US_CG2 Set the Ringtone Send a SMS Dial a number Store a Number
US_CG3 Store a Number Dial a number Send a SMS Set the Ringtone
Note: LB=Legally Blind, CG=Control Group
A detailed hierarchical task analysis of the action sequences that is needed to perform each
task follows:
• Sending a message: In a study of usage patterns of mobile phone users in Korea, it
was concluded that the use of SMS is higher in a collectivist culture (Kim et al.,
2003). This study focused on the cultural usability of mobile phone usage and
concluded that users in a highly collectivist culture use SMS as a means of
communication with their close social circle. As explained before ‘cultural markers’

54
are those elements of an interface that are most prevalent, and possibly preferred
within a particular cultural group. According to Barber & Badre (1998) cultural
markers can directly impact the perceived usability of a product. Therefore the
usability of an interface for a particular task depends on the underlying cultural
dimension. The usability rating of this task is dependent on a collectivist culture.
• Setting the ringer sound: This task’s sequence can be seen in Appendix D. This task
sequence clearly indicates that the user needs to be aware of the concept of user
profiles to personalize the interface to select the required ringer sound. The concept
of user profiles deals with customizing the interface features to individual
preferences. This feature is related to the individualism dimension which focuses on
the preferences of the individual versus the collective preferences of a group.
Therefore usability rating of this task is dependent on the IDV dimension.
Table 9: Summary of Tasks with the Related Cultural Dimensions
Task Related Cultural DimensionSending an SMS Collectivism
Setting the ring-tone Individualism
The tasks that were performed by the participants and the related cultural dimensions are
summarized in Table 9. The other two tasks, dialing a number and storing a number in the phone
book were not related to any cultural dimensions. The mean ratings on the post task questionnaires
were compared for the nationality and disability for all the 4 tasks are summarized in the Results
section.
4.4 Dependent Variables
The dependent variables that were measured in this study are discussed in the sections that
follow.

55
4.4.1 Cultural Dimension Scores
The cultural dimensions are context variables or dependent variables. The scores that each
culture group obtained on the VSM 94 are a construct to measure the cultural dimension of the
group. The scores of the cultural dimensions were calculated using the formulae summarized in
Appendix A. The dimension scores for 4 units of analyses obtained are shown in Table 10.
Table 10: Summary of Mean Dimension Scores and Standard Error from VSM 94
Group
Cultural Dimension India_LB India_CG US_LB US_CG PDI 54.44(15.63) 57(9.03) 12.63(12.66) 37(15.10) IDV 94.72(13.76) 75.66(16.73) 74.21(8.49) 111.33(7.5) MAS 60.55(21.86) 21(29.69) 18.42(22.79) 13.33(24.98) UAI 53.33(12.66) 16.33(17.15) 74.47(15.09) 22.33(13.2) LTO 34.44(8.05) 42.66(7.77) 42.1(5.27) 37.33(8.4) Sample size n=18 n=16 n=19 n=16
4.4.2 Cell Phone Interface Ratings
Cell phone interface features have been identified and classified using existing literature
(Choi et al., 2005). Hofstede’s cultural dimensions have also been used to classify features of the
cell phone interface that reflect specific cultural constructs. The user’s preferences for these
features were acquired using a Likert-type ratings questionnaire (Appendix E). The mean scores
obtained for each group is summarized in Table 11.

56
Table 11: Summary of Mean Ratings and Standard Deviations of Interface Ratings
Mean Ratings and Standard Deviation Interface item India_CG SD India_LB SD US_CG SD US_LB SD Minimal Keystrokes 3.69 1.14 4.61 0.98 4.60 0.51 4.58 0.51Secondary info 2.75 1.06 4.28 0.89 3.23 0.94 4.26 0.73Variety of Contents 3.88 1.02 4.17 0.92 3.40 0.74 3.89 1.37Menu Labeling 4.19 0.83 4.06 1.06 4.07 0.59 4.53 0.84Screen utilization 4.31 0.70 3.44 1.58 4.27 0.59 4.63 0.76 Large amt. of info. 3.38 1.31 3.56 1.46 3.27 0.70 3.58 1.50Personalizable interface 3.81 1.11 4.61 0.61 3.47 1.25 4.05 1.03Familiar interface 3.75 0.93 3.50 1.20 4.40 0.63 4.21 1.13Using default folders 4.00 1.03 3.94 0.94 3.27 0.88 3.74 1.24Softkey functions 4.06 0.93 4.50 0.62 3.73 1.03 4.16 0.90softkeys 3.81 0.98 4.06 1.06 3.33 1.23 4.37 0.68Group SMS 3.63 1.26 3.61 1.50 3.00 1.07 2.32 1.29Variety of fonts 3.50 1.15 3.06 1.51 3.07 1.22 4.26 1.05Aesthetic appeal 4.56 1.03 3.78 1.22 4.13 0.83 4.05 1.22
4.4.3 Hardware Ratings
The Hardware ratings of the test phone model were summarized in a Likert-type ratings
questionnaire. The items which were the different hardware attributes measured with the
corresponding mean ratings are summarized in Table 12.

57
Table 12: Mean and Standard Deviations of Cell Phone Hardware Ratings
Group India_LB India_CG US_LB US_CG
Cell Phone Hardware Feature Mean SD Mean SD Mean SD Mean SD
Size 3.72 1.07 2.63 1.09 4.37 1.67 2.20 0.75Shape 3.89 1.02 3.56 1.46 4.21 1.78 3.93 1.24Weight 3.22 1.66 2.44 1.26 4.21 1.69 2.67 1.40Feel when dialing 3.61 1.61 4.50 1.03 4.89 1.20 3.67 1.14
Feel when holding (to speak) 4.06 1.51 4.31 0.95 5.05 0.85 4.40 1.02Key size 3.22 1.59 4.81 1.11 4.11 1.66 3.73 1.34Key shape 3.33 1.64 4.88 0.96 4.53 1.43 3.60 1.25Ease of pressing buttons 4.00 1.46 4.88 1.26 3.95 1.61 4.60 0.71
Ease of reading labels on the keys/buttons 3.06 1.76 5.13 0.89 3.58 1.74 4.53 1.45Size of the LCD screen 4.65 1.11 5.56 0.63 4.68 1.34 5.67 0.47
Ease of opening the LCD screen 4.88 0.86 5.00 1.26 5.11 1.24 4.93 1.18Rotating the LCD screen 4.65 1.27 5.31 1.35 5.74 0.45 4.93 1.06Contrast of the LCD screen 5.35 0.61 5.44 0.51 4.68 1.67 5.47 0.50
Brightness of the LCD screen 4.94 1.14 5.44 0.73 5.11 1.41 5.47 0.62Font size of menus 3.35 1.73 4.94 0.93 4.05 1.99 4.93 0.93Overall look 4.61 1.42 4.13 1.02 4.74 1.63 3.27 1.06Overall satisfaction 4.17 1.42 4.13 0.72 4.68 1.29 3.60 0.71
Total Hardware Rating
67.16 12.73 77.06 17.15 77.68421
24.65064
71.6
16.83

58
4.4.4 Post-Task Software Usability Ratings The software attributes that were measured, were based on different usability aspects of the
cell phone interface. The rating sheets contained a series of questions related to these software
usability aspects. Participants answered the questions by marking their opinions on a six-point
Likert-type rating scale Appendix I. Rating scale anchors were 1-6 with negative at the lower end
(e.g., 1=Very Difficult, Not Clearly, Very Bad) and positive at the higher end (e.g., 6=Very Easy,
Very clearly, Very Good). The usability attributes are listed as follows:
• Ease of completing the task
• Ease of locating a function in the menu hierarchy
• Ease of identifying relevant keys on the phone keypad
• Meaningfulness of the icons associated with specific functions
• Ease of understanding the menu labels for each function
• Feedback of the phone when performing tasks
The three general questions on the cell phone feature were:
• Importance of this cell phone function
• Frequency of using this feature
• Whether the function is essential in cell phone
The ratings of first 6 features were totaled to calculate an overall usability rating for each
task. The mean overall usability rating and the general ratings for each task were compared across
groups and the outcomes can be found in the Results section. The four tasks that were included in
the Product Interactive Focus Group were Dialing a number, Storing a Number, Sending a text
message and Changing the Ringtone, which are the most frequently used features of a cell phone.

59
4.4.5 Interface Design Preferences The focus group discussion raised issues regarding the interface design of the cell phone.
These issues included hardware, software features and other additional advanced features required
for cell phones. Product interactive focus groups are an efficient method previously used to
generate product related discussions (Lee et al, 2006; Lee et al., 2004; Mooney et al., 2002; Smith-
Jackson et al., 2003). The focus group discussion were transcribed and further analyzed for
similarities and differences in design preferences and user requirements across the 4 groups, using
the Overview grid method summarized in a following section.
4.5 Participants
Participants were matched as closely as possible on demographic characteristics so that the
cultural differences can stand out clearly (Vijver & Leung, 1997). A demographic questionnaire
(Appendix B) was used to confirm the similarities among participants. Due to constraints in time
and resources gender will not be matched while recruiting the participants. The participants were
recruited matched on the following criteria:
• Age group 19-50 years
• Have owned a cell phone within the past year
• Have been employed at some point in their life
The age group was initially restricted to range from 19-35 years of age, in order to strictly
control the influence of age on design preference. However due to challenges in recruitment of
participants with disabilities the age group was relaxed. This was mainly due to the fact that visual
disabilities increase with age. Every participant was recruited on the criterion that s/he has used a
cell phone within the past year. This is an important criterion, since only some previous knowledge
of using cell phones will allow the participants to perform the tasks and comprehend the task related
questionnaires. The employment criterion ensures that the participants will comprehend and relate
to the questions on the VSM 94 instrument which revolve around the values in the workplace.

60
Controlling the demographics of the participants enhanced the validity of the responses on the
questionnaires.
Despite careful matching of samples in this study, the possibility that the background
variables may influence the results is recognized. The VSM 94 (Hofstede, 1994) manual warns
that:
“Comparisons of countries or regions should as much as possible be based on samples of
respondents who are matched on all criteria other than nationality or region. So respondents from
one country to another should be chosen from the same gender, age, education level, occupation,
manager/non-manger status, employer etc. They should be matched on any criterion other than
nationality that can be expected to affect the answers.”
4.5.1 Recruitment of Participants
Participants with disabilities in the US were recruited through the following contacts:
• The Access Board, Washington DC
• Raleigh Lions Clinic for the Blind, NC
In India the following agencies helped to recruit participants for this study
• National Association for the Blind, Mumbai, India
All the above listed organizations provided a location to conduct the focus groups as well.
Detailed contact information of these institutes and their locations can be found in Appendix C.
Participants with no apparent disabilities were recruited using Newspaper advertisements
and personal contacts, through the snowballing method in India and the United States. Where
immediate contacts, that fit the criteria were asked to recruit their immediate contacts, for
participation.
4.6 Equipment and Apparatus

61
Camcorders and voice recorders were used to capture the focus group discussion as well as
the participants’ interaction with the cell phone during the tasks. The cell phone model used for this
study is a model manufactured by Toshiba Corporation.
4.7 Procedure for Data Collection
The IRB for this study was an amendment to the previously approved IRB for the study of
inclusive design of cell phones in the UK and in Germany. The approved IRB amendment for this
study is attached in Appendix G. Participants were recruited and the focus groups were conducted
in India and the United States. The procedure that was followed for data collection is summarized in
Figure 12.

62
4.7.1 Procedure during the Product Interactive Focus Group The steps that were followed are summarized in this section. The script provides details of
the probes and questions posed by the moderator (Appendix K).
4.7.1.1 Introduce the study
In the first step of data collection, the moderator (the author of this thesis) of the focus group
first introduced the objective and goals of the research to the participant. An important issue
Complete Informed Consent VSM 94 and Demographic
questionnaire
Turn on the phone
Perform the next Task
Discussion about task performance and interface design preferences
Observed and logged
participant’s performance
Repeat for each task (4 times)
Participant completes rating questionnaire about cell phone
interface design preference
Provide accommodations
if requested
PI introduces the purpose and objective of
the study
Product Interactive Focus Group Discussion
Post task questionnaire
Introduction
Pre-task Question-
naires
Figure 12: Procedure for Data Collection

63
communicated to the participants at this stage was that the study is focused on evaluating the cell
phone and not the participant. The participants were asked if they needed any accommodations,
such as large print forms and/or assistance in filling out the forms. The participants were not
assisted with the tasks as they were required to perform them independently.
4. 7.1.2 Turn on the phone and Examine hardware
The participants were all asked to examine the hardware features of the test phone model.
Hardware attributes include the weight, size and shape of the phone. They are then asked to turn on
the phone which is followed by the completion of the hardware ratings questionnaire.
4. 7.1.3 Perform Tasks
The participants of all groups were asked to complete 4 tasks. First all the participants were
asked turn on the phone. The other 4 tasks that were counterbalanced as mentioned before to
minimize order effects on task performance are as follows:
• Calling a number
• Sending a message
• Setting the ringertone
• Storing a number in the phone book.
The participants were instructed to discontinue the task once the pre-determined time (3 minutes) to
complete the task was completed.
The interaction with the cell phone facilitated the expression of their ideas and they were
able to communicate their views about the present design and provide suggestions and design
recommendations. The focus group discussion script covered areas such as task difficulty level and
why/ why not they found the task difficult/easy. They were also asked how they would have
preferred the interface to be designed in order to perform the task more efficiently. Also they were
questioned about their perceived performance level and the expectations from the cell phone

64
interface during their interaction with the cell phone. These interactions and the discussions will be
video taped and voice recorded. The focus groups were transcribed and the transcription was further
analyzed to quantify content data to provide specific information such as cell phone interface design
preferences. This was done using the ATLAS.ti, software that is used to quantify qualitative data
such as transcripts and video recordings.
4.7.1.4 Post-task Ratings Questionnaire
Participants were asked to complete a ratings questionnaire, based on the preference of each
of the cell phone features which has a scale from 1-5 (Appendix E).
4.8 Summarizing Independent and Dependent Variables
Table 13 summarizes the above discussed independent and dependent variables used in this
study.
Table 13: Summary of Independent and Dependent Measures Independent Variables Dependent Variables
Disability Group (D) (D1,D2) Cultural Dimension Scores
Nationality Group (N) (N1,N2) Cell phone interface rating
Hardware Features rating
Usability Ratings on Tasks
Design Preference/User Requirements
4.9 Revisiting Research Questions
The hypotheses tested in this research study are summarized in this section.
1. Hypotheses on the Cultural Dimensions 1.A. The cultural dimension scores on the VSM 94 for users with disabilities will differ from those without disabilities, within the same nationality group.

65
1.B. The cultural dimension scores for disability groups in India will differ from those in the United States. 2. Hypothesis on the Cell phone Hardware Attributes The Hardware Attributes of the Cell Phone will be rated differently by the Nationality groups, Disability group and the interaction of Nationality × Disability groups. 3. Hypotheses on the Software Attributes and Tasks 3.A. The group with higher uncertainty avoidance will have higher ratings on all the tasks. 3.B. The group with a low individualism (therefore collectivist) score will rate significantly higher on the task sending an SMS. 3.C. The group with a high individualism score will have a significantly higher score on the overall usability rating on the task of setting the ring-tone. 3.D. The Overall Software Usability Attributes will be rated significantly different by the Nationality groups, Disability group and the interaction of Nationality × Disability groups. 3.E. The General Features of the use of the cell phone features will be rated significantly different by the Nationality groups, Disability group and the interaction of Nationality× Disability groups. 4. Hypotheses on Cell Phone Interface Ratings 4.A. The scores of cell preferences on the interface ratings questionnaire will differ between the control group and the disability group within the same nationality grouping. 4.B. The scores of the interface preferences will be related to the corresponding group cultural dimension score. 4.C. The scores on the ratings questionnaire will be correlated with the corresponding individual level cultural dimension score. 5. Hypothesis on the User Requirements and Design Preferences of Cell phone Interface Components: There will be differences in the user requirements of cell phone interfaces based on Nationality groups, Disability groups and the interaction of Nationality × Disability groups.

66
The following section describes techniques for data analysis used for cross-cultural studies:
4.10 Cross-Cultural Research Methods and Data Analysis
One way to improve the quality of cross-cultural studies is to combine qualitative and
quantitative research methods. This also ensures that the findings are culturally relevant and
accurate (Hines, 1993). This research has used this mixed methods approach where extensive
quantitative and qualitative data was collected.
4.10.1 Quantitative Data Analysis
The central theme of this thesis is integrated into the broader framework of existing theory
and research of culture, consequently enlarging the scope of the field of cross-cultural studies.
Seeking to broaden the theories of cross-cultural comparisons to nationality culture and disability
culture, this thesis is a focused review of the research questions with a formal testing of the research
hypotheses. The data analysis is focused on comparisons of responses between the disability
groups, country groups and interaction of the disability×country groups. The data analysis
techniques are summarized in this section.
Hofstede, Bond and Luk (1993) have repeatedly stated that it is necessary to be clear about
the level of analysis considered in quantitative comparisons among cultural entities. They
distinguish four types or levels of analysis based on Leung and Bond (1989) cross-cultural studies.
4.10.1.1 Comparison of group means
The most frequently used method is the comparison of group means, either in simple or
descriptive form or through statistical formal procedures using tests of significance. Majority of
comparative culture quantitative studies take groups of individuals as a unit of analysis, and
compare group means of individual scores based on numerical responses to questionnaires. When
group means are compared using statistical methods as analysis of variance or paired comparisons it
is referred to as group means analysis. The level of analysis here is the cultural group. This method

67
was used to compare group means of the VSM scores, Hardware Ratings, Software Usability
Attribute Ratings.
4.10.1.2 Correlations
Another method of analysis is the calculating correlations between variables. Correlations
can be computed at different levels of analysis. Correlation between two variables can be obtained
taking all individual observations regardless of the cultural unit to which the observation belongs.
According to Hofstede, Bond & Luk (1993) this is referred to as pan-cultural analysis. This method
was used to correlate cultural dimensions with the cell phone interface ratings.
Correlations can also be computed between two variables using the group mean scores
where groups are cultural units instead of individual scores. This method mitigates the individual
variations and the scores that are used for data analysis are cultural indicators. The unit of analysis
here is the cultural group, and we obtain information on the relationships between variables across
groups. According to Hofstede, Bond and Luk (1993) this is referred to as ecological level analysis.
Even though correlations were not calculated, this level of analysis was followed to establish a
relationship between the interface ratings mean scores and the group level cultural dimension
scores.
Data analysis for cross-cultural research is divided into two stages according to Vijver &
Leung (1997). The preliminary analysis stage is the first stage and it consists of computing the
reliability of the instrument: VSM 94.
The second stage of the study explores the research questions and hypotheses testing (Vijver
& Leung, 1997). The dependent variable measures were tabulated for the cultural groups and will
be compared for differences. The responses from the control group will be compared with the
disability group to compare the differences between cell phone design preferences and ratings of
users without and with a disability. To measure the differences between the control and the
experimental group a post hoc pair-wise comparison will be performed.

68
For all the Analyses of Variance and post-hoc tests (LS means), the alpha will be set at a
level of 0.05. A folded-F test was used to test for equality of variances, given the differences in the
number of users in each group. None of the folded-F values were significant at p < .05, indicating
that the variances were not unequal.
4.11 Qualitative Data Analysis
Focus groups were selected as a method for qualitative data gathering for this cross-cultural
study on design preferences, after an indepth understanding of the strengths and weaknesses of this
method. Focus groups have been used as a method for exploratory research to investigate the
prevalence of any given attitude or experience (Ward, et al. 1992). When it was compared to other
methods, it lead to the conclusion that the real strength of focus groups is not simply in exploring
what people have to say, but in providing insights into the sources of complex behaviors and
motivations (Morgan & Krueger 1993). Morgan & Krueger (1993) also argued that the advantages
of focus groups for investigating complex behaviors and motivations were a direct outcome of the
interaction in focus groups, which has been termed “the group effect” (Carey, 1994; Carey & Smith
1994). An emphasis on the specific kinds of interactions that occur in focus groups is also an
improvement over vague assertions that “synergy” is one of their strengths. What makes the
discussion in focus groups more than the sum of separate individual interviews is the fact that the
participants query each other as well as explain themselves to each other. As Morgan & Krueger
(1993) have also emphasized, such interaction offers valuable data on the extent of consensus and
diversity among the participants. This ability to observe the extent and nature of interviewees’
agreement and disagreement is a unique strength of focus groups (Morgan & Krueger, 1993). An
added strength comes from the researcher’s ability to ask the participants themselves for
comparisons among their experiences and views, rather than aggregating individual data in order to
speculate about whether or why the participants differ. Therefore focus groups were selected as a
tool for data collection for this cross-cultural study that seeks to identify the differences and
similarities between groups.

69
4.11.1 Data Analysis Techniques of Focus Groups The most challenging step of a research project is the analysis of the data collected.
Unfortunately there is more written about how to conduct focus group discussion sessions than how
to go about analyzing the data gathered from the focus group sessions (Knodel, 1993). The first
step towards data analysis was to transcribe the video recordings of the focus group sessions to
extract information by content analysis. Content Analysis is a technique used to extract desired
information from a body of information usually verbal by systematically and objectively identifying
specified characteristics of the material. By means of content analysis a large body of qualitative
data may be reduced to a smaller more manageable form of information (Smith, 2000). Converting
to these smaller and more manageable forms of information is also referred to as coding. In social
sciences other than psychology content analysis has been used to describe and compare cultures
(Smith, 2000).
Given the qualitative nature of the data gathered by focus group methodology, a
considerable amount of subjective judgment is necessarily involved in its interpretation and
analysis. Not all statements and comments made in a focus group session can be considered at
face value (Knodel, 1993). Interpretation of statements is facilitated by examining them in the
context of the discussion session. According to Seidel & Clark (1984), there are two basic parts
in the analysis of focus group data: a) mechanical and b) interpretive (Knodel, 1993). The
mechanical part involves physically subdividing and organizing the data into meaningful
segments. The coding system developed specifically for the study in question is the foundation for
the mechanical part of the analysis. The interpretative part involves determining the criteria to
organizing the data into analytically useful subdivisions. The next step in the interpretation of
data is to look for patterns, within and between these subdivisions, to draw meaningful
conclusions. Qualitative data analysis software such as Atlas.ti and The Ethnograph enables the
analyst to interactively code the textual data files into analytic categories. With the help of such
software segments of the text which is associated with a particular code or a combination of code

70
can be automatically sorted and retrieved. In this way all statements relating to a particular topic
of focus group sessions or all of the views of a specific nature concerning that topic can be
assembled and organized for further analysis (Knodel, 1993). The coding system is the heart of
the content analytic method. If appropriate categories of analysis are not used, vital information
may not be detected and the analysis may reveal nothing of interest (Smith, 2000). The coding
system is the basis or foundation for the objectivity of the content analytic method. This system is
what makes the distinctions explicit and public so other researchers can use the same procedure
(Smith, 2000) and therefore enhance the validity of the outcome.
Figure 13: Data Analysis Steps for Focus Group Transcripts
The systematic approach for data analysis of focus group transcripts is depicted in Figure 13
above. The grounded theory that was used to develop the codes was based on the cell phone UI
Code Mapping Transcripts
Constructing an Overview Grid
Making Inter-group Comparisons
Assessing Reliability
Develop an Initial Set of Codes
Create Additional Codes
Develop Non-substantive Codes
Develop subsequent detailed codes
MECHANICAL
INTERPRETATIVE

71
components proposed by Ketola and Roykkee (2001). The steps of cross-cultural qualitative data
analysis used for this thesis are explained as follows:
I. Code Mapping Transcripts
The transcripts of the focus groups were coded systematically following the steps:
i. Develop an Initial Set of Codes: The initial set of codes was corresponding to each category
and item of the cell phone interface proposed by Ketola and Roykkee (2001). Separate
codes were assigned to every item at each of the three levels. Therefore some codes were
general and some were specific. The three levels of the cell phone interface can be referred
to in Table 4. Atlas.ti was used to build up these initial codes. The type of interface was
categorized as a code family as it was a general categorization of the cell phone interface.
The category specific to each of the 3 types of interface and items specific to each of the
categories were coding using the free coding feature in Atlas.ti.
ii. Create Additional Codes for Topics That Arise and Are of Special Interest: As the transcript
for each focus group was analyzed, cell phone features that were not included in the focus
group guideline were coded as well. These additional codes were added to the list of existing
using the open coding feature in Atlas.ti
iii. Develop Non-substantive Codes that will be of particular help in the analysis and write-up
phases: These codes were also added using the open coding feature in Atlas.ti.
iv. Develop subsequent detailed codes to user for analyses of specific topics: The Atlas.ti
software allows a view of the quotations corresponding to each code that was assigned to the
transcript. The quotations are the statements pertaining to user requirements gathered from
the focus group sessions. These quotations (user requirements) were added to the overview
grid for further analysis.
Figure 14 provides a summary of the coding levels of the cell phone interface as well as the
corresponding Atlas.ti coding mechanism.

72
Figure 14: Levels of Code in the Cell Phone Interface and corresponding Atlas.ti
II. Constructing an Overview Grid
Constructing a large chart or table is an effective way of proceeding with the interpretation
of the focus group transcripts. This chart or grid is also referred to as an overview grid and it
provides a descriptive summary of the content of the focus group discussions (Knodel, 1993). A
grid for this cross-cultural comparison will have topic headings on one axis and focus group
identifiers on the other axis. Each cell of the grid contains the statements (quotations) which were
identified as user requirements specific to the cell phone interface item code. Some quotations in a
cell were not isolated quotations but illustrating discussions between participants, indicating the
impact of group dynamics (Kitzinger, 1995).
General Specific
Level 1 Level 2 Level 4 Level 3
Type of Interface
Category Participant’s comments
Items
Code Family
Free code Quotations Free code +
List Code
ATLAS.TI CODING
CELL PHONE INTERFACE

73
Items Focus Group 1 Focus Group 2 Focus Group 3Item1 Quotation11; Quotation12 Quotation13 Item2 … … …… … … …Item n … … Quotation n
Figure 15: Overview Grid format for focus group comparisons
III. Making Inter-group Comparisons
In this study, 3-4 focus group sessions were conducted for each of the 4 nationality specific
disability groups. The first step was to make inter-group comparisons for the successive focus group
sessions conducted specific to these 4 demographics.
Figure 15 shows the overview of the grid made corresponding to each of the 4 groupings.
Each column represents a different focus group session. A total of 4 such grids were developed that
summarized quotations specific to each cell phone interface component. When similar opinions are
expressed by different subsets, despite the differences that characterize the conduction of any two
sessions, it is likely that the views or experiences being tapped are common to a shared underlying
culture within the broader population (Knodel, 1993). The difficulty in distinguishing differences
between groups may arise due to a particular way a moderator conducted the session or related to
the group dynamics related to the different personalities of participants in the group. To ensure
consistency of the successive focus group sessions the focus group moderator was consistent for all
the 13 focus group sessions. A measure for inter-group comparisons can be referred to as a coding
dimension which represents a continuous variable. Intensity or degree can be measured by means
of a numerical scale such as 0 (no conflict) to 6 (extreme conflict). Coding for intensity may be
problematic since it is implied by words in the text and it is difficult for a researcher to make
reliable judgments. Another type of coding dimension is a frequency of occurrence of a variable
(Smith, 2000). Even though the each occurrence is given equal weight, this dimension is highly
dependent on the length of the coding unit, such as the transcript for one group. Due to the

74
advantages and disadvantages of both these coding mechanisms, a combination of both was used as
a decision rule to explore differences and similarities between groups in this study. After
developing these overview grids the user requirements were summarized for each item of the cell
phone interface that was coded. An example of an overview grid constructed can be found in
Appendix L. The next step was to compare the different groups which were selected as the unit of
analysis of this cross-cultural study, which was done using an overview grid as seen in Figure 16.
Items India_LB US_LB India_CG US_CG
Item1 User Requirement summary 1
User Requirement summary 2
User Requirement summary 3
User Requirement summary 4
Item2 … … … … … … … … … Item n … … … User Requirement
summary n
Figure 16: Overview Grid to Compare the Units of Analysis
IV. Assessing Reliability
The accuracy of the interpretive analysis is enhanced if the analyst is involved in the focus
group session, and possibly even serves as the moderator. This considerably reduces the distance
between the analyst and the subject being studied and will lead to a better understanding of the
content in the data collected during the focus group sessions.
According to Wikan (1991) the culture analyst or ethnographer not only needs to observe
performances in the target cultures, but more fundamentally needs to experience culture personally
(Stewart, 1998). The analyst of the data for this study has been a resident of the two countries for
the cross-cultural comparison and therefore has a personal insight to the two nationality cultures and
therefore has a better understanding of the different communication techniques.

75
CHAPTER 5. DATA ANALYSIS AND RESULTS
5.1 Participant Demographics
A total of 13 focus groups were conducted in this study, 6 in India and 7 in the United
States. The session conducted and corresponding number of participants are summarized in Table
14.
Table 14: Summary of the Focus Group Sessions Conducted
Focus Group No.
Group Identifier Number of Participants
Total number of Participants
1 India_LB 6
2 India_LB 6
3 India_LB 6
18
4 India_CG 6
5 India_CG 6
6 India_CG 4
16
7 US_CG 6
8 US_CG 6
9 US_CG 4
16
10 US_LB 3
11 US_LB 6
12 US_LB 6
13 US_LB 4
19
The demographics of participants are summarized in Table 15. The type of cell phone model
owned by users is shown in Figure 17 (in percentages).

76
Table 15: Summary of participant demographics
Demographic India_LB India_CG US_LB US_CG
Sample Size 18 16 19 16
Male: Females 9:9 8:7 10:9 9:6
Age (SD) years 25(3.5) 25(5.62) 43(5.67) 23(3.2)
Number of School Years (Mean)
14 15 14 16
Cell Phone Usage (Mean Years)
3.52 4.43 6 4.7

77
6%18%
58%
18%
LGMotorolaNokiaSamsung
25%
56%
19%
MotorolaNokiaSamsung
13%
13%
37%
19%
6%6% 6% LG
CingularMotorolaNokiaSanyoSprintNo Answer
7%
29%
36%
14%
14%
KyoceraLGMotorolaNokiaSamsung
Figure 17: Cell Phone Model Owned by Users (in Percentages)
United States Legally Blind Group
United States Control Group
India Legally Blind Group
India Control Group

78
5.2 Primary Data Analysis and Results
The internal consistency of any instrument is the extent to which the components of the
instrument are interrelated, that is the extent to which they produce or predict similar results (Crano
& Brewer, 2002). A technique to measure the internal consistency is to calculate the Cronbach’s α
for the instrument (Crano & Brewer, 2002). The internal reliability of the VSM 94 questionnaire
was measured using this Cronbach’s α. The higher the α value, the more reliable the instrument.
Usually a value of 0.7 and above is acceptable (Nunnally, 1978). The reliabilities the 5 cultural
dimensions in each of the groups were tested and are reported here. Internal consistency reliability
was assessed with coefficient alpha. Table 16 shows the raw alpha values for each dimension,
which is a subscale in the VSM 94 questionnaire. As it can be seen the alpha values are low. None
of the alpha values achieved the acceptable 0.70 criteria set by Nunnally (1978). Even with the less
stringent criteria of 0.60 for a research scale, only a few more alphas reached a minimum acceptable
level.
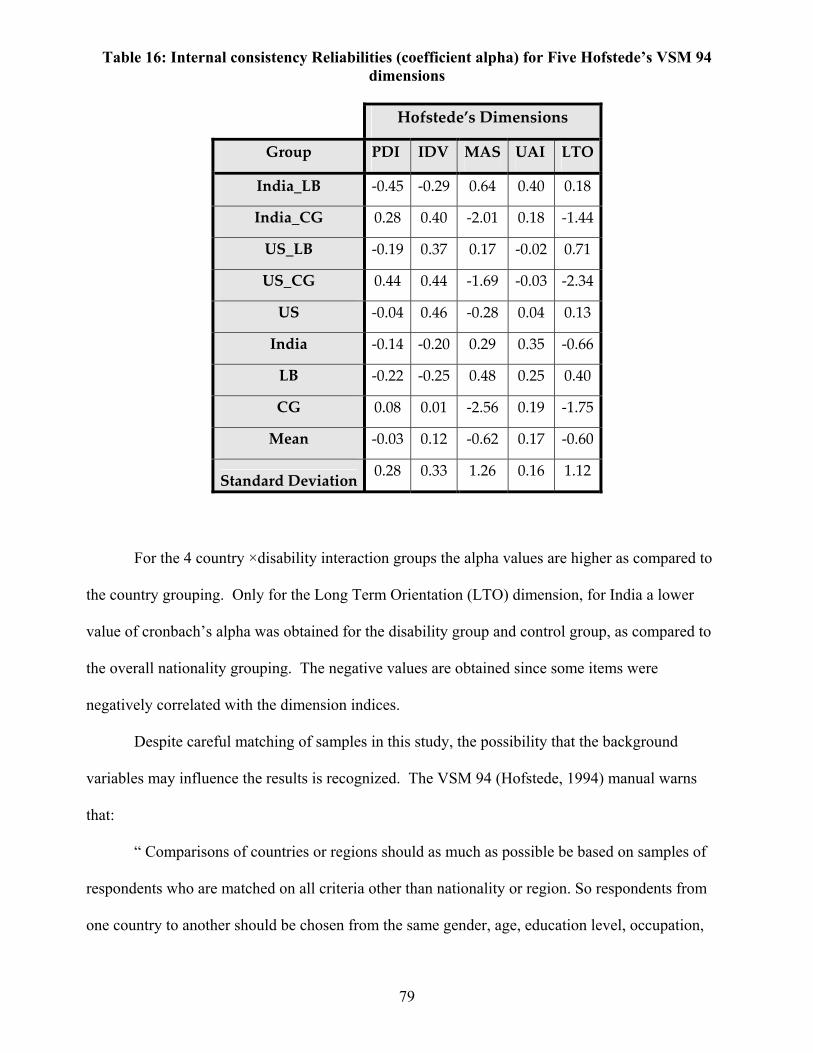
79
Table 16: Internal consistency Reliabilities (coefficient alpha) for Five Hofstede’s VSM 94 dimensions
Hofstede’s Dimensions
Group PDI IDV MAS UAI LTO
India_LB -0.45 -0.29 0.64 0.40 0.18
India_CG 0.28 0.40 -2.01 0.18 -1.44
US_LB -0.19 0.37 0.17 -0.02 0.71
US_CG 0.44 0.44 -1.69 -0.03 -2.34
US -0.04 0.46 -0.28 0.04 0.13
India -0.14 -0.20 0.29 0.35 -0.66
LB -0.22 -0.25 0.48 0.25 0.40
CG 0.08 0.01 -2.56 0.19 -1.75
Mean -0.03 0.12 -0.62 0.17 -0.60
Standard Deviation 0.28 0.33 1.26 0.16 1.12
For the 4 country ×disability interaction groups the alpha values are higher as compared to
the country grouping. Only for the Long Term Orientation (LTO) dimension, for India a lower
value of cronbach’s alpha was obtained for the disability group and control group, as compared to
the overall nationality grouping. The negative values are obtained since some items were
negatively correlated with the dimension indices.
Despite careful matching of samples in this study, the possibility that the background
variables may influence the results is recognized. The VSM 94 (Hofstede, 1994) manual warns
that:
“ Comparisons of countries or regions should as much as possible be based on samples of
respondents who are matched on all criteria other than nationality or region. So respondents from
one country to another should be chosen from the same gender, age, education level, occupation,
80
manager/non-manger status, employer etc. They should be matched on any criterion other than
nationality that can be expected to affect the answers.”
The participants recruited for this study were matched in most of the criteria mentioned in
the VSM manual. However the occupation, manager/non-manager status and employer could not
be perfectly matched between and within the subject groups. Since perfect matching of the
participants could not be achieved, the reliabilities could have been affected and therefore be
considerably low. According to Hofstede (2002) despite of poor matching of sampling of criteria,
some studies have still found significant correlations with the original country index scores.
Hofstede (2002) further justifies that although due to the low internal consistency of the scale the
construct validity of the questionnaire may be questioned, testing the internal consistency of a cross-
cultural instrument is a job for which the instrument is not prepared. Hofstede (2002) continues to
explaining that the reliability of an instrument can be implicitly tested through its proven validity.
An unreliable test will not produce valid results, so if validity is proven the reliability can be
assumed (Hofstede, 2002). The validity can be shown by correlating the test results to theory and
logical explanations. The next section provides descriptive statistics of the cultural dimensions for
the 4 cultural groups, with an explanation of mean score differences.
5.2.1 Data Analysis of Cultural Dimension Scores This section tests for the first set of hypothesis on cultural dimensions. The hypotheses that
related to the cultural dimensions of the disability groups were:
1.A. The cultural dimension scores on the VSM 94 for users with disabilities will differ from those without disabilities, within the same nationality group 1.B. The cultural dimension scores for each disability group in India will differ from the corresponding group in the United States.
Cultural Dimensions were calculated using the formulae in Hofstede (1994)’s VSM manual.
The VSM 94 is a Likert-type ratings questionnaire with 20 questions, and the formulae that

81
calculate each dimension index are listed in (Appendix A). The mean scores and standard errors of
the four groups are listed in Table 17.
Table 17: Summary of Dimension Scores and Standard Error of VSM 94
Group
Cultural Dimension India_LB India_CG US_LB US_CG PDI 54.44(15.63) 57(9.03) 12.63(12.66) 37(15.10) IDV 94.72(13.76) 75.66(16.73) 74.21(8.49) 111.33(7.5) MAS 60.55(21.86) 21(29.69) 18.42(22.79) 13.33(24.98) UAI 53.33(12.66) 16.33(17.15) 74.47(15.09) 22.33(13.2) LTO 34.44(8.05) 42.66(7.77) 42.1(5.27) 37.33(8.4) Sample size n=18 n=16 n=19 n=16
Table 18: Ranking of the Cultural Groups in terms of Dimension Scores
Cultural Dimension India_LB India_CG US_LB US_CG PDI 2 1 4 3 IDV 2 3 4 1 MAS 1 2 3 4 UAI 2 4 1 3 LTO 4 1 1 3
Note: Rank 1= Highest Score

82
0
20
40
60
80
100
120
PDI IDV MAS UAI LTO
Hofstedeʹs Dimensions
Dim
ensi
on S
core
India_LBIndia_CGUS_LBUS_CG
Figure 18: Graph Showing the Mean Dimension scores for 4 cultural groups
Questionnaire responses were summarized and a multivariate analysis of variance
(MANOVA) was performed to test differences among the 4 nationality specific and disability
specific groups on the five dimensions. MANOVA is performed as a repeated measures and the
time variable is assigned to the five cultural dimensions that are calculated using the VSM 94
formulae. The MANOVA results for main effect measures are summarized in Table 19.
Table 19: MANOVA results of Dimensions, Disability and Country Effects
3 Note: Time Effect=Cultural Dimension Effect
Wilk’s Lambda F Pvalue Time effect3 0.511 F(4,60)=14.030 p<0.0001 Time × Disability effect
0.839 F(4,60)=2.87 p=0.03
Time× Country effect 0.90 F(4,60)=1.55 p=0.19 Time×Disability× Country effect
0.90 F(4,60)=1.55 p=0.198

83
The results of the MANOVA indicate that a significant effect of time exists. The
F(4,60)=13.03 and the p-value<0.0001. This indicates that there exists a significant difference in
the mean scores of the dimensions indices. Significant differences also exists in the time×disability
interaction effect, where F(4,60)=2.87 and p-value=0.03. This indicates that the means scores of
the dimension indices differ for the legally blind disability and control groups. The results of the
MANOVA are further explored using an ANOVA model.
An informative technique using Analysis of Variance (ANOVA) to test for the differences in
cultural dimensions (dependent variables) was also applied, which allows for statistical
confirmation of the hypotheses. A two way 2×2 ANOVA was performed using the General Linear
Model. The dependent variables were the scores on the five dimensions; the independent variables
were the identified as nationality and disability. Nationality has 2 levels, 1: India and 2: United
States, and disability has 2 levels, 1: Legal Blindness and 2: Control Group (with no apparent
disability). Results of the ANOVA type III model were reported, since sample sizes were different
in each cell. For all analyses statistical significance was set at a level of 0.05. Table 20 below
summarizes the significant effects of the country, disability independent variables on the dependent
variables. The MAS and LTO dependent variables showed no significant effects.
Table 20: Summary of Significant effects of Cultural Dimensions with Disability and Country Sources
Dependent
Variable
Source F value P-value
PDI Country F(1,63)=5.09 p=0.03
IDV Disability×Country F(1,63)=5.37 p=0.03
UAI Disability F(1,63)=9.17 p=0.001

84
The three dependent variables that showed significant effects on the disability and country
sources were PDI, IDV and UAI dimensions. For the dependent variable Power Distance Index
PDI, the independent variable Country showed significant effects, with F(1,63)=5.08 and p-
value=0.03. With the post-hoc test of LS Means it was found that, p=0.027 and for (Country=1)
India, the mean PDI score was 55 and for (Country=2) the United States the mean PDI score was
24. No significant effects were found for disability and Disability×Country variables. For the
dependent variable of Individualism IDV the interaction of Disability×Country showed significant
effects, with F(1,63)=5.37 and p-value=0.03. The post-hoc test of Least Square Difference (LS
Means) p-value=0.05 showed differences in the India Control Group, with IDV mean score of 75
and the United States Control Group with a IDV mean score of 111.33. The post-hoc test of LS
Means p-value=0.03 showed differences in the United States Legally Blind Group, with IDV mean
score of 74 and the United States Control Group with a IDV mean score of 111.33. Figure 19 shows
a graph depicting the interaction effect of Country and Disability on the IDV index.
0
20
40
60
80
100
120
Disability Group
IDV
Mea
n Sc
ore
India 94.72 75.66
United States 74.21 111.33
Legally Blind Control Group
Figure 19: Interaction effect of IDV Dimension index
For the dependent variable Uncertainty Avoidance Index (UAI) the independent variable
Disability showed significant effects, with F(1,63)=9.17 and p-value=0.001. With the post-hoc test
of Tukey’s LSD it was found that, p=0.003 and for (disability=1) Legally Blind Group, the mean

85
UAI score was 63.903 and for (disability=2) the Control Group the mean UAI score was 19.33. No
significant effects were found for country and disability×country variables.
5.2.2 Explanation of Differences in Cultural Dimension Scores
The Power Distance Index score was tested to be significantly different between the two
countries. Moreover it was found that the mean score of India was greater than the United States
mean score. This is commensurate with Hofstede (1990)’s findings that India has Power Distance
(PDI) as the highest Hofstede Dimension for the culture, with a ranking of 77 compared to a world
average of 56.5. This Power Distance score for India indicates a high level of inequality of power
and wealth within the society. This condition is not necessarily subverted upon the population, but
rather accepted by the population as a cultural norm. Also according to his findings United States
has a Power Distance (PDI) score of 40, compared to the world Average of 55. This is indicative of
a greater equality between societal levels, including government, organizations, and even within
families. This orientation reinforces a cooperative interaction across power levels and creates a
more stable cultural environment. Since no significant effects were found between the disability
groups and the country specific disability groups, it may be concluded that the nationality overrides
the power distance dimension.
Comparing the control groups, the mean of IDV dimension India has a lower score
compared to US. This is in concordance with Hofstede (1990)’s findings where he found that India
is more collectivist than the US therefore would score lower in the IDV means score. When the
mean scores of the legally blind groups are compared to the corresponding control groups it was
found that the India Legally blind group had a mean (94.72) greater than its control group (75.66).
Comparing the groups in the US, it was observed that the mean IDV score of the legally blind group
(74.21) was lower than the Control group mean score (111.33). This was an interesting finding as
according to Hofstede (2000)’s literature, as IDV is negatively correlated to the country’s GDP. A
country that has high GDP and economic, has more rights and legislation for their population with
86
disabilities. According to Westbrook, Legge and Pennay (1993), Individualistic and Collectivist
societies deal differently with disabilities (Hofstede, 2000). In individualistic societies, people with
disabilities plan for the future as a normal population would. They are more cheerful, optimistic
and they resent dependency. However in collectivist societies there is more of an association of
shame, grief and guilt with disability. This also explains that the IDV scores of legally blind group
in India (a collectivist country) are greater than that of the legally blind group in the US. The higher
IDV score describes that the feeling of community and societal inclusion is lacking, in the India
(legally blind) disability group.
Both the legally blind groups show a greater UAI score than their corresponding control
groups in each country. Uncertainty avoidance dimension in a culture is defined as a measure of
preference for strict laws and regulations over ambiguity and risk (Hofstede, 1994). People with
disabilities, especially with visual disabilities would like to avoid any form of uncertainty and risk.
This would lead to them scoring higher on the UAI dimension as compared to the control groups in
their respective countries. Avoiding uncertainty can related to the need for clear and important
feedback to avoid any ambiguity as well. People with disabilities would prefer to avoid such
situations and therefore score higher on the uncertainty avoidance index.
5.3 Comparison of Cell Phone Hardware Ratings Hypothesis 2: The Hardware Attributes of the Cell Phone will be rated differently by the Nationality groups, Disability group and the interaction of Nationality × Disability groups The above stated hypothesis was tested by applying a 2 (Nationality) × 2 (disability type)
ANOVA, on the total hardware ratings and the ratings of the 17 Hardware Features. Table 21 lists
the means and standard deviations for each hardware attribute rating for the nationality × disability
interaction groups.

87
1
1.5
2
2.5
3
3.5
4
4.5
5
5.5
6
Siz
e
Sha
pe
Wei
ght
Feel
whe
n di
alin
g
Feel
whe
n ho
ldin
g (to
spea
k) Key
siz
e
Key
sha
pe
Eas
e of
pre
ssin
g bu
ttons
Eas
e of
read
ing
labe
ls o
nth
e ke
ys/b
utto
ns
Siz
e of
the
LCD
scr
een
Eas
e of
ope
ning
the
LCD
scre
en
Rot
atin
g th
e LC
D s
cree
n
Con
trast
of t
he L
CD
scre
en
Brig
htne
ss o
f the
LC
Dsc
reen
Font
siz
e of
men
us
Ove
rall
look
Ove
rall
satis
fact
ion
Cell Phone Hardware Attribute
Mea
n R
atin
gs
India_LBIndia_CGUS_LBUS_CG
Figure 20: Graph of Mean Ratings of Cell Phone Hardware Attributes

88
Table 21: Mean and Standard Deviations of Cell Phone Hardware Ratings
Group India_LB India_CG US_LB US_CG
Cell Phone Hardware Feature Mean SD Mean SD Mean SD Mean SD
Size 3.72 1.07 2.63 1.09 4.37 1.67 2.20 0.75Shape 3.89 1.02 3.56 1.46 4.21 1.78 3.93 1.24Weight 3.22 1.66 2.44 1.26 4.21 1.69 2.67 1.40Feel when dialing 3.61 1.61 4.50 1.03 4.89 1.20 3.67 1.14
Feel when holding 4.06 1.51 4.31 0.95 5.05 0.85 4.40 1.02Key size 3.22 1.59 4.81 1.11 4.11 1.66 3.73 1.34Key shape 3.33 1.64 4.88 0.96 4.53 1.43 3.60 1.25Ease of pressing buttons 4.00 1.46 4.88 1.26 3.95 1.61 4.60 0.71
Ease of reading labels on the keys/buttons 3.06 1.76 5.13 0.89 3.58 1.74 4.53 1.45Size of the LCD screen 4.65 1.11 5.56 0.63 4.68 1.34 5.67 0.47
Ease of opening LCD 4.88 0.86 5.00 1.26 5.11 1.24 4.93 1.18Rotating the LCD screen 4.65 1.27 5.31 1.35 5.74 0.45 4.93 1.06Contrast of the LCD screen 5.35 0.61 5.44 0.51 4.68 1.67 5.47 0.50
Brightness of the screen 4.94 1.14 5.44 0.73 5.11 1.41 5.47 0.62Font size of menus 3.35 1.73 4.94 0.93 4.05 1.99 4.93 0.93Overall look 4.61 1.42 4.13 1.02 4.74 1.63 3.27 1.06
Overall satisfaction 4.17 1.42 4.13 0.72 4.68 1.29 3.60 0.71Total Hardware Rating 69.41 2.4 77.06 2.5 77.68 2.3
71.6
2.62
Sample size for the ANOVA was n = 67 due to incomplete questionnaires by some users.
For the total hardware rating, significant differences were found between groups on the basis of the
country × disability interaction, with F(1,63)=7.57, p-value=0.007. As expected the cell phones
were rated higher by the control groups as compared to the legally blind group since the test phone

89
model had few accessibility features. From the LS Means post hoc tests (α=0.05) it was found that
the India Legally Blind (M=69.41, SD=2.4) and India control Group (M=77.06, SD=2.5) were
significantly different (p-value=0.093). Also was found that the US Legally Blind (M=77.67,
SD=2.3) and US control Group (M=71.6, SD=2.62) were significantly different (p=0.01).
The preference of the Size of the LCD screen of the test phone model significantly differed
on the basis of the disability groups, with F(1,63)=14.96 and p-value=0.0002. The legally blind
groups rated the preference of the size of the LCD screen lower as compared to the control group.
From the LS Means post-hoc tests (α=0.05) it was found that the Legally Blind Group (M=4.66,
SD=1.2) and Control Group (M=5.46, SD=.86) were significantly different (p=0.0002). There were
no significant effects of country or country × disability interaction.
The preference of font size on the menus of the cell phone test model also significantly
differed on the basis of the disability groups as well, with F(1,63)=11 and p-value=0.001. The
legally blind groups rated the preference of font size on the menus lower as compared to the control
group. From the LS Means post hoc tests (α=0.05) it was found that the Legally Blind Group
(M=3.70, SD=1.53) and Control Group (M=4.93, SD=0.93) were significantly different (p=0.001).
There were no significant effects of country or country × disability interaction.
Sample size for the remaining ANOVAs was n = 68 due to incomplete questionnaires by
some users.
The preference of the Size of the phone of the test phone model significantly differed on the
basis of the disability groups, with F(1,64)=29.90 and p-value=0.0001. The legally blind groups
rated the preference of the size of the phone higher as compared to the control groups. From the LS
Means post-hoc tests (α=0.05) it was found that the Legally Blind Group (M=4.04, SD=1.52) and
Control Group (M=2.41, SD=.89) were significantly different (p<0.0001). There were no
significant effects of country or country × disability interaction.
The preference of the Weight of the phone of the test phone model significantly differed on
the basis of the disability groups as well, with F(1,64)=9.65 and p-value=0.0028. The legally blind

90
groups rated the preference of the weight of the phone higher as compared to the control groups.
From the LS Means post-hoc tests (α=0.05) it was found that the Legally Blind Group (M=3.7,
SD=1.36) and Control Group (M=2.55, SD=1.32) were significantly different (p=0.0028). There
were no significant effects of country or country × disability interaction.
The preference of the Ease of pressing the keys/buttons of the test phone model significantly
differed on the basis of the disability groups, with F(1,64)=5.51 and p-value=0.02. The legally
blind groups rated the Ease of pressing the keys/buttons of the phone lower as compared to the
control groups. From the LS Means post-hoc tests (α=0.05) it was found that the Legally Blind
Group (M=3.97, SD=1.55) and Control Group (M=4.73, SD=1.02) were significantly different
(p=0.02). There were no significant effects of country or country × disability interaction.
The Ease of reading the Menu labels of the test phone model significantly differed on the
basis of the disability groups as well, with F(1,64)=16.32 and p-value=0.0001. The legally blind
groups rated the Ease of pressing the keys/buttons of the phone lower as compared to the control
groups. From the LS Means post-hoc tests (α=0.05) it was found that the Legally Blind Group
(M=3.31, SD=1.75) and Control Group (M=4.83, SD=1.53) were significantly different
(p=0.0001). There were no significant effects of country or country × disability interaction.
For the feel of the phone when dialing rating, significant differences were found between
groups on the basis of the country × disability interaction, with F(1,64)=11.46, p-value=0.0079.
As expected the cell phones were rated higher by the control groups as compared to the legally
blind group. From the LS Means post hoc tests (α=0.05) it was found that the India Legally Blind
(M=4.06, SD=1.51) and India control Group (M=4.5, SD=1.03) were significantly different
(p=0.093). Also was found that the US Legally Blind (M=4.89, SD=1.2) and US control Group
(M=3.66, SD=1.34) were significantly different (p=0.01).
For the preference in key size on the test phone significant differences were found between
groups on the basis of the country × disability interaction, with F(1,64)=11.46, p-value=0.0079.
From the LS Means post-hoc tests (α=0.05) it was found that the India Control Group (M=4.81,

91
SD=1.11) and US Control Group (M=3.73, SD=1.34) were significantly different (p=0.04). Also
was found that the India Legally Blind (M=3.22, SD=1.59) and US Legally Blind (M=4.11,
SD=1.66) were significantly different (p=0.0025).
The Overall look and feel ratings of the test phone model significantly differed on the basis
of the disability groups as well, with F(1,64)=9.00 and p-value=0.0038. The legally blind groups
rated the Overall Look and feel of the phone higher as compared to the control groups. From the
LS Means post-hoc tests (α=0.05) it was found that the Legally Blind Group (M=4.67, SD=1.51)
and Control Group (M=3.68, SD=1.04) were significantly different (p=0.003). There were no
significant effects of country or country × disability interaction.
The overall satisfaction ratings of the test phone model significantly differed on the basis of
the disability groups as well, with F(1,64)=4.27 and p-value=0.04. The legally blind groups rated
the overall Satisfaction of the phone higher as compared to the control groups. From the LS Means
post-hoc tests (α=0.05) it was found that the Legally Blind Group (M=4.4, SD=1.35) and Control
Group (M=3.68, SD=0.71) were significantly different (p=0.04). There were no significant effects
of country or country × disability interaction.
Looking at the above found results where the main effects mainly were found on the basis of
disability (or control) group, it may be concluded that the influence of nationality is minimum on
the physical aspects of the hardware design of the cell phone. The next section explores the
influence of disability and nationality of software usability ratings.

92
5.4 Comparison of Software Usability Ratings
The first few hypotheses in this section are related to the cultural dimension scores of the
different groups. Therefore the groups were ranked according to their cultural dimension scores as
shown in Table 18. The following are the set of hypotheses tested for the software usability
attributes ratings.
Hypothesis 3.A: The group with higher uncertainty avoidance will have higher ratings on all the tasks. The Group identified by ranking (according to higher mean scores) the UAI scores is the
Legally Blind Group in the United States (US_LB Rank=1). Descriptive statistics are reported to
test this hypothesis.
The United States legally blind group does not rate the usability of the any of the tasks
higher than the other group. This is due to the fact that most of the participants could not see the
screen due to their visual disability and therefore could not complete the task. The low scores
indicated that the participants rated the usability of the interface, very bad, very difficult, not easy.
Hypothesis 3.B: The group with a low individualism (therefore collectivist) score will rate significantly higher on the task sending an SMS. The groups identified by ranking the IDV scores are the India Control Group (India_CG
Rank=3) and United States Legally Blind (US_LB Rank=4). Looking at the descriptive statistics of
the total score of the task sending a text message, it was found that the India Control Group rated
this task higher than the other groups. This indicates that this group rated the task higher, as there
were more responses on very good, very easy spectrum of the scale. This finding is in concordance
with (Kim et al., 2003)’s findings that the use of SMS is higher in a collectivist society. Due to
more frequency of use and familiarity with this feature this group must have rated this feature
higher as compared to the other groups. Also in the test phone model, there is use of the term SMS,
which was not a familiar term with the US population. While comparing the legally blind groups as

93
well, it was also found that this task was rated higher by the India group as compared to the US
group.
3.C. The group with a high individualism score will have a significantly higher score on the overall usability rating on the task of setting the ring-tone. The group identified by ranking the IDV scores is the US Control Group (US_CG Rank=1).
Observing descriptive statistics for the overall usability rating of the task setting the ringtone it was
found that the United States Control group did not have the higher usability rating among the four
groups. It was observed that the India Control group had a higher score on the total usability ratings
of this task. This can be explained with the focus group discussion results which are summarized in
the Qualitative data analysis section. It was found that the India control group was more familiar
with the concept of Profiles and frequently changed their ringtone as compared to the US group.
The US group was more familiar with the term ‘mode’ as compared to profile and therefore found
this task more difficult, as compared to the India group. This can be explained with the statistics on
the cell phone model owned found in Figure 17. It was observed that in the US the more popular
cell phone model was Motorola, which uses the term mode (Manner mode, Silent mode, Normal
mode), whereas in India the more popular phone was Nokia which used the term ‘profiles’ for
personalizing their interface. The test phone used in this study also used the term ‘profiles’
therefore the India groups were more comfortable performing this task.
3.D. The Overall Software Usability Attributes will be rated significantly different by the Nationality groups, Disability group and the interaction of Nationality × Disability groups 3.E. The General Features of the use of the cell phone features will be rated significantly different by the Nationality groups, Disability group and the interaction of Nationality× Disability groups. The above stated 2 hypotheses were tested using a 2×2 ANOVA model which was applied
to the all the task rating items (dependent variables).
The overall software usability of a task was the sum of the attributes:
• Ease of completing the task
• Ease of locating a function in the menu hierarchy

94
• Ease of identifying relevant keys on the phone keypad
• Meaningfulness of the icons associated with specific functions
• Ease of understanding the menu labels for each function
• Feedback of the phone when performing tasks
The three general questions on the cell phone feature were:
• Importance of this cell phone function
• Frequency of using this feature
• Function is essential in cell phone
The results of the hypothesis tests are summarized for each of the tasks:
5.4.1 Placing a Call
For the overall usability rating of the task placing a call a 2×2 ANOVA was applied
with disability and country as predictors. The three general questions on the cell phone features,
were Importance of this cell phone function, Frequency of using this feature, whether the function is
essential in cell phone. A 2×2 ANOVA was applied to all these three dependent variables as well,
with disability and country as predictors. The overall rating of the task placing a call on the test
phone model significantly differed on the basis of the disability groups, with F(1,63)=6.34 and p-
value=0.014. The legally blind groups rated the task placing a call lower as compared to the control
groups. From the LS Means post-hoc tests (α=0.05) it was found that the Legally Blind Group
(total=42.35) and Control Group (total=47.18) were significantly different (p=0.01). There were no
significant effects of country or country × disability interaction.
5.4.2 Storing a Number
The overall rating of task of storing a number on the test phone model significantly differed
on the basis of the disability groups, with F(1,55)=19.94 and p-value<0.0001. The legally blind
groups rated the task placing a call lower as compared to the control groups. From the LS Means

95
post-hoc tests (α=0.05) it was found that the Legally Blind Group (total=19.95) and Control Group
(total=28.218) were significantly different (p<0.0001). There were significant effects on the basis
of disability × country on the overall rating of storing a number as well, with F(1,55)=4.52 and p-
value=0.03. From the LS Means post-hoc tests (α=0.05) it was found that the India Legally Blind
Group (total=18.73) and India Control group (total=30.90) were significantly different (p<0.0001).
The rating of Importance of this cell phone function was rated significantly different by
group on the basis of disability, with F(1,57)=7.14 and p-value=0.009. From the LS Means post-
hoc tests (α=0.05) it was found that the Legally Blind group (M=4.8, SD=1.52) and Control group
(M=5.73, SD=.22) were significantly different (p=0.0098). The importance of storing a number
was also rated significantly differently on the basis of nationality groups, with F(1,57)=8.26 and p-
value=0.005. From the LS Means post-hoc tests (α=0.05) it was found that the India Group
(M=5.71, SD=.24) and US group (m=4.82, SD=1.02) were significantly different (p=0.0005).
The Frequency of using the feature of storing a phone number was rated significantly
different by group on the basis of disability, with F(1,57)=5.97 and p-value=0.01. The legally blind
group rated with feature lower, indicating that they use it less frequently. From the LS Means post-
hoc tests (α=0.05) it was found that the Legally Blind group (M=4.43, SD=1.13) and Control group
(M=5.43, SD=0.38) were significantly different (p=0.01). The frequency of using the feature of
storing a number was also rated significantly differently on the basis of nationality groups, with
F(1,57)=14.33 and p-value=0.004. From the LS Means post-hoc tests (α=0.05) it was found that
the India Group (M=5.59, SD=.33) and US group (M=4.18, SD=1.53) were significantly different
(p<0.0001). There were significant effects on the basis of disability ×country on storing a number as
well, with F(1,57)=5.76 and p-value=0.05. From the LS Means post-hoc tests (α=0.05) it was
found that the India Legally Blind group (M=5.59, SD=.44) and US Legally Blind Group (M=4.18,
SD=1.03) were significantly different at (p=0.005) and US legally blind group (M= 3.36, SD=1.2)
was significantly different from the US control group (M=5.6, SD=.35)

96
The ratings of whether the function of storing a cell phone is essential in cell phone, was
rated significantly different by groups on the basis of nationality/country, disability and
country×disability interaction groups as well. This item was rated significantly differently by groups
on the basis of disability, with F(1,57)=11.46, p-value 0.0013. From the LS Means post-hoc tests
(α=0.05) it was found that the Legally Blind group (M=4.85, SD=1.1) Control group (M=5.77,
SD=1.3) were significantly different (p=0.0013). This item was rated significantly differently by
groups on the basis of country as well, with F(1,57)=11.77, p-value=0.0011. From the LS Means
post-hoc tests (α=0.05) it was found that the India group (M=5.78, SD=.21) and US group
(M=4.84, SD=1.21) were significantly different (p=0.0011). This item was rated also significantly
differently by groups on the basis of disability ×country interaction as well, with F(1,57)=13.07, p-
value 0.0006. From the LS Means post-hoc tests (α=0.05) it was found that the India Legally Blind
group (M=5.18, SD=.79) and US Legally Blind group (M=3.89, SD=1.2) were significantly
different (p=0.0006) and US Legally Blind group (M=3.89, SD=1.2) and US Control Group
(M=5.8) were significantly different (p=0.0006).
5.4.3 Changing the Ringtone
The overall rating of changing the ringtone on the test phone model significantly differed on
the basis of the nationality groups, with F(1,61)=12.13 and p-value=0.0009. The India groups
rated the changing the ringtone higher as compared to the US groups. From the LS Means post-hoc
tests (α=0.05) it was found that the India Group (total=19.46) and Control Group (total=13.83) were
significantly different (p<0.0002). The overall rating of changing the ringtone significantly
different on the basis of disability as well, with F(1,62)=6.46 and p-value=0.0135. From the LS
Means post-hoc tests (α=0.05) it was found that the Control Group (total=14.59) ratings where
significantly higher than the legally blind disability group (total=18.70).
The rating of Importance of this cell phone function (Changing the Ringtone) was rated
significantly different by groups on the basis of disability, with F(1,62)=4.06 and p-value=0.04.
From the LS Means post-hoc tests (α=0.05) it was found that the Legally Blind group (M=5.06,

97
SD=.89) and Control group (M=4.3, SD=1.2) were significantly different (p=0.04). This was an
interesting observation since the ringtone feature is used as caller identification by legally
blind/visually impaired groups (since they are unable to see the screen) and hence could be of more
importance to them. The importance of changing a ringtone feature was also rated significantly
different on the basis of disability ×nationality groups, with F(1,57)=8.26 and p-value=0.005.
From the LS Means post-hoc tests (α=0.05) it was found that the India Legally Blind Group
(M=5.5, SD=1.1) and US Legally Blind group (M=3.36, SD=1.3) were significantly different
(p=0.0005).
The Frequency of using the feature of changing the ringtone was rated significantly different
by group on the basis of disability, with F(1,62)=4.18 and p-value=0.04. The legally blind group
rated with feature higher, indicating that they use it more frequently. From the LS Means post-hoc
tests (α=0.05) it was found that the Legally Blind group (M=4.43, SD=1.31) and Control group
(M=3.67, SD=1.2) were significantly different (p=0.01). The frequency of using the feature of
changing the ringtone was also rated significantly different on the basis of nationality groups, with
F(1,62)=8.45 and p-value=0.0051. From the LS Means post-hoc tests (α=0.05) it was found that
the India Group (M=4.43, SD=.89) and US group (m=3.36, SD=1.22) were significantly different
(p=0.04). There were significant effects on the basis of disability ×country on storing a number as
well, with F(1,62)=8.12 and p-value=0.0059. From the LS Means post-hoc tests (α=0.05) it was
found that the India Legally Blind group (M=5.5) and US Legally Blind Group (M=3.36) were
significantly different at (p=0.005) and India legally blind group (M= 5.5) was significantly
different from the India control group (M=3.68) (at p=0.005).
The ratings of whether the function of changing the ringtone is essential in a cell phone, was
rated significantly different by groups on the basis of nationality/country, groups, with
F(1,62)=4.18 and p-value=0.032. From the LS Means post-hoc tests (α=0.05) it was found that the
India group (M=5.09, SD=.72) and US group (M=4.29, SD=1.21) were significantly different
(p=0.0032).

98
5.4.4 Sending a Text Message
The overall rating of task of sending a text message on the test phone model significantly
differed on the basis of the disability groups, with F(1,62)=57.11 and p-value<0.0001. The legally
blind groups rated the task sending a text message lower as compared to the control groups. From
the LS Means post-hoc tests (α=0.05) it was found that the Legally Blind Group (total=18.27) and
Control Group (total=27.27) were significantly different (p<0.0001).
The rating of Importance of this cell phone function (Sending a Text Message) was rated
significantly different by groups on the basis of country, with F(1,62)=8.97 and p-value=0.0039.
From the LS Means post-hoc tests (α=0.05) it was found that the India group (M=6.0, SD=0) and
US group (M=3.45, SD=1.2) were significantly different (p=0.04).
The Frequency of using the feature of sending a text message was rated significantly
different by group on the basis of disability, with F(1,62)=15.4 and p-value=0.0002. The legally
blind group rated with feature lower, indicating that they use it less frequently. From the LS Means
post-hoc tests (α=0.05) it was found that the Legally Blind group (M=3.01, SD=1.23) and Control
group (mean=4.37) were significantly different (p=0.0002). The frequency of using the feature of
sending a text message was also rated significantly different on the basis of nationality groups, with
F(1,62)=54.2 and p-value<0.0001. From the LS Means post-hoc tests (α=0.05) it was found that
the India Group (M=4.96, SD=.82) and US group (M=2.42, SD=1.3) were significantly different
(p=0.04).
The ratings of whether the function of sending a text message is essential in a cell phone,
was rated significantly different by groups on the basis of nationality/country, groups, with
F(1,62)=44.63 and p-value<0.0001. From the LS Means post-hoc tests (α=0.05) it was found that
the India group (M=5.76, SD=.11) and US group (M=3.31, SD=1.22) were significantly different
(p<0.0001).

99
Overall it was observed that for all the four tasks, significant effects were found on factors
of country, disability and the interaction between the two, on the usability ratings and general
features ratings. This indicates that the presence (and absence) of a disability, plays a more
important role in the rating of attributes of hardware/accessibility features. However nationality
(which can be disability specific) plays an important role in the rating of usability features of the
interface.
5.5 Data Analysis of Cell Phone Interface Feature Ratings
The participants in this research study completed a cell phone interface feature ratings
questionnaire at the end of the focus group session. The features that were included in this
questionnaire were described the Methods section. The responses from the ratings questionnaire
were summarized and mean ratings were calculated for each group. Figure 21 summarizes the
mean ratings on items of the Interface ratings questionnaire (Appendix E). This section provides
results of the tests of the following hypotheses relating to the cell phone interface ratings.
4.A The cell interface feature preferences will be rated significantly different by the Nationality groups, Disability groups and the interaction of Nationality × Disability groups.
The above stated hypotheses were tested by applying a 2 (Nationality) × 2 (disability type)
ANOVA, on the cell phone interface ratings and the ratings on the 14 features. The significant
effects found are summarized in Table 23, which includes the mean scores from the LS Means post-
hoc test.

100
Table 22: Summary of Mean Ratings and Standard Deviations of Interface Ratings
Mean Ratings and Standard Deviation
Cell phone Interface item India_CG SD India_LB SD US_CG SD US_LB SD Minimal Keystrokes 3.69 1.14 4.61 0.98 4.60 0.51 4.58 0.51Secondary info 2.75 1.06 4.28 0.89 3.23 0.94 4.26 0.73Variety of Contents 3.88 1.02 4.17 0.92 3.40 0.74 3.89 1.37Menu Labeling 4.19 0.83 4.06 1.06 4.07 0.59 4.53 0.84Screen space utilization 4.31 0.70 3.44 1.58 4.27 0.59 4.63 0.76 Large amt. of info. (screen) 3.38 1.31 3.56 1.46 3.27 0.70 3.58 1.50Personalizable interface 3.81 1.11 4.61 0.61 3.47 1.25 4.05 1.03Familiar interface 3.75 0.93 3.50 1.20 4.40 0.63 4.21 1.13Using default folders 4.00 1.03 3.94 0.94 3.27 0.88 3.74 1.24Softkey functions 4.06 0.93 4.50 0.62 3.73 1.03 4.16 0.90 Programmable softkeys 3.81 0.98 4.06 1.06 3.33 1.23 4.37 0.68Group SMS 3.63 1.26 3.61 1.50 3.00 1.07 2.32 1.29Variety of fonts 3.50 1.15 3.06 1.51 3.07 1.22 4.26 1.05Aesthetic appeal 4.56 1.03 3.78 1.22 4.13 0.83 4.05 1.22

101
0
1
2
3
4
5
Min
imal
Key
stro
kes
Seco
ndar
y in
fo
Var
iety
of
Con
tent
s
Men
u La
belin
g
Scre
en s
pace
utili
zatio
n
Lar
ge a
mt.
of in
fo.
(scr
een)
Pers
onal
izab
lein
terf
ace
Fam
iliar
inte
rfac
e
Usi
ng d
efau
ltfo
lder
s
Softk
ey fu
nctio
ns
Pro
gram
mab
leso
ftkey
s
Gro
up S
MS
Var
iety
of f
onts
Aes
thet
ic a
ppea
l
Cell Phone Features
Mea
n Ra
tings
India - CG India - LB US - CG US - LB
Figure 21: Graph Comparing Means Scores of Interface Ratings for Disability×Country
Interaction Groups

102
Table 23: ANOVA significant effects on the Mean Ratings of Cell phone Interface Features
Cell Phone Attributes Main Effects F (1,64) p- Value
Mean Scores from LS Means
Disability 5 0.02 LB= 4.59 CG=4.14 Country 4.76 0.03 I= 4.5 US=4.5
DisabilityxCountry 5.48 0.02 I-LB=4.6 I-CG=3.6 Minimal Steps or Keystrokes
I-CG= 3.68 US-CG=4.6 Secondary
information Disability 33.45 <0.0001 LB= 4.2 CG= 2.9 Country 5.38 0.023 I= 3.8 US= 4.44
DisabilityxCountry 6.28 0.014 I-LB=3.44 I-LB=3.44 Efficient screen
space utilization
US-LB= 4.63 I-CG= 4.31 Personalizable
interface (Concept of
Profiles) Disability 7.9 0.065 LB=4.33 CG= 3.63 Country 3.37 0.07 I= 4.2 US= 3.7
Familiar interface Country 7.53 0.0079 I= 3.62 US= 4.3 Softkey, shortcut functions Disability 4.1 0.047 LB= 4.32 CG= 3.89
Programmable softkeys Disability 4.1 0.04 LB= 4.21 CG= 3.57
Group SMS Country 9.2 0.003 I= 3.6 US= 2.65 DisabilityxCountry 7.29 0.0089 I-LB= 3.05 US-LB= 4.2 Variety of
fonts and font sizes US-LB= 4.2 US-CG=3.06
5.5.1 Relationship between Interface Ratings and Cultural Dimensions
The following hypothesis was tested to find the relationship between interface ratings and
cultural dimension scores.
4.B The scores of the interface preferences will be related to the corresponding group cultural dimension score. A group level analysis was undertaken and the means scores on the preferences of the cell
phone interface features were observed. The significant effect of the Disability variable was found
on the mean score of the feature of cell phone Minimum steps or Key strokes, which was rated
significantly higher by the legally blind group as compared to the control group. This could be

103
related to the underlying cultural dimension score of uncertainty avoidance index (UAI), since the
legally blind group had a higher score as compared to the control group. A similar effect was found
on the Secondary information feature, where a significant effect of disability variable was
calculated. A relationship between this cell phone interface feature and the UAI score could be
established observing the mean scores from the LS means post-hoc test, where it was found that the
legally blind group had a higher means score, indicating they have greater preference as compared
to the control group of this feature. Looking at the significant effect of DisabilityxCountry
interaction, on the feature of efficient screen space utilization it was observed that the India control
group had a mean score significantly greater than the India legally blind group. This observation
was contrary to the relationship that was proposed, between UAI and Efficient screen space
utilization. The experimental scores however can be explained by the observations of critical
incidents in the focus group sessions. It was found that the legally blind group could not see the
screen due to their visual disability (they depended only on audio feedback) and therefore they rated
the importance of this feature lower as compared to the control group in India.
Also looking at the country significant effect on the feature of personalizable interface on a
cell phone, it was found that India rated this feature higher as compared to the US. This was
contrary to the proposed relationship between the Individualism index and personalizable interface
(concept of profiles). The observed mean score differences however could be explained using the
qualitative data analysis results. It was found that the term ‘profiles’ was familiar to participants in
India as compared to the US, since Nokia phones which were more popular amongst the
participants, used this term. In the US Motorola was more popular amongst the participants, which
uses the term ‘mode’ to personalize the cell phone interface.
Looking at the feature of variety of font and font sizes, it was found that there was a significant
interaction effect of disabilityxcountry. Observing the mean scores from the post-hoc test it was
found that the legally blind group in India rated the importance of this feature lower as compared to
the US legally blind group. This relationship justifies the proposed (negative) relationship between

104
PDI (power distance index). Since India scored higher on the PDI as compared to US, it was found
that there was a lower preference for this feature of Variety of fonts in India.
Another relationship could be established between the feature of group SMS and IDV. It was
observed that there was a significant effect of country on this feature and from the post hoc test it
was found that the mean scores in India were greater (indicating a greater importance/preference)
for this feature. This was commensurate with previous theory (Kim et al., 2003) that proposed that
the SMS feature was more popular in collectivist cultures.
Based on the above relationships that were established between the underlying cultural
dimensions of the group and the preference of a cell phone feature, one may conclude that some of
the proposed relationships were observed in a group level analysis.
4.C The scores on the ratings questionnaire will be correlated with the corresponding individual level cultural dimension score. On the basis of results of the VSM 94 data analysis, it was found that only the dimensions
of Uncertainty Avoidance (UAI), Individualism (IDV) and Power Distance (PDI) were found to be
significantly different across some groups. Therefore these dimensions are considered in this
individual level analysis of calculating the values of correlation co-efficient. Table 24 shows the
summary spearman’s correlation coefficients of the items of the interface ratings questionnaire with
corresponding cultural dimensions.

105
Table 24: Correlation Co-efficients of Cultural Dimensions with Interface Ratings
PDI IDV UAI Variety of Contents R2= 0.018
Personalizable interface (concept of Profiles) R2=0.0004
Minimal Steps or Keystrokes R2=0.02
Efficient screen space utilization R2=0.04
Using Default folders R2=0.0004
Secondary information R2=0.08
Large amount Information within a screen R2=0.0004
Programmable softkeys R2=0.0008
Clear Menu Labeling R2=0.001
Group SMS R2=0.057
Efficient screen space utilization R2=0.01
Variety of fonts and font sizes R2=0.068
Large amount Information within a screen R2=0.001
Familiar interface R2=0.0069
Overall it may be concluded that the expected outcomes of the relationship between the
cultural dimension and the preferences on the importance of certain cell phone features were found
when a group level analysis was adopted as compared to the individual level of analysis.
5.6 Qualitative Data Analysis Results
The user requirements in terms of design preferences corresponding to the components of
the cell phone interface are summarized in this section. These design preferences were extracted
from the qualitative data analysis using the Overview grid method of the focus group transcripts
(Knodel, 1993). The user requirements for the four disability-specific and nationality-specific
groups are summarized in this section, which is followed with an insight to the differences between
these groups.

106
5.6.1 India Legally Blind Participants 5.6.1.1 Cell Phone User Interface In term of Input tools used in the User Interface, the users of this group stated that the
navigation keys must be easily discernable in terms of color and tactile feedback, in-order for them
to distinguish easily between all four arrow keys. The softkeys are useful but the users have to
memorize the function assigned to them, since they cannot read the screen display easily. A
prominent tactile dot on the 5 key was also essential. This protrusion helps in identification of keys
tactilely. With the flat key design the users requirement was that the lateral pitch between the keys
must be raised. A keypad design with a deeper key protrusion was preferred by users in this group.
A flat keypad design must be avoided. Tactile feedback from the keys was also a required essential
feature.
The phone was turned on mainly by trial and error and the users stated that the ‘end call key’
is used as the power key is not intuitive. They desired a clear and well contrasted symbol must
indicate the power function on the end key. The users also mentioned that if the power function is
clearly depicted on the key, then a separate power key is not needed on the phone. In-terms of
identifying the relevant keys for each task the users said that the identification of keys is simplified
after some training and practice on the cell phone.
While talking about Shortcut Keys it was learnt that they were used extensively for
frequently used functions as an alternative to navigating in to the menu structure.
In terms of Call Management the users stated that for frequently used phone numbers they
use speed dial keys more frequently as opposed to the phonebook dialing. They also claimed that
the Registered calls (Last dialed, Missed, Received) lists are more frequently used as compared to
looking up the phone book to dial numbers. The users required a feature for easy adjustment of call
volume to adapt to noisy environments such as local trains in India. In terms of Call Feedback the
users stated that it is necessary for the cell phone to provide audio or tactile feedback for call end is

107
required to ensure that a dialed call has ended. When the users were asked about the preference of
voice keys on the cell phone they stated that they prefer voice feedback as compared to audio
feedback as beeps from key presses. This user group also stated that they would like to use the
feature of voice dialing however they do not trust the reliability of its accuracy.
In terms of ergonomics and hardware design of the test cell phone the users all said that the
size of the phone is too large and bulky. The reason that was stated for this was that it is
inconvenient to carry a large and bulky phone in crowded places such as local trains. The users
would like to have the option of increasing the font size on the display screen.
Users with residual vision need larger screens on cell phones, however some partially
sighted individuals who could not see the screen said they would like to have a phone without a
screen to reduce the size of the phone. The users found the weight of the phone too heavy and users
preferred lighter phones. The users preferred the flip mechanism of the cell phone to ensure that the
keys are well protected from unintentional key presses.
The users also did not like the large size of the text phone model. They said they would
prefer a phone size that fits easily in their pocket. Large phone sizes are cumbersome for users to
carry in crowded environments such as local trains. Most of the users did not want to compromise
on the phone size, but also required a large screen size, incorporate larger icons and larger font
sizes. The user requirements on screen size varied with the degree of visual impairment. Users
with minimal residual vision stated a high importance to screen reading software as compared to the
size of the screen.
5.6.1.2 The External Interface The users also explained that they have difficulty using some detachable parts of the cell
phone. The users require easy to use method of changing SIM cards on cell phones
The users also required an accessible method of remove the cell phone battery.
While talking about some advance features of communication methods in cell phones, it was
learnt that the users are aware of the Bluetooth technology and would like to use this feature if it

108
were accessible. Some of the fun features in the cell phone software the users stated that they use
were features such as Games, Radio and Composing Ringtones frequently.
Users state that they are unable to perform the tasks on the cell phone due to lack of training
and lack of familiarity. They did not state many usability problems with the interface. Users
explained that they have issues with the learnability of new cell phones and hence avoid purchasing
newer models.
In reference to the learning methods of cell phones, participants of the India legally blind
group stated that they mainly depend on friends and family to train them to use the cell phone
advanced features. Users also said that they would like to refer to instruction manuals for cell
phones, however are unable to do so due to unavailability of accessible formats. Users would like
have option of all different formats of accessible formats including Large print hard copies, Audio
based, web-based, braille and electronic. However some users said that they prefer a phone that is
intuitive enough so that there is no need for a manual.
In reference to supporting software of cell phones, the legally blind participants have
repeatedly mentioned the need for magnification and screen reading software for the cell phones.
5.6.1.3 Service Interface In regard to services and service providers users with disabilities in the India group express
the lack of customer service through phone calls, emails etc. The users express the need for
customer support to solve their problems with service issues and cell phone compatibility issues.
Responses to the post task questions relating to each of the 4 tasks implied the preferences
of the software design of the function as well as the general usage of the features.
5.6.1.4 Changing the Ringtone For the task of Changing Ringtone, the users claimed that their inability to complete the task
was due to the fact that they require training or manuals before using a feature in a new phone.
They stated that they currently use shortcut keys to change ringtones in profiles. They also do
prefer to use this feature of changing the ring tone frequently. Most users were familiar with the

109
concept of profiles. Another feature that is used is to assign ringtones to frequently used numbers.
Therefore they require a feature that would allow them to easily use this feature in minimum steps.
5.6.1.5 Storing a Number For the Task of Storing a number, the users stated that looking up the phonebook to dial is
difficult therefore users do not use this function often. They prefer to dial numbers that they have
memorized as opposed to looking up the phone book. They also prefer shortcut keys as compared to
looking up the phonebook.
5.6.1.6 Sending a Text Message For the Task Sending an SMS, the participants expressed the need for a screen reading
software called ‘talks’ to be installed in order to complete this task successfully. Users found too
many options at each stage of the menu confusing. A fewer number of options at each stage would
make this task more intuitive. The task was unsuccessful since the interface was unfamiliar.
Therefore they feel they would be more successful if the interface was similar to their current cell
phone. Users state that for some features such as SMS it is either the use of screen reader/talking
software or asking others to help
5.6.1.7 General Cell Phone Features In general most users stated that voice feedback to indicate task completion is needed in
current phones. Some of the essential functions in a cell phone that were reported were Organizer,
scheduler, Calendar, SMS, Volume Control, Ringtones.
For the advanced features cell phones such as image recognition function, the users stated that
instead of being used as a barcode reader it would be more useful for the same technology to work
as a money recognizer and color recognizer.
For this user group an Accessible cell phone was defined as one:
• Hardware and software both should be so comfortable that we can use it without assistance;
• Without any limitations, frustration, confusion;

110
• Which is like a computer used with the help of Jaws (screen reading software);
• It should be affordable
• Screen reader and Talking software is an important feature in an Ideal cell phone
5.6.2 United States Legally Blind Participants 5.6.2.1 The User Interface In terms of navigation keys users of the United States legally blind group were aware of the
functionality of the Multifunction key. They stated that they require that the labels of the center
button and the 4 arrow keys are well contrasted and provide tactile feedback. With reference to the
keypad design users require better contrast, lateral pitch and key protrusion of keys on the keypad.
There was an general awareness among participants that cell phone manufacturers have to comply
with the section 508 requirement for the key size, protrusion and lateral pitch. The users preferred a
lighter background with a darker foreground for the keys on the keypad.
The users expressed the tactile dot on the 5 key was essential for the keypad. They users
require a dot that has a greater protrusion. The users identified the need to have separation on the
key pad between the function keys and the numeric keys. These keys must be separated with a
color, physical distance and shape for easy identification.
Another feature identified by the users was that they require a clearer symbol on the key
designated the end call key. The red color did not intuitively indicate power on to them. The users
do not require a separate key designated as the power key. The most prominent key (in terms of
color contrast and protrusion) is mistaken to be the power key.
In terms of call management the users claimed that they find it difficult to identify incoming
calls since they cannot read the font size on their phones. The users needed a simpler method for
caller identification. Most of the users did not use the assigning a different ringtone to the contact
feature.

111
The users expressed the need for voice commands for all the functions. Some of the current
phone have this feature, however the users are unable to use it as they find it difficult to program.
The users found that most of the icons on the test phone model were not clear since their
size were too small. None of the participants mentioned the intuitiveness of the icons. Most users
said that they use the icon as the identifier or the text in the menu. Therefore clear and large icons
and related text were desired by the users. Also color contrast on the screen and the keypad is very
essential for accessibility.
Most of the participants did express that the size of the phone was too big, however they
liked the fact that the phone piece extended from their ear to the mouth.
The participants liked the bulkiness and the weight of the phone as it gave them the impression of
being a sturdy phone. Users prefer to have phones that appear to be sturdy.
Users would not like phones larger than the current size, however do prefer fonts of a larger
size. However they were willing to compromise on the size if larger fonts are provided. Most of the
participants emphasized on the high learnability curve of using a new cell phone.
In terms of Usability, ease of use was emphasized as more important as compared to having
many functions on a cell phone.
5.6.2.2 The External Interface In reference to instruction manuals, some of the users stated that they currently use manuals
however trying it out, asking friends were more commonly used. Users wanted the option of
ordering an accessible format of the instruction manuals. In this manner they would have a choice
from a variety of formats. They understood that it was not practical to have different formats (large
print etc) packaged in the phone box.
In terms of chargers some users said that they prefer the cradle charger as compared to the
one without a cradle, since it was easier to plug in. Users also stated that instant feedback after
completing any task is extremely necessary. Since most of the time they cannot view the screen,
they would like audio feedbacks for confirmation.

112
5.6.2.3 The Service Interface The participants stated that they consistently change their cell phone provider and hence
have to change their cell phone manufacturers as well. This leads to a great deal of confusion due to
lack of consistency. Therefore they expressed the need for consistency for standard in the UI across
cell phone and cell phone manufacturers.
5.6.2.4 Dial a Number While performing the dial a number task the clear key was not well understood by the
participants. They had difficulty in clearing a number if they typed the wrong number and
eventually gave up the task. Most of the participants said that they currently dial numbers that they
remember, however they did state that this was a limitation since they cannot remember too many
numbers
5.6.2.5 Changing the Ringtone During the task of setting the ringtone the users found that there were too many steps and
too many options at each stage to complete the task. Another observation was that the users were
not familiar with the concept of profiles. They refer to them as phone modes.
Some of the users presumed that the cell phone was not manufactured by a US based company.
They explained that the confusing menu structure was due to a foreign manufacturer.
5.6.2.6 Storing a Number Participants did not find the task storing the number confusing, but mainly pointed out
accessibility issues regarding font size and icon size. Participants mostly claimed that they
currently do not use it due to its lack of accessibility. They agreed on the need for using this feature
if they included voice recognition. Users agreed on the usefulness of the varied options of the
storing a name and thought that would be useful in retrieval. When looking up a phonebook,

113
participants also asked for the feature of looking up a number and finding the corresponding name
instead of looking up a name and finding the number.
5.6.2.7 Sending a Text Message After the task of sending a text message (SMS), it was found that most of the participants
had not used this feature before. They did not understand the SMS and MMS terminology. Text
messaging was the commonly used term. They pointed out that the default options that are selected
are not intuitive. For example to complete this task, the MMS function was a default selection. This
MMS feature is uncommon in the US)
Users found difficulty in some of the functions such as placing a space between consecutive
words, and inserting symbols. They differed from the method that they used in previous phones,
therefore they found the task confusing.
5.6.2.8 General Cell Phone Features Some of the essential features that were listed were emergency calls, shortcuts, camera for
(emergency situations such as taking a picture during an accident). Other features such as tip
calculator, magnifier were also specified as important features.
In summary an accessible phone was defined by the United States Legally Blind Group as:
• One where I should not have to strain my eyes;
• For me it is something simple to use and easy to use
• I should be able to use everything on it;
• I should be comfortable using it
• A talking cell phone
5.6.3 India Control Group 5.6.3.1 The User Interface

114
With reference to navigation tools for cell phone interfaces the users stated that all phones
not necessarily have the multifunction key. It is not an essential tool for navigation. The users liked
the keypad of the test phone model, but would prefer a greater lateral pitch for easier use of the
keys.
The End call key was well understood as the power on/off key. They did not require a
separate key designated as the power key. The power key turns off the phone too soon, therefore
they would prefer longer time the key must be pressed to turn off the phone. For Shortcut Keys, the
users liked the feature in the test phone model that 11 shortcut keys were programmable.
In terms of Call Management, the call volume must be easily adjusted; they require a
shortcut key for this feature. The speaker phone is an essential feature for call management. Users
mentioned that they used the speed dial feature frequently to dial numbers. They use call history
more often than looking up the phonebook to dial. The users also said they would like a feature to
allow an incoming call to be set to Silent, instead of ending the call when you do not want to answer
it.
The users in the India control group explained that voice keys were not suitable for noisy
environments. If the voice dialing feature is reliable then they would like to use it. It would allow
the keys to last longer.
For Icons and Menu the test cell phone’s menu structure displays all the items in one
screen. The users like this feature of displaying all items at once on the screen as compared to the
sequential display of items in consecutive screens.
The participants stated that some Non English speaking users in India may not be familiar
with the term profiles on cell phones. Therefore it is important that the cell phone explains the
meaning of this feature clearly. With reference to Localization in India most places are crowded
and noisy therefore the voice dial feature does not work reliably. Most of the users refrain from
using it. The users were apprehensive about using any voice functions since they thought the voice
recognition has not been well developed for the Indian accent.

115
The users did not complain about the font size of the text phone model. For them clear fonts
on the alpha numeric key pad are important. The fonts on the test phone received no complaints.
The users liked the big screen of the test phone model. They also liked the colors and contrast on
the screen. When asked about the voice feature, they stated that voice messaging is useful,
especially if for the visually impaired users.
With reference to the ergonomics of the cell phone, the users stated that the aesthetic look
and feel of the phone body and keypad must be appealing. They thought that the rotation feature
was good and would prefer to have the cell phone screen rotate 360 in order to use the screen for the
camera. They found that the test phone model was too heavy. They all liked the flip design of the
phone to protect the keys from unintentional key presses.
The preferred size of the phone was much smaller than the test phone. The phone must not be as big
as a cordless phone. They also stated that the phone body must be sturdy. The cell phone should be
able to withstand falling. The life of the cell phone battery was considered as an important cell
phone feature.
In terms of communication methods users stated that Bluetooth is an essential feature. With
the phones with such advanced features it is needed to transfer data to the computer, an Bluetooth
was the preferred method.
Users enjoy changing their incoming call ringtones frequently to the latest Hindi movie
songs, which are available for purchase by the service providers. Games on the cell phone were also
considered to be an essential feature.
In terms of Usability of the cell phone, Ease of use was rated higher than having many
functions by the India Control Group. However the users said that even though some tasks are
difficult initially they can always be figured out after using the phone for a while.
5.6.3.2 The External Interface

116
In terms of User Support, users liked the feature in cell phone in-built help, however they
would also like to have the option of switching it off. In terms of instruction manuals it was
important for the users to have a good table of contents and a keyword index in order to facilitate
easy searching. The instruction manual also must have many pictures to graphical represent the
phone’s functionality.
With reference to accessories such as the Hands-free sets, the voice recognition and voice
feedback features must be used with a head set. They users may not always want the speaker on the
cell phone to be heard loudly.
5.6.3.3 The Service Interface The network availability was pointed out an essential feature on the cell phone. They users
stated that due to interruptions in the service availability SMS was considered a preferred method as
compared to calling in certain situations. Some of the users stated that an accessible cell phone is
one that has good cell phone service at all times. Interoperability, it was mentioned that an ideal
phone would be one that interacts and synchronized with your PC as well;
5.6.3.4 Dialing a Number
Users preferred to use call history to place a call, as opposed to the phonebook since it was
faster.
5.6.3.5 Changing the Ringtone Some of the user thought that the changing ringtone settings would be under ‘sounds and
ringtones’. They thought menu should avoid using too many options and too many steps. The users
found that even though this task can be set as a shortcut key, however it was important for the cell
phone to have this function easily accessible in the cell phone menu.
The users were extremely familiar with the concept of profiles and like to use profiles such as
airplane profiles.

117
The user group explained that they enjoy changing their incoming call ringtones often to the
latest Hindi movie songs. These ringtones could be purchased from the cell phone service provider
by sending a text message.
Assigning the ringtone to a contact is a feature that must be available as an option in contact
list in the phonebook.
5.6.3.6 Storing a number
The feedback for task storing the number was positive. Most of the users liked the way the
menu structure was organized. They understood the sequence of the menu stages well which lead to
their successful task completion.
The users liked the options of storing the different types of information for the contact stored
(Email, address, Birthday etc). They mentioned that these details may be more useful to business
people but they would like to have the option of storing this information as well. They also liked the
feature of the storing a display name in the phonebook. They would like to store a picture with the
contact name as well.
5.6.3.7 Send a Text Message
The users found that the T9 dictionary was extremely useful and time saving while typing an
SMS. They stated that this task on the test phone model had too many steps and too many options. It
is important that this function has minimum steps. The choice of SMS over placing a call is mainly
due to the fact that it is cheaper and fast as compared to dialing. Also due to the fact that the sender
and the receiver do not have to depend on the availability of the service in order to send the SMS.
The cell phone messages double checks your actions for task completion, which is not necessary.
The most important feature is to complete the task in the minimum number of steps possible. Also it
was important for them to be able to easily edit the number that was entered.
The users would like additional symbols and animations (smileys) to be easily inserted in
the body of the text. The user said that they liked the feature in the test phone that a large number

118
of characters were allowed for the message, since they would like to send large text messages.
Since the phone allows for large storage this feature could be useful for storing notes as well. Some
of the users preferred sending an SMS over calling. One participant made an interesting comment:
“I can type faster than I can talk”. This indicates that this feature is used as frequently as or more
frequently than dialing a number that allows the user get so efficient at it.
5.6.3.8 General Cell Phone Features
When asked about important functions in a cell phone, SMS, calling, and Ringtones were
mentioned across the groups.. In terms of advanced functions, users mention that text to speech will
be useful for listing to SMSs while driving. They also would like to use the speech to text
technology to input text messages. The Image recognition feature as Barcode reader not useful, but
scanning would be useful. TV calls (video calls) would be useful but would not want to pay more
for this feature.
When asked how they would define an accessible phone the following responses were obtained:
• A phone with a good network
• You have a cell to be accessible
To summarize the discussion some of the features of an ideal phone were as follows:
• Should be usable by people with disabilities
• User friendly, and Light and handy
• If you have a camera phone the camera should work well.
5.6.4 United States Control Group 5.6.4.1 The User Interface
In reference to Navigation tools used in the cell phone interface the users were aware of the
Multifunction key and liked its functionality. However it was important that the center button of the
multifunction key must be labeled “OK”. In terms of the keypad/keyboard, the users found that the

119
keys were easy to press to dial and they liked the size of the keys. However they would prefer that
the lateral pitch of the keys was increased.
The users found that the Power button (End call key) was understandable and intuitive. They
understood that this was generic in all phones and they would not like a separate power key.
In terms of call management they mentioned that they use the call history feature as often as
they use the phonebook. The users would like a shortcut key to easily access the call history (missed
calls, received calls, last dialed numbers).
Some of the users said that they do have the voice key/ audio display feature in their phone,
however they would like to use it only with a headset. They would like to use an audio display
while driving. Users found the key beeps annoying. Users would like to have the option of turning
this off quickly.
The control group in the US found that the icons on the cell phone menu were clear and
descriptive however the functions under the icons were not relevant and did not lead to successive
task completion (especially the task of setting the ringtone). Some users also said that the icons all
look similar and they should be more distinguishable in terms of color and contrast.
In reference to the Display/Screen, the users stated that they loved the screen of the test
phone, the size as well as the contrast and colors. The users further explained that they would
prefer if the secondary screen be larger and it must be well contrasted; a dim screen was of no use.
The secondary screen must display the number of the incoming call, and the clock on the secondary
screen is essential
In reference of the cell phone appearance and touch and feeling the users stated that they
prefer to have a thin and slim phone. They concluded that men and women do prefer slimmer
phones. Also that it was important for the phone to be sturdy and durable. The users did not like the
rotation of the screen, they felt that the phone was fragile and therefore would prefer something
sturdier. The users thought that the phone was too heavy; they would prefer a lighter phone. All the

120
users like the flip design of the phone, however they found the phone to be too bulky, they would
prefer something smaller and slimmer. However they liked the fact that the phone piece was
lengthy enough to reached their ear and mouth, which felt that they were talking into the phone.
In terms of the communication methods the users found that the test phone model had blue
tooth, USB and infrared, which made it very useful for data transfer. They said that they would like
to use this feature in their cell phones. They would like to use this feature of the phone synchronized
with the computer for the contact list and other data. In reference to the utility and security, they
said would avoid adding too much personal information in their cell phones. They would like to
include a security code to secure information such as their SSN. In reference to cell phone usability,
the users said they prefer ease of use over having many functions. In terms of feedback, the users
claimed that the explanations on the phone about each of the software features were not self
explanatory, they would like the text to be clearer and more descriptive.
5.6.4.2 The External Interface Most of the users said that they figured out how to use their phone by trying it out
themselves. They said that they would use an instruction manual only when the phone stops
working. They would like an instruction manual with lots of graphics pictures and a fewer number
of pages.
In reference to external components the users claimed that they would like to have a cradle
charger, instead of the plug in type for the cell phone.
5.6.4.3 Service Interface In terms of service availability the users stated that they currently have issues with their
network and desire a better service/ reception from their service provider. Also they would like a
phone with the pull antenna for better reception. Also they would use features like the internet if the
service providers would offer them at no additional cost.
121
The users found that the large number of intermediate steps made the tasks difficult. Users
would prefer fewer steps and would like the option of shortcut keys for the important and frequently
used functions. The responses to the post task questions are summarized as follows:
5.6.4.4 Changing the Ringtone For the task setting the ringtone, the users thought that the most intuitive place to find
ringtones would be under ‘sounds’, therefore finding it under ‘settings’ was difficult. The users
were familiar with the concept of profiles, however used the term modes as well. They mainly used
the vibrate/silent and normal (profile) mode options.
All the users changed their ringtones often, therefore they would like few steps for completing this
task. For frequently used functions the users said they would like minimum steps, some said that 3
steps were the maximum.
5.6.4.5 Storing a Number
For the task storing a number, the phone feedback was useful for saving the name under a
number and avoided unnecessary loss of information if the forgot to enter a name. However the
users would prefer the feedback to be worded better (in more direct terms). The users also would
like to have the different options/ categories for a contact while storing a number. However they
expressed that storing so many details will be useful for a business purposes as compared to
personal purposes. They would like to save the name of the service provider of the contact on the
contact list. The users expressed that they use the call history more frequently as compared to their
phonebook
5.6.4.6 Sending a Text Message For sending an SMS or text message, the users stated that there were too many levels and
options to complete this task. Users use the instant messaging feature through their online
messaging functions more often as compared to sending messages through their cell phones.

122
Usually they disable the shortcut to SMS since they do not use the SMS feature often. Users stated
that they prefer using the dictionary while inputting text to send a message. They said that they
should have the option of: choosing the contact first before typing the message to be sent or typing
the message and then choosing the contact.
5.6.4.7 General Cell Phone Features
When asked about the essential features they users listed Calling Receiving, Games, MP3,
music, Clear reception.
In-terms of advanced features, users were not extremely enthusiastic about the voice
recognition function, image recognition and TV call. Some of the users expressed the privacy issues
related to the TV call feature.
The participants were asked to define an accessible cell phone. The responses are as follows:
• You should be able to figure it out without a manual
• The phone should teach you how to use it.
• Being in range (service) all the time to send and receive calls at all times.
Also in summary they were asked to describe an ideal cell phone, the responses are as follows:
• Minimum number of steps for all the frequently used functions
• Some of the users said that they would like to be able to program the phone to change the
mode (profile) according to the time of the day.
• Alarm feature in current phones are too easy to turn off. They would like a security code to
stop the camera.

123
CHAPTER 6. DISCUSSIONS AND CONCLUSIONS
The global nature of mobile technologies has highlighted the importance of this cross-
cultural study to identify differences in interface design preferences of cell phones. The data
analysis results in the previous section indicated that there are several aspects of cell phone
interfaces which are similar and different in both countries and across the disability groups. Overall
this study indicates that there are more differences on the usability aspects than accessibility aspects
of cell phone interfaces between the legally blind groups across the two countries, India and the
United States. The results of this study indicate the presence of a relationship of culture and
interface design. This section highlights some of significant the differences across these groups.
6.1 Research Questions Answered
The research questions that were proposed in this thesis are answered and summarized in this
section.
The first research question was as follows:
• What are the differences in cultural dimensions? (And whether these differences substantiate the existence of a disability culture)
It was hypothesized that differences would be found on certain dimensions of the cultural
model. This research study found differences between the control and legally blind groups on the
uncertainty avoidance (UAI) cultural dimension, indicating disability overrides nationality. For the
Power Distance Index (PDI) it was found that the India group score was significantly different as
compared to the United States group, indicating that nationality overrides disability. For the
individualism (IDV) dimension, it was found that the India legally blind group scored higher as
compared to the control group with no apparent disability. In the United States, the control group
scored higher on this cultural dimension as compared to the group with legal blindness. Therefore to
summarize, differences in cultural dimensions were driven by disability and nationality and the

124
interaction between these two independent variables. These significant effects and differences were
explained based on theory, and point toward the presence of a disability culture.
Another research question was as follows:
• What are the differences in cell phone hardware features ratings?
The statistical and content analyses found that main effects on the preferences of hardware
aspects of the cell phone were driven by disability groups. The differences indicated that the
control group preferences differed significantly from the legally blind group. The cell phone
hardware features preferences were driven by disability, indicating that the presence of a disability
was overridden by nationality for the hardware ratings dependent variable.
The research question that followed was:
• What are the differences in cell phone usability ratings? The data analysis on usability ratings found that the significant differences were driven
by disability as well as nationality groups. Indicating that on certain cell phone functions there were
differences in usability ratings, based on the disability groups, for some based on nationality groups
and for some tasks, disability specific nationality groups. This finding reinstates the issue of
Culturabilty (Barber & Badre, 1998), which emphasizes the need to consider usability in a cultural
context.
The next research question was as follows:
• What are the differences in design preferences? (of certain cell phone interface features) Certain cell phone features and their relationships between cultural dimensions were
identified based on previous studies. The data analysis found that when a group level analysis was
adopted, as compared to an individual level of analysis, the differences in the cell phone interface
features were reflected on the underlying cultural dimensions of the groups.
The question that proposed the integration of the quantitative data analysis findings with the
content analysis of the qualitative data was as follows:

125
• What are the bases of these differences in design preferences of cell phone interfaces?
The significant differences that were found from the statistical data analysis were explained
by some of the findings of content analysis. Some of the quantitative results have been validated
with the findings from the qualitative data analysis. For example it was found that the usability
ratings of the task sending an SMS were significantly greater in India as compared to the United
States. From the focus group discussion sessions it was found that the use of SMS was more
prevalent in India and they considered it as an essential cell phone feature. Some of the ratings of
the cell phone interface features, such as Essential screen space utilization were rated significantly
different by the control and the legally blind group. From the qualitative analysis it was found that
some of the legally blind participants could not view the cell phone screen (due to their visual
disability), therefore this feature was rated of higher preference by the control group. The
quantitative data analysis results were tied in with qualitative interpretations (that have been
explained in the results section).
The next section highlights some of the significant differences found between the groups that were
under analysis for this research study.
6.2 Differences across the Legally Blind Disability Groups
In India the legally blind users emphasized the fact that they are unable to complete tasks
since they were not familiar with the phone that used as the test model. However legally blind users
in the United States emphasized the fact that the phone had usability and accessibility issues and
therefore they had more suggestions on the different aspects of designing the user interface. This
could be explained with the differences in disability legislation. In the US the Telecommunications
Act 1996 has increased the focus on consumers with disabilities (henceforth referred to as 36 CFR
1193). 36 CFR 1193 specifically addressed accessibility, and assigned regulatory authority of the
Federal Communications Commission (FCC) to ensure that all users have access to

126
communications products, regardless of disability, to the extent that access is achievable without
undue expense. This Act was designed to ensure that the 20% of Americans affected by a disability
have equal access to telecommunications products such as cell phones and portable computers
(Smith- Jackson et al., 2003). No such legislation exists or is enforced in India for people with
disabilities. Most of the accessibility user requirements of these two user groups overlapped,
however the participants from United States disability group identified more issues concerned with
the usability of the interface.
However users with disabilities in India currently used and desired to use more advanced
features as compared to the US. This complies with the cross-cultural differences of cell phone
adoption in the two countries, with India advancing at a faster pace.
6.3 Differences between India and United States
Privacy issues regarding information sharing through cell phones were brought up in
discussions in the US focus group sessions. The participants were concerned about their privacy
being violated due to the features such as the camera, voice call and storing personal information on
the cell phone. No such privacy issues were raised in India. The importance and familiarity of using
Text messaging (SMS) was found to be higher in India as compared to the United States. This
complies with findings of the study of French and American mobile phone users by Issac, Nikerson
& Tarasewich (2004), where differences were found in text messaging usage which was attributed
the relative newness of this feature in United States. The other study by Kim et al. (2003) supports
these findings, states that text messaging is more frequently used in collectivist cultures such as
India. The concept of calling tunes where the caller can listen to a song instead of the regular
calling sound has gained popularity in India over the past few years. The popularity of songs from
Bollywood (The movie industry in India) penetrates the mobile phone culture and the service
providers have the latest songs available for purchase, in the ringing tone and calling tone formats.
Therefore the importance of ringing tones and usability ratings of the task, was rated higher in India

127
as compared to the United States. The users in India were more familiar with the concept of
profiles. The current test phone model was developed by Toshiba an Asian cell phone
manufacturer, which explains some of the higher usability ratings in India as compared to the
United States.
Statistically significant relationships however were not found between the cell phone
interface elements and cultural dimensions that were identified by Choi et. al (2005).
6.4 Disability Culture Revisited Some of the differences that were found in some of the index scores of the cultural
dimensions, as calculated by the VSM 94 formulae. As discussed before, different cultures perceive
things differently. It is the influence of childhood experiences, upbringing, education, social aspects
that affects interaction with the environment (Yeo, 1996). Since people born with disabilities (or
those that have acquired a disability in their childhood) have had a different childhood, upbringing,
education, social interaction and other experiences than those without disabilities, therefore, they
will share a common attitude and a set of values different from the population without disabilities.
The values and behavior of a population with disabilities differs in some aspects if not all aspects
from the national culture. However, if the person has developed a disability in adulthood, s/he may
or may not share the values of those that were born with a disability. Most of the participants in this
study acquired the disability congenitally. The differences in cultures are also explained by the
presence of emic and etic variables. The emic approach is based on the assumption that at least
some cultural dimensions are culture-specific and cannot be used to analyze cultures of various
entities. Unlike the etic approach of universal cultural dimensions that are used to describe cultures
relative to each other. Emic variables are cultural metaphors that are unique to specific cultures and
are used to describe each culture independently which can be explored mainly through a qualitative
approach (Gannon, 2004). Therefore the presence of a disability culture must be investigated
further by purely qualitative methods such as ethnographic studies. However, since this research is

128
exploratory in nature, the current findings of the cultural dimensions provide an insight to further
studying the presence of a disability culture.
6.5 Limitations of the Current Study
The shortcoming of this study is that there is a potential for a sampling bias due to
convenient sampling, therefore if a complete random sampling method were employed the validity
of the results would be increased. The education level, work experience, gender and age of
participants in one group could not be perfectly matched at the time of recruitment which therefore
may be a potential bias the findings. Specifically the United States legally blind group had a greater
mean age as compared to the other groups. To justify that the effects of age did not bias the scores
obtained on the cultural dimension index, an age group independent variable was included in
addition to the disability and nationality variables in the ANOVA model for the VSM 94. No
significant effects were found for the variable age group, (which considered age>35 high and
age<35 low) for the 5 cultural dimensions as the dependent variables.
According to Hofstede’s (1994) manual, the minimum number of respondents per country or
region to be used in comparisons is 20, since below that number, the influence of individuals is
strong. In this study the sample size for each cultural group varied between 16-19 participants.
Another limitation is that the VSM 94 questionnaire mainly revolves around work related questions.
Therefore it is essential to justify the obtained scores with another robust instrument. For example
a questionnaire developed by Bierbrauer et al. (1994) called the Cultural Orientation Scale (COS)
measures the individualism and collectivism dimensions defined by Hofstede (1991). This scale
has been used and validated in various studies (Ferreira, 2002). Ferreira (2002) used this scale in a
study that compared the type of information Anglo-American and Hispanic-American people prefer
in an e-commerce environment. Further research is needed to deepen the value of Hofstede’s
cultural specific variables to cross-national and cross-cultural design of interfaces. Also the

129
possibility of construct bias due to different rating schemes on Likert-type questionnaires adopted
by different cultures must considered while interpreting the quantitative data (Cliff & Keats, 2003).
6.6 Guidelines for Cross-National Studies
A set of guidelines were developed from the research experience of this study to address the
issues in cross national studies. These guidelines are categorized as technical issues and recruitment
issues and are described as follows.
6.6.1 Technical Issues Video Formats: Video cameras come in two formats: PAL and NTSC. A recording in a PAL
format will not play in a NTSC player and vice versa. The PAL format is used in Europe and Asia,
and the NTSC format is used in the United States. It is important to ensure that the digital copies of
the video recordings are prepared in the country where the research was conducted to avoid video
format compatibility issues.
Voltage range: Europe and Asian countries have different voltage as compared to the US. It is
important to ensure all equipment is compatible and can be used in the target countries. The
researcher must purchase voltage converters to ensure their equipment works in the country they are
planning to conduct the research.
Import/Export duty: Some cross-national studies will require the transportation of electronic
equipment. It is important to learn the permissible limits on electronic equipment to avoid the
payment of import/export duty during shipment of equipment across national borders.
Language: It is important for the moderator of the focus group to be familiar with the national
language and the lingo used in the country where localization research is being conducted.
Familiarity with their language allows the participants to be more participative in the discussions
and interview sessions.
6.6.2 Recruitment of Participants
For recruiting participants for a cross cultural study is necessary to designate a local resident
for this task. The budget for a cross-cultural study must include the expenses to hire a consultant to

130
be in-charge of the recruitment located in the countries where the research will be conducted.
Remote recruitment using phone calls and emails was not found effective.
6.7 Guidelines for Studies including People with Disabilities
In this section some guidelines are provided for design studies involving users with
disabilities. Some of issues that must be considered have been addressed in User Sensitive Inclusive
Design. (Newell & Gregor, 2001). These guidelines are categorized as accommodations and
recruitment are as follows:
Accommodations: While conducting a study to improve usability and accessibility issues in
designing products for users with disabilities, it is important that these issues must be reflected by
the research methods during data collection. One method is by providing questionnaires in
accessible formats suitable for the target population. Large print questionnaires for users with low
vision and Braille prints for the users that are totally blind must be provided. It is important to keep
in mind that different disability types have different accommodation needs. It also is important to
consider questionnaire usability in mind while designing the survey questions.
Recruitment: Recruiting users with disabilities is one of the biggest challenges in studies for users
with disabilities. This challenge becomes three fold when the recruitment involves scheduling
participants at a common location and time for a focus group. The most effective way for this was
found to recruit through disability service providers and agencies. These organizations have a direct
contact with the target population and therefore a larger number can be recruited through them.
6.8 Future Work
For future cross-cultural quantitative studies it is proposed to consider the influence of
cultural dimensions on the responses of ratings questionnaires. Previous studies on response styles
have showed that there are major differences in response styles between countries. In one such
study by (Harzing, 2006) it was found that country-level characteristics such as power distance,
collectivism and uncertainty avoidance significantly influence response styles. This study also

131
found that, English-language questionnaires are shown to elicit a higher level of middle responses,
while questionnaires in a respondent’s native language result in more extreme response styles.
Therefore for results to truly reflect cultural differences, it is important to adopt certain methods to
mitigate the effects of response bias. The qualitative data analysis will render more reliable results
when more than one analyst and coder is responsible for the content analysis of a cross-cultural
research study. This would lead to a higher inter-rater reliability and therefore lead to more valid
results.
For a holistic understanding of cross-cultural aspects of cell phone design the following model was
proposed for future work.
6.9 Proposed Research Model
The importance of designing cell phone interfaces by considering differences based on
disability and nationality is explained by using Jordon (2002)’s pleasurability framework . This
framework can be used to assess the specific needs of users with disabilities to provide insight for
the design process. The framework consists of four pleasures: sociological (relationships with
others), ideological (people’s values and beliefs), psychological (cognitive and emotional
characteristics) and physiological (anthropometrics). It is important to realize that needs of the user
group with disabilities differs somewhat from mainstream users. Designing products for people
with disabilities makes certain tasks possible for them, which would otherwise not be possible. For
example the speech based interface which made word processing, web browsing and other activities
possible for the blind. Jordon (2002)’s pleasurability framework was studied and its application in
designing for users with disabilities has been explained by Harrison (2004). The findings of this
thesis have been integrated with Jordon (2002) and Harrison (2004)’s theories, and a model has
been developed for a holistic view of designing cell phones for users with disabilities, explained as
follows in Figure 22:

132
Figure 22: Pyramid Model for Cell phone Design adopted from Jordon (2000)
Physiological
Physiological characteristics are related to the size and appearance of the body. The
population with disabilities is at a physiological disadvantage than the main stream population. The
user’s anthropometrics must be considered in the design of a product. For example a cell phone for
a person with limited upper extremity use must be designed such that the keys have minimal force
requirements and eliminate any tasks that require the press and hold operation. Physiological
characteristics depend mainly on the physical limitations of the users and therefore the accessibility
issues for a particular type of disability may not differ to a large extent. As found in this paper
significant differences were mainly found between disability and control groups on the physical
features and hardware attributes of cell phones.
Physiological
Sociological
Psychological
Ideological
Physical (Accessibility) Features: Cell Phone Hardware Attributes
Mobile/ Cell Phone Culture
Mobile/Cell phone
Usability
Cultural Values
Disability+Nationality
Disability+Nationality
Disability+Nationality
Disability
Influence of:

133
Sociological
Sociological characteristics deal with a person’s relationship with others. This includes the
country and culture the user belongs to and the values and customs associated with these. A sense
of normalcy is important for people with disabilities as they do not want to be a burden. Due to
social isolation, products that can increase interaction with other people are important. Designing
cell phone for users with disabilities will enable them to interact socially with their community.
Also by reducing the clinical look of the product, users’ feelings of social isolation due to negative
stigma could be reduced. Therefore it is important that an in-depth analysis of the mobile phone
culture in a country is undertaken understand and design implications of mobile phones for the
population with disabilities. In this paper the content analysis results of the focus group discussions
revealed the differences in the mobile/cell phone cultures, which helped in a enhanced interpretation
of the quantitative data collected.
Psychological
Psychological characteristics are related to cognitive and emotional characteristics of people
or a group of people. It includes characteristics of intelligence, skill and creativity. It includes the
ability to learn, memorize, and tolerate errors, the perceived ease of use. The usability of a product
can be perceived by understanding the psychological characteristics of the users. A design
implication of this for a person with a deteriorated short term memory having difficulties with
memorizing, would be a menu that is wide as opposed to a deep menu structure will be preferred for
such an individual. Most people with disabilities may experience some degree of negative emotion
(frustration, avoidance, anxiety) when faced with new or complex technology. As many of these
users are already suffering from emotional difficulties, they may be more susceptible to frustration.
Therefore, it is important to lower the occurrence of frustration by reducing the number of possible
errors and ensuring a short learning time. Studying existing technology used by people with
disabilities and adapting certain features in the design of cell phones is important and must be

134
considered for future work. In this paper was found that the perceived usability of the interface was
rated differently by different groups based on nationality and disability. For example one finding in
this research was that using popular terminology on cell phones such as profiles or modes (or visa
versa) reduced the frustration experience and increased the usability ratings when adapting to new
cell phone models.
Ideological
Ideological characteristics deal with a person’s values, morals, tastes and aspirations. During
the study of these characteristics it is important to consider the emic and etic variables used to
define cultural dimensions. A careful consideration of the boundaries of culture is essential as well,
where cultural values may be defined by disability as well as nationality. An in depth analysis of
the cultural differences and similarities between the target population provides holistic perspective
to the design of cell phones for a population with disabilities. The findings of cultural variables
must be further studied to understand their design implications. For example, it has been observed
that the user population with disabilities does not want to waste money on useless or unusable
products. They often refuse to buy equipment that cannot be of benefit to other people as well. It is
important to ensure that the product look and feel aesthetically satisfies the user with disability as
well. It is imperative that in designing a product that is usable and accessibility, the aesthetic appeal
aspect is not overlooked, to ensure that the product experience is pleasurable for the user.

135
REFERENCES
Answers.Com. Retrieved June 10, 2005, from http://www.answers.com/cell+phone&r=67 Aykin, N. (2005). Overview: Where to start and what to consider. In N. Aykin (Ed.), Usability and
internationalization of information technology. Mahwah, New Jersey: Lawrence Erlbaum Associates, Publishers.
. Barber, W., & Badre, A. (1998, June 5). Culturability: The merging of culture and usability. Paper
presented at the 4th Conference on Human Factors & the Web, New Jersey. Benyon, D., Crerar, A., & Wilkinson, S. (2001). Individual differences and inclusive design. In C.
Stephanidis (Ed.), User interfaces for all: Concepts, methods and tools (pp. 21-46): Lawrence Erlbaum Associates, Publishers.
Brown, S. E. (2001). Disability culture. Independent Living Institute Newsletter 2001-12 Retrieved
November 20, 2005, from http://www.independentliving.org/newsletter/12-01.html#anchor1 Carbone, J. (2005, Sep 15). India takes first steps in electronics. Retrieved September 16, 2005, from http://www.purchasing.com/article/CA6255675.html?industryid=21951 Carrol, R. (2003, August 4). Millions getting rid of landline phones. Retrieved November 12,
2005, from http://www.kinetowireless.com/news/industry_articles/millions.html Choi, B., Lee, I., Kim, J., & Jeon, Y. (2005, April 2-7). A qualitative cross-national study of
cultural influences on mobile data service design. Paper presented at the CHI 2005, Portland, Oregon, USA.
Christie, P. M. J., Kwon, I.-W. G., Stoeberl, P. A., & Baumhart, R. (2003). A cross-cultural
comparison of ethical attitudes of business managers: India, Korea and the United states. Journal of Business Ethics, 46, 263-287.
C.I.A.-The World Fact Book. (2006, September 7 2006). Retrieved March 20, 2006, from
http://www.cia.gov/cia/publications/factbook/index.html Cliff, N., & Keats, J. A. (2003). The application of ordinal test theory to items in tests used in
crosscultural comparisons. In Ordinal measurement in behavioral sciences. Mahwah, New Jersey: Lawrence Erlbaum Associates, Publishers.
Crano, W. D., & Brewer, M. B. (2002). Priniciples and methods of social science research (2nd
ed.). Mahwah, New Jersey: Lawrence Erlbaum Associates, Publishers. CTIA Semi Annual Wireless Industry Survey. (2006) Washington DC: CTIA The Wireless Association. Retrieved April 11, 2006 from http://www.ctia.org/research_statistics/index.cfm/AID/10030 Disability status. (2000). In U. S. C. Bureau (Ed.).

136
Emiliani, P. L. (2001). Special needs and enabling technologies. In C. Stephanidis (Ed.), User interfaces for all: Concepts, methods and tools. Mahwah, New Jersey: Laurence Erlbaum Associates, Publishers.
Ferreira, R. (2002). Culture and e-commerce: Culture based preferences for interface information
design. Virginia Polytechnic Institute and State University, Blacksburg, Virginia. Gartner Press Release (2005). Gartner Says Mobile Phone Sales Will Exceed One Billion in 2009.
Retrieved April 11, 2006 from http://www.gartner.com/press_releases/asset_132473_11.html
Gould, E. W. (2005). Synthesizing the literature on cultural values. In N. Aykin (Ed.), Usability and
internationalization of information technology (pp. 74-121). Mahwah, New Jersey: Laurence Erlbaum Associates.
Gregor, P., & Newell, A. F. (2001, May 22-25). Designing for dynamic diversity m making
accessible interfaces for older people. Paper presented at the WUA UC'O1, Alchcer do Sal, Portugal.
Gupta, R. (2005, May 25). Rural India beckons cellular operators. Retrieved November 29, 2005,
from http://www.ciol.com/content/search/showarticle1.asp?artid=70852 Harzing, A.-W. (2006). Response styles in cross-national survey research: A 26-country study.
International Journal of Cross Cultural Management, 6(2), 243-266. Henry, S. L. (2002, July 8-12, 2002). Another–ability: Accessibility primer for usability specialists.
Paper presented at the UPA 2002, Orlando, Florida USA. Hines, A. M. (1993). Linking qualitative and quantitative methods in cross-cultural survey research:
Techniques from cognitive science. American Journal of Community Psychology, Vol. 2 No. 6, 1993, 2(6), 729-746.
Hofstede, G. (1994). Values survey module 1994. Retrieved June 8, 2005, from
http://feweb.uvt.nl/center/hofstede/VSM.html Hofstede, G. (1997). Cultures and organizations: Software of the mind: McGraw-Hill. Hofstede, G. (2002). The pitfalls of cross-national survey research: A reply to the article by spector
et al. On the psychometric properties of the hofstede values survey module 1994. Applied Psychology: An International Review, 51(1), 170-187.
Hoft, N. H. (1996). Developing a cultural model. In E. M. d. Galdo & J. Neilson (Eds.),
International user interfaces (1 ed., pp. 41-73): John Wiley & Sons, Inc. Honold, P. (1999). Learning how to use a cellular phone. Technical Communication, 196-205. Iwarsson, S., & Stahl, A. (2003). Accessibility, usability and universal design-positioning and
definition of concepts describing person-environment relationships. Disability and Rehabilitation, 25(2), 57-66.

137
Issac, H., Nickerson, R., Tarasewich, P., (2004). Cell Phone Use in Social Settings: Preliminary Results from a Study in the United States and France: Proceedings of the DSI 2004 Annual Meeting. Retrieved October 3, 2005 from http://www.ccs.neu.edu/home/tarase/
Jenkins, T. (2004). Towards a convention on disabilities. In U. N. Department of Public Information
(Ed.) (944, pp.1-10): News & Media Division. Jordon, P. W. (2000). Designing pleasurable products: Taylor and Francis. Kerston, G. E., Kerston, M. A., & Rakowski, W. M. (2002). Software and culture: Beyond the
internationalization of the culuture. Journal Of Global Information Management, 10(4), 86-101.
Ketola, P., & Roykkee, M. (2001, April 1 -2). Three facets of usability in mobile handsets. Paper presented at the CHI 2001: Workshop, Mobile Communications: Understanding Users, Adoption & Design, Seattle, Washington.
Kiljander, H., & Johanna, J. (2003). Dominant design in mobile user interfaces: User interface
styles. In C. Lindholm, T. Keinonen & H. Kiljander (Eds.), Mobile usability: How nokia changed the face of the mobile phone: McGraw-Hill Companies, Inc.
Kim, S., Kim, J. M., Choo, H., Kim, S.-H., & Kang, H. J. (2003, June 23-27). Cultural issues in
handheld usability - are cultural models effective for interpreting unique use patterns of korean mobile phone? Paper presented at the UPA (Usability Professionals' Association) Conference, Scottsdale, Arizona.
Kitzinger, J. (1995). Qualitative research: Introducing focus groups. BMJ, 311(7000), 299-302. Knodel, J. (1993). The design and analysis of focus group studies, a practical approach. In D. L.
Morgan (Ed.), Successful focus groups: Advancing the state of the art (pp. 35-50): Sage Publications.
Langton, A. J., & Ramseur, H. (2001). Enhancing employment outcomes through job
accommodation and assistive technology resources and services. Journal of Vocational Rehabilitation, 16(1), 2-37.
Lee, Y. S., Hong, S. W., Smith-Jackson, T. L., Nussbaum, M. A., & Tomioka, K. (2006).
Systematic evaluation methodology for cell phone user interfaces. Interacting with computers, 18(2), 304-325.
Lee, Y. S., Smith-Jackson, T. L., Nussbaum, M. A., Tomioka, K., & Bhatkhande, Y. (2004). Use of
product-interactive focus groups for requirement capture and usability assessment. Paper presented at the Proceedings of the 48th Annual Human Factors and Ergonomics Conference, New orleans, LA.
Marcus, A. (2005). User interface design and culture. In N. Aykin (Ed.), Usability and
internationalization of information technology (pp. 51-78). Mahwah, New Jersey: Laurence Erlbaum Associates.
Marcus, A., & Gould, E. W. (2000). Crosscurrents: Cultural dimensions and global web user-
interface design. Interactions, 7(4), 32-46.

138
Mooney, A., Nussbaum, M. A., & Smith-Jackson, T. L. (2002). Universal access in practice:
Usability evaluation of cellular telephones for users with disabilities. Paper presented at the HFES 46th Annual Meeting.
Motorola (2006). Towards the next billion subscribers: Motorola delivers on seamless mobility
vision. Retrieved April 11, 2006 from http://www.motorola.com/mediacenter/news/detail/0,,6405_6355_23,00.html#fn1 Newell, A. F. (1995). Extra-ordinary human-computer interaction. In A. D. N. Edwards (Ed.),
Extra-ordinary human-computer interaction: Interfaces for users with disabilities. New York, New York: Cambridge University Press.
Newell, A. F., & Gregor, P. (2001, 4-6 July). User sensitive inclusive design. Paper presented at the
JIM 2001, France. Oshlyyansky, L., Cairns, P., & Foy, K. (2004, 8-10 July). User centered design and the japanese
user. Paper presented at the IWIPS 2004, Vancouver, Canada. Peters, S. (2000). Is there a disability culture? A syncretisation of three possible world views.
Disability & Society, 15(4), 583–601. Population Reference Bureau Country Statistics. (2006). Washington DC: Population Reference
Bureau. Retrieved March 20, 2006. Prager, J. H. (1999, December 15). People with disabilities are the next consumer niche. The Wall
Street Journal. Rose, K. (2005). Intercultural human-machine systems: Emperical study of user requirements in
mainland china. In N. Aykin (Ed.), Usability and internationalization of information technology. Mahwah, New Jersey: Lawrence Erlbaum Associates, Publishers.
Sarker, S., & Wells, J. D. (2003). Understanding mobile handheld device use and adoption.
Communications of the ACM, 46(12). Smith-Jackson, T., Nussbaum, M. A., & Mooney, A. M. (2003). Accessible cell phone design:
Development and application of a needs analysis framework. Disability and Rehabilitation, 25(10), 549-560.
Smith, C. P. (2000). Content analysis and narrative analysis. In H. T. Reis & C. M. Judd (Eds.),
Handbook of research methods in social and personality psychology: Cambridge University Press.
Stewart, A. (1998). The ethnographer's method (Vol. 46): Sage Publications. Stewart, D. W., & Shamdasani, P. N. (1990). Focus groups: Theory and practice (Vol. 20): Sage
Publications.

139
Takagi, H., Asakawa, C., Fukuda, K., & Maeda, J. (2004, October 18–20). Accessibility designer: Visualizing usability for the blind. Paper presented at the ASSETS'04, Atlanta, Georgia, USA.
Telecom Regulatory Authority of India (2006). Press release dated 4/10/2006 (no. 36/2006) New
Delhi: Telecom Regulatory Authority of India. Retrieved 4/11/2006 from http://www.trai.gov.in/pr10apr06.pdf Thylefors, B. (1998). A global initiative for the elimination of avoidable blindness. Community Eye
Health Journal, 11(25), 1-16. Vijver, F. v. d., & Leung, K. (1997). Methods and data analysis for cross-cultural research: Sage
Publications. Yeo, A. (1996). World-wide chi: Cultural user interfaces, a silver lining in cultural diversity. SIG-
CHI, 28(3), 4-7.

140
Appendix A: Value Survey Module 94 Questionnaire
Please think of an ideal work situation, (you can disregard your present work situation, if it is not ideal). The work situation could be an employment or a student position at a university/school/college or any other. In choosing an ideal work situation, how important would it be to you ... (please choose one answer in each line across):
1 = of utmost importance 2 = very important 3 = of moderate importance 4 = of little importance 5 = of very little or no importance
1) To have sufficient time for your personal or family life
2) To have good physical working conditions (good ventilation and lighting, adequate
workspace, etc.)
3) To have a good working relationship with your direct superior
4) To have security of employment
5) To work with people who cooperate well with one another

141
6) To be consulted by your direct superior in his/her decisions
7) To have an opportunity for advancement to higher level positions
8) To have an element of variety and adventure at work
In your private life, how important is each of the following to you? (Please choose one answer in each line across):
1 = of utmost importance 2 = very important 3 = of moderate importance 4 = of little importance 5 = of very little or no importance
9) Personal steadiness and stability
10) Thrift
11) Persistence (perseverance)

142
12) Respect for tradition
13) How often do you feel nervous or tense at work?
1=never 2=seldom 3=sometimes 4=usually 5=always
14) In your experience, how frequently, are subordinates afraid to express disagreement with
their superiors? 1= very seldom 2= seldom 3= sometimes 4= frequently 5= very frequently
To what extent do you agree or disagree with each of the following statements? (Please choose one answer in each line across):
1 = strongly agree 2 = agree 3 = undecided 4 = disagree 5 = strongly disagree
15) Most people can be trusted

143
16) One can be a good manager/supervisor without having precise answers to most questions
that subordinates may raise about their work
17) An organization structure in which certain subordinates have two supervisors should be
avoided at all costs
18) Competition between peers usually does more harm than good
19) An organization's rules should not be broken-not even when the member thinks it is in the
organization’s best interest
20) When people have failed in life it is often their own fault

144
VSM 94 Formulae for Index Calculation
Power Distance Index (PDI)
The index formula is PDI = –35m(03) +35m(06) +25m(14) –20m(17) –20
in which m(03) is the mean score for question 03, etc.
The index normally has a value between 0 (small Power Distance) and 100 (large Power Distance), but values below 0 and above 100 are technically possible.
Individualism Index (IDV)
The index formula is IDV = –50m(01) +30m(02) +20m(04) –25m(08) +130
in which m(01) is the mean score for question 01, etc.
The index normally has a value between 0 (strongly collectivist) and 100 (strongly individualist), but values below 0 and above 100 are technically possible.
Masculinity Index (MAS)
The index formula is MAS = +60m(05) –20m(07) +20m(15) –70m(20) +100
in which m(05) is the mean score for question 05, etc.
The index normally has a value between 0 (strongly feminine) and 100 (strongly masculine), but values below 0 and above 100 are technically possible.
Uncertainty Avoidance Index (UAI)
The index formula is UAI = +25m(13) +20m(16) –50m(18) –15m(19) +120
in which m(13) is the mean score for question 13, etc.
Long-term Orientation Index (LTO)
The index formula is LTO = -20m(10) +20m(12) +40
(revised version 1999)
in which m(10 is the mean score for question 10, etc.
The index normally has a value between 0 (very short-term oriented) and 100 (very long-term oriented), but values below 0 and above 100 are technically possible.

145
Appendix B: Demographic Questionnaire
1) Are you: 1. Male 2. female
2) How old are you?
1. Under 20 2. 20-24 3. 25-29 4. 30-34 5. 35-39 6. 40-49 7. 50-59 8. 60 or over
3) How many years of formal school education (or their equivalent) did you complete (starting with primary school)?
1. 10 years or less 2. 11 years 3. 12 years 4. 13 years 5. 14 years 6. 15 years 7. 16 years 8. 17 years 9. 18 years or over
4) If you have or have had a paid job, what kind of job is it / was it?
1. No paid job (includes full-time students) 2. Unskilled or semi-skilled manual worker 3. Generally trained office worker or secretary 4. Vocationally trained craftsperson, technician, nurse, artist or equivalent 5. Academically trained professional or equivalent (but not a manager of people) 6. Manager of one or more subordinates (non-managers) 7. Manager of one or more managers
5) What is your nationality? _______________________________ 6) What was your nationality at birth (if different)?__________________________

146
7) Do you have a disability?
1. Yes 2. No
If yes please answer the following 8) 9) and 10): 8) What is your type of disability?
1. Upper Extremity Limitations 2. Full Blindness 3. Legal Blindness 4. Low Vision
9) When did you acquire this disability?
1. at birth 2. age 0- 6 years 3. age 6-12 years 4. age 12-18 years 5. after the age of 18
10) How did you acquire the disability?
1. it was congenital 2. through an illness or disease 3. because of an accident 4. any other cause________________________
11) Were you born in India?
1. Yes 2. No
12) Are your parents of Indian Origin?
1. Yes 2. No
13) Have you ever traveled/lived overseas?
1. Yes 2. No
14) Have you used a cell phone before?
1. Yes 2. No
If Yes then 15) For how many years have you used a cell phone?_____ 16) What cell phone model have you been using?________

147
Appendix C: Contact Information of Institutes/Agencies for the Visually Impaired (Locations of Focus Groups Conducted)
National Association for the Blind 11 Khan Abdul Gaffar Khan Road Worli Seaface Mumbai 400 025.
Tel. +9122 2493 8511
United States Access Board 1331 F Street, NW, Suite 1000 Washington, DC 20004-1111 Phone (voice): (202) 272-0080 toll free: (800) 872-2253 Phone (TTY): (202) 272-0082 toll free: (800) 993-2822 Fax: (202) 272-0081
Raleigh Lions Clinic For the Blind 315 Hubert Street Raleigh, NC 27603 Phone: 919-833-8611 Fax: 919-833-5664

148
Appendix D: Action Sequences of Tasks
Go to Main Menu
Select ‘Messaging’
Select ‘Create Message’
Select ‘SMS’
Type in the message
Add recipient ‘from contacts’
Select Target Contact from List
Send

149
Action Sequence for Sending a message
Go to main menu
Select ‘Settings’
Select ‘Phone Settings’
Select ‘Personalize’
profiles
Select Ring tone
Select desired ringtone from list

150
Appendix E: Interface Rating Questionnaire
The following features must be rated in a scale from 1-5, according to whether you would prefer this feature or not.
1) Minimal Steps or Keystrokes
2) Secondary information
Not necessary at all Very important
3) Variety of Contents
Not necessary at all Very important
4) Menu Labeling
Not necessary at all Very important
5) Efficient screen space utilization
Very important
Not necessary at all

151
Not necessary at all Very important
6) Large amount of information within a screen
Not necessary at all Very important
7) Personalizable interface (concept of Profiles)
Not necessary at all Very important
8) Familiar interface
Not necessary at all Very important
9) Using default folders/personalizable folders
Not necessary at all Very important
10) Hotkey, softkey, shortcut functions

152
Not necessary at all Very important 11) Programmable softkeys
Not necessary at all Very important
12) Group SMS
Not necessary at all Very important
13) Variety of fonts and font sizes
Not necessary at all Very important
14) Cell phone body aesthetic appeal (look and feel)
Not necessary at all Very important

153
Appendix F: INFORMED CONSENT FORM Title of Project: Cross cultural comparison of cell phone interface design preferences and performance among users with (and without) visual disabilities Principal Investigators: Tonya L. Smith-Jackson, Ph.D. and Ira Jhangiani (Graduate Student) PURPOSE OF PROJECT This project will acquire and analyze the preliminary information gathered from UK and German users with disabilities to develop questionnaires and tasks for the final study in the US and India. INFORMATION In this project, you will be instructed to perform tasks on the cell phone and then will be told to fill out questionnaires related to the task and design preferences of the interface. You will also be told to perform card sorting. A cultural questionnaire would have to be filled out at the end of the session. All sessions will be videotaped to support data collection RISKS Participation in this project does not place you at more than minimal risk of harm. BENEFITS You will be compensated for your participation, and you will be given information to contact the principal investigator to get information about the outcomes of the study. You will also benefit from knowing that you have participated in worthwhile research that has immediate and positive applications. CONFIDENTIALITY The information gained in this research project will be kept strictly confidential. At no time will the researchers release the results of the study to anyone other than individuals working on the project without your written consent. You will be identified only by a 3 digit study code. Data will be stored securely and will be made available only in the context of research publications and discussion. No reference will be made in oral or written reports that could link you to the data nor will you ever be identified as a participant in the project. We will use digitized portions of the videos of the focus group and experimental sessions. However, faces will be blurred or obscured so that you cannot be identified. However, your voice as well as your hands may be used to present specific issues requiring design attention. If you feel uncomfortable with the display of your hands and voice to other groups, please indicate on the second page. COMPENSATION You will be compensated at the rate of the equivalent of $10 US per hour (in pounds or deutschmarks) for participation in this research. Also, you will be reimbursed for travel to and from the focus group site up to the equivalent of $20 US. FREEDOM TO WITHDRAW You are free to withdraw from this study at any time without penalty.

154
APPROVAL This research project has been approved, as required, by the Institutional Review Board for Research Involving Human Subjects at Virginia Polytechnic Institute and State University and by the Department of Industrial and Systems Engineering. PARTICIPANT’S RESPONSIBILITIES It is very important that you keep the activities and information discussed confidential, since others will be participating in this research. QUESTIONS If you have questions, or do not understand information on this form, please feel free to ask them now. PARTICIPANT’S PERMISSION I have read and understand the Informed Consent and conditions of this project. I have had all questions answered. I hereby acknowledge the above and give my voluntary consent for participation in this project. If I participate, I may withdraw at any time without penalty. Signature _______________________________________________________________ Date _______________________________________________________________ PARTICIPANT’S PERMISSION TO USE EXCERPTS FROM VIDEOTAPED SESSIONS (FACES WILL BE OBSCURED OR BLOCKED) I have read and understand the manner in which videos will be used for subsequent presentation of information related to this study. I understand that my face will not be identifiable because it will be obscured or blocked. I understand that my hands and voice will be presented as relevant to the operation of cell phones. I grant permission to researchers to present this information as necessary in the manner described on this form. Signature _______________________________________________________________ Date _______________________________________________________________ I do not grant permission to researchers to present this information as necessary in the manner described on this form. I do not want any digitized images of my hands or recorded voice to be used for presentation purposes. Signature _______________________________________________________________

155
Date _______________________________________________________________ CONTACT If you have questions at any time about the project or the procedures, you may contact the principal investigator, Tonya Smith-Jackson at 231-4119 or [email protected] (519-H Whittemore). If you feel you have not been treated according to the descriptions in this form, or your rights as a participant have been violated during the course of this project, you may contact Dr. David Moore, Chair of the Institutional Review Board Research Division at 231-4991.

156
Appendix G: IRB Amendment

157
Appendix H: Hardware Features Phone Body How do you feel about the size of the phone?
Don’t like at all Like very much How do you feel about the shape of the phone?
Don’t like at all Like very much How do you feel about the weight of the phone?
Don’t like at all Like very much When dialing, how does it feel to hold this phone?
Very Bad Very Good When speaking, how does it feel to hold this phone?
Very Bad Very Good Keys (Buttons) How do you feel about the size of the buttons on the key pad?
Don’t like at all Like very much How do you feel about the shape of the buttons?
Don’t like at all Like very much Indicate how easy it is to press the buttons?
Don’t like at all Like very much

158
Indicate how easy it is to read labels on the key?
Very Bad Very Good LCD Screen How do you feel about the size of the LCD screen?
Don’t like at all Like very much Indicate how easy it is to open the LCD screen.
Don’t like at all Like very much How do you feel about rotating the LCD screen?
Don’t like at all Like very much How do you feel about the contrast of the LCD screen?
Don’t like at all Like very much How do you feel about the brightness of the LCD screen?
Don’t like at all Like very much How do you feel about the font size in the menu?
Don’t like at all Like very much 15-1. If you don’t like the font size, what is the reason? □ Too small □ Too large □ Else:_________ Overall Look and satisfaction

159
16. How do you feel about the overall look of the phone?
Don’t like at all Like very much 17. Indicate how satisfactory the phone is, overall
Not satisfactory at all Satisfactory very much

160
Appendix I: Software Usability Ratings 1. Indicate how easy it was to complete this task.
Very Difficult Very Easy 2. Indicate how easy it was to locate or find functions in menus.
Very Difficult Very easy 3. Indicate how easy it was to identify relevant keys on the phone keypad.
Very Difficult Very easy 4. Indicate how meaningful the icon was to the function/feature?
Not meaningful at all Very meaningful 5. Indicate how understandable the menu label was to the function?
Not understandable at all Very understandable 6. How would you rate feedback or response from the phone on undertaking actions (beeps to indicate when you press a key, text messages to indicate the task completion, etc.)?
Very Bad Very Good 7. How important do you find this function?
Not at all important very important 8. How often do you use this task?
Not at all very often 9. Is this function essential in a mobile phone?
Not at all essential Very essential

161
Appendix J: Dimension scores of Combined Country and Disability groups
Group
Dimension India US LB CG
PDI 75.6061 23.3824 32.973 47 IDV 86.0606 90.5882 84.1892 93.5 MAS 42.7273 16.1765 38.9189 17.3333 UAI 36.5152 51.4706 64.1892 19.3333 LTO 38.1818 40 38.3784 40

162
Appendix K: Summary of Overview Grids