a decision support system for symptom-based common
TRANSCRIPT
A Decision Support System for Symptom-based CommonDiseases and Image-based Skin Diseases Detection
by
Moinul Alam Joy19166022
A thesis submitted to the Department of Computer Science and Engineeringin partial fulfillment of the requirements for the degree of
M.Sc. in Computer Science
Department of Computer Science and EngineeringBrac University
May 2021
© 2021. Brac UniversityAll rights reserved.

Declaration
It is hereby declared that
1. The thesis submitted is my/our own original work while completing degree atBrac University.
2. The thesis does not contain material previously published or written by athird party, except where this is appropriately cited through full and accuratereferencing.
3. The thesis does not contain material which has been accepted, or submitted,for any other degree or diploma at a university or other institution.
4. We have acknowledged all main sources of help.
Student’s Full Name & Signature:
Mohammad Moinul Alam Joy19166022
1

Approval
The thesis/project titled “A Decision Support System for Symptom-based CommonDiseases and Image-based Skin Diseases Detection” submitted by
1. Mohammad Moinul Alam Joy
Of spring, 2021 has been accepted as satisfactory in partial fulfillment of the re-quirement for the degree of M.Sc. in Computer Science on May 06, 2021.
Examining Committee:
Supervisor:(Member)
Dr. Md. Golam Rabiul AlamAssociate Professor
Dept. of Computer Science and EngineeringBRAC University
Program Coordinator:(Member)
Dr. Amitabh ChakrabartyAssociate Professor
Dept. of Computer Science and EngineeringBrac University
Head of Department:(Chair)
Sadia Hamid Kazi,Ph.DChairperson and Associate Professor
Department of Computer Science and EngineeringBrac University
2

Abstract
Nowadays, it has become difficult to get in touch with a doctor for the current pan-demic situation. Patients need to wait several days to get an appointment from thedoctor and visiting the hospitals in recent times is also very risky. So, The mainpurpose of this application is to give a patient the basic treatment by given his symp-toms so that he/she can receive medical services in home. This project focuses ontwo portions of disease detection. One portion is for common diseases and anotherone is for skin diseases. We have used different training algorithm for both portionsof disease detection. An online API has been used along with machine learning li-brary like tensorflow to produce the results. This mobile application not only showsthe probability of the diseases, but also gives information about the cure or solutions.
Keywords: Disease Prediction;Support Vector Machine; Machine Learning; SkinDisease; MobileNet; Collaborative filtering; Android Application.
3
Acknowledgement
Firstly, I would like to thank the Almighty God who provided us the opportunity tostudy at BRAC University, and blessed me with the most precious gift of physicaland mental health during the whole study period. I would like to take the opportu-nity to express my humble gratitude to my honorable supervisor, Dr. Md. GolamRobiul Alam, Associate Professor, Dept. of Computer Science and Engineering,BRAC University. Under His supervision, I have completed this project success-fully. His constant guidance and willingness made me understand this project andits manifestation in great depth of knowledge also helped me to complete the as-signed task. His endless support, cooperativeness, inspiration, outstanding guidance,constructive criticism, and fantabulous suggestions throughout the progress of ourwork helped me make this work far better. I am cordially grateful to him and I feelblessed to have him as my supervisor.
4
Table of Contents
Declaration 1
Approval 2
Abstract 3
Acknowledgment 4
Table of Contents 5
List of Figures 7
List of Tables 8
Nomenclature 8
1 Introduction 91.1 Introduction . . . . . . . . . . . . . . . . . . . . . . . . . . . . . . . . 91.2 Motivation . . . . . . . . . . . . . . . . . . . . . . . . . . . . . . . . . 91.3 Problem Background . . . . . . . . . . . . . . . . . . . . . . . . . . . 101.4 Objectives . . . . . . . . . . . . . . . . . . . . . . . . . . . . . . . . . 10
2 Related Work 12
3 Methodology 153.1 Proposed System Diagram . . . . . . . . . . . . . . . . . . . . . . . . 15
3.1.1 Dataset for Common Disease . . . . . . . . . . . . . . . . . . 173.1.2 Data Visualization . . . . . . . . . . . . . . . . . . . . . . . . 173.1.3 Implementation Using Web Scraping . . . . . . . . . . . . . . 193.1.4 Data Preprocessing . . . . . . . . . . . . . . . . . . . . . . . . 193.1.5 Intelligent Smart Symptom Prediction . . . . . . . . . . . . . 193.1.6 User Clustering . . . . . . . . . . . . . . . . . . . . . . . . . . 193.1.7 Smoothing . . . . . . . . . . . . . . . . . . . . . . . . . . . . . 213.1.8 New Ratings . . . . . . . . . . . . . . . . . . . . . . . . . . . . 213.1.9 The Dense User-Item Matrix . . . . . . . . . . . . . . . . . . . 223.1.10 Item Clustering . . . . . . . . . . . . . . . . . . . . . . . . . . 223.1.11 Algorithm . . . . . . . . . . . . . . . . . . . . . . . . . . . . . 223.1.12 Selecting Clustering Centers . . . . . . . . . . . . . . . . . . . 233.1.13 Selecting Neighbors . . . . . . . . . . . . . . . . . . . . . . . . 243.1.14 Producing Recommendations . . . . . . . . . . . . . . . . . . 24
5
3.1.15 Support Vector Machine . . . . . . . . . . . . . . . . . . . . . 263.1.16 Decision Boundary . . . . . . . . . . . . . . . . . . . . . . . . 263.1.17 Equation of Hyperplane . . . . . . . . . . . . . . . . . . . . . 273.1.18 Distance Measure . . . . . . . . . . . . . . . . . . . . . . . . . 273.1.19 Optimal Hyperplane . . . . . . . . . . . . . . . . . . . . . . . 273.1.20 SVM Representation . . . . . . . . . . . . . . . . . . . . . . . 283.1.21 Kernel Trick . . . . . . . . . . . . . . . . . . . . . . . . . . . . 283.1.22 Kernel Functions . . . . . . . . . . . . . . . . . . . . . . . . . 29
3.2 Skin Disease Prediction . . . . . . . . . . . . . . . . . . . . . . . . . . 293.2.1 Dataset . . . . . . . . . . . . . . . . . . . . . . . . . . . . . . 303.2.2 Data Visualization . . . . . . . . . . . . . . . . . . . . . . . . 303.2.3 MobileNet Description . . . . . . . . . . . . . . . . . . . . . . 313.2.4 MobileNet Architecture . . . . . . . . . . . . . . . . . . . . . . 32
3.3 Image Preprocessing . . . . . . . . . . . . . . . . . . . . . . . . . . . 353.4 Training Algorithm . . . . . . . . . . . . . . . . . . . . . . . . . . . . 353.5 Inference Algorithm . . . . . . . . . . . . . . . . . . . . . . . . . . . . 363.6 Final Result . . . . . . . . . . . . . . . . . . . . . . . . . . . . . . . . 37
4 Implementation and Result Analysis 384.1 Implementation . . . . . . . . . . . . . . . . . . . . . . . . . . . . . . 38
4.1.1 Diagnosis . . . . . . . . . . . . . . . . . . . . . . . . . . . . . 394.1.2 Diagnosis Sample Response . . . . . . . . . . . . . . . . . . . 394.1.3 Proposed Symptoms Sample Response . . . . . . . . . . . . . 404.1.4 SVM Accuracy . . . . . . . . . . . . . . . . . . . . . . . . . . 40
4.2 Implementation of skin disease prediction . . . . . . . . . . . . . . . . 404.2.1 Confusion Matrix . . . . . . . . . . . . . . . . . . . . . . . . . 424.2.2 Accuracy . . . . . . . . . . . . . . . . . . . . . . . . . . . . . 42
4.3 Result . . . . . . . . . . . . . . . . . . . . . . . . . . . . . . . . . . . 424.3.1 Common Disease Prediction . . . . . . . . . . . . . . . . . . . 44
4.4 Skin Disease Prediction . . . . . . . . . . . . . . . . . . . . . . . . . . 47
5 Conclusion 505.1 Conclusion . . . . . . . . . . . . . . . . . . . . . . . . . . . . . . . . . 50
5.1.1 Limitations . . . . . . . . . . . . . . . . . . . . . . . . . . . . 505.1.2 Future Work . . . . . . . . . . . . . . . . . . . . . . . . . . . . 50
Reference 52
6
List of Figures
1.1 A general view of the project . . . . . . . . . . . . . . . . . . . . . . 11
3.1 Proposed System Model . . . . . . . . . . . . . . . . . . . . . . . . . 163.2 Dataset for common disease . . . . . . . . . . . . . . . . . . . . . . . 173.3 Data visualization of common disease prediction . . . . . . . . . . . . 183.4 Collaborative Filtering . . . . . . . . . . . . . . . . . . . . . . . . . . 203.5 User Clustering . . . . . . . . . . . . . . . . . . . . . . . . . . . . . . 203.6 Item Clustering . . . . . . . . . . . . . . . . . . . . . . . . . . . . . . 223.7 Result for common disease prediction . . . . . . . . . . . . . . . . . . 253.8 How SVM works . . . . . . . . . . . . . . . . . . . . . . . . . . . . . 263.9 Kernel Trick . . . . . . . . . . . . . . . . . . . . . . . . . . . . . . . . 283.10 Different type of skin disease . . . . . . . . . . . . . . . . . . . . . . . 303.11 Data visualization for skin disease . . . . . . . . . . . . . . . . . . . . 313.12 Block diagram of MobileNet . . . . . . . . . . . . . . . . . . . . . . . 333.13 Inference algorithm . . . . . . . . . . . . . . . . . . . . . . . . . . . . 363.14 Skin disease output . . . . . . . . . . . . . . . . . . . . . . . . . . . . 37
4.1 Tensor flow Lite image . . . . . . . . . . . . . . . . . . . . . . . . . . 414.2 Confusion Matrix . . . . . . . . . . . . . . . . . . . . . . . . . . . . . 42
7
List of Tables
3.1 Common parameters . . . . . . . . . . . . . . . . . . . . . . . . . . . 193.2 Proposed Symptoms . . . . . . . . . . . . . . . . . . . . . . . . . . . 243.3 MobileNet Architecture . . . . . . . . . . . . . . . . . . . . . . . . . . 343.4 Training MobileNet . . . . . . . . . . . . . . . . . . . . . . . . . . . . 36
4.1 Diagnosis contents . . . . . . . . . . . . . . . . . . . . . . . . . . . . 394.2 SVM Accuracy . . . . . . . . . . . . . . . . . . . . . . . . . . . . . . 404.3 MobileNet Accuracy . . . . . . . . . . . . . . . . . . . . . . . . . . . 42
8
Chapter 1
Introduction
1.1 Introduction
It is important to stay healthy and fit. But as time goes on, life is becomimngmore and more hectic by the day to reach out for medical appointments. The solepurpose of this android project is to provide quick, easy and comfortable medicalaid to people who might need it. The patient can get the primary knowledge abouttheir diseases by checking symptoms. They can get the probability with percentageof every disease which is depending on their symptoms. In case of skin diseases, thepatients can see the probability of the occurrence of skin disease by live streaming,taking a picture through the application or by selecting a picture of their skin diseasefrom the gallery option in their phone. In this Covid-19 pandemic situation, thisis making a risk factor while people are going to the hospital to meet doctors.Several people are getting infected everyday by covid-19 by visiting the hospitals.To get medical attention, the patients have to go through the ordeal of going tothe hospital, getting an appointment, waiting in line in a queue, all of which mightbe inconvenient for a patient in need of immediate medical treatment. If by someinconvenience the doctor has to cancel the appointment, the patients then findshimself in a very bothersome situation. Besides, people are not informed whichdisease they are suffering from by checking their symptoms. They have to wait forthe doctor’s confirmation. So we are introducing this project so that the patientscan get medical care in their home in this difficult times. The proposed work isan android application that will help people to find out any kind of disease bychecking their symptoms. They can be notified about their disease and they willknow about the reason and cure of the disease. In case of skin disease, we tried todetect and predict 7 common skin diseases by taking skin disease image data frompublic websites and manually taken images. Then the images are classified into thecorrect skin disease group by training in MobileNet CNN. [19].
1.2 Motivation
In this pandemic situation, getting an appointment of a doctor, especially in thehospital is very difficult and risky given the circumstances. To decrease this risk,people should take a step to consult or getting suggestions from a doctor from theirplaces. Besides, several times doctors cannot get free time. In that time, if peoplecan get suggestions just by selecting symptoms then it would be much pleasant and
9
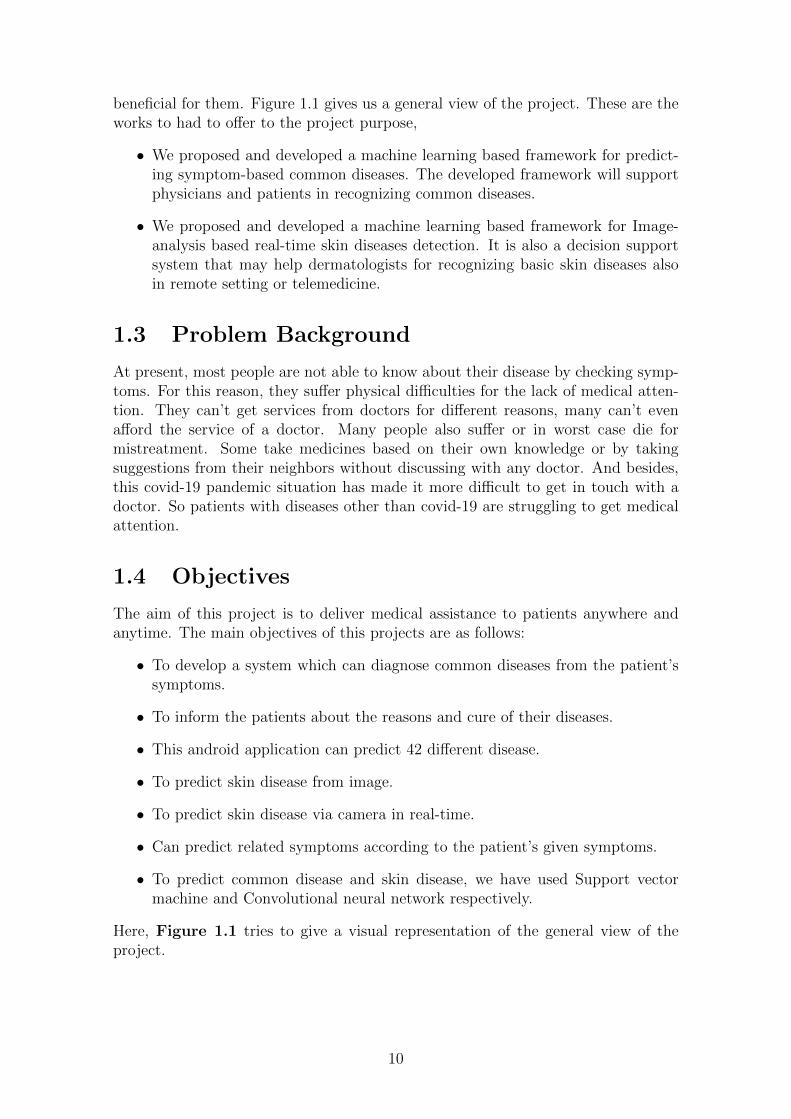
beneficial for them. Figure 1.1 gives us a general view of the project. These are theworks to had to offer to the project purpose,
• We proposed and developed a machine learning based framework for predict-ing symptom-based common diseases. The developed framework will supportphysicians and patients in recognizing common diseases.
• We proposed and developed a machine learning based framework for Image-analysis based real-time skin diseases detection. It is also a decision supportsystem that may help dermatologists for recognizing basic skin diseases alsoin remote setting or telemedicine.
1.3 Problem Background
At present, most people are not able to know about their disease by checking symp-toms. For this reason, they suffer physical difficulties for the lack of medical atten-tion. They can’t get services from doctors for different reasons, many can’t evenafford the service of a doctor. Many people also suffer or in worst case die formistreatment. Some take medicines based on their own knowledge or by takingsuggestions from their neighbors without discussing with any doctor. And besides,this covid-19 pandemic situation has made it more difficult to get in touch with adoctor. So patients with diseases other than covid-19 are struggling to get medicalattention.
1.4 Objectives
The aim of this project is to deliver medical assistance to patients anywhere andanytime. The main objectives of this projects are as follows:
• To develop a system which can diagnose common diseases from the patient’ssymptoms.
• To inform the patients about the reasons and cure of their diseases.
• This android application can predict 42 different disease.
• To predict skin disease from image.
• To predict skin disease via camera in real-time.
• Can predict related symptoms according to the patient’s given symptoms.
• To predict common disease and skin disease, we have used Support vectormachine and Convolutional neural network respectively.
Here, Figure 1.1 tries to give a visual representation of the general view of theproject.
10

Figure 1.1: A general view of the project
11
Chapter 2
Related Work
The related projects and researches to point out the research gaps are briefly dis-cussed in this particular chapter. A Smartphone-Based Skin Disease ”ClassificationUsing MobileNet CNN” is a similar mobile application which detects only skin dis-eases using MobileNet model [19]. They used transfer learning method using theMobileNet model on seven skin diseases. This resulted in creating a skin diseaseclassifier system on an android application. The authors gathered 3,406 number ofimages and it was observed that the classes contained unequal number of images.So it was considered as imbalanced dataset. To improve the accuracy, they useddifferent preprocessing and sampling method on input data.
Another related work is ”Mobile Application for Preliminary Diagnosis of Disease”which focuses on detecting common diseases and providing recommendations. Thisparticular application contains an information system which can analyze the symp-toms of patient’s disease and can also determine preliminary diagnosis. It can alsorecommend doctors of a particular specialization, which actually helps the patientsfind their desired doctor’s service which is suitable for their current condition [13].
Another paper, ”Effective Heart Disease Prediction Using Hybrid Machine Learn-ing Techniques” [16] is about predicting heart diseases. A heart disease can causea lot of suffering to a person. It can cut a person’s life span in half if infected. Itis a very critical challenge to predict cardiovascular disease in the world of clinicaldata analysis. Nowadays, machine learning is giving effective assistance in decisionmaking and predictions which are produced from large number of data. This dataare produced from large number of data. This data are provided by the health careindustry. The authors observed use of machine learning techniques in recent devel-opments in different sections of IoT(Internet of things). identifying a heart diseaseis not easy because of many risk factors like diabetes, abnormal pulse rate, highbp (blood pressure), high amount of cholesteral and many more. In order to findthe severity of a heart disease in humar body, different type of techniques in thefield of data mining along with neural network has been waged. K-nearest neigh-bour (KNN), Decision tree, Genetic algorithm, Naive bias algorithms can classifythe severity of the infected heart disease. The nature of heart disease is complexso it must be handled with great care, otherwise it may be the cause of prematuredeath. A good method to investigate data and predict heart disease is data miningwith classification. This paper introduces computer aided decision support system
12
in the world of research and medicine. The suthors proposed to diagnose heart dis-ease by applying genetic algorithm (GA). This method uses tournament selection,mutation and crossover; techniques provided by GA to construct newly proposedfitness function. Cleveland dataset collected from UCI machine learning repositoryis used for the experimentation. They also generated some rules of ”Particle swarnoptimization””(PSO) for heart disease. These rules along with encoding techniquesresulted an improvement in the overall accuracy. Symptoms, pulse rate, sex, ageand many other parameters are used to predict heart disease [16].
”Disease Prediction in Data Mining Technique – A Survey” focuses on comparingmultiple tecniques in detecting and predicting various disease. Data mining shiftsthrough anormous amount of data to gain valuable information. Association rules,classification, sequential patterns, prediction, clustering, etc are among some of themethods data mining offers. This methods can be used in many causes and applica-tions. Data mining plays a role of great importance and significance by reducing thenumber of tests required for the patient to detect a certain disease. This also effectsperformance and time. But like other methods, This one also has pros and cons. Inthis paper, the authors analyzed various types of data mining techniques to predictvarious kind of diseases. The paper reviewed research papers gthat mainly focuseson predicting diabetes, breast cancer and heart disease. Applying data mining inmedical research requires a hypothesis. Later, the results are adjusted accordingto the hypothesis. Although, this technique is unlike normal data mining methodwhere the process starts with datasets relying on no particular hypothesis. A tra-ditional data mining method mainly concentrates on patterns and trends consistingin a dataset, which are unlikely to be confronted in medical data mining purpose.Clinical decisions rests in the hands of the doctors advice and suggetion. Excessivemedical cost, unwanted bias, errors can cause low quality of service. Generating aknowledge base environment can be achieved by applying data mining [18].
This paper focuses on Identifying research contributions which consists of appli-cation of multiple supervised learning algorithms to detect a certain disease. Thispaper gives us a summary of the corresponding performance evaluation of differ-ent versions of supervised learning algorithms which are used for predicting disease.This valuable piece of information can help fellow researchers to decide which su-pervised machine learning algorithms should they choose to use for their purpose.In the recent years, the data science researchers have given a great amount of at-tention to disease prediction along with medical information. The main concept ofthis paper is to shed light on the performance comparison on different versions ofsupervised learning algorithms. The availability of huge health databases, and widespread use of computer based technology has encouraged data science researchersto study more on the health service field [18].
This paper introduced a new approach which relies on coactive neuro fuzzy inferencesystem (CANFIS). This method is used for predicting heart disease. The proposedmodel was integreted with GA (genetic algorithm) combined with fuzzy logic ap-proach and neural network adaption capacities to diagnose a disease. The model wasproven to be of great importance and showed potentiality in predicting the heartdisease. The models performance was evaluated based on classification accuracy
13
and training performance. Fuzzy inference systems combines the evaluative natureof rules with capabilities of neural networks. To quickly and accurately approximatecomplex functions the CANFIS model integrates a modular network consisting offuzzy inputs. When the underlying function is variable, these type of networks solveproblems more swiftly and correctly. Use of genetic algorithm to search for thebest optimal number of MF for inputs were applied to improve the learning rate ofthe model. Learning rate, momentum coefficient were used for this purpose. Thismethod also allows to select the most relevant features from the training data. Thisresults in producing a smaller network which is less complicated; that contains theability to generate freshly uploaded data, because of removing redundant data. Tofind the best solution, the GA combines mutation operators, crossovers, selecvtionby searching and it keeps up the process until the specified goal is achieved. Thissolution is denoted as chromozome; it is a collection of genes. Genes act as CANFISparameters, which are to be optimized. In search of the best network parameters,the GA evolves the population corresponding to multiple generations. It does so bycreating an population and evaluating it by training network for chromozomes [5].
This particular paper proposes a system for early disease prediction. The proposedmodel consists of isolation forest which uses outlier detection method for removingoutlier data. To balance distribution of data and sunthetic minority oversamplingmethod is used along with ensemble approach to predict the disease. To extract themost significant risk factors and to build the proposed model, four datasets wereused. The authors also applied the model in an mobile application for practicalusage. The mobile app collects the risk factor data to send it to a remote server.With this approach, the user’s current condition will be diagnosed with the proposedmodel. After that, the prediction result will be back to the mobile app so that theuser may know and take necessary steps for prevention about any disease occuranceat an early stage [14].
14
Chapter 3
Methodology
We are working on an application which can predict diseases given certain symptomsand can also propose more symptoms as input. This application has two mainfeatures, one is only for skin disease prediction and the other one is for commondiseases. For this purpose, we have used two algorithms. In this portion, we willtry to discuss about this algorithms and how they work.
3.1 Proposed System Diagram
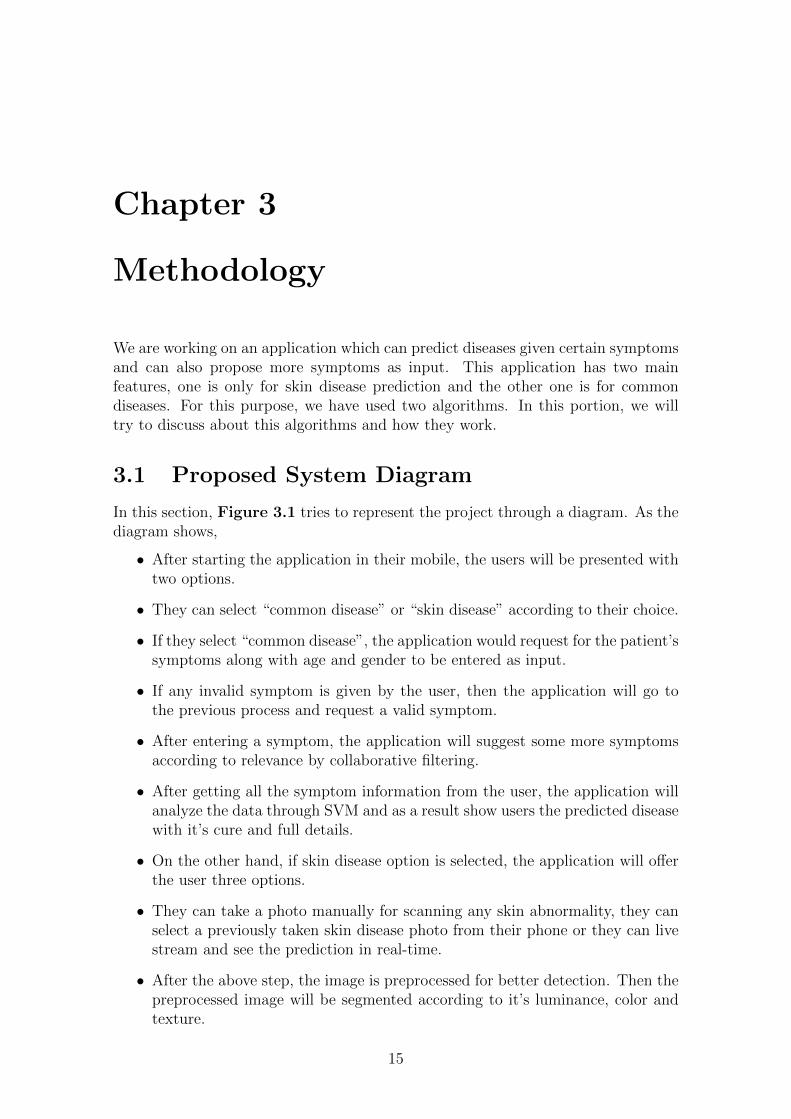
In this section, Figure 3.1 tries to represent the project through a diagram. As thediagram shows,
• After starting the application in their mobile, the users will be presented withtwo options.
• They can select “common disease” or “skin disease” according to their choice.
• If they select “common disease”, the application would request for the patient’ssymptoms along with age and gender to be entered as input.
• If any invalid symptom is given by the user, then the application will go tothe previous process and request a valid symptom.
• After entering a symptom, the application will suggest some more symptomsaccording to relevance by collaborative filtering.
• After getting all the symptom information from the user, the application willanalyze the data through SVM and as a result show users the predicted diseasewith it’s cure and full details.
• On the other hand, if skin disease option is selected, the application will offerthe user three options.
• They can take a photo manually for scanning any skin abnormality, they canselect a previously taken skin disease photo from their phone or they can livestream and see the prediction in real-time.
• After the above step, the image is preprocessed for better detection. Then thepreprocessed image will be segmented according to it’s luminance, color andtexture.
15
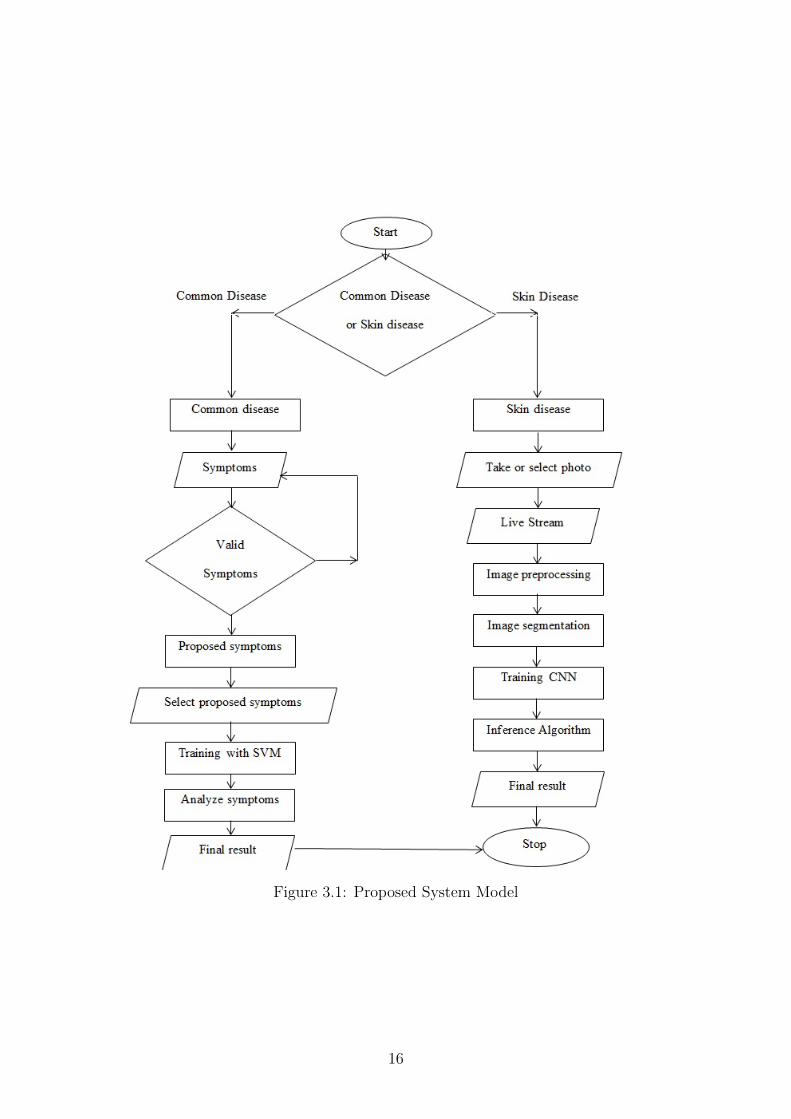
Figure 3.1: Proposed System Model
16
• Then the image will be trained by CNN algorithm for the skin disease predic-tion.
• Next an inference algorithm is applied where it takes the help of tensorflow toutilize the MobileNet model into android application properly.
• Finally the predicted disease is shown to the user.
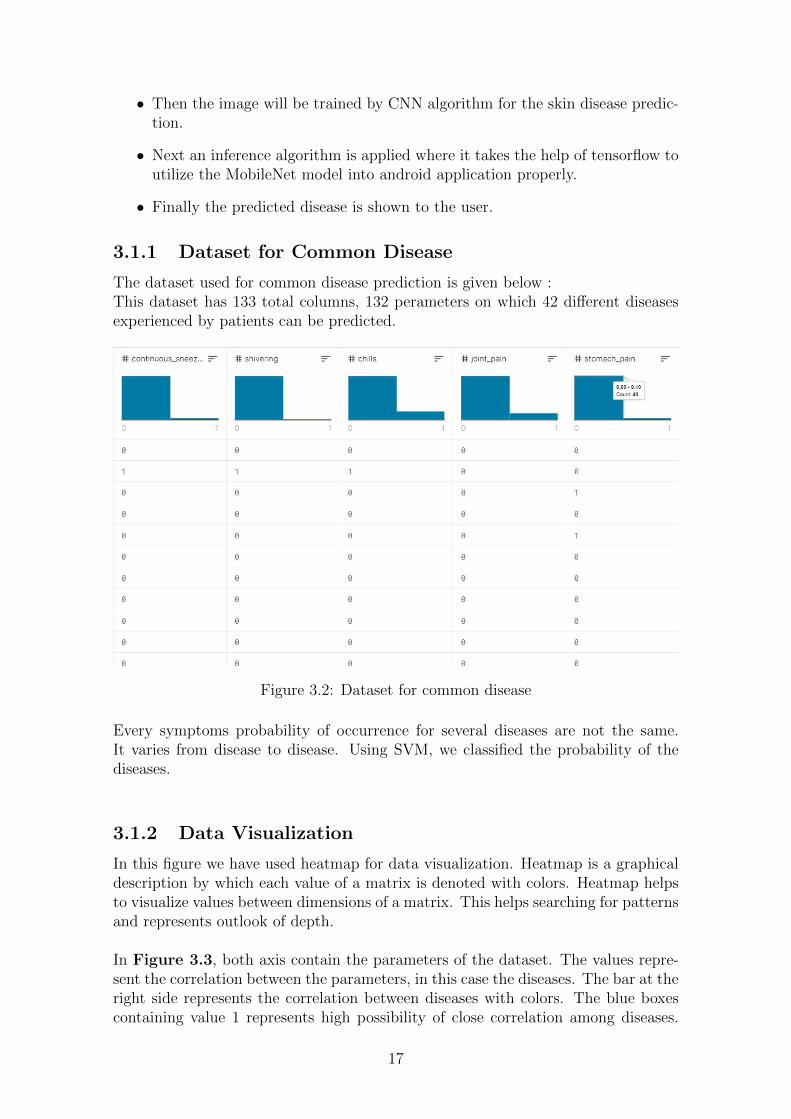
3.1.1 Dataset for Common Disease
The dataset used for common disease prediction is given below :This dataset has 133 total columns, 132 perameters on which 42 different diseasesexperienced by patients can be predicted.
Figure 3.2: Dataset for common disease
Every symptoms probability of occurrence for several diseases are not the same.It varies from disease to disease. Using SVM, we classified the probability of thediseases.
3.1.2 Data Visualization
In this figure we have used heatmap for data visualization. Heatmap is a graphicaldescription by which each value of a matrix is denoted with colors. Heatmap helpsto visualize values between dimensions of a matrix. This helps searching for patternsand represents outlook of depth.
In Figure 3.3, both axis contain the parameters of the dataset. The values repre-sent the correlation between the parameters, in this case the diseases. The bar at theright side represents the correlation between diseases with colors. The blue boxescontaining value 1 represents high possibility of close correlation among diseases.
17
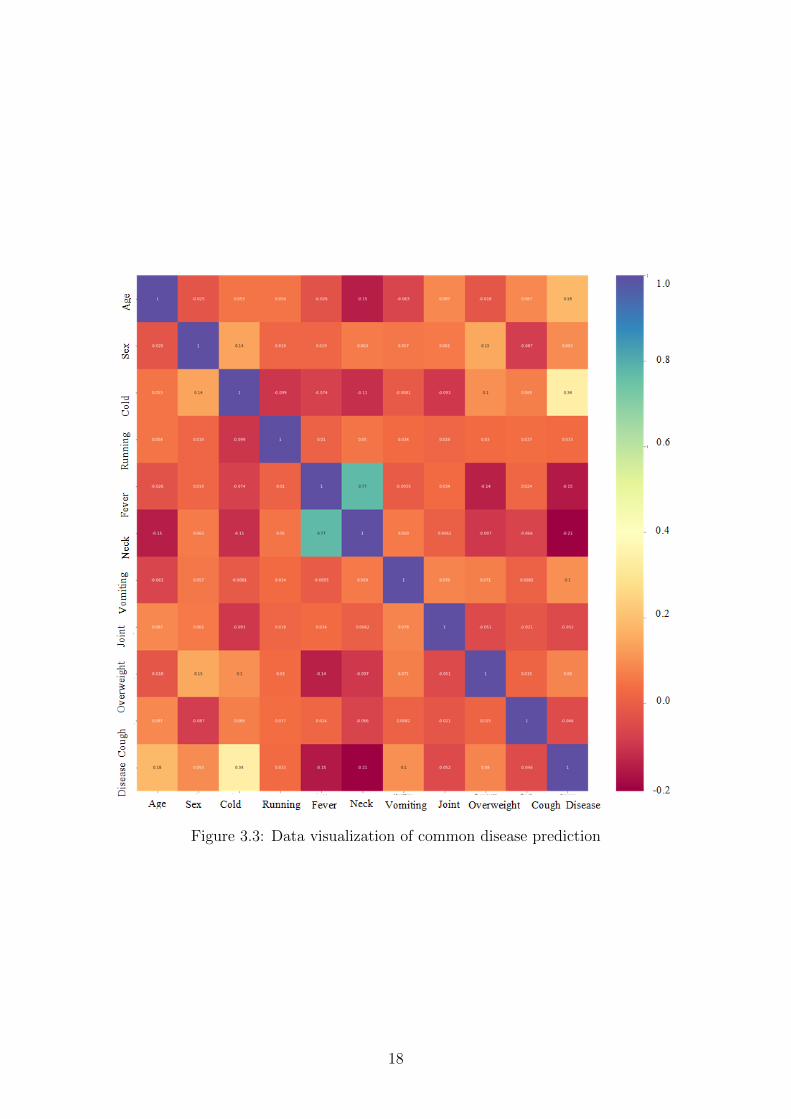
Figure 3.3: Data visualization of common disease prediction
18

Yellow boxes containing value 0.34 represent moderate correlation between diseasesand so on.
3.1.3 Implementation Using Web Scraping
Web scrapping is the process which extracts and combines data collected from theweb. [9]. We used webscraping to extract data from a web API for our predictionresults.
Parameter Type ValuesToken String Security token received from
https://authservice.priaid.ch/loginFormat(optional)
String json.xml
Table 3.1: Common parameters
3.1.4 Data Preprocessing
Machine learning’s rate of succes on any task can be influenced by various factors.Good quality of data and proper representation is top prioroty. The training phaseof the algorithm turns out to be worse and complex if the dataset consists of re-dundant data. Data preprocessing is a great solution to this kind of issues for it’sfeature extraction, transformation, data cleaning, normalization properties. Thismethod produces the final training set of data [4]. From the data preprocessing stepwe can extract the data which is needed for the prediction process.
3.1.5 Intelligent Smart Symptom Prediction
The necessity of effective recommender system increases every day rapidly as moreand more users are joining in the internet and also because the internet is expandingmassively in all sectors of life. [8].Collaborative filtering technique performs collaboration among data instances, sources,viewpoints to filter information. This method is very popular and widely used foranalyzing any user’s interest on a subject depending on the data of other similaruser’s view.
3.1.6 User Clustering
User clustering methods identifies groups of consumers who have interest on similarsubjects or topics. Predictions for a user can be created by producing the averageof opinions of other users in a cluster; this step occurs after the cluster is created.
19
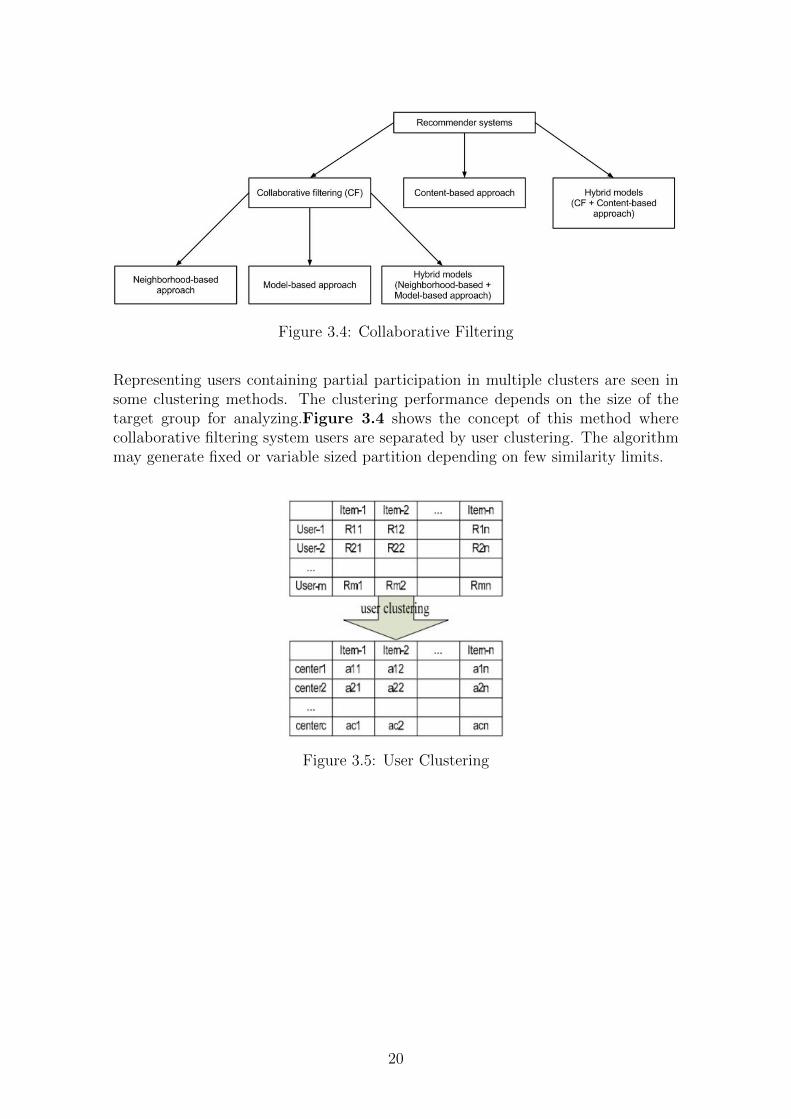
Figure 3.4: Collaborative Filtering
Representing users containing partial participation in multiple clusters are seen insome clustering methods. The clustering performance depends on the size of thetarget group for analyzing.Figure 3.4 shows the concept of this method wherecollaborative filtering system users are separated by user clustering. The algorithmmay generate fixed or variable sized partition depending on few similarity limits.
Figure 3.5: User Clustering
20

Here Rij is the rating of user i respect to item i, aij denotes average rating of thecenter of user i to item i, n represents number of items, m represents the number ofall users and user centers are denoted by c .
3.1.7 Smoothing
K means clustering algorithm is used in this purpose to form clustering centers byclustering users into few groups.The algorithm is as follows:
Algorithm 1 Smoothing Algorithm
1: Input the clustering number k, user-item grading matrix2: Give the smoothing grading as output3: Start4: Select set of user Y=Y1,Y2, . . . , Yz;5: Select set of item E=E1, E2, . . . , Ev;6: Select top k rated users for clustering7: CL = CL1, CL2, . . . , CLk;8: Clustering center k null if d = d1, d2, . . . , dk;9: do
10: for each user Y i ε Y11: for each cluster center CLj ε CL12: calculate the sim(Yi, CLj);13: end for14: sim(Yi, CLm)= max sim(Yi, CL1), sim(Yi, CL2), . . . , sim(Yi, CLk);15: cp = cp ∪ Y i16: end for17: for each cluster cp ε c18: for each user Y j ε Y19: CLi = mean(di, Yj);20: end for21: end for22: while C is unchanged23: Stop =0
3.1.8 New Ratings
Sparsity of data is one of the major problems faced in collaborative filtering. Plainuse of item clusters for prediction implementation was made so that unfilled valueswhich are part of user-item rating data can be predicted. Derived from the user-item clustering result, prediction mechanism is applied on free rating data as givenbelow,
Rij =
{Rij if user i rate the item j
cj else(3.1)
21
3.1.9 The Dense User-Item Matrix
Dense ratings from the users given to the items were obtained after applying theclustering algorithm. By this procedure, we get the dense user item matrix from theoriginal scattered user item matrix.
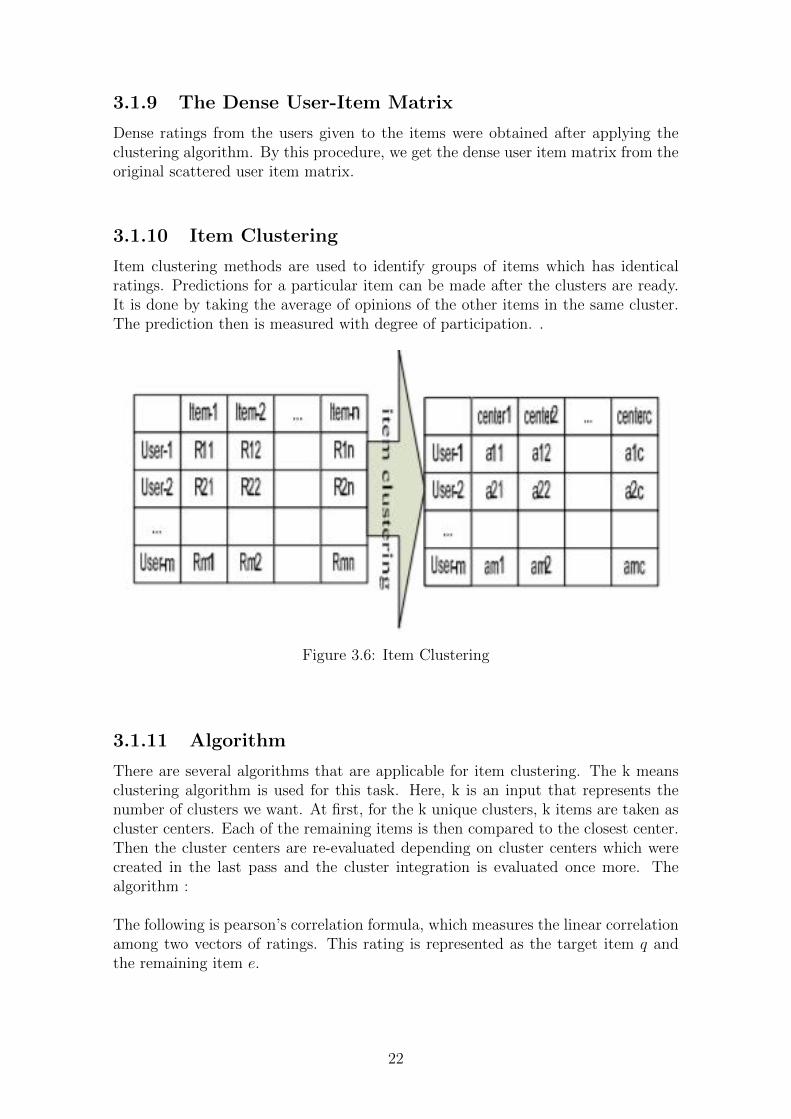
3.1.10 Item Clustering
Item clustering methods are used to identify groups of items which has identicalratings. Predictions for a particular item can be made after the clusters are ready.It is done by taking the average of opinions of the other items in the same cluster.The prediction then is measured with degree of participation. .
Figure 3.6: Item Clustering
3.1.11 Algorithm
There are several algorithms that are applicable for item clustering. The k meansclustering algorithm is used for this task. Here, k is an input that represents thenumber of clusters we want. At first, for the k unique clusters, k items are taken ascluster centers. Each of the remaining items is then compared to the closest center.Then the cluster centers are re-evaluated depending on cluster centers which werecreated in the last pass and the cluster integration is evaluated once more. Thealgorithm :
The following is pearson’s correlation formula, which measures the linear correlationamong two vectors of ratings. This rating is represented as the target item q andthe remaining item e.
22
Algorithm 2 Item Clustering
1: Input the clustering number k, user-item grading matrix2: Give the item center matrix as output3: Start4: Select set of user Y=Y1,Y2, . . . , Yz;5: Select set of item H = H1, H2, . . . , Hv;6: Select top k rated users for clustering7: CH=CH1, CH2, . . . , CHk;8: Clustering center k null if d = d1, d2, . . . , dk;9: do
10: for each item11: Hi ε H12: for each cluster center13: CHj ε CH14: evaluate the sim(Hi, CHj);15: end for16: sim(Hi, CHx) = maxsim(Hi, CH1), sim(Hi, CH2), . . . ,17: sim(Hi, CHk);18: dx = dx ε Hi19: end for20: while CY and d are unchanged21: for each cluster22: di ε d23: for each user24: Hj ε H25: CHi = mean (di, Hj);26: end for27: end for28: Stop =0
sim(q, e) =
∑jk=1(Rit− Ae)(Ria− Ae)√∑j
k=1(Riq − Aq)2∑j
k=1(Rie− Ae)2(3.2)
Here, Riq is the rating of our item q by user k. Rie denotes rating of the last iteme by user k. At is the mean rating of the target item q for every co-rated users, Aeis the mean rating of the last item e for every co-rated users, and j represents allrating users respect to the item q and item e.
3.1.12 Selecting Clustering Centers
Searching neighbors of the target item is a necessary step in collaborative filtering.Memory based collaborative filtering suffers from bad scalability if large amount ofusers and items are added in ratings database. The items center is obtained byclustering it. This center represents average rating of all items present in the clus-ter. After evaluating similarity between item and centers using pearson’s correlation
23
formula, the items of the most similar centers are selected.
3.1.13 Selecting Neighbors
Calculation of the similarity among the target item and selected clustering centeritems needs to be done after selecting the target item’s nearest cluster centers. Basedon the cosine measure, the top K most similar items were selected. The formulabelow states the angle between two vectors of rating as target item t and remainingitem r.
sim(h, e) =
∑ni=1(Riheie)√∑n
i=1Ri2h
∑ni=1Ri
2e
(3.3)
Here Rin denotes the target item t’s rating by user i, Rie denotes the remainingitem e’s rating by user i, the number of total rating n, to the item h and item e.
3.1.14 Producing Recommendations
Calculation of the weighted mean of the neighbor’s ratings, weighted by each otherssimilarity to the target item is possible after getting the membership of item. Targetuser j’s rating to the target item h is given below,
Qjh =
∑ni=1Rj i × sim(h, i)∑n
i=1 sim(h, i)(3.4)
Here Rij denotes the rating of target user j respect to neighbor item i, sim(h, i)represents similarity between target item h and the neighbor user i for every relevantitems. Lastly, n is the total number of rating users respect to item h and item v [6].This option is given to the application so that users don’t have to input symptomsmanually every time. It requests for proposed symptoms using the parameters be-low. It distinguishes a symptoms by it’s corresponding SL no. Symptoms withsimilar effects are proposed to the user for multiple selection.
Source https://healthservice.priaid.ch/symptoms/proposedParameter key,symptoms,yob,genderAccess Token
Parameter Type ValuesSymptom int[] array en-
coded by jsonArray contains sorted SLno. in json code, forexample [3,4,5]
Gender String male, femaleyob int
Table 3.2: Proposed Symptoms
After executing this steps, the result below is generated :
24
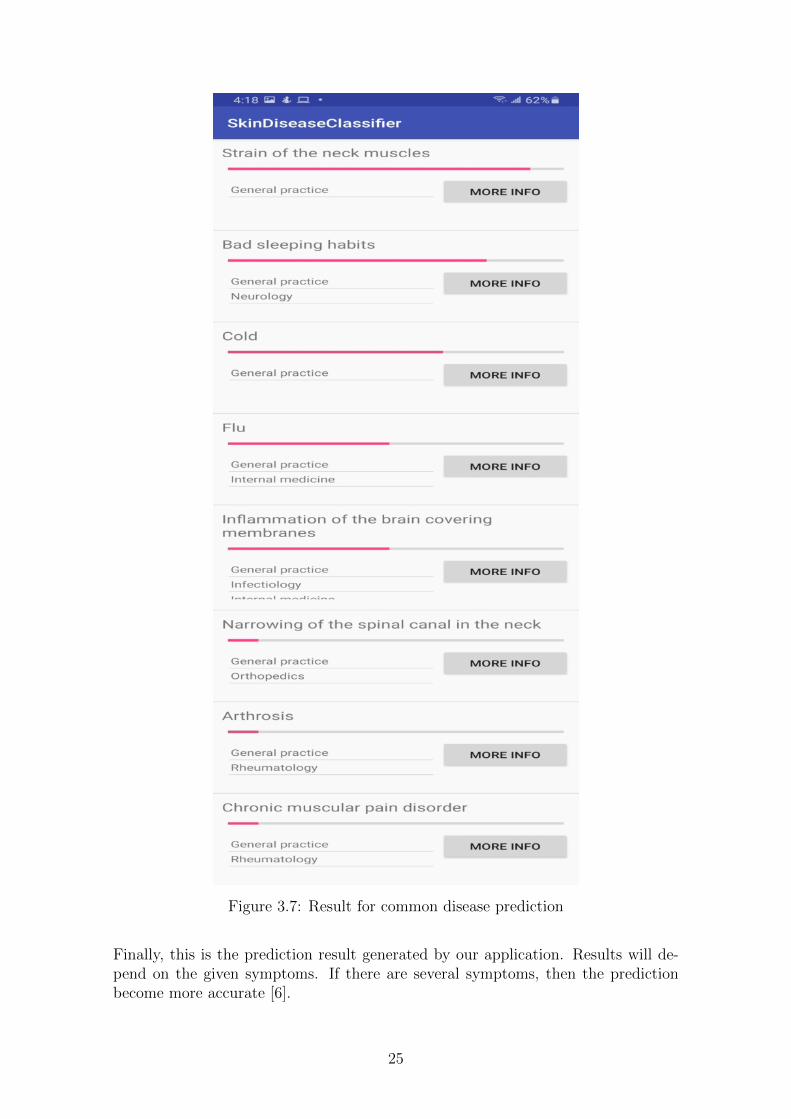
Figure 3.7: Result for common disease prediction
Finally, this is the prediction result generated by our application. Results will de-pend on the given symptoms. If there are several symptoms, then the predictionbecome more accurate [6].
25

3.1.15 Support Vector Machine
In case of solving classification problems containing huge data, support vector ma-chine might be one of the best choices. In a big data environment, it makes multido-main tasks relatively easy. But it is computationally costly and difficult to execute[12].SVM models works by dividing data into different classes consisting ina hyperplaneusing decision boundary. The hyperplane acts in an iterative manner to avoid er-rors. SVM’s main objective is to seperate the classes gained from the dataset forthe purpose of finding maximum marginal hyperplane.
Figure 3.8: How SVM works
Suppose we have dataset and we want SVM to classify male and female genders. Thisaction can be performed by first studying relevant characteristics of both genders.For unseen data, it needs to label them according to their gender. The character-istics that helps SVM classify data are called features. Defining a feature in realspace represents it’s domain. Mapping a function b = f(a) gives us the range andco-domain. Basically a data is presented to us to be divided by SVM. These dataare denoted as unique point in a feature space and every single point is denoted bya which are denoted as feature vectors.
a ε RF (3.5)
Further mapping points into feature space a ,
φ(a) ε RN (3.6)
We map the transformed basis vector φ(a) for the transformed feature space,
φ(a) : RF = RM (3.7)
3.1.16 Decision Boundary
SVM includes different kinds of variations like adaptive margin classifier, kernel trick,soft margin classifier etc. A constructive hyperplane’s job is to seperate classes. Thisis done by putting margins between each class. Even if classes contain noise andare overlapped even a slightest bit, they have similar properties [2]. On the otherhand, the decision boundary acts as the main divider to distribute features to theirrelevant classes.
26
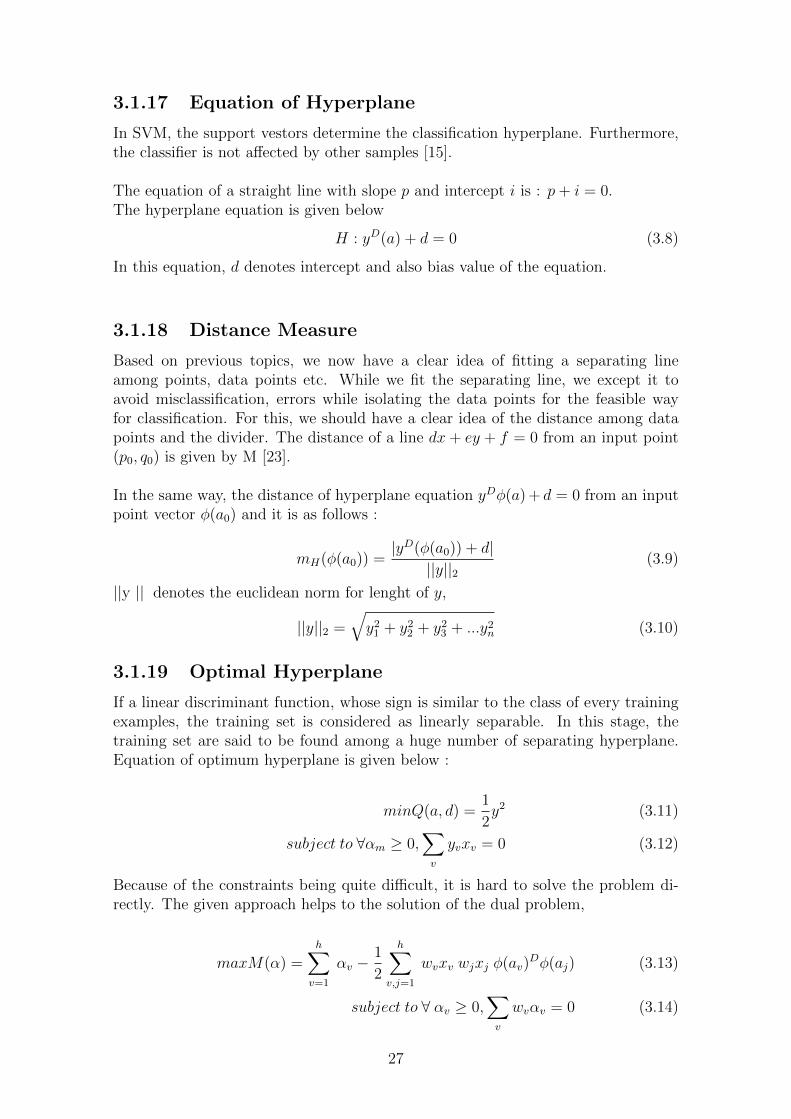
3.1.17 Equation of Hyperplane
In SVM, the support vestors determine the classification hyperplane. Furthermore,the classifier is not affected by other samples [15].
The equation of a straight line with slope p and intercept i is : p+ i = 0.The hyperplane equation is given below
H : yD(a) + d = 0 (3.8)
In this equation, d denotes intercept and also bias value of the equation.
3.1.18 Distance Measure
Based on previous topics, we now have a clear idea of fitting a separating lineamong points, data points etc. While we fit the separating line, we except it toavoid misclassification, errors while isolating the data points for the feasible wayfor classification. For this, we should have a clear idea of the distance among datapoints and the divider. The distance of a line dx+ ey + f = 0 from an input point(p0, q0) is given by M [23].
In the same way, the distance of hyperplane equation yDφ(a) + d = 0 from an inputpoint vector φ(a0) and it is as follows :
mH(φ(a0)) =|yD(φ(a0)) + d|
||y||2(3.9)
||y || denotes the euclidean norm for lenght of y,
||y||2 =√y21 + y22 + y23 + ...y2n (3.10)
3.1.19 Optimal Hyperplane
If a linear discriminant function, whose sign is similar to the class of every trainingexamples, the training set is considered as linearly separable. In this stage, thetraining set are said to be found among a huge number of separating hyperplane.Equation of optimum hyperplane is given below :
minQ(a, d) =1
2y2 (3.11)
subject to ∀αm ≥ 0,∑v
yvxv = 0 (3.12)
Because of the constraints being quite difficult, it is hard to solve the problem di-rectly. The given approach helps to the solution of the dual problem,
maxM(α) =h∑v=1
αv −1
2
h∑v,j=1
wvxv wjxj φ(av)Dφ(aj) (3.13)
subject to ∀ αv ≥ 0,∑v
wvαv = 0 (3.14)
27
3.1.20 SVM Representation
The QP formulation in case of SVM classification is given below :
SVM classification :
mine,ξv||e||2k +G
l∑v=1
ξ wve(av) ≥ 1 − ξv, for all vξv ≥ 0 (3.15)
For Dual formulation:
minxv
l∑v=1
αv −1
2
l∑v=1
l∑s=1
αvαsyvysK(av, as) 0 ≤ αv ≤ G, for all v;l∑
v=1
αvwv = 0
(3.16)The variables assess the mistake made at point (av, wv). Large number of trainingpoints makes the training procedure of SVM complex.
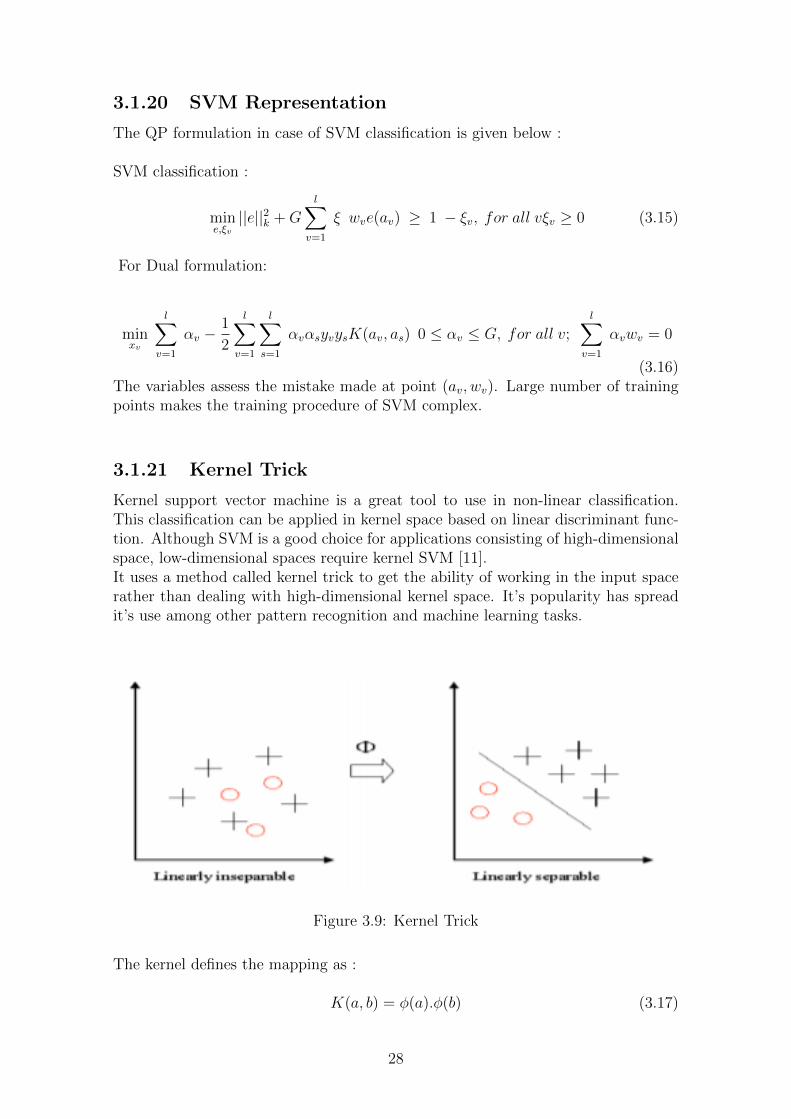
3.1.21 Kernel Trick
Kernel support vector machine is a great tool to use in non-linear classification.This classification can be applied in kernel space based on linear discriminant func-tion. Although SVM is a good choice for applications consisting of high-dimensionalspace, low-dimensional spaces require kernel SVM [11].It uses a method called kernel trick to get the ability of working in the input spacerather than dealing with high-dimensional kernel space. It’s popularity has spreadit’s use among other pattern recognition and machine learning tasks.
Figure 3.9: Kernel Trick
The kernel defines the mapping as :
K(a, b) = φ(a).φ(b) (3.17)
28
3.1.22 Kernel Functions
The kernel function’s motive is to grant the ability to perform operations in theinput space instead of infinite dimensional feature space. The finctions are requiredto perform mapping on the attributes of the currently working input space in thefeature space. It also plays a vital role on SVM performance and is based on repro-ducing Kernel Hilbert Spaces.
K(a, a′) = (φ(a), φ(a′) (3.18)
Mercer’s condition could be achieved if K is a symmetric positive definite function
K(a, a′) =∞∑n
xnφm(x)φn(a′), xn ≥ 0, (3.19)∫∫K(a, a′)y(a)y(a′)dada′ ≥ 0, y ε L2 (3.20)
After this, the kernel is able to produce a correct inner product in the feature space.The feature space consists of linearly separable training set. Variations of kernelfunction are given below :Polynomial : Polynomial mapping is used for non-linear modeling. The secondkernel avoids problems and is therefore, more preferable.
K(a, a′) = (a, a′)d (3.21)
K(a, a′) = ((a, a′) + 1)d (3.22)
This form of function uses Gaussian formulation :
K(a, a′) = exp(−||a− a′||2
2σ2) (3.23)
Exponential Radial Basis Function: This functions are preferable in a situationwhere discontinuities are acceptable. It produces linear solutions one by one.
K(a, a′) = exp(−||a− a′||2σ2
) (3.24)
Multi-Layer Perceptron: This function consists of a single hidden layer alongwith a valid kernel representation :
K(a, a′) = tanf(ρ(a, a′) + %) (3.25)
Fourier, spline, additive kernels, B-splines tensor products are also part of this clus-tering[3].
3.2 Skin Disease Prediction
Skin disease can occur for various skin abnormalites. The surroundings around uscan cause skin disease and infections too. Hidden bacteria, fungas forming overthe skin, allergic reactions are part of skin abnormalities that causes skin disease[24]. Environmental pollution, ozone layer, sun burn are also responsible for causing
29
skin disease. There are many classification algorithm which are developed or under-development to detect and predict skin disease [20]. Machine learning algorithmsare also designed to predict skin disease at an early stage. For this, the diseaseattributes needs to be studied thoroughly [21].Tensorflow is a public software library accesible to anyone for machine learning ap-plications. It mainly focuses on inference and training deep neural networks.
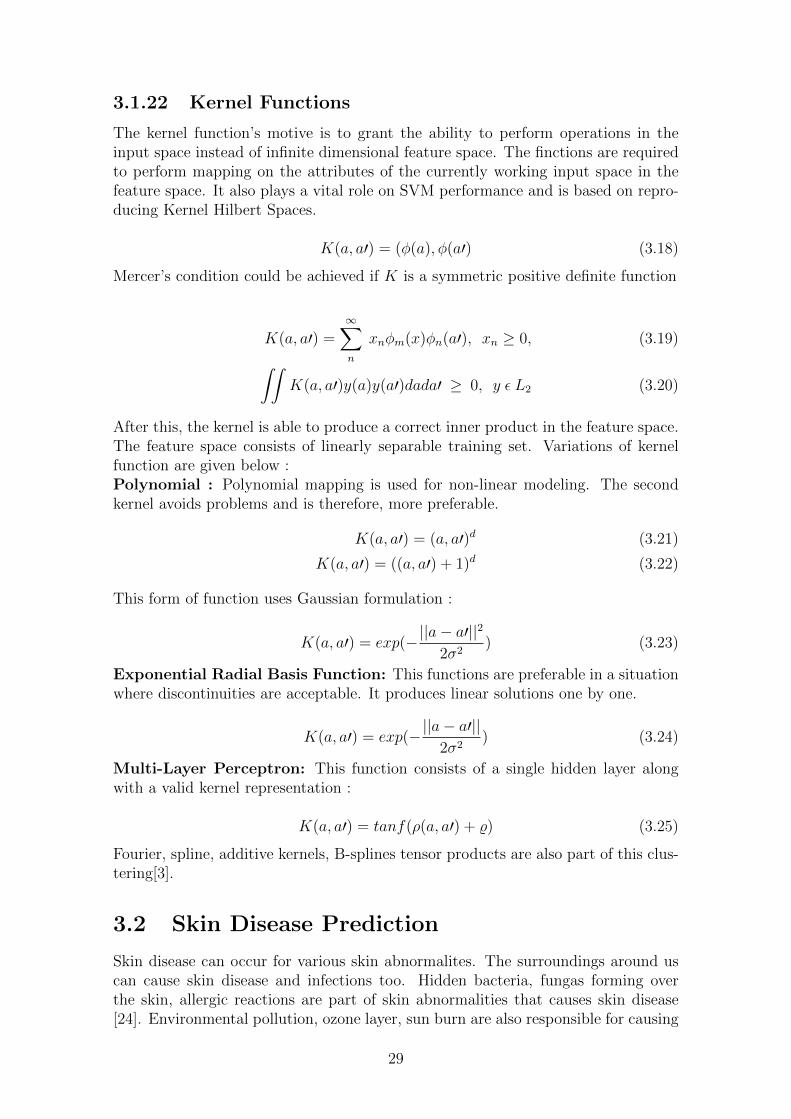
Figure 3.10: Different type of skin disease
3.2.1 Dataset
The dataset we used for this purpose consists of publicly accessible medical skindisease photos, manually taken photos and photos from dermetology repositories.The consisting images of the dermetology repositories are examined and valited byprofessional dermetologists. The dataset consists of herpes, acne, warts, eczema,actinic keratosis and cellulitis impetigo.
3.2.2 Data Visualization
In Figure 3.11, we have used a Piechart for data visualization. A piechart rep-resents the data consisting in a dataset by dividing them into distinct classes andputting them in a circle chart while dividing each class with radial slices. The classes’size is proportional to the amount of data it has in the original dataset. This figurerepresents the percentage of skin diseases present in our preferred dataset. We cansee that the percentage of “acne” is 18.8 percent, “actinic keratosis” is 15.4 percent,”eczema” is 12.5 percent and so on. With this we can see a clear representation ofthe present skin diseases in the dataset.
30
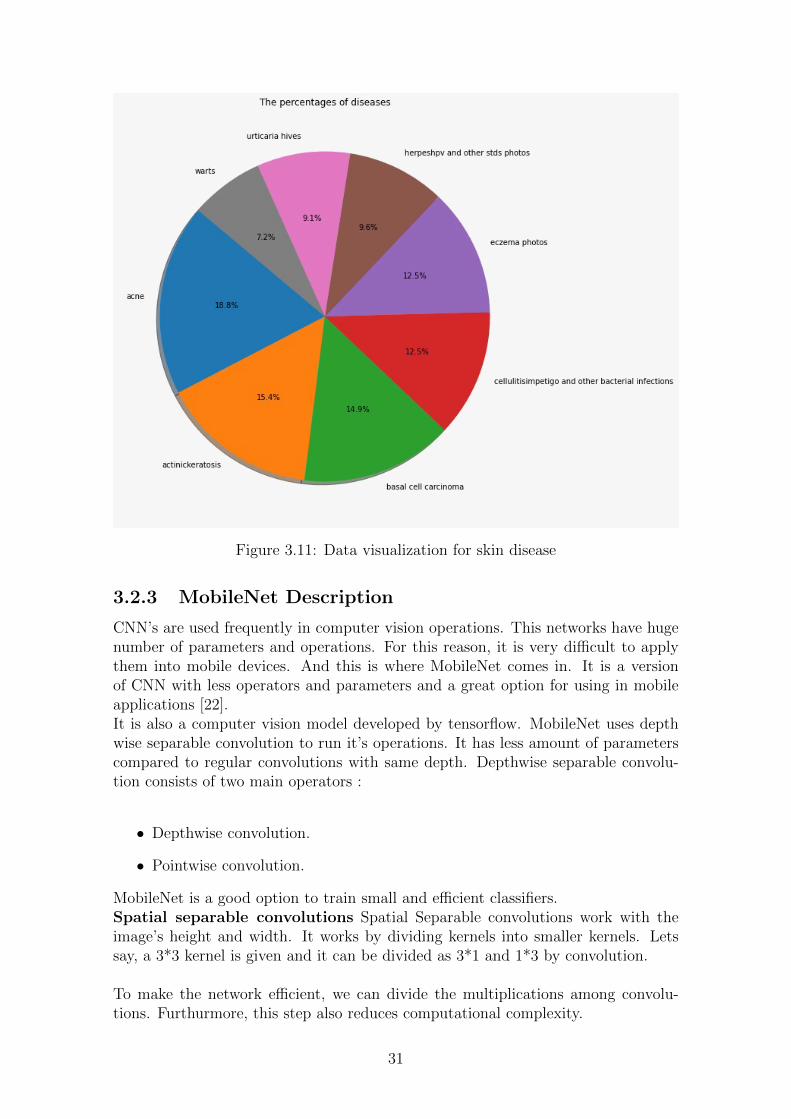
Figure 3.11: Data visualization for skin disease
3.2.3 MobileNet Description
CNN’s are used frequently in computer vision operations. This networks have hugenumber of parameters and operations. For this reason, it is very difficult to applythem into mobile devices. And this is where MobileNet comes in. It is a versionof CNN with less operators and parameters and a great option for using in mobileapplications [22].It is also a computer vision model developed by tensorflow. MobileNet uses depthwise separable convolution to run it’s operations. It has less amount of parameterscompared to regular convolutions with same depth. Depthwise separable convolu-tion consists of two main operators :
• Depthwise convolution.
• Pointwise convolution.
MobileNet is a good option to train small and efficient classifiers.Spatial separable convolutions Spatial Separable convolutions work with theimage’s height and width. It works by dividing kernels into smaller kernels. Letssay, a 3*3 kernel is given and it can be divided as 3*1 and 1*3 by convolution.
To make the network efficient, we can divide the multiplications among convolu-tions. Furthurmore, this step also reduces computational complexity.
31
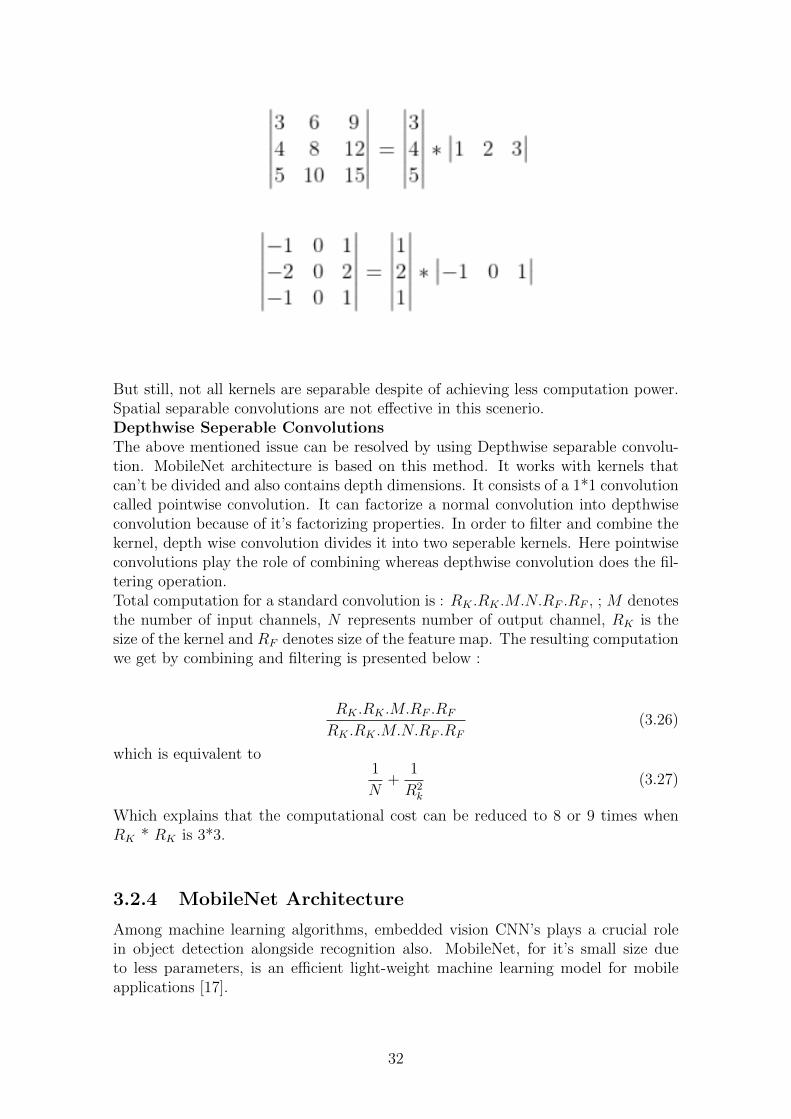
But still, not all kernels are separable despite of achieving less computation power.Spatial separable convolutions are not effective in this scenerio.Depthwise Seperable ConvolutionsThe above mentioned issue can be resolved by using Depthwise separable convolu-tion. MobileNet architecture is based on this method. It works with kernels thatcan’t be divided and also contains depth dimensions. It consists of a 1*1 convolutioncalled pointwise convolution. It can factorize a normal convolution into depthwiseconvolution because of it’s factorizing properties. In order to filter and combine thekernel, depth wise convolution divides it into two seperable kernels. Here pointwiseconvolutions play the role of combining whereas depthwise convolution does the fil-tering operation.Total computation for a standard convolution is : RK .RK .M.N.RF .RF , ; M denotesthe number of input channels, N represents number of output channel, RK is thesize of the kernel and RF denotes size of the feature map. The resulting computationwe get by combining and filtering is presented below :
RK .RK .M.RF .RF
RK .RK .M.N.RF .RF
(3.26)
which is equivalent to1
N+
1
R2k
(3.27)
Which explains that the computational cost can be reduced to 8 or 9 times whenRK * RK is 3*3.
3.2.4 MobileNet Architecture
Among machine learning algorithms, embedded vision CNN’s plays a crucial rolein object detection alongside recognition also. MobileNet, for it’s small size dueto less parameters, is an efficient light-weight machine learning model for mobileapplications [17].
32
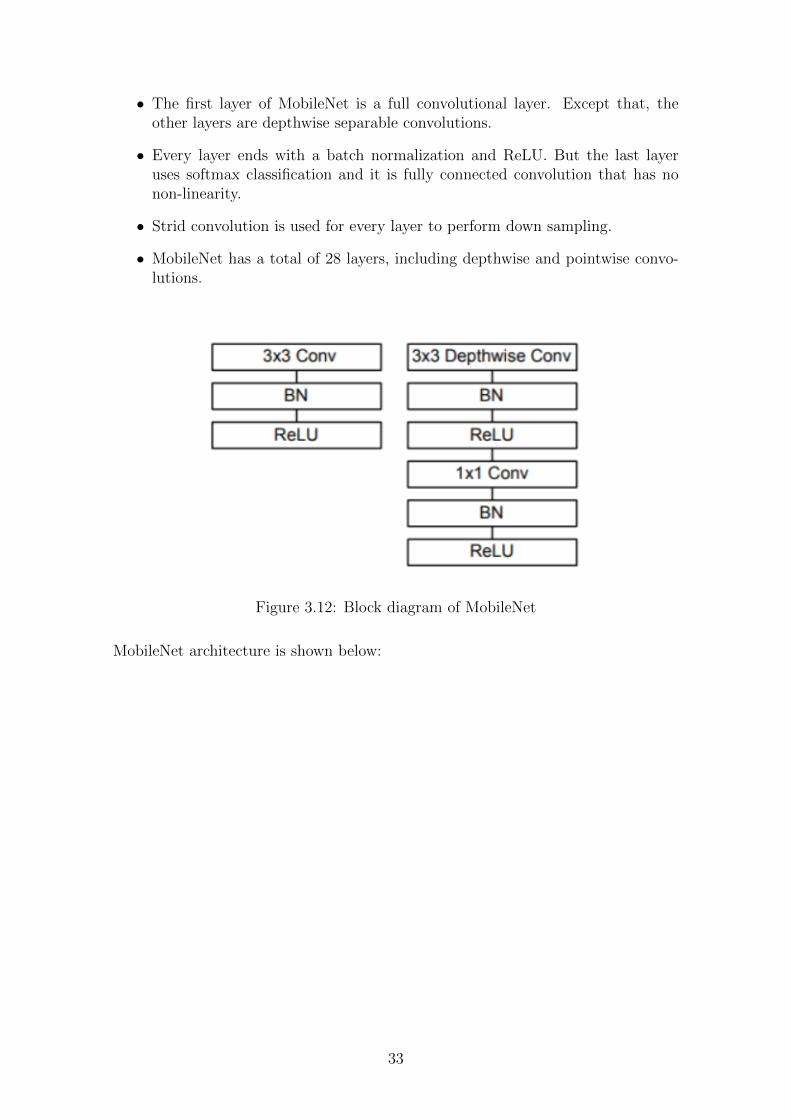
• The first layer of MobileNet is a full convolutional layer. Except that, theother layers are depthwise separable convolutions.
• Every layer ends with a batch normalization and ReLU. But the last layeruses softmax classification and it is fully connected convolution that has nonon-linearity.
• Strid convolution is used for every layer to perform down sampling.
• MobileNet has a total of 28 layers, including depthwise and pointwise convo-lutions.
Figure 3.12: Block diagram of MobileNet
MobileNet architecture is shown below:
33

Sort/Stride Refine Size Given ShapeCoLayer / s2 3 x 3 x 3 x 32 224 x 224 x 3CoLayer dpws / s1 3 x 3 x 3 x 32 dpws 112 x 112 x 32CoLayer / s1 1 x 1 x 32 x 64 112 x 112 x 32CoLayer dpws / s2 3 x 3 x 64 dpws 112 x 112 x 64CoLayer / s1 1 x 1 x 64 x 128 56 x 56 x 64CoLayer dpws / s1 3 x 3 x 128 dpws 56 x 56 x 128CoLayer / s1 1 x 1 x 128 x 128 56 x 56 x 128CoLayer dpws / s2 3 x 3 x 128 dpws 56 x 56 x 128CoLayer / s1 1 x 1 x 128 x 256 28 x 28 x 128CoLayer dpws / s1 3 x 3 x 256 dpws 28 x 28 x 256CoLayer / s1 1 x 1 x 256 x 256 28 x 28 x 256CoLayer dpws / s2 3 x 3 x 256 dpws 28 x 28 x 256CoLayer / s1 1 x 1 x 256 x 512 14 x 14 x 2565 x CoLayer dpws / s1 3 x 3 x 512 dpws 14 x 14 x 512
CoLayer / s1 1 x 1 x 512 x 512 14 x 14 x 512CoLayer dpws / s2 3 x 3 x 512 dpws 14 x 14 x 512CoLayer / s1 1 x 1 x 512 x 1024 7 x 7 x 512CoLayer dpws / s2 3 x 3 x 1024 dpws 7 x 7 x 1024CoLayer / s1 1 x 1 x 1024 x 1024 7 x 7 x 1024Mean Pool / s1 Pool 7 x 7 7 x 7 x 1024FC / s1 1024 x 1000 1 x 1 x 1024Softmax / s1 Classifier 1 x 1 x 1000
Table 3.3: MobileNet Architecture
34
Width Multiplier to achieve Thinner ModelsTo make MobileNet more smaller and less costly to minimize computational cost,another model needs to be constructed. In this model, a separate parameter is usedand is denoted as α and is known as width multiplier. It assists to make the modelslimmer uniformly. The number of input channels are denoted by C and transformsinto αC. The number of output channels are denoted as H and transforms intoαH. The computational cost that we get after this procedure is presented by theequation below,
RK .RK .αC.RF .RF + αC.αH.RF .RF (3.28)
A width multiplier’s purpose is to reduce the structure of a model which needs train-ing from scratch. It can define a smaller model by doing so resulting better size,accuracy and latency.
Resolution Multiplier for reduced representationThis is another parameter used for the same purpose as width multiplier and that isto reduce computational expense. It is denoted by ρ and by applying it to the inputimage, each layer’s internal representation is reduced. The computational cost ispresented by the equation given below:
RK .RK .αC.ρRF .ρRF + αC.αH.ρRF .ρRF (3.29)
The base MobileNet is represented by ρ = 1 and ρ < 1 represents the reduced com-putational MobileNets.
3.3 Image Preprocessing
Digital image processing has two very important steps which are image preprocess-ing and feature extraction [7].Image preprocessing is a method that explores different types of image in order todetect certain objects or patterns to give the desired output that exists within theimage. At first, the image’s quality needs to be enhanced for better performanceand it is done by converting it to a standard size. This helps the model for bettergeneralization. In case of skin disease images, features like hair and pigments arefiltered off for the purpose of enhancing the capability of detection.
Image SegmentationImage segmentation is also of great importance for medical-image applications [1].In this process, the result of image preprocessing is divided into disjoint regionswhich are homogeneous and properties like texture, color, luminance are chosen forthe sole purpose of making the analyzing process more meaningful.
3.4 Training Algorithm
Based on the given table below, we used the MobileNet CNN model for skin diseaseprediction. The input images were preprocessed by converting size to 224x224x3,
35
which is the ideal measurement of image MobileNet is capable of working with.For fine-tuning process, the last layer of the model was retrained alongside the
Model WeightSize
LoadingTime(seconds)
Accuracy(Percent)
MobileNet 16.821MB 4.837 84.28
Table 3.4: Training MobileNet
removal of the final classification layer. The model converts the input images in ameaningful form so that the processing part does not get complicated. After that,the first layer goes to the second layer (max-pooling) till the fully connected neuralnetwork can be achieved.
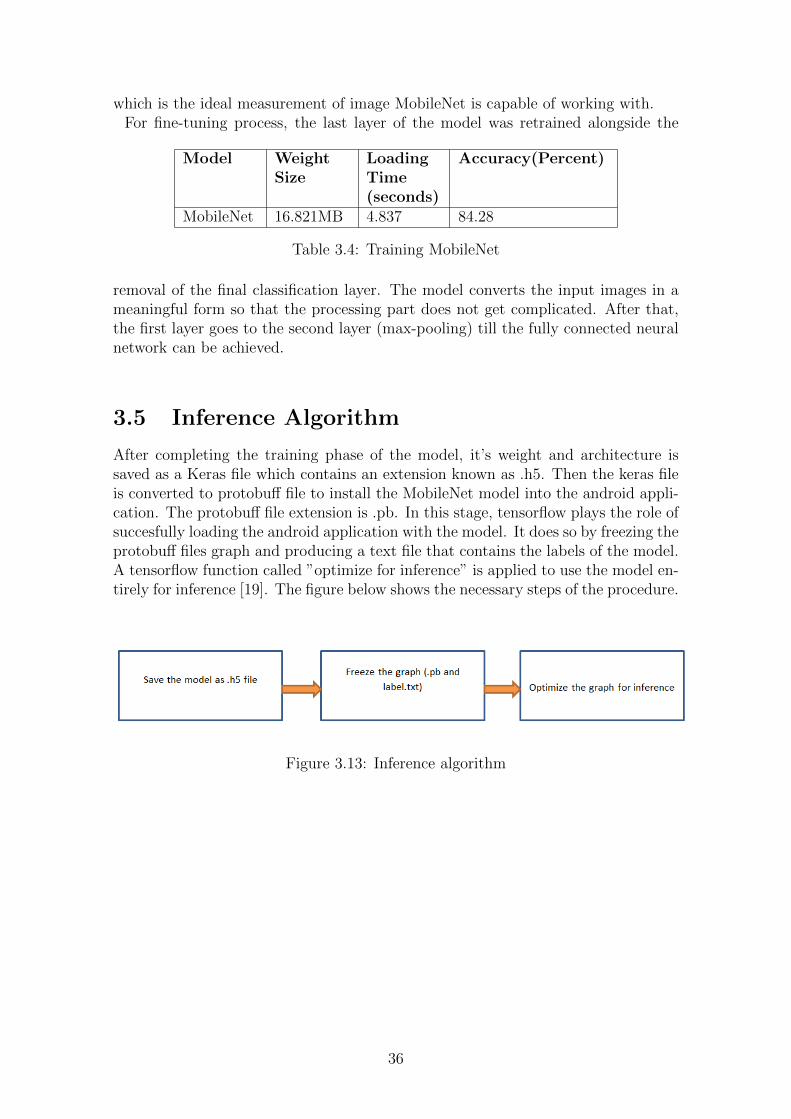
3.5 Inference Algorithm
After completing the training phase of the model, it’s weight and architecture issaved as a Keras file which contains an extension known as .h5. Then the keras fileis converted to protobuff file to install the MobileNet model into the android appli-cation. The protobuff file extension is .pb. In this stage, tensorflow plays the role ofsuccesfully loading the android application with the model. It does so by freezing theprotobuff files graph and producing a text file that contains the labels of the model.A tensorflow function called ”optimize for inference” is applied to use the model en-tirely for inference [19]. The figure below shows the necessary steps of the procedure.
Figure 3.13: Inference algorithm
36

3.6 Final Result
Figure 3.14: Skin disease output
37
Chapter 4
Implementation and ResultAnalysis
4.1 Implementation
This section discusses about the implementation process of the application whichincludes datasets, data visualization, accuracy and many more.
Sample response by scraping symptoms
Type of content : json for android application[{ ”SL no.”:288,”Label”:”Conjunctivity”},{”SL no.”:138,”Label”:”Yellow skin”},{”SL no.”:674,”Label”:”Red eyes”},{”SL no.”:34,”Label”:”Decreased appetite”},{”SL no.”:171,”Label”:”Choking while eating”},{”SL no.”:50,”Label”:”Pain while taking breath”},...
38
]Every symptom has a unique SL number. Like for “Yellow skin”, the SL no. is“138”. The data is coming from the api as json array. We had to scrap the datafrom the array using retrofit.
RetrofitRetrofit is a network library which helps in the webscrapping process. It works forjava and android. It’s job is to retrieve and upload files, in our case json files by awebservice that is REST based.
4.1.1 Diagnosis
This is the main function of the android application. It works on symptoms given bythe user and gives the appropriate disease prediction. It recognizes the symptomsvia SL no. of the corresponding symptoms which are stored in json array.
Source https://healthservice.priaid.ch/diagnosisParameter token,year of birth, gender, symptoms,Access Key
Parameter Type ValuesSymptom int[] array with
json formatSL no. of corresponding symptoms sorted injson array for instance, [155,156,157]
Gender String male,femaleyob integer
Table 4.1: Diagnosis contents
The endpoint’s output is generated as an array containing health diagnosis. Theparameters are (id, name, icd, profname, icdname). The elements have the corre-sponding accuray presented in percentage.
4.1.2 Diagnosis Sample Response
Type of content : json for android application]},{”Problem”:{”SL no.”: 252,”Label”: ”Bleeding internally”,”Medname”: ”Internel homorrhage””bcf” : ”B04.8”,”BcfLabel” : ”Ruptured blood”,”Precision”: 20},
39

4.1.3 Proposed Symptoms Sample Response
Type of content : json for android application
4.1.4 SVM Accuracy
By dividing accurately classified instances with the complete number of instancesexixting in the dataset, we can attain the accuracy.
Accuracy =TP + TN
TP + FP + TN + FN
According to the equation above TP is denoted as True positive, FP is denoted asFalse positive, FN represents False negative, and TN denotes True negativeTP Rate This term is also known as sensitivity in machine learning. For searchingthe high true positive rate, this ability is used.
TPR =TP
TP + FN
Precision It presents the number of units classified as faulty. It needs the numberof incorrectly classified and number of correctly classified modules to generate out-put.
Precision =TP
TP + TF
F Measure This is the combined term of Re-call and precision. It is used to mea-sure the classification performance of an algorithm [10].
F −Measure =2 ∗Recall ∗ PrecisionRecall + Precision
Table 4.2 represents the accuracy measure of the datasets using SVM
Algorithm AccuratelyClassifiedInstances(%)
InaccuratelyClassifiedInstances(%
TP Rate Precision F Mea-sure
Recall
SVM 78.52 23.68 0.763 0.820 0.213 0.173
Table 4.2: SVM Accuracy
4.2 Implementation of skin disease prediction
TensorflowGoogle developed tensorflow as a deep learning frame work. It contains suitable li-braries for image processing and it can control every node in a network. To achieve
40
the best performance, the neural networks existing weights can be adjusted as perrequirement.
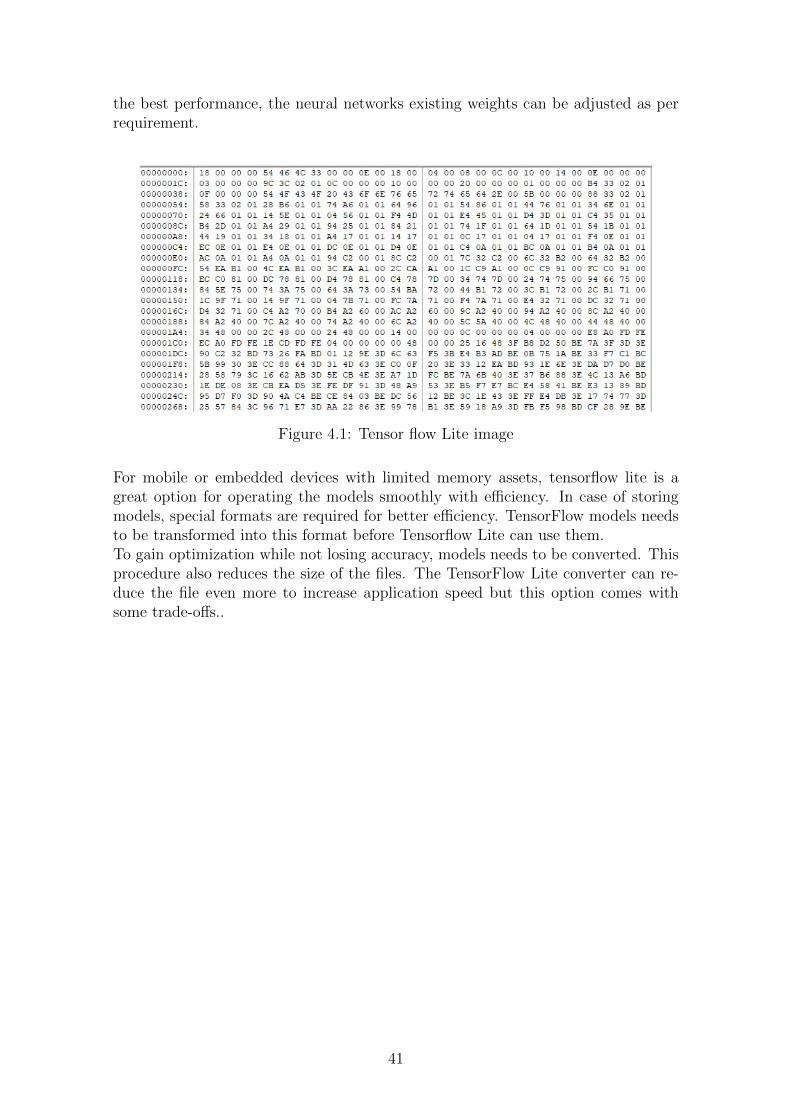
Figure 4.1: Tensor flow Lite image
For mobile or embedded devices with limited memory assets, tensorflow lite is agreat option for operating the models smoothly with efficiency. In case of storingmodels, special formats are required for better efficiency. TensorFlow models needsto be transformed into this format before Tensorflow Lite can use them.To gain optimization while not losing accuracy, models needs to be converted. Thisprocedure also reduces the size of the files. The TensorFlow Lite converter can re-duce the file even more to increase application speed but this option comes withsome trade-offs..
41
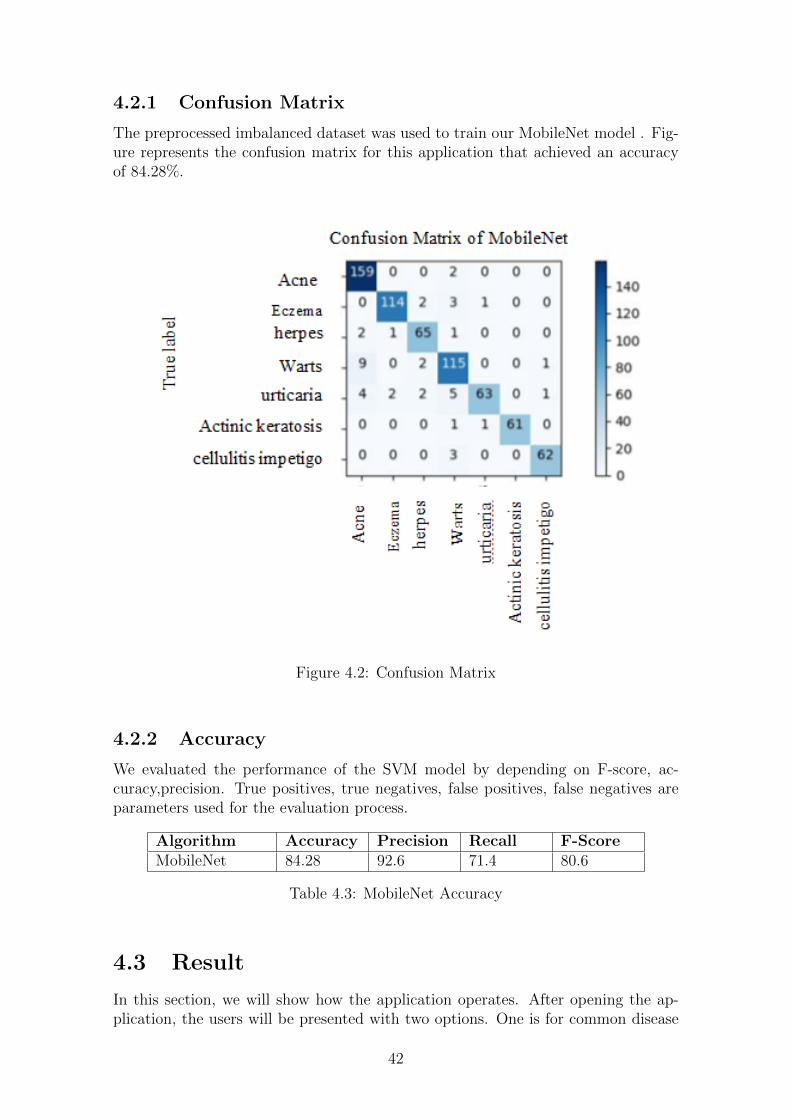
4.2.1 Confusion Matrix
The preprocessed imbalanced dataset was used to train our MobileNet model . Fig-ure represents the confusion matrix for this application that achieved an accuracyof 84.28%.
Figure 4.2: Confusion Matrix
4.2.2 Accuracy
We evaluated the performance of the SVM model by depending on F-score, ac-curacy,precision. True positives, true negatives, false positives, false negatives areparameters used for the evaluation process.
Algorithm Accuracy Precision Recall F-ScoreMobileNet 84.28 92.6 71.4 80.6
Table 4.3: MobileNet Accuracy
4.3 Result
In this section, we will show how the application operates. After opening the ap-plication, the users will be presented with two options. One is for common disease
42

prediction using symptom checking and the other one is for skin disease predictiononly.
43
4.3.1 Common Disease Prediction
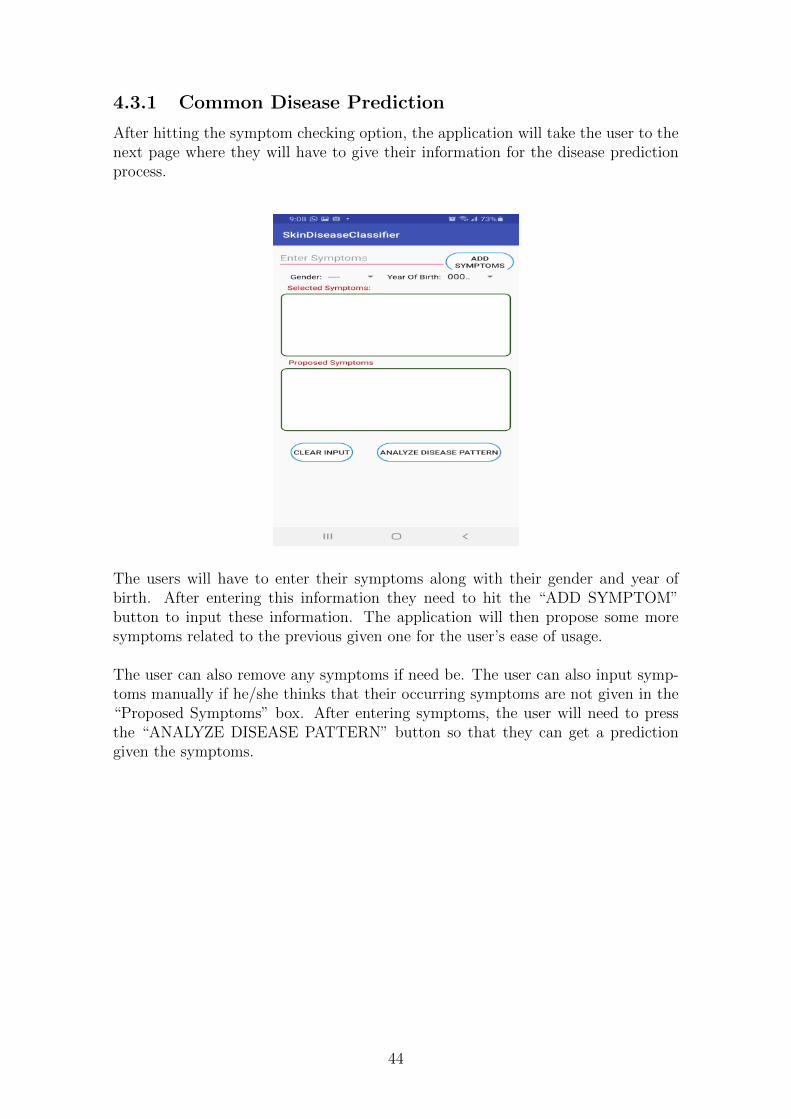
After hitting the symptom checking option, the application will take the user to thenext page where they will have to give their information for the disease predictionprocess.
The users will have to enter their symptoms along with their gender and year ofbirth. After entering this information they need to hit the “ADD SYMPTOM”button to input these information. The application will then propose some moresymptoms related to the previous given one for the user’s ease of usage.
The user can also remove any symptoms if need be. The user can also input symp-toms manually if he/she thinks that their occurring symptoms are not given in the“Proposed Symptoms” box. After entering symptoms, the user will need to pressthe “ANALYZE DISEASE PATTERN” button so that they can get a predictiongiven the symptoms.
44
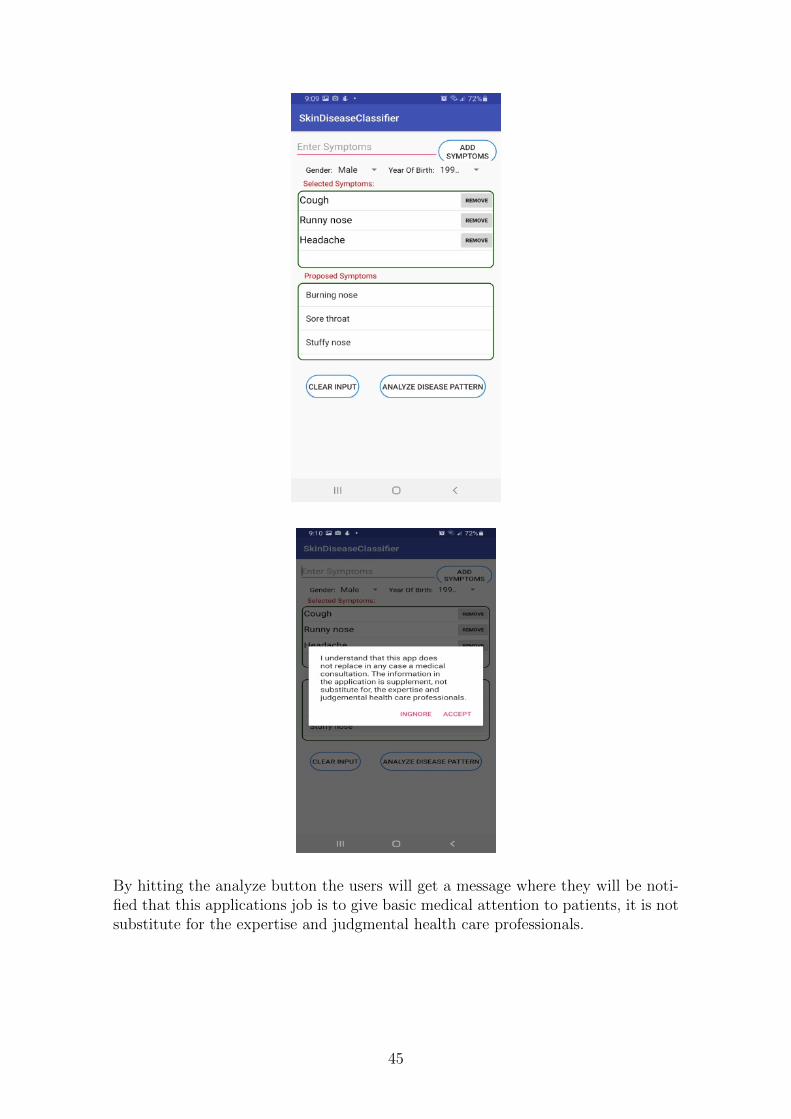
By hitting the analyze button the users will get a message where they will be noti-fied that this applications job is to give basic medical attention to patients, it is notsubstitute for the expertise and judgmental health care professionals.
45
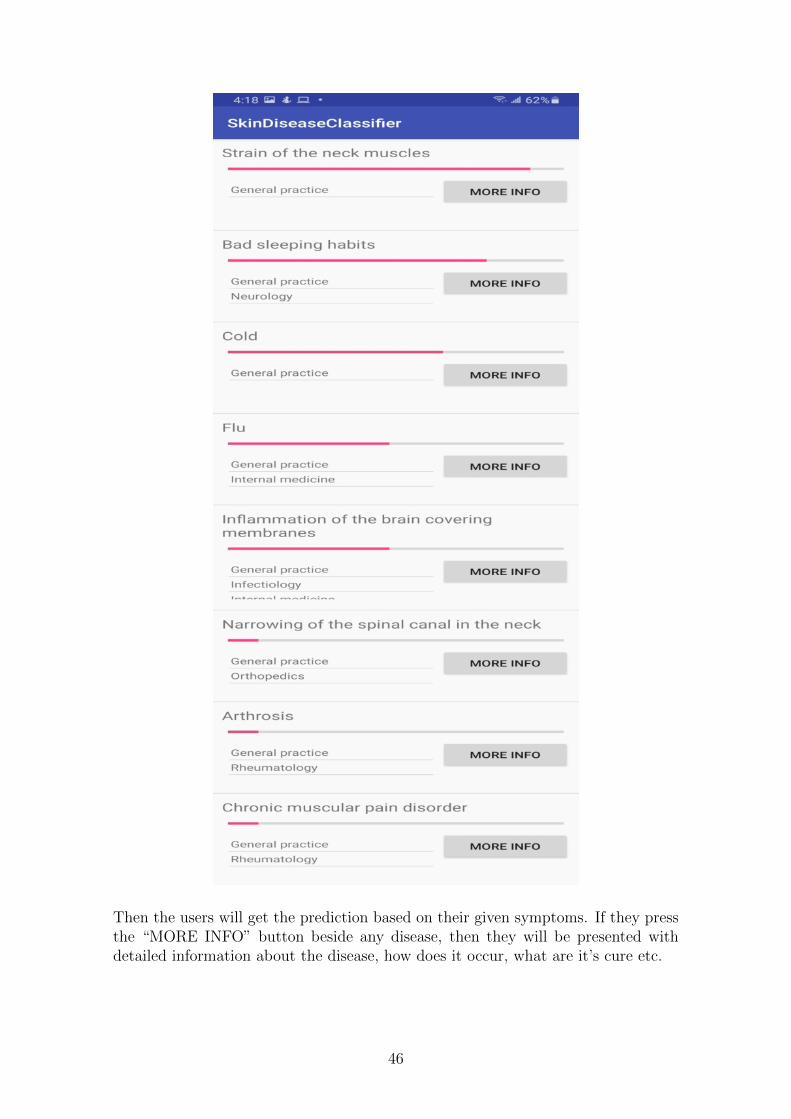
Then the users will get the prediction based on their given symptoms. If they pressthe “MORE INFO” button beside any disease, then they will be presented withdetailed information about the disease, how does it occur, what are it’s cure etc.
46
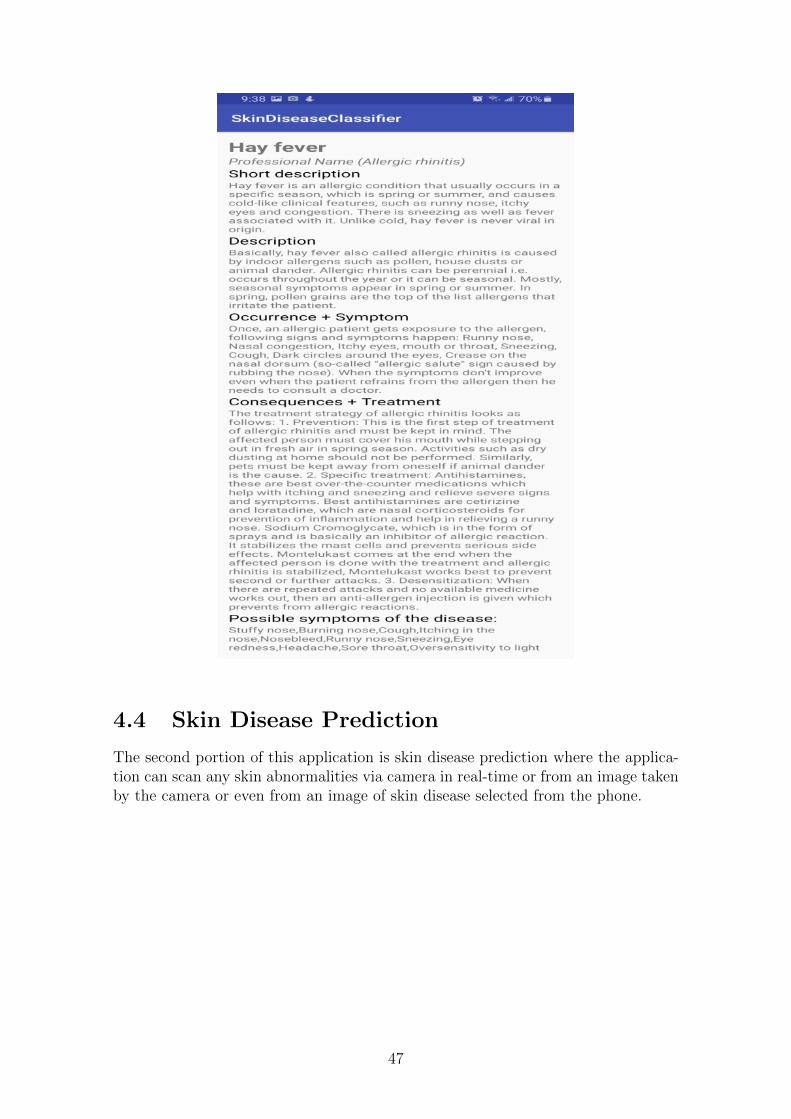
4.4 Skin Disease Prediction
The second portion of this application is skin disease prediction where the applica-tion can scan any skin abnormalities via camera in real-time or from an image takenby the camera or even from an image of skin disease selected from the phone.
47
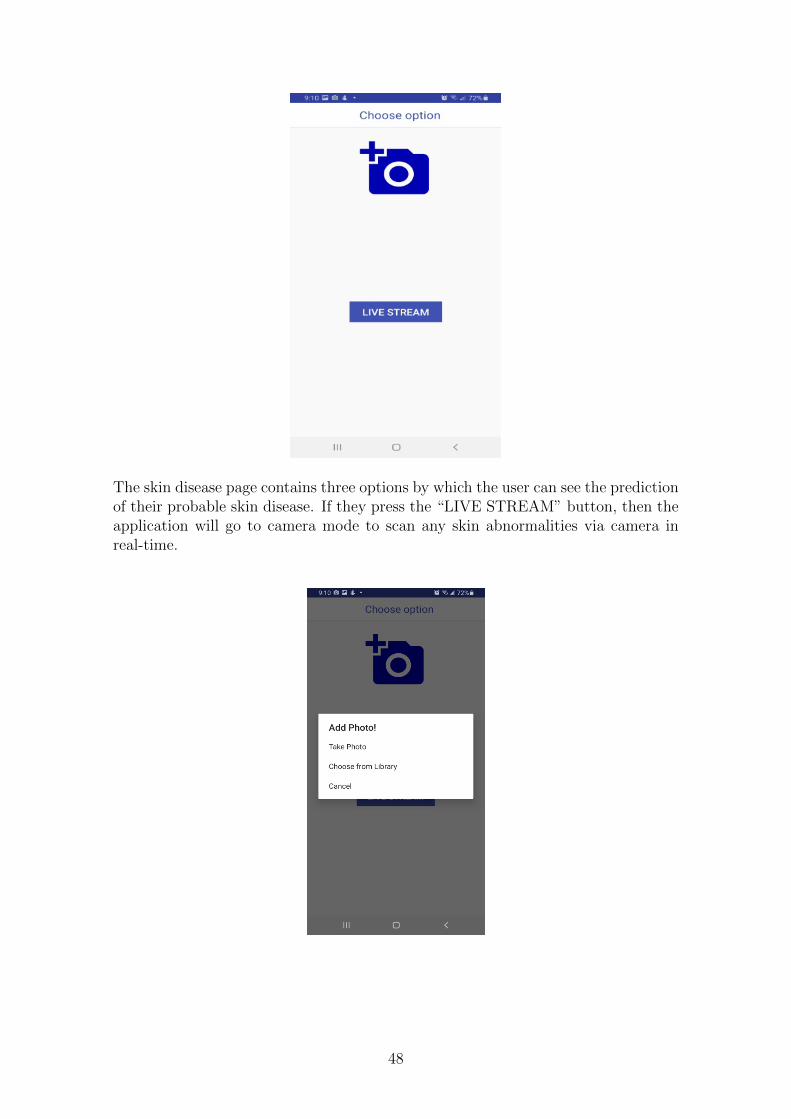
The skin disease page contains three options by which the user can see the predictionof their probable skin disease. If they press the “LIVE STREAM” button, then theapplication will go to camera mode to scan any skin abnormalities via camera inreal-time.
48
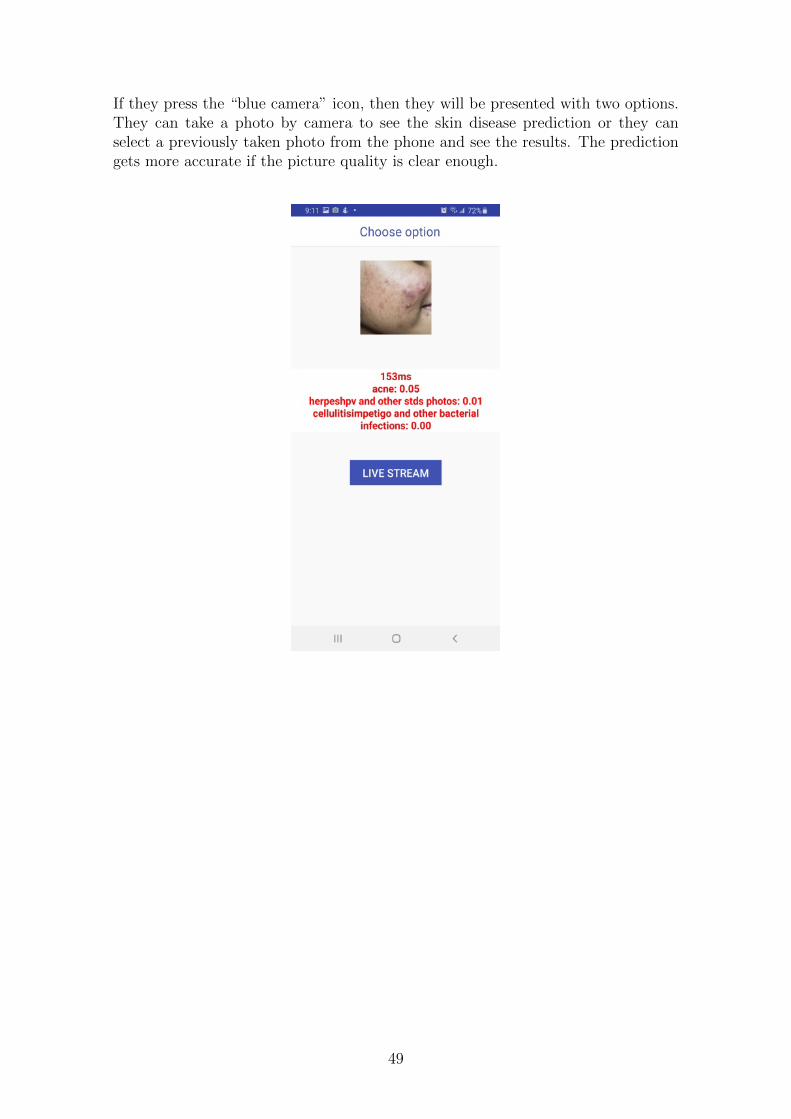
If they press the “blue camera” icon, then they will be presented with two options.They can take a photo by camera to see the skin disease prediction or they canselect a previously taken photo from the phone and see the results. The predictiongets more accurate if the picture quality is clear enough.
49
Chapter 5
Conclusion
5.1 Conclusion
The proposed android application that we constructed is reliable and secure mediumfor predicting patients’ diseases. It also has a user-friendly interface requiring min-imal learning and IT skills. One of the most satisfactory feedbacks of our system isit saves so much time and energy. It requires less manpower and is very useful forpatients who can’t afford medical treatment. Also users can get basic health tipsand medical attention anywhere anytime. Which makes it a really handy and usefulresource given the current covid-19 pandemic situation.
5.1.1 Limitations
• Users can’t search anything manually.
• The user cannot locate any doctor nearby.
• Requires internet connection to update the database.
• Some symptoms may not match with others in case of rare diseases.
5.1.2 Future Work
• We can add an FQ option to get user feedback.
• We can give more advanced features for the system including more facilitiesaccording to user demand.
• We will try to add an online drug-selling platform.
• We will implement a GPS tracking system for users so that they can find anydoctor nearby.
• We can develop a system to suggest doctors with their chamber locations andcontact information according to the patients selected disease after prediction.
• Will try to add some premium features to the registered members.
50
Bibliography
[1] D. L. Pham, C. Xu, and J. L. Prince, “Current methods in medical imagesegmentation,” Annual review of biomedical engineering, vol. 2, no. 1, pp. 315–337, 2000.
[2] R. Koggalage and S. Halgamuge, “Reducing the number of training samplesfor fast support vector machine classification,” Neural Information Processing-Letters and Reviews, vol. 2, no. 3, pp. 57–65, 2004.
[3] V. Jakkula, “Tutorial on support vector machine (svm),” School of EECS,Washington State University, vol. 37, 2006.
[4] S. B. Kotsiantis, D. Kanellopoulos, and P. E. Pintelas, “Data preprocessing forsupervised leaning,” International Journal of Computer Science, vol. 1, no. 2,pp. 111–117, 2006.
[5] L. Parthiban and R. Subramanian, “Intelligent heart disease prediction sys-tem using canfis and genetic algorithm,” International Journal of Biological,Biomedical and Medical Sciences, vol. 3, no. 3, 2008.
[6] S. Gong, “A collaborative filtering recommendation algorithm based on userclustering and item clustering.,” JSW, vol. 5, no. 7, pp. 745–752, 2010.
[7] S. Bhattacharyya, “A brief survey of color image preprocessing and segmen-tation techniques,” Journal of Pattern Recognition Research, vol. 1, no. 1,pp. 120–129, 2011.
[8] L. Lu, M. Medo, C. H. Yeung, Y.-C. Zhang, Z.-K. Zhang, and T. Zhou, “Rec-ommender systems,” Physics reports, vol. 519, no. 1, pp. 1–49, 2012.
[9] D. Glez-Pena, A. Lourenco, H. Lopez-Fernandez, M. Reboiro-Jato, and F.Fdez-Riverola, “Web scraping technologies in an api world,” Briefings in bioin-formatics, vol. 15, no. 5, pp. 788–797, 2014.
[10] S. Vijayarani, S. Dhayanand, et al., “Data mining classification algorithms forkidney disease prediction,” Int J Cybernetics Inform, vol. 4, no. 4, pp. 13–25,2015.
[11] M. Murty and R. Raghava, “Kernel-based svm,” in Support vector machinesand perceptrons, Springer, 2016, pp. 57–67.
[12] S. Suthaharan, “Support vector machine,” in Machine learning models andalgorithms for big data classification, Springer, 2016, pp. 207–235.
[13] E. Vasilevskis, I. Dubyak, T. Basyuk, V. Pasichnyk, and A. Rzheuskyi, “Mobileapplication for preliminary diagnosis of diseases.,” in IDDM, 2018, pp. 275–286.
51
[14] N. L. Fitriyani, M. Syafrudin, G. Alfian, and J. Rhee, “Development of dis-ease prediction model based on ensemble learning approach for diabetes andhypertension,” IEEE Access, vol. 7, pp. 144 777–144 789, 2019.
[15] J. Hamidzadeh and S. Moslemnejad, “Identification of uncertainty and deci-sion boundary for svm classification training using belief function,” AppliedIntelligence, vol. 49, no. 6, pp. 2030–2045, 2019.
[16] S. Mohan, C. Thirumalai, and G. Srivastava, “Effective heart disease predic-tion using hybrid machine learning techniques,” IEEE Access, vol. 7, pp. 81 542–81 554, 2019.
[17] D. Sinha and M. El-Sharkawy, “Thin mobilenet: An enhanced mobilenet ar-chitecture,” in 2019 IEEE 10th Annual Ubiquitous Computing, Electronics &Mobile Communication Conference (UEMCON), IEEE, 2019, pp. 0280–0285.
[18] S. Uddin, A. Khan, M. E. Hossain, and M. A. Moni, “Comparing differentsupervised machine learning algorithms for disease prediction,” BMC medicalinformatics and decision making, vol. 19, no. 1, pp. 1–16, 2019.
[19] J. Velasco, C. Pascion, J. W. Alberio, J. Apuang, J. S. Cruz, M. A. Gomez, B.Molina Jr, L. Tuala, A. Thio-ac, and R. Jorda Jr, “A smartphone-based skindisease classification using mobilenet cnn,” arXiv preprint arXiv:1911.07929,2019.
[20] A. K. Verma and S. Pal, “Prediction of skin disease with three different featureselection techniques using stacking ensemble method,” Applied biochemistryand biotechnology, pp. 1–20, 2019.
[21] A. K. Verma, S. Pal, and S. Kumar, “Comparison of skin disease predictionby feature selection using ensemble data mining techniques,” Informatics inMedicine Unlocked, vol. 16, p. 100 202, 2019.
[22] D. Wu, Y. Zhang, X. Jia, L. Tian, T. Li, L. Sui, D. Xie, and Y. Shan, “A high-performance cnn processor based on fpga for mobilenets,” in 2019 29th Inter-national Conference on Field Programmable Logic and Applications (FPL),IEEE, 2019, pp. 136–143.
[23] R. KUNCHHAL, The mathematics behind support vector machine algorithm(svm), https://www.analyticsvidhya.com/blog/2020/10/the-mathematics-behind-svm/, Oct. 2020.
[24] P. N. Srinivasu, J. G. SivaSai, M. F. Ijaz, A. K. Bhoi, W. Kim, and J. J.Kang, “Classification of skin disease using deep learning neural networks withmobilenet v2 and lstm,” Sensors, vol. 21, no. 8, p. 2852, 2021.
52