a delicate balance - issafrica.s3.amazonaws.com · is broken down by surface water, ground water,...
TRANSCRIPT
South Africa is currently overexploiting its renewable water resources. Moreover, withdrawals
are forecast to increase in all three sectors (agricultural, industrial and municipal). Meanwhile,
much of the country’s water infrastructure is in disrepair and dam levels are dangerously low.
This report presents a national-level forecast of water supply and withdrawals until 2035, before
exploring alternative scenarios. It is possible to restore stability to South Africa’s water system,
but it will take significant financial investment and political will.
SOUTHERN AFRICA REPORT 13 | MARCH 2018
A delicate balanceWater scarcity in South AfricaZachary Donnenfeld, Courtney Crookes and Steve Hedden
A DELICATE BALANCE: WATER SCARCITY IN SOUTH AFRICA2
Introduction
Although the 2014–2016 drought has catalysed a national conversation and, to some extent, brought water security into the policy debate in South Africa, the drought did not cause water scarcity. What the drought did was highlight existing vulnerabilities in South Africa’s water system, and properly frame the magnitude of the challenge of ensuring water security for the country.
South Africa is a water-scarce country. Yet there are extant, affordable technologies that government, business and private individuals could employ to help realign supply and demand while ensuring water security for future generations.
South Africa’s water picture has not appreciably stabilised since the African Futures Project (AFP) – a collaboration between the Institute for Security Studies (ISS) and the Frederick S Pardee Center (Pardee Center) for International Futures – published the first national-level supply and demand forecast for water in the country in 2014.1
Implement water conservation and demand reduction measures: South Africa must use water more efficiently. This can be achieved through a combination of infrastructure repairs, the implementation of new building codes, incentives to install water-efficient appliances and a tiered pricing structure. Policy measures should be supplemented with campaigns to raise awareness about water use and conservation.
Increase the amount of wastewater that is treated and reused: About 40% of South Africa’s wastewater is untreated. Improving wastewater treatment could increase the quantity and improve the quality of water in the country.
Increase groundwater extraction: The DWS estimates that South Africa could significantly expand the use of groundwater. This is particularly important for agriculture, where nearly two-thirds of South Africa’s water is allocated.
Additional technologies could play a role in the future, but they are likely not necessary now.
Recommendations
More than 60% of South Africa’s rivers are currently being overexploited and only one-third of the country’s main rivers are in good condition
At the same time, the International Futures (IFs) model – developed and housed at the Pardee Center at the Josef Korbel School for International Studies at the University of Denver – forecasts that demand will increase in all three sectors out to 2035 (agricultural, industrial and municipal). This increase in water demand is being driven by a combination of population growth, urbanisation, rising incomes, irrigation expansion, non-renewable electricity generation and a growing manufacturing sector.
Moreover, the Intergovernmental Panel on Climate Change anticipates a decline in average precipitation levels in the western part of the country, and that the entire south-western region of South Africa will be at increased risk of severe drought throughout this century.2 While the January and February rains of 2017 have offered a brief reprieve from the 2014–2016 drought, the fact is that South Africa is still overexploiting its renewable water resources and, without additional interventions, will continue to do so for the foreseeable future.
The 403 mm that the country received in 2015 was the lowest annual total on record since the South African Weather Service began collecting rainfall data in 1904. Moreover, the 2015 drought came on the back of three consecutive years of below-average rainfall, making it the most severe and prolonged drought since the 1940s.3 This caused South Africa’s average dam levels to plummet from around 93% in March 2014 to a low of 48% in November 2016.4 At the national level, dam levels recovered in early 2017, but have declined and are now considered ‘moderately low’ (they stood at about 59%
SOUTHERN AFRICA REPORT 13 | MARCH 2018 3
in February 2018). However, dam levels are only part of the story.
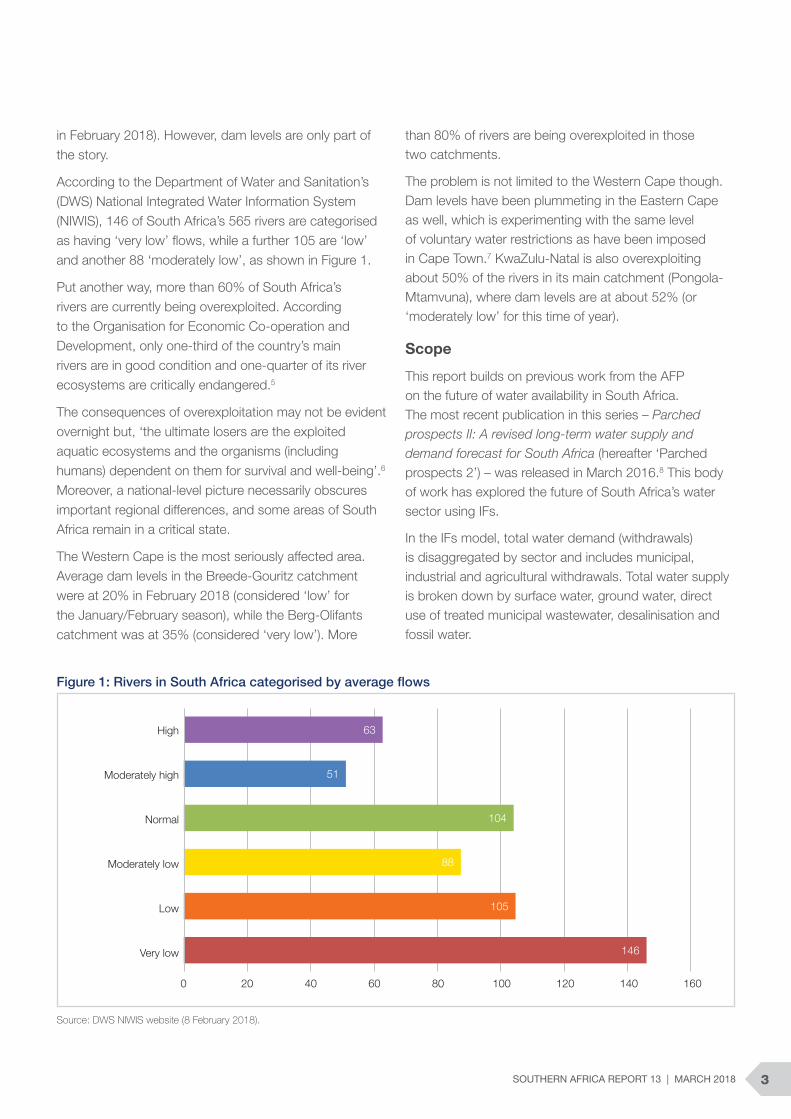
According to the Department of Water and Sanitation’s (DWS) National Integrated Water Information System (NIWIS), 146 of South Africa’s 565 rivers are categorised as having ‘very low’ flows, while a further 105 are ‘low’ and another 88 ‘moderately low’, as shown in Figure 1.
Put another way, more than 60% of South Africa’s rivers are currently being overexploited. According to the Organisation for Economic Co-operation and Development, only one-third of the country’s main rivers are in good condition and one-quarter of its river ecosystems are critically endangered.5
The consequences of overexploitation may not be evident overnight but, ‘the ultimate losers are the exploited aquatic ecosystems and the organisms (including humans) dependent on them for survival and well-being’.6 Moreover, a national-level picture necessarily obscures important regional differences, and some areas of South Africa remain in a critical state.
The Western Cape is the most seriously affected area. Average dam levels in the Breede-Gouritz catchment were at 20% in February 2018 (considered ‘low’ for the January/February season), while the Berg-Olifants catchment was at 35% (considered ‘very low’). More
than 80% of rivers are being overexploited in those two catchments.
The problem is not limited to the Western Cape though. Dam levels have been plummeting in the Eastern Cape as well, which is experimenting with the same level of voluntary water restrictions as have been imposed in Cape Town.7 KwaZulu-Natal is also overexploiting about 50% of the rivers in its main catchment (Pongola-Mtamvuna), where dam levels are at about 52% (or ‘moderately low’ for this time of year).
Scope
This report builds on previous work from the AFP on the future of water availability in South Africa. The most recent publication in this series – Parched prospects II: A revised long-term water supply and demand forecast for South Africa (hereafter ‘Parched prospects 2’) – was released in March 2016.8 This body of work has explored the future of South Africa’s water sector using IFs.
In the IFs model, total water demand (withdrawals) is disaggregated by sector and includes municipal, industrial and agricultural withdrawals. Total water supply is broken down by surface water, ground water, direct use of treated municipal wastewater, desalinisation and fossil water.
Source: DWS NIWIS website (8 February 2018).
Figure 1: Rivers in South Africa categorised by average flows
High
Moderately high
Normal
Moderately low
Low
Very low
0 20 40 60 80 100 120 140 160
63
51
104
88
105
146
4 A DELICATE BALANCE: WATER SCARCITY IN SOUTH AFRICA
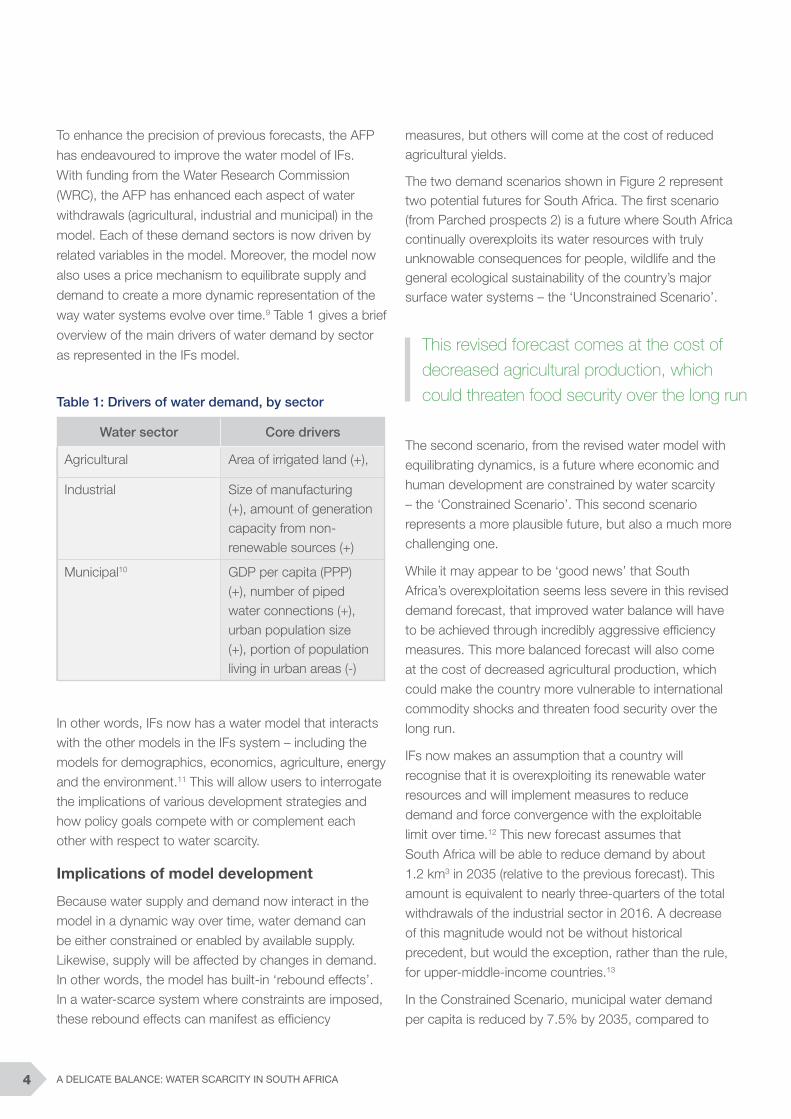
Water sector Core drivers
Agricultural Area of irrigated land (+),
Industrial Size of manufacturing (+), amount of generation capacity from non-renewable sources (+)
Municipal10 GDP per capita (PPP) (+), number of piped water connections (+), urban population size (+), portion of population living in urban areas (-)
To enhance the precision of previous forecasts, the AFP
has endeavoured to improve the water model of IFs.
With funding from the Water Research Commission
(WRC), the AFP has enhanced each aspect of water
withdrawals (agricultural, industrial and municipal) in the
model. Each of these demand sectors is now driven by
related variables in the model. Moreover, the model now
also uses a price mechanism to equilibrate supply and
demand to create a more dynamic representation of the
way water systems evolve over time.9 Table 1 gives a brief
overview of the main drivers of water demand by sector
as represented in the IFs model.
measures, but others will come at the cost of reduced agricultural yields.
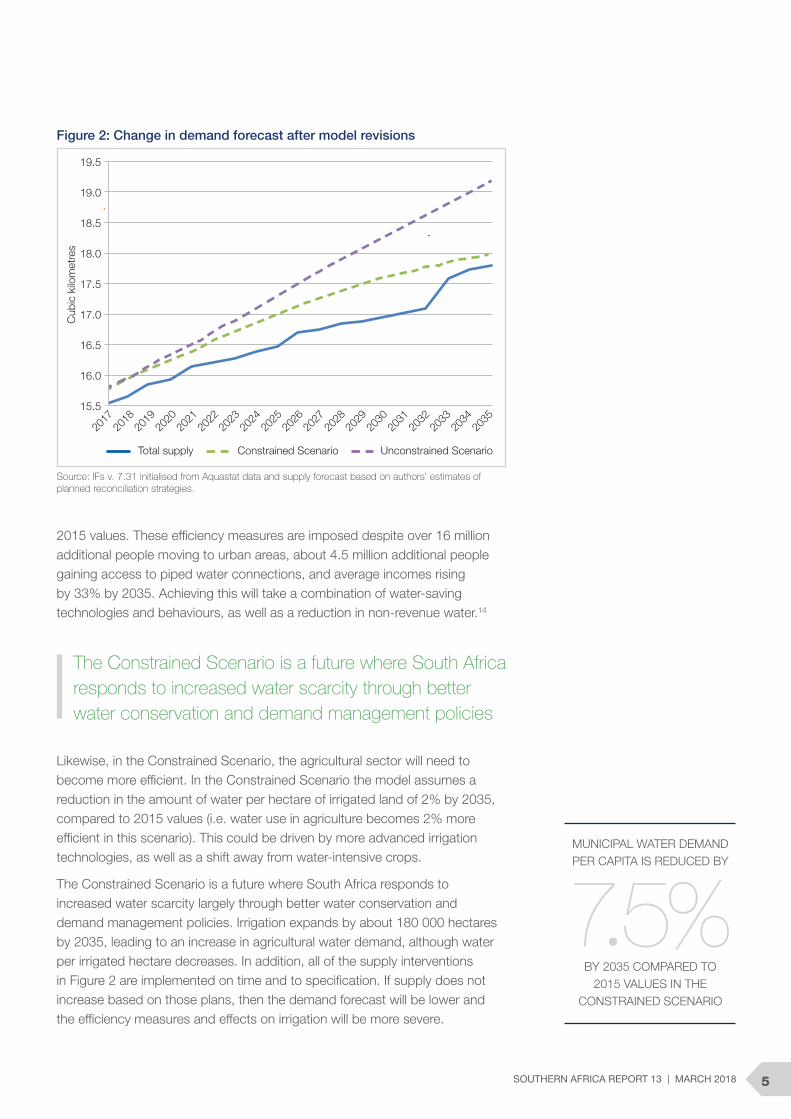
The two demand scenarios shown in Figure 2 represent two potential futures for South Africa. The first scenario (from Parched prospects 2) is a future where South Africa continually overexploits its water resources with truly unknowable consequences for people, wildlife and the general ecological sustainability of the country’s major surface water systems – the ‘Unconstrained Scenario’.
Table 1: Drivers of water demand, by sector
In other words, IFs now has a water model that interacts with the other models in the IFs system – including the models for demographics, economics, agriculture, energy and the environment.11 This will allow users to interrogate the implications of various development strategies and how policy goals compete with or complement each other with respect to water scarcity.
Implications of model development
Because water supply and demand now interact in the model in a dynamic way over time, water demand can be either constrained or enabled by available supply. Likewise, supply will be affected by changes in demand. In other words, the model has built-in ‘rebound effects’. In a water-scarce system where constraints are imposed, these rebound effects can manifest as efficiency
This revised forecast comes at the cost of decreased agricultural production, which could threaten food security over the long run
The second scenario, from the revised water model with
equilibrating dynamics, is a future where economic and
human development are constrained by water scarcity
– the ‘Constrained Scenario’. This second scenario
represents a more plausible future, but also a much more
challenging one.
While it may appear to be ‘good news’ that South
Africa’s overexploitation seems less severe in this revised
demand forecast, that improved water balance will have
to be achieved through incredibly aggressive efficiency
measures. This more balanced forecast will also come
at the cost of decreased agricultural production, which
could make the country more vulnerable to international
commodity shocks and threaten food security over the
long run.
IFs now makes an assumption that a country will
recognise that it is overexploiting its renewable water
resources and will implement measures to reduce
demand and force convergence with the exploitable
limit over time.12 This new forecast assumes that
South Africa will be able to reduce demand by about
1.2 km3 in 2035 (relative to the previous forecast). This
amount is equivalent to nearly three-quarters of the total
withdrawals of the industrial sector in 2016. A decrease
of this magnitude would not be without historical
precedent, but would the exception, rather than the rule,
for upper-middle-income countries.13
In the Constrained Scenario, municipal water demand
per capita is reduced by 7.5% by 2035, compared to
SOUTHERN AFRICA REPORT 13 | MARCH 2018 5
MUNICIPAL WATER DEMAND PER CAPITA IS REDUCED BY
BY 2035 COMPARED TO 2015 VALUES IN THE
CONSTRAINED SCENARIO
2015 values. These efficiency measures are imposed despite over 16 million additional people moving to urban areas, about 4.5 million additional people gaining access to piped water connections, and average incomes rising by 33% by 2035. Achieving this will take a combination of water-saving technologies and behaviours, as well as a reduction in non-revenue water.14
Source: IFs v. 7.31 initialised from Aquastat data and supply forecast based on authors’ estimates of planned reconciliation strategies.
Figure 2: Change in demand forecast after model revisions
The Constrained Scenario is a future where South Africa responds to increased water scarcity through better water conservation and demand management policies
Likewise, in the Constrained Scenario, the agricultural sector will need to become more efficient. In the Constrained Scenario the model assumes a reduction in the amount of water per hectare of irrigated land of 2% by 2035, compared to 2015 values (i.e. water use in agriculture becomes 2% more efficient in this scenario). This could be driven by more advanced irrigation technologies, as well as a shift away from water-intensive crops.
The Constrained Scenario is a future where South Africa responds to increased water scarcity largely through better water conservation and demand management policies. Irrigation expands by about 180 000 hectares by 2035, leading to an increase in agricultural water demand, although water per irrigated hectare decreases. In addition, all of the supply interventions in Figure 2 are implemented on time and to specification. If supply does not increase based on those plans, then the demand forecast will be lower and the efficiency measures and effects on irrigation will be more severe.
19.5
19.0
18.5
18.0
17.5
17.0
16.5
16.0
15.5
2017
2018
2019
2020
2021
2022
2023
2024
2025
2026
2027
2028
2029
2030
2031
2032
2033
2034
2035
Total supply Constrained Scenario Unconstrained Scenario
Cub
ic k
ilom
etre
s
7.5%
6 A DELICATE BALANCE: WATER SCARCITY IN SOUTH AFRICA
Alternatively, the government could choose to pursue an expansion of irrigation, but that would require either further supply increases or more efficiency increases. That scenario (Agricultural Trade-offs) is explored in detail in the sections below.
So, even with a dynamic model where withdrawals are constrained based on available supply, South Africa is forecast to continue to overexploit its water resources throughout the duration of the forecast. This can have devastating effects for water ecosystems and could ultimately impact the quality of water throughout the country.15
Consequences of overexploitation
When water is extracted from river systems at unsustainable levels, it reduces the overall amount of water flowing downstream, which affects the ability of the river ecosystem to properly absorb the by-products associated with human life (e.g. industrial discharge or fertilizer run-off). When effluent discharges occur downstream of the point where water is extracted for human consumption, and there is an insufficient volume of water in the river to dilute the chemicals and microbials present in the (raw and treated) effluent discharge, the ecosystem can begin to deteriorate.16 This imbalance between effluent discharge and river flows can manifest as water temperature increases, higher concentrations of chemicals and microbials, or changes in dissolved oxygen and pH levels.17
When water resources are overexploited for a prolonged period of time, this interaction between human activity and deteriorating water quality is amplified. Other things being equal, adding more people to a community that is overexploiting its renewable resources will not only exacerbate the impact on water levels (i.e. cause the level of overexploitation to increase) but those additional people will also engage in other activities that add more effluent to the hydrological system.18 In other words, there are more pollutants being added to less water, making it increasingly difficult for the water system to efficiently dilute those particulates and regenerate itself.
When the ability of a river to effectively absorb potentially harmful particulates is diminished, there are substantial consequences for human development including an increased risk of contracting a waterborne disease.19
Contaminated water is a significant driver of diarrheal disease, which alone is responsible for roughly 1 600 dead children per day, according to UNICEF.20
Even when children survive a bout of diarrheal disease, they may suffer from undernutrition or stunting. Stunting has negative consequences for both physical and cognitive development, and can hinder people’s ability to progress through school and inhibit the productivity of the workforce over the long term.21 Poor water quality may also result in an increase in vector-borne diseases from mosquitoes, tsetse flies and ticks, particularly when the water is so polluted that it is not disturbed by humans and where the eggs of insects can survive for extended periods in a dormant state.22
Also important to the South African context is that overexploitation in one area can have negative impacts in downstream communities that are not overexploiting their local resources.
In the past year, the City of Cape Town in the Western Cape province has twice had to invent new levels of water restrictions
As shown earlier, certain areas of the country are suffering from far more severe water stress than others, and if any province or municipality were to completely run out of water, it would quickly become a national emergency. Many parts of the country remain drought disaster zones, with the hardest-hit areas being the Karoo and the western coast.23 In the past year, the City of Cape Town in the Western Cape province has twice had to invent new levels of water restrictions. These now stand at level 6b, and residents are limited to 50 litres of water per day.
Moreover, there has been a fairly consistent decline in dam levels around the Cape Town metro area. The province is gravely concerned about the loss of its water supply, with a near panic erupting around a possible ‘Day 0’, when the province could potentially run out of water completely.24 This would indeed be a crisis, but even tightly constrained water supplies could result in unmet basic needs, continued deterioration of water quality and negative environmental consequences.25 Also, if some residents from Cape Town were to leave, that would place enormous stress on already overexploited water systems in other parts of the country.
SOUTHERN AFRICA REPORT 13 | MARCH 2018 7
LITRES PER CAPITA PER DAY. THE GLOBAL AVERAGE IS
LITRES PER CAPITA PER DAY
SOUTH AFRICA’S WATER CONSUMPTION IS ABOUT
235175
Finally, water systems that are overexploited for a substantial period of time become more vulnerable to the impact of external shocks such as droughts, floods and other extreme weather events. Although droughts in South Africa are inevitable – and likely to become more prominent and severe in the south-west of the country in the future – the gravity of their impact can be mitigated by efficient management of the water system.26
Current withdrawals and supply
To forecast water withdrawals, IFs relies on data from the United Nations Food and Agriculture Organization’s (FAO) Aquastat database, which has data for South Africa from 2013 on withdrawals in all three sectors. IFs uses Aquastat data to ensure that data are standardised across countries, and also because Aquastat withdrawal categories are mutually exclusive, so withdrawals are neither double-counted nor underrepresented. Agricultural withdrawals are defined by the FAO as including ‘self-supplied water for irrigation, livestock and aquaculture purposes’, while municipal withdrawals consist of the total water withdrawn from the public distribution network.27 Industrial withdrawals are defined as self-supplied consumers that are not connected to the public distribution network.28
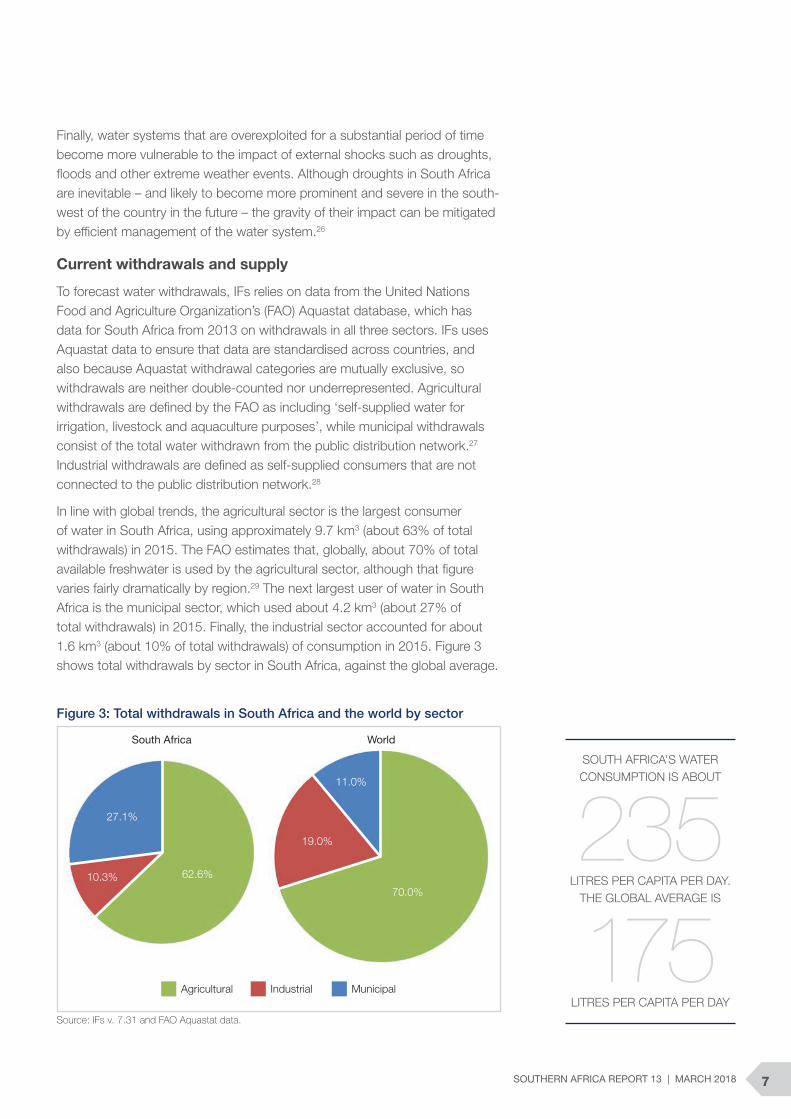
In line with global trends, the agricultural sector is the largest consumer of water in South Africa, using approximately 9.7 km3 (about 63% of total withdrawals) in 2015. The FAO estimates that, globally, about 70% of total available freshwater is used by the agricultural sector, although that figure varies fairly dramatically by region.29 The next largest user of water in South Africa is the municipal sector, which used about 4.2 km3 (about 27% of total withdrawals) in 2015. Finally, the industrial sector accounted for about 1.6 km3 (about 10% of total withdrawals) of consumption in 2015. Figure 3 shows total withdrawals by sector in South Africa, against the global average.
Source: IFs v. 7.31 and FAO Aquastat data.
Figure 3: Total withdrawals in South Africa and the world by sector
Agricultural Industrial Municipal
South Africa World
27.1%
62.6%10.3%
11.0%
19.0%
70.0%
A DELICATE BALANCE: WATER SCARCITY IN SOUTH AFRICA8
A 2012 WRC study found that, at about 235 litres per capita per day (l/c/d), per capita water consumption in South Africa is above the global average of approximately 175 l/c/d.30 One driver of high consumption is the high level of non-revenue water in South Africa.
Non-revenue water refers to the ‘difference between the amount of water put into the distribution system and the amount of water billed to consumers’.31 Non-revenue water can generally be categorised as falling into one of three categories: real or physical losses that occur because of leakage owing to poor operation and maintenance; commercial losses caused by meter manipulation or other forms of water theft; and unbilled authorised consumption, which includes water used by the utility for emergency purposes such as firefighting.
Although the level of non-revenue water in South Africa is on par with the global average, it is significantly higher than in other water-stressed countries
According to the latest (2012) DWS data, approximately 36% (or nearly 1.5 km3)
of municipal water consumption in South Africa was non-revenue.32 Of that
1.5 km3, approximately 70% was from real or physical losses and another 17%
from commercial losses.
Although the level of non-revenue water in South Africa is on par with the
global average, it is significantly higher than in other water-stressed countries.
For example, Australia has limited its non-revenue water to roughly 10%.33 If
South Africa were to accomplish a similar feat, it could reduce total withdrawals
in the country by 1.1 km3 – or approximately 75% of total estimated industrial
withdrawals in 2017.
Forecast of withdrawals and supply
While agriculture is forecast to remain the sector responsible for most of South
Africa’s total water withdrawals, the most significant increase is expected in the
municipal sector. By 2035 the municipal sector will account for roughly 32% of
total withdrawals, against 28% in 2017, whereas the agricultural and industrial
sectors will account for about 58% and 10% respectively. The increase in
municipal consumption is driven by South Africa’s growing and rapidly urbanising
population, rising incomes in the country and an increase in the percentage of
the population with access to piped water. Figure 4 shows a snapshot of the
evolution of water withdrawals by sector in 2017 and 2035 respectively.
Although the municipal sector is expected to account for the majority of
additional withdrawals, water demand is forecast to increase in all three sectors.
In absolute terms, municipal water demand is forecast to increase by 1.3 km3,
industrial demand by 0.2 km3, and agricultural demand by about 0.5 km3 from
2017 levels by 2035 in the Current Path forecast.
(OR NEARLY 1.5 KM3) OF MUNICIPAL WATER
CONSUMPTION IN SOUTH AFRICA WAS NON-REVENUE
About
36%
SOUTHERN AFRICA REPORT 13 | MARCH 2018 9
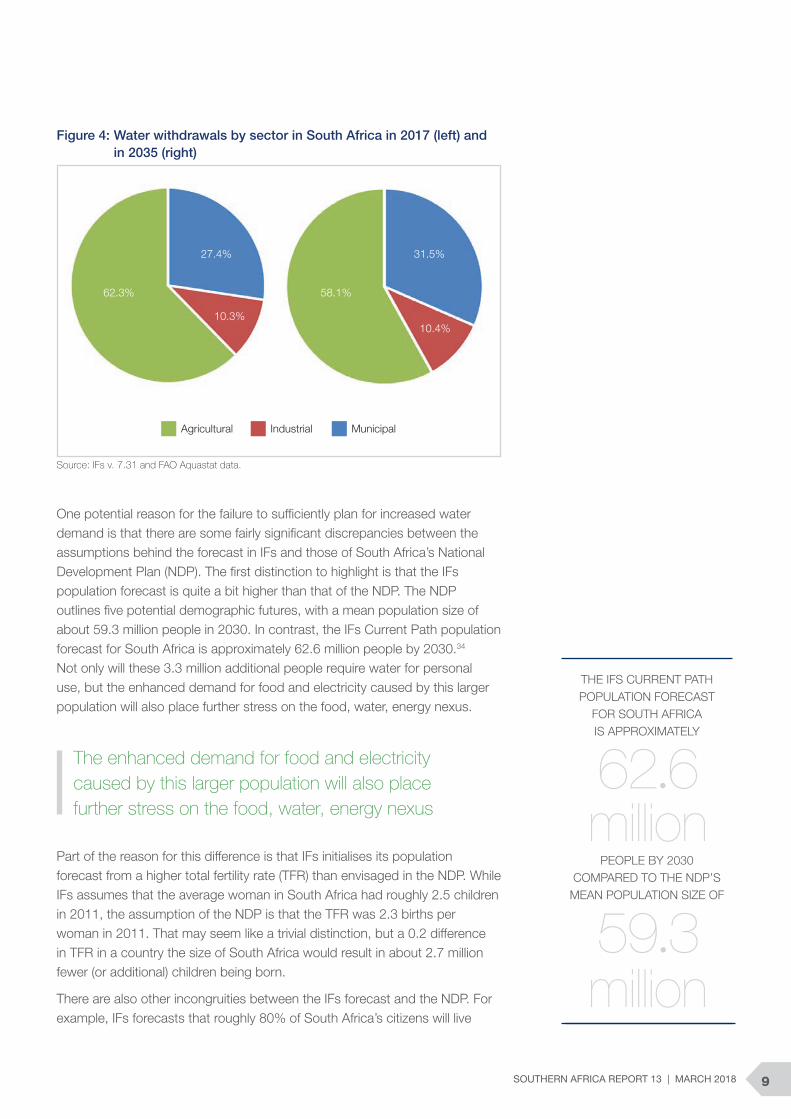
One potential reason for the failure to sufficiently plan for increased water demand is that there are some fairly significant discrepancies between the assumptions behind the forecast in IFs and those of South Africa’s National Development Plan (NDP). The first distinction to highlight is that the IFs population forecast is quite a bit higher than that of the NDP. The NDP outlines five potential demographic futures, with a mean population size of about 59.3 million people in 2030. In contrast, the IFs Current Path population forecast for South Africa is approximately 62.6 million people by 2030.34 Not only will these 3.3 million additional people require water for personal use, but the enhanced demand for food and electricity caused by this larger population will also place further stress on the food, water, energy nexus.
Source: IFs v. 7.31 and FAO Aquastat data.
Figure 4: Water withdrawals by sector in South Africa in 2017 (left) and in 2035 (right)
The enhanced demand for food and electricity caused by this larger population will also place further stress on the food, water, energy nexus
Part of the reason for this difference is that IFs initialises its population forecast from a higher total fertility rate (TFR) than envisaged in the NDP. While IFs assumes that the average woman in South Africa had roughly 2.5 children in 2011, the assumption of the NDP is that the TFR was 2.3 births per woman in 2011. That may seem like a trivial distinction, but a 0.2 difference in TFR in a country the size of South Africa would result in about 2.7 million fewer (or additional) children being born.
There are also other incongruities between the IFs forecast and the NDP. For example, IFs forecasts that roughly 80% of South Africa’s citizens will live
Agricultural Industrial Municipal
27.4%
62.3%
31.5%
58.1%
10.4%10.3%
THE IFS CURRENT PATH POPULATION FORECAST
FOR SOUTH AFRICA IS APPROXIMATELY
PEOPLE BY 2030 COMPARED TO THE NDP’S
MEAN POPULATION SIZE OF
62.6
59.3
million
million
A DELICATE BALANCE: WATER SCARCITY IN SOUTH AFRICA10
in urban spaces by 2035, while the NDP expects that figure to be more like 70%.35 A difference of 10 percentage points would be about 6 million additional people living in cities – based on the IFs population forecast. IFs also forecasts that South Africa will add an additional 4.5 million new piped water connections between 2017 and 2035.
Finally, the Current Path forecast assumes that South Africa will remain heavily dependent on coal. Thermoelectric power generation is a large driver of industrial water demand (mostly for cooling) and the Current Path forecast is that coal will remain the dominant fuel source for South Africa until 2035. IFs forecasts that thermoelectric power generation will become more water efficient, however, owing to the implementation of dry-cooling technologies by 2035.
A separate issue with coal in South Africa is that many power stations are situated in catchment areas that are under water stress.36 This makes them vulnerable to overexploitation, as well as highly sensitive to any potential contamination resulting from industrial activity.37 A recent report found that the Mokolo Dam Crocodile River Water Augmentation Project – which is intended to supply water to the Medupi power station – will divert more than 80% of its water for power generation and mining and could ‘pose significant risks to the population’s right to food, water and health’.38 Moving the country away from a coal-based energy profile and increasing the share of renewables will reduce industrial water demand and free up water for use in other sectors.
Moving the country away from coal-based energy and increasing the share of renewables will reduce industrial water demand and free up water for use in other sectors
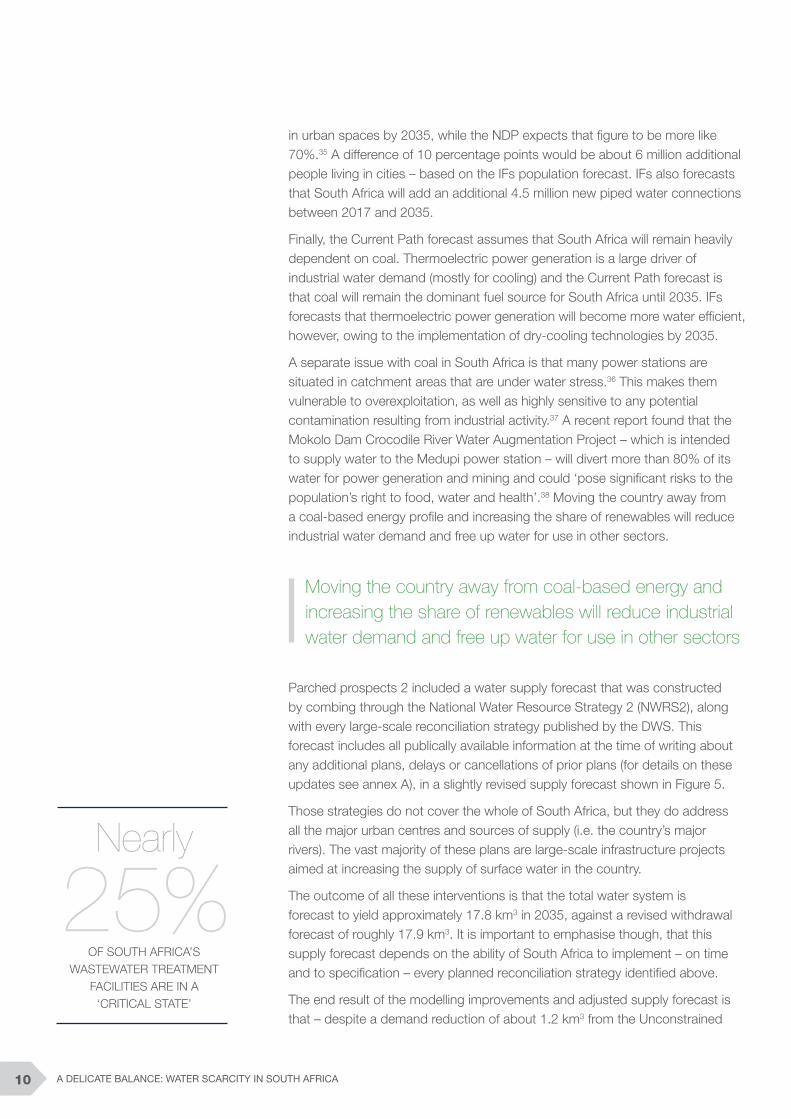
Parched prospects 2 included a water supply forecast that was constructed by combing through the National Water Resource Strategy 2 (NWRS2), along with every large-scale reconciliation strategy published by the DWS. This forecast includes all publically available information at the time of writing about any additional plans, delays or cancellations of prior plans (for details on these updates see annex A), in a slightly revised supply forecast shown in Figure 5.
Those strategies do not cover the whole of South Africa, but they do address all the major urban centres and sources of supply (i.e. the country’s major rivers). The vast majority of these plans are large-scale infrastructure projects aimed at increasing the supply of surface water in the country.
The outcome of all these interventions is that the total water system is forecast to yield approximately 17.8 km3 in 2035, against a revised withdrawal forecast of roughly 17.9 km3. It is important to emphasise though, that this supply forecast depends on the ability of South Africa to implement – on time and to specification – every planned reconciliation strategy identified above.
The end result of the modelling improvements and adjusted supply forecast is that – despite a demand reduction of about 1.2 km3 from the Unconstrained
OF SOUTH AFRICA’S WASTEWATER TREATMENT
FACILITIES ARE IN A ‘CRITICAL STATE’
Nearly
25%
SOUTHERN AFRICA REPORT 13 | MARCH 2018 11
Scenario – South Africa continues to see a period of prolonged overexploitation before supply and demand begin to reconcile.
Potential solutions to South Africa’s water challenges
Although South Africa’s water challenges seem daunting, there are available, affordable solutions to some of the most pressing problems posed by water scarcity in the country today. So far, the overwhelming majority of proposed solutions in South Africa have focused on increasing the overall level of surface water, mainly through large infrastructure projects such as the construction of new dams.
However, as previous research from the AFP has indicated, even those strategies, if implemented on time and to scale, are insufficient to meet South Africa’s growing water needs in the absence of demand constraints.
In other words, without a combination of existing plans, additional strategies to access previously underused sources of water and some measure of demand
management, the water sector will begin to constrain the
country’s ability to meet other development objectives.
Wastewater treatment
According to the latest Aquastat data (from 2009), South
Africa only treats about 54% of its municipal wastewater.40
Furthermore, its existing wastewater treatment
infrastructure requires substantial investment. The 2014
Green Drop Report concluded that nearly a quarter of
South Africa’s wastewater treatment facilities are in a
‘critical state’, defined as needing urgent intervention,
while roughly another quarter are defined as ‘high risk’.41
Although seven of the 10 reconciliation strategies
analysed for this report set targets for increasing the
use of treated wastewater, those interventions amount
to roughly 0.22 km3, or less than one-quarter of the
projected gap between supply and demand in the
Unconstrained Scenario in 2035. While the proposed
interventions are a step in the right direction, there is
surely a larger role for treated wastewater in South
Africa than currently envisioned in the major
reconciliation strategies.
Source: All large-scale reconciliation strategies.39
Figure 5: Planned increases in yield extracted from all published large-scale reconciliation strategies
Cub
ic k
ilom
etre
s
2035
2034
2033
2032
2031
2030
2029
2028
2027
2026
2025
2024
2023
2022
2021
2020
2019
2018
2017
2016
2015
2014
2013
2012
2011
2010
2009
2008
2007
2006
18.5
18.0
17.5
17.0
16.5
16.0
15.5
15.0
14.5
Algoa
Amatole
KZN coastal metropolitanLuvuvhu and LetabaManguang
Mbombela
Oliphants
Orange
Richards Bay
Vaal
Western Cape
Existing yield
A DELICATE BALANCE: WATER SCARCITY IN SOUTH AFRICA12
Between May and June 2017, the non-governmental organisation AfriForum tested the water sewage systems in 88 towns and found that two-thirds (59) did not meet national quality standards.46 This is an increase of more than 100% relative to 2016 (when 26 plants did not meet minimum standards) and, according to AfriForum, could ‘pose a threat to human health, food security and the environment’.47
This increase in the number of insufficiently operated or maintained water sewage treatment plants points to some available strategies for municipal water authorities to improve water quality and potentially increase supply. Moreover, the poor quality of water treatment plants is just one indication of the country’s deteriorating water infrastructure, in addition to the issue of non-revenue water discussed earlier.
Non-revenue water
While the amount of non-revenue water is roughly on par with the global average, South Africa is considered a ‘high’ water-stress country by the World Resources Institute, and cannot afford to let its water infrastructure fall into further disrepair.48 The South African government has committed to a ‘War on Leaks’ campaign that aims to reduce the level of non-revenue water in South Africa by employing 15 000 South Africans as plumbers and artisans by the end of 2018. Although the campaign is being implemented unevenly throughout the country, most of the focus seems to be on KwaZulu-Natal and the Eastern Cape.49
There is a misconception that water restrictions are draconian measures reserved for near-emergency situations such as those in the Western Cape or in California in 2014–2015. However, examples from other communities demonstrate that conservation need not compromise quality of life. Tucson, Arizona is a city with a population of about 500 000 that receives about 30 cm of rainfall a year. The municipality began to run out of groundwater in the 1970s and adopted a multifaceted policy response that has enabled the city to reduce per capita consumption by roughly one-third (from just over 700 litres a day in 1989 to less than 500 litres a day in 2015).42 This multipronged approach involved instituting tiered water pricing (higher rates for larger consumers), implementing new building codes (reducing irrigation for landscaping and mandating efficient utilities in commercial spaces), encouraging the collection of rainwater and offering a slew of incentives for private individuals to invest
in water-efficient appliances.43 The result is that total consumption in the city is roughly the same as it was in the late 1980s, despite its population growing by about 25% over the same time period.44
Israel is an oft-cited example of a country that has used supply-side measures (i.e. desalination technology) to reconcile its national water sector. However, water conservation has been a critical part of Israel’s water strategy as well. The Israel Water Authority has said that ‘water conservation and efficient usage of it is the cheapest most available source of water’, adding that ‘savings campaigns carried out in the past have shown, without doubt, that 10–20% of [the] total consumed in the municipal sector may be saved, while making sure not to affect the consumer’s welfare’.45 This last part is perhaps the most important. It is possible to decrease water consumption on a large scale, without significant sacrifices in the day-to-day lives of South Africans.
THE GOVERNMENT’S ‘WAR ON LEAKS’ CAMPAIGN AIMS TO REDUCE THE LEVEL
OF NON-REVENUE WATER BY EMPLOYING
AS PLUMBERS AND ARTISANS BY THE END
OF 2018
South Africans15 000
Box 1: Water conservation
SOUTHERN AFRICA REPORT 13 | MARCH 2018 13
Groundwater
Parched prospects 2 pointed out that groundwater was likely an underutilised resource in South Africa. Since then, the DWS has published estimates of how much groundwater could potentially be available in the country, and suggests that utilising groundwater more intensively, particularly in the agricultural sector, could be a fruitful source of additional water.50 The DWS estimates that close to 85% of the country’s groundwater aquifers are under-allocated, and that there could be as much as 4.8 km3 worth of exploitable groundwater in South Africa.51
Nobody can say with any certainty if that groundwater estimate is accurate or not, because the kind of in-depth, scientific study necessary to establish a reliable figure has yet to be completed. Further, groundwater is a delicate resource and needs to be managed cautiously. Nonetheless, the DWS estimate does suggest that a modest increase in groundwater use, provided that it was done in a sustainable way, could act as one prong of a strategy to improve water security in South Africa.
Water Conservation and Water Demand Management (WCWDM)
South Africa must price water more deliberately. In fact, WCWDM strategies may be the most important element of its effort to ensure stability in its water sector. However, the legacy of apartheid and the extreme levels of structural inequality require a delicate and nuanced approach to water pricing.
Tiered water pricing is a well-established system of water conservation that has proven its effectiveness in other parts of the globe. Tiered pricing works by charging customers based on how much water they use. Customers who use more than the level deemed necessary for human consumption pay a higher rate for that additional water.
Nelson Mandela Bay has already begun to implement tiered pricing. In that municipality, customers pay R14.57 for the first 1 000 litres per day, R29.46 (per 1 000 litres) for the next 3 000 litres and R58.92 (per 1 000 litres) for anything up to 8 000 litres per day.52 Customers using more than 8 000 litres per day pay R196.41 per 1 000 litres. Research from Stanford University suggests that ‘increasing block price schedules provide strong incentives for consumers to conserve water’.53
Santa Fe, New Mexico began implementing tiered, or block, pricing more than a decade ago and has seen per capita water use drop by almost 30%.54 Total municipal water withdrawals have decreased by about 20%, despite the city’s population growing by more than 10%. The advantage of tiered pricing is that it ‘offers a balance between fairness and efficiency’, according to a 2014 study from the University of California, Riverside.55 The study found that introducing tiered pricing in residential communities reduced demand by at least 18% in just over three years.56
Tiered pricing is beneficial because it does not rely on government regulation or forbid anyone from using additional water. The idea is that water meant for basic human consumption is as affordable as possible, while water used to maintain a swimming pool or extravagant landscaping is relatively expensive. As Santa Fe’s director of public utilities commented, ‘for some people a lawn is important, and if they want to spend their money on irrigation, they can’.57
Israel is another example of a country that has used tiered pricing to reflect scarcity.58 That country also treats more than 80% of its wastewater and has employed a dynamic approach to water security that has allowed the country to move from continually overexploiting its renewable resources during the 1980–1990s to a space where the National Water Authority is now able to reduce prices.59 In South Africa, the DWS has been investigating an increase in tariffs, but does not appear to be publically advocating for a national tiered pricing structure.60
Introducing tiered pricing in residential communities reduced demand by at least 18% in just over three years
Pricing water more responsibly should help create a culture of conservation, and avoid more onerous regulations such as the level 6b water restrictions currently in place in the Cape Town metro area.61 The best way for other areas of South Africa to avoid having to deal with the harsh measures being implemented in the Western Cape is to start using water more consciously now.
There are also other demand reduction campaigns being implemented by DWS. In the Northern Cape, the
A DELICATE BALANCE: WATER SCARCITY IN SOUTH AFRICA14
department has issued 50 000 water-saving blocks for users to drop in their toilet cistern, to reduce the average flush by about 2 litres. The department hopes the ‘drop-a-block’ campaign will save over 100 000 litres of water per year.62 DWS has also started the Clear Rivers Campaign, which calls on citizens to get involved in their communities and assist with river rehabilitation.63 These are not national campaigns yet, but could be built upon to encourage a more introspective conversation about water use in South Africa.
The best way for other areas of South Africa to avoid the harsh measures being implemented in the Western Cape is to start using water more consciously now
What is clear is that South Africa must implement a combination of strategies to restore balance to its national water system. The following section explores some alternate futures of water use in South Africa.
Scenario analysis
South Africa’s water sector hangs in the balance. Yet, as shown, stability is not out of reach. As other areas of the globe facing severe water stress have demonstrated, there are solutions available to cultivate a more secure water future for South Africa. These include implementing a combination of WCWDM strategies, increasing the amount of treated wastewater and using groundwater more frequently in areas where its longevity can be ensured.
This section will explore the likely future of South Africa’s water sector and introduce some alternative scenarios. A first scenario (Agricultural Trade-offs) is intended to highlight the constraints that water scarcity can place on other development priorities. A second scenario is presented (Closing the Gap) to demonstrate how a comprehensive, robust response to the water challenges faced today could lead to a more secure water future in South Africa.
Agricultural Trade-offs
South Africa’s NDP envisions a ‘substantial investment in irrigation infrastructure’ and loosely suggests a 50% increase over a 10-year period as the first pillar of the country’s national agriculture strategy.64 South Africa currently has an estimated 1 670 000 ha equipped for irrigation in 2015, of which about 1 365 000 is actually irrigated.65
Both the NWRS2 and the Department of Agriculture, Forestry and Fisheries (DAFF) subsequently questioned if that increase was possible, or even desirable, given current water constraints.66 The DAFF believes that 145 000 ha would be a more reasonable target, which it has established as its target for the national Agricultural Policy Action Plan.67
This scenario will explore some of the implications of increasing the amount of land under irrigation by roughly 145 000 ha by 2025 compared to the Current Path.
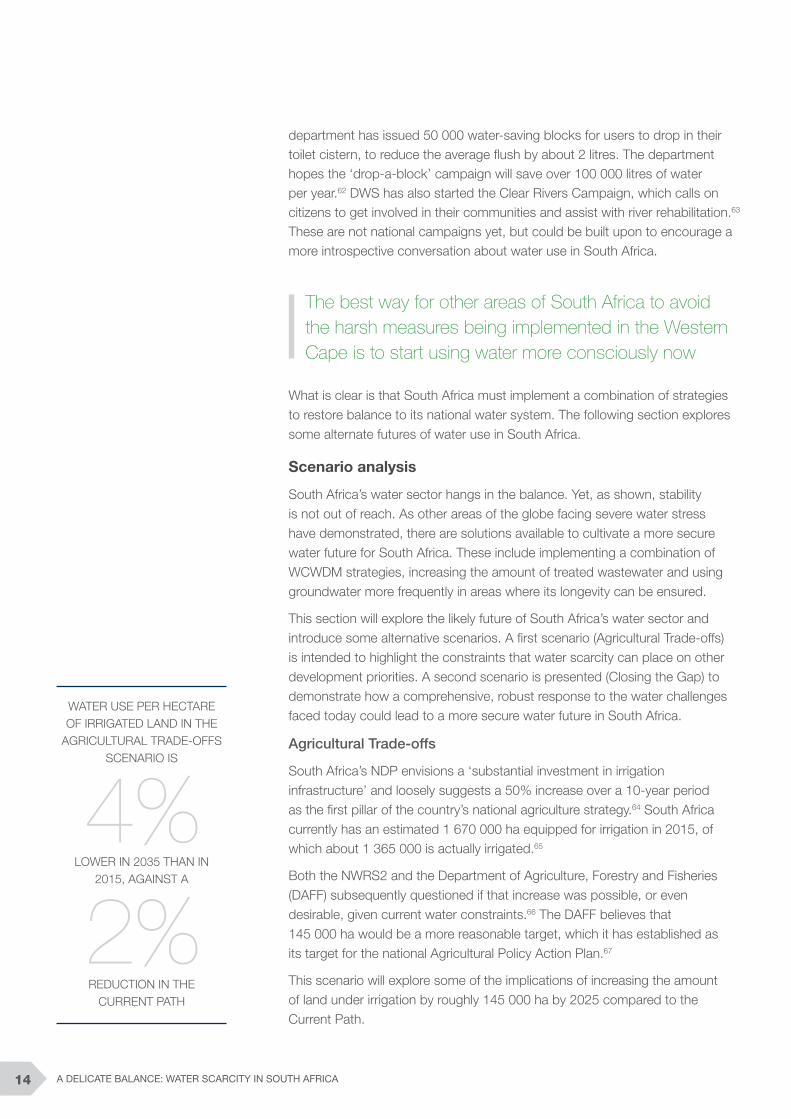
LOWER IN 2035 THAN IN 2015, AGAINST A
REDUCTION IN THE CURRENT PATH
WATER USE PER HECTARE OF IRRIGATED LAND IN THE
AGRICULTURAL TRADE-OFFS SCENARIO IS
4%2%
SOUTHERN AFRICA REPORT 13 | MARCH 2018 15
There are clear benefits to increasing irrigation. A well-
executed expansion of irrigated land in South Africa could
increase yields, decrease dependence on erratic rainfall
and improve the overall resilience of the agricultural
sector. However, like the municipal sector, an expansion
of irrigation in South Africa will have to be conducted
‘primarily through more efficient use of existing water
resources’.68 If South Africa hopes to efficiently increase
the amount of land under irrigation and get ‘more
crop per drop’, it will have to exercise careful water
management in the agricultural sector.69
Put bluntly, ‘in conditions of increasing water shortage,
further development of irrigated agriculture production is
impossible without improving the methods of cultivation
of agricultural crops, primarily irrigation technology’.70
If an expansion of irrigation is considered, it should be
reserved for soils with a higher nutrient content to achieve
the desired increase in yield. If this is accomplished, it
should increase food production in the country and also
leave more water for the municipal and industrial sectors.
In the Agricultural Trade-offs scenario, the land equipped
for irrigation increases from its current (2017) level of
1 688 000 hectares to 1 910 000 by 2025 and then
1 987 000 by 2035. This leads agricultural water
demand to increase from 9.8 km3 (in 2017) to 11.1 km3
by 2035 (compared to the Current Path forecast of
10.4 km3 in 2035).
In the absence of other supply enhancement and
demand reduction interventions, increasing the amount
of land equipped for irrigation will be challenging, and
will almost certainly have diminishing returns. As South
Africa’s population continues to grow, incomes continue
to rise and the country seeks to expand its manufacturing
sector, it will become increasingly difficult to allocate
additional water to the agricultural sector.71
In the Agricultural Trade-offs scenario, municipal water
demand still increases slightly, but only to 5.3 km3 by
2035, compared to 5.6 km3 in the Current Path.
Crucially, municipal demand per capita is about 12%
lower in the Agricultural Trade-offs scenario in 2035 than
in 2015, compared to an 7% decrease in the Current
Path. Industrial water demand is constrained as well,
growing to just 1.77 km3 rather than 1.86 km3 in the
Current Path.
The agricultural sector will also need to be more efficient
– water use per hectare of irrigated land in this scenario
is 4% lower in 2035 than in 2015, against a 2% reduction
in the Current Path. In this scenario, South Africa has
less water to distribute to individuals, less water available
to grow its manufacturing sector or increase the supply
of thermoelectric power, and less water per hectare of
irrigated land.
In other words, if the South African government hopes
to achieve the irrigation target in the NDP, it will need to
offset the additional withdrawals in the agricultural sector
by either increasing supply through alternative sources
(i.e. large investments in treated wastewater, additional
groundwater extraction), or reducing demand through
conservation measures or infrastructure improvements.
It will very likely involve some aspects of both supply
enhancement and demand reduction.
An important consequence of the constraint that water
scarcity places on agricultural production is that South
Africa is forecast to become a significant net food
importer by the late 2020s. This new future could have
serious implications for food security, and make the
country more vulnerable to droughts and other external
shocks going forward.
To achieve the irrigation target in the NDP, government will need to offset the additional withdrawals in the agricultural sector
Additional irrigation schemes will increase agricultural yields and resilience over the short run, but the amount of water devoted to agriculture is still restricted by the structural constraints of the water sector. Increasing the amount of land equipped for irrigation will mean that, over the long run, each hectare of farmland in South Africa receives less water than it otherwise would have without that additional irrigation. Moreover, as additional land is irrigated and agricultural water demand increases, the municipal and industrial water sectors will be even more constrained than in the Current Path.
Closing the Gap
There are a plethora of policy options available to South Africa to reconcile supply and withdrawals in its water
A DELICATE BALANCE: WATER SCARCITY IN SOUTH AFRICA16
sector. The critical question is, what combination of penalties, incentives,
investments and technologies should it embrace?
The Closing the Gap scenario is a future where water supply increases
through higher levels of treated wastewater and renewable groundwater
withdrawals. Irrigation does not expand at the same rate as in the Agricultural
Trade-offs scenario, although it does increase in line with the Current Path.
Water efficiency measures are put in place in the municipal, industrial and
agriculture sectors. Renewable energy increases as a share of the national
energy mix, leading to lower industrial water demand for coal-fired power
plants. And finally, all of the planned supply interventions from all the
reconciliation strategies are implemented on time.
Supply-side interventions
There are various combinations of policies that could deliver a sustainable
solution to South Africa. But, deciding which will ultimately provide the largest
return on investment requires detailed work at local and catchment level by
experts with an intimate knowledge of the relevant conditions and constraints
in their respective water systems.
Deciding which combination of policies will ultimately provide the largest return on investment requires detailed work
At a national level however, this research has pointed to broad areas that the South African government can focus on: increasing the amount of wastewater that is treated and reused, minimising non-revenue water or otherwise increasing efficiency in the municipal sector, increasing the intensity of groundwater use in areas where it is sustainable, and increasing the share of renewable sources in the national energy mix.
This section presents a scenario where the level of treated wastewater that is recycled through the system is increased by about 0.72 km3 by 2035, and the amount of renewable groundwater extracted increases by about 0.3 km3. Moreover, in this scenario these interventions occur in addition to all of the planned interventions outlined in the major reconciliation strategies. In other words, this represents efforts well above and beyond what the government is currently planning.
In the Closing the Gap scenario, South Africa ambitiously implements the above recommendations. These interventions begin from 2018, occur over five years and are then maintained until the end of the forecast. Figure 6 shows that if South Africa can implement ambitious water policies, it is feasible to bring the water sector back into relative balance in a fairly short period of time. However, in this scenario South Africa still toes the line of overexploitation for the next decade and a half, remaining vulnerable to drought and other external shocks.
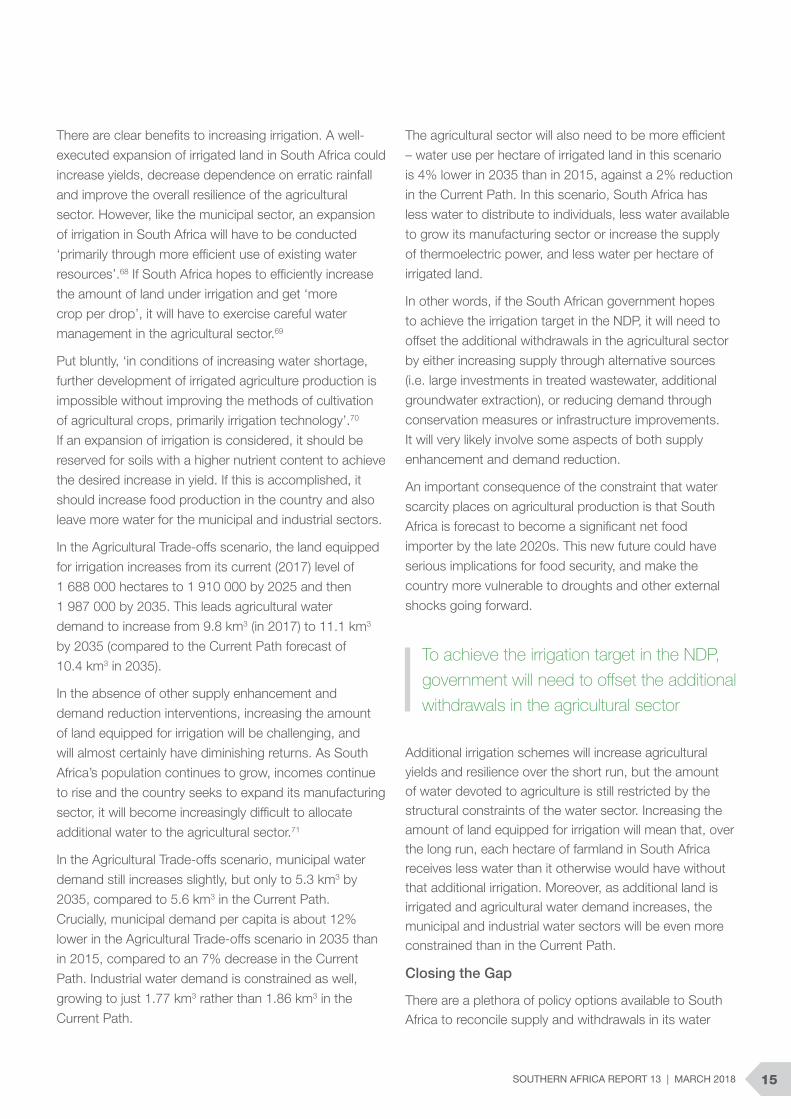
IN THE CLOSING THE GAP SCENARIO, PER HECTARE WATER USE IS REDUCED
BY NEARLY
RELATIVE TO THE CURRENT PATH
by 20357%
SOUTHERN AFRICA REPORT 13 | MARCH 2018 17
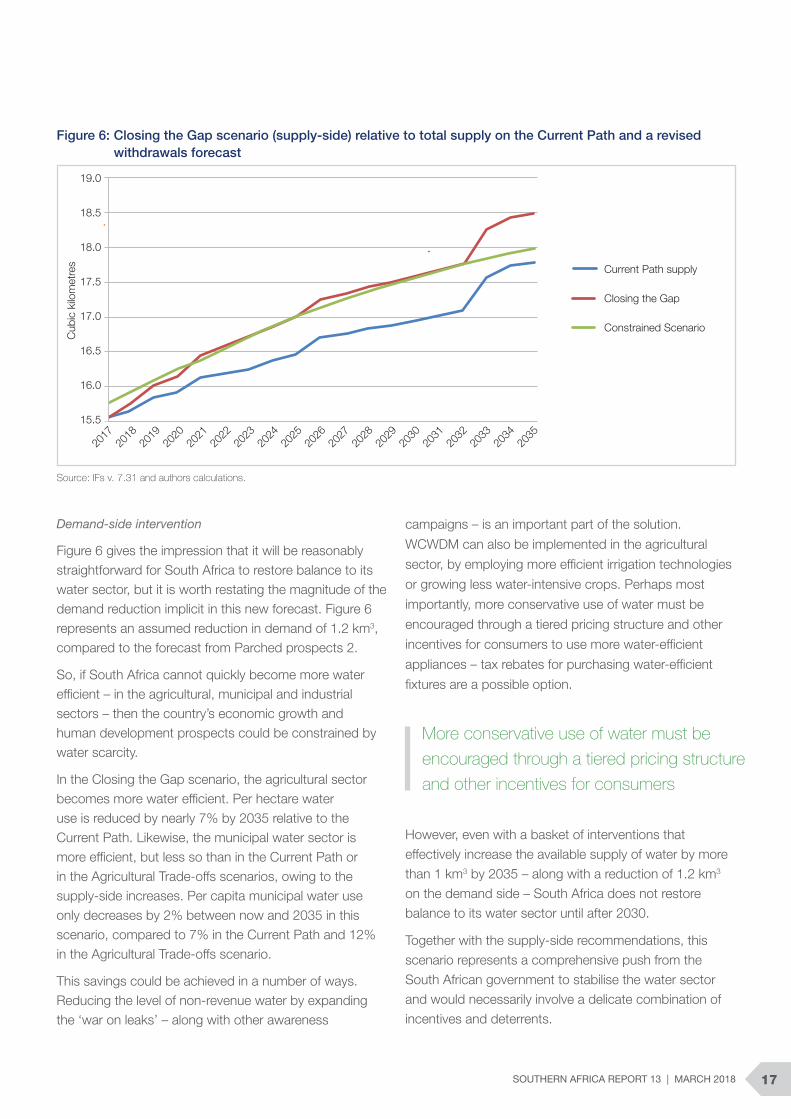
Figure 6: Closing the Gap scenario (supply-side) relative to total supply on the Current Path and a revised withdrawals forecast
Demand-side intervention
Figure 6 gives the impression that it will be reasonably straightforward for South Africa to restore balance to its water sector, but it is worth restating the magnitude of the demand reduction implicit in this new forecast. Figure 6 represents an assumed reduction in demand of 1.2 km3, compared to the forecast from Parched prospects 2.
So, if South Africa cannot quickly become more water efficient – in the agricultural, municipal and industrial sectors – then the country’s economic growth and human development prospects could be constrained by water scarcity.
In the Closing the Gap scenario, the agricultural sector becomes more water efficient. Per hectare water use is reduced by nearly 7% by 2035 relative to the Current Path. Likewise, the municipal water sector is more efficient, but less so than in the Current Path or in the Agricultural Trade-offs scenarios, owing to the supply-side increases. Per capita municipal water use only decreases by 2% between now and 2035 in this scenario, compared to 7% in the Current Path and 12% in the Agricultural Trade-offs scenario.
This savings could be achieved in a number of ways. Reducing the level of non-revenue water by expanding the ‘war on leaks’ – along with other awareness
campaigns – is an important part of the solution.
WCWDM can also be implemented in the agricultural
sector, by employing more efficient irrigation technologies
or growing less water-intensive crops. Perhaps most
importantly, more conservative use of water must be
encouraged through a tiered pricing structure and other
incentives for consumers to use more water-efficient
appliances – tax rebates for purchasing water-efficient
fixtures are a possible option.
Source: IFs v. 7.31 and authors calculations.
More conservative use of water must be encouraged through a tiered pricing structure and other incentives for consumers
However, even with a basket of interventions that
effectively increase the available supply of water by more
than 1 km3 by 2035 – along with a reduction of 1.2 km3
on the demand side – South Africa does not restore
balance to its water sector until after 2030.
Together with the supply-side recommendations, this
scenario represents a comprehensive push from the
South African government to stabilise the water sector
and would necessarily involve a delicate combination of
incentives and deterrents.
2017
2018
2019
2020
2021
2022
2023
2024
2025
2026
2027
2028
2029
2030
2031
2032
2033
2034
2035
Current Path supply
Closing the Gap
Constrained Scenario
19.0
18.5
18.0
17.5
17.0
16.5
16.0
15.5
Cub
ic k
ilom
etre
s

A DELICATE BALANCE: WATER SCARCITY IN SOUTH AFRICA18
If the government begins to aggressively implement measures to enhance supply and curtail demand, then it is on the edge of possible to restore sustainability to South Africa’s water sector without resorting to extremely punitive restrictions. But, if the government fails to respond to the situation, the country could be forced to endure a situation similar to the recent energy crisis, which nearly paralysed the economy.
If the government fails to respond to the situation, the country could be forced to endure a situation similar to the energy crisis, which nearly paralysed the economy
Based on the research presented in this report, these targets appear to be within the realm of possibility – at least in terms of South Africa’s physical resources. Whether or not the South African government possesses the political will – or sufficient finances – to proactively address the problem, is an entirely separate question.
Conclusion and recommendations
The prevailing conclusion of this report is that it is possible for South Africa to reconcile its national-level water system by using available technologies and policies. This research indicates that the country can bring demand in line with available supply through policies that incentivise efficiency (including tiered pricing), improve the quality of the country’s water infrastructure (including wastewater treatment plants) and increase the amount of groundwater used. However, as new technologies (such as desalination and renewable energy) become increasingly affordable, there are other solutions beyond what has been outlined here that could help close the gap between supply and demand.
That said, South Africa cannot afford to delay the implementation of more aggressive water policies. To avoid a state of national panic – similar to that which occurred during the energy crisis of 2014–2015 – the government will have to act immediately. In order to align its water sector, South Africa must:
• Implement water conservation and demand reduction measures: The country must do more to improve the efficiency of water use. This can be done through a combination of infrastructure repairs (to address non-revenue water), new building codes, incentives to install water-efficient appliances and a tiered water-pricing structure. Policy measures should be supplemented with campaigns to raise awareness about high levels of per capita water use and the inherent value of water conservation in a water-scarce country.
• Increase the amount of wastewater that is treated and reused: About 60% of the country’s wastewater in untreated and a survey of 88 municipalities found that more than two-thirds of the wastewater treatment facilities examined did not meet minimum quality control standards. A failure to
SOUTH AFRICA CANNOT AFFORD TO DELAY THE
IMPLEMENTATION OF MORE AGGRESSIVE WATER POLICIES
SOUTHERN AFRICA REPORT 13 | MARCH 2018 19
efficiently address wastewater treatment and reuse could have devastating consequences for people, the environment and the economy. Progress here will not only improve the quality of South Africa’s water but also increase the supply.
• Increase groundwater extraction: Groundwater is likely an under-used resource in South Africa. Although there are no precise estimates of how much groundwater is available and where, the DWS estimate suggests that there is potential to significantly expand the amount of groundwater extracted. This could be particularly useful for the agricultural sector, where nearly two-thirds of South Africa’s water is used.
option for these major municipalities. However,
desalination will not be able to address water scarcity
in South Africa’s inland areas and will have a limited
impact on the agricultural sector, and so likely will
only play a small part in South Africa’s water future.
• Renewable energy: South Africa is almost entirely
dependent on coal for its electricity needs. These
thermoelectric power plants require large amounts
of water for cooling and threaten to further harm
the country’s water ecosystems. Increasing the
amount of energy generated from renewable sources
will reduce industrial water demand, lower carbon
emissions and minimise water contamination from
industrial activity related to coal production.
In 2002, UNESCO adopted General Comment No.
15, which states that ‘the human right to water is
indispensable for leading a life in human dignity. It is a
prerequisite for the realization of other human rights.’72
As the forces of climate change, population growth,
urbanisation and industrialisation collide in South Africa
it is vital that policymakers take aggressive measures to
restore balance to the water sector.
However, it is equally critical that those policies are
implemented with the understanding that the country
is still working to overcome decades of systemic
oppression. Finding the right balance between promoting
general conservation among those who can afford it,
while working to expand access to clean water for
those who do not currently have it, will be difficult. That
said, it is hard to think of a more important or worthy
policy goal.
Based on the research presented in this report, these targets appear possible – at least in terms of South Africa’s physical resources
• Explore new technologies: This report stresses that there are available, affordable solutions to South Africa’s water problems. However, it did not explore more advanced technologies in as much detail.
• Desalination: Currently, desalination technology is prohibitively expensive for South Africa, except in very large, coastal metropolitan areas such as Cape Town, Durban and Nelson Mandela Bay (desalination currently accounts for less than 1% of South Africa’s total water demand). As the cost of desalination decreases, it will likely become an increasingly viable
20 A DELICATE BALANCE: WATER SCARCITY IN SOUTH AFRICA
• LHWP Phase ll, had slight delays due to the unrest in Lesotho after their national elections and a new government coming into power. That notwithstanding, the project is proposed to be finished in the original timeline by 2025.73 The main structures will be the building of the Polihali Dam and the tunnel that would join Polihali to the Katse Dam now in operation.74
• Kalahari East Water Scheme in Northern Cape, construction of a 21 million litre storage reservoir,
not competed.75
• Greater Mthonjaneni Bulk Water Supply Project in Kwa-Zulu Natal. In Phase 2, goal of eradicating water backlogs by 30 percent with a yield of 14.6 million m3/year, expected to be completed by 2018. Includes upgrading booster pumps, refurbishment of raw water reservoirs and pipeline networks, using Lake Phobane as a water source.76
• Vaal Gamagara Water Scheme in Northern Cape launched on 23 June 2016. To Augment water supply in the Northern Cape up to 2040. For mining and agricultural activities and six municipalities and
22 villages. Involves pipeline construction and drilling of boreholes.77
• Mopani Intervention Project in Limpopo province is set to be completed in June 2017. Project consists of a pipeline network, borehole refurbishment and upgrading Waste Water Treatment Works (WWTW)
and construction of a new WWTW that will provide water to 55 villages.78
• Thukela-Goedertrouw Tranfer Scheme upgrade in Kwa-Zulu Natal. Richards Bay area water supply is
running low and therefore the upgrade will double current yield from the Tugela River.79
• Mzimvubu Water Project in Eastern Cape is soon to finish the design phase. It consists of two dams; Ntabelanga Dam on the Tsitsa River with a storage capacity of 490 million m3 and the Lanleni Hydropower Dam which will generate between 35 and 180 MW of power. The project will include a distribution pipeline and an irrigation network.80
• James Kleynhans Bulk Water Supply in the Eastern Cape, Phase 1: augmentation and upgrading has commenced and will increase water treatment works from 3.65 million m3/year to 7.3 million m3/year. Upon completion, the project will help meet water demand requirements till 2035.81
Annex A – Updates to large scale reconciliation strategies

SOUTHERN AFRICA REPORT 13 | MARCH 2018 21
Notes
The authors would like to thank Wandile Nomquphu,
Barry Hughes, Jakkie Cilliers, Jonathan Moyer, Julia
Schuenemann, Mark Ronan, Roger Dickinson, Amelia
Broodryk, Anu Klaussens and Penny Jaca, for their
feedback and support throughout this process. We
must also thank Harold Weepener, Isa Thompson, Niel
Van Wyk, Inga Jacobs, Eiman Karar and the rest of the
Reference Group of the WRC Project for the assistance
and the constructive discussions during the duration of
the project.
1 S Hedden and J Cilliers, Parched prospects: the emerging water crisis in South Africa, Institute for Security Studies (ISS), African Futures, Paper 11, September 2014, www.issafrica.org/research/papers/parched-prospects-the-emerging-water-crisis-in-south-africa
2 Intergovernmental Panel on Climate Change (IPCC), Climate change 2014: impacts, adaptation, and vulnerability, Part B: Regional aspects, Chapter 22: Africa, 1199, www.ipcc.ch/report/ar5/wg2/
3 E de Jager, SA rainfall in 2015 the lowest on record – SAWS, PoliticsWeb, 14 January 2016, www.politicsweb.co.za/politics/sa-rainfall-in-2015-the-lowest-on-record--saws; South African Weather Service, General information: South Africa – total rainfall, www.weathersa.co.za/images/documents/299/CLS-CI-GEN-INFO-109%201%20SA%20Annual%20Total%20Rainfall.pdf
4 Department of Water and Sanitation (DWS), National Integrated Water Information System (NIWIS), http://niwis.dws.gov.za/niwis2/SurfaceWaterStorage
5 Organisation for Economic Co-operation and Development (OECD), Economic surveys: South Africa 2015 overview, July 2015, http://www.oecd.org/eco/surveys/South-Africa-OECD-economic-survey-overview.pdf
6 United Nations (UN), The United Nations World Water Development Report 3: Water in a changing world, 2009, http://unesdoc.unesco.org/images/0018/001819/181993e.pdf
7 M van der Merwe, Eastern Cape drought rapidly overtaking the Cape Town crisis, Daily Maverick, 17 January 2018, www.dailymaverick.co.za/article/2018-01-17-eastern-cape-drought-rapidly-overtaking-the-cape-town-crisis/#.WoGEoZNubUI
8 S Hedden, Parched prospects II: a revised long-term water supply and demand forecast for South Africa, ISS, African Futures, Paper 16, March 2016, www.issafrica.org/research/papers/parched-prospects-ii-a-revised-long-term-water-supply-and-demand-forecast-for-south-africa
9 The mechanism used to constrain demand is known as a proportional-integral-derivative controller. The price of water is initialised at a constant rate and uses the integral to determine the absolute distance of the system from the target (i.e. equilibrium between supply and withdrawal) and the derivative, which is the change in the balance of the system from the previous year (i.e. change between supply and withdrawal). For more information on the technical details of the water sub-module documentation, see University of Denver, Frederick S Pardee Center for International Studies, www.pardee.du.edu/understand-interconnected-world or the forthcoming WRC publication from this research.
10 ‘The larger the proportion of a country’s population that lives in urban areas, the better developed the water-saving technologies and policies for municipal-water demand generally become. Therefore, there is a negative correlation between the portion of a country’s population that lives in urban areas and water use per capita.’ S Hedden, Parched prospects II: a revised long-term water supply and demand forecast for South Africa, ISS, African Futures, Paper 16, March 2016, www.issafrica.org/research/papers/parched-prospects-ii-a-revised-long-term-water-supply-and-demand-forecast-for-south-africa
11 For a full description of the water sub-module of the International Futures (IFs) forecasting system, see the environmental model documentation on University of Denver, Frederick S Pardee Center for International Studies, IFs environmental model documentation, http://pardee.du.edu/ifs-environment-model-documentation
12 The default time to convergence in the model is set to 50 years, and that has not been adjusted for this project. This has a significant impact on the forecast for water withdrawals, as well as in other areas, as shown above.
13 Examples of countries that have decreased total water demand include Australia (1 km3 between 2000 and 2013), Belgium (1.6 km3 between 1997 and 2009), Canada (.9 km3 between 1996 and 2007) and Japan (3 km3 between 2002 and 2009). Data taken from IFs via FAO Aquastat.
14 Non-revenue water refers to the discrepancy between the volume of water put into a system and the volume billed to consumers.
15 UN Educational, Scientific and Cultural Organization (UNESCO), Water in a changing world, 2009, http://unesdoc.unesco.org/images/0018/001819/181993e.pdf
16 Ibid.; C Vörösmarty et al., Global threats to human water security and river biodiversity, Nature, 467:7315, 2010. Microbials refer to ‘a unicellular or small multicellular organism including bacteria, protozoa, some algae, fungi, viruses and some worms, especially those that are injurious to other organisms’. See The Free Dictionary, Microbial, http://medical-dictionary.thefreedictionary.com/microbial
17 CV Privette and J Smink, Assessing the potential impacts of WWTP effluent reductions within the Reedy River watershed, Ecological Engineering, 98, 2017, 11–16. Untreated effluent leads to higher traces of chemicals and bacteria, resulting in increased eutrophication and pollution of the water source as there is an algae bloom and this causes less sunlight to perforate the water and reach plants on the waterbed. Plants on the waterbed begin to decompose and the dissolved oxygen count in the water decreases. Low oxygen counts cause further loss of aquatic life.
18 UNESCO, Water in a changing world, 2009, http://unesdoc.unesco.org/images/0018/001819/181993e.pdf; C Vörösmarty et al., A geospatial approach to assessing water stress in Africa, www.mssanz.org.au/MODSIM03/Volume_01/A07/04_Vorosmarty.pdf
19 NJ Ashbolt, Microbial contamination of drinking water and disease outcomes in developing regions, Toxicology, 198:1–3, 20 May 2004, 229–238.
20 UNICEF, How WASH relates to health, education, and development, 30 June 2015, http://www.unicef.org/wash/index_healthandeducation.html
21 B Hughes et al., Patterns of potential human progress, vol. 3 (Health), Oxford University Press, 2011, www.pardee.du.edu/patterns-potential-human-progress
22 Climate Nexus, Climate risk and spread of vector-borne diseases, 2015, https://climatenexus.org/climate-issues/health/climate-change-and-vector-borne-diseases/
23 J de Villiers, Western Cape declared disaster area over drought, News24, 22 May 2017, http://www.news24.com/SouthAfrica/News/western-cape-declared-disaster-zone-over-drought-20170522
24 Level 6b water restrictions: Limit of 50 litres of municipal drinking water per person per day, no irrigation with municipal water, boreholes and well points must be registered and water irrigation using these must be done between 6pm and 9am. See Government of Cape Town, Guidelines and regulations: water restrictions, http://www.capetown.gov.za/Family%20and%20home/residential-utility-services/residential-water-and-sanitation-services/Residential-water-restrictions-explained
25 G Howard and J Bartman, Domestic water quantity, service level and health, World Health Organization (WHO), 2003, http://cdrwww.who.int/water_sanitation_health/diseases/WSH03.02.pdf
26 IPCC, Climate change 2014: impacts, adaptation, and vulnerability, Part B: Regional aspects, Chapter 22: Africa, 1199, www.ipcc.ch/report/ar5/wg2/
27 Food and Agriculture Organization (FAO), Aquastat, http://www.fao.org/nr/water/aquastat/data/glossary/search.html
28 Ibid. When industries are connected to the public distribution network, they are typically categorised as municipal withdrawals.
22 A DELICATE BALANCE: WATER SCARCITY IN SOUTH AFRICA
29 While the agricultural sector consumes more than 80% of available freshwater in Africa and Asia, that figure is only 21% for Europe. See FAO, Water use, http://www.fao.org/nr/Water/aquastat/water_use/index.stm
30 Department of Water Affairs, Strategic overview of the water sector in South Africa, 2013, nepadwatercoe.org/wp-content/uploads/Strategic-Overview-of-the-Water-Sector-in-South-Africa-2013.pdf; R McKenzie, ZN Siqalaba and WA Wegelin, The state of non-revenue water in South Africa, Water Research Commission, WRC report no. TT 522/12, 12 August 2012.
31 R Frauendorfer and R Liemberger, The issues and challenges of reducing non-revenue water, Asian Development Bank, 2010, https://www.adb.org/sites/default/files/publication/27473/reducing-nonrevenue-water.pdf
32 DWS, National Integrated Water Information System (NIWIS), http://niwis.dws.gov.za/niwis2/ws_nrw
33 Australian Water Association, July 2017, More investment needed to curtail non-revenue water losses in Australia, http://www.awa.asn.au/AWA_MBRR/Publications/Latest_News/More_investment_needed_to_curtail_non-revenue_water_losses_in_Australia.aspx
34 The Current Path forecast used in this paper does have some slight modifications. This forecast includes more recent data on life expectancy, infant mortality, government spending and the area of land equipped for irrigation that is actually irrigated. These are many of the same changes used in J. Cilliers. Fate of the Nation: 3 Future Scenarios for South Africa. Jonathan Ball Publishers. 2017.
35 National Planning Commission, Our future – make it work: National Development Plan 2030, 2012, www.poa.gov.za/news/Documents/NPC%20National%20Development%20Plan%20Vision%202030%20-lo-res.pdf
36 For a detailed report on water use for electricity in South Africa, see A Pouris and GA Thopil, Long term forecasts of water usage for electricity generation: South Africa 2030, Water Research Commission (WRC), Report no. 2383/1/14, www.wrc.org.za/Knowledge%20Hub%20Documents/Research%20Reports/2383-1-14.pdf
37 For information on Mpumalanga, see FG Bell et al., Environmental impacts associated with an abandoned mine in the Witbank coalfield, South Africa, International Journal of Coal Geology, 45, 2001, 195–216; JN Blignaut and NA King, The externality cost of coal combustion in South Africa, paper presented at the First Annual Conference on the Forum for Economics and the Environment, Cape Town, 2002; P Hobbs, SHH Oelofse and J Rascher, Management of environmental impacts from coal mining in the Upper Olifants River catchment as a function of age and scale, International Journal of Water Resource Development, special edition, 24:3, 2008, 417–432.
38 M Muller and A Paasch, When only coal counts: German co-responsibility for human rights in the South African coal sector, Actionaid, 2017, 46, www.actionaid.org/south-africa/publications/when-only-coal-counts-german-co-responsibility-human-rights-south-african-
39 The following is a list of reconciliation strategies used for this forecast: J Beumer et al., Development of a reconciliation strategy for the Olifants River Water Supply System, Department of Water Affairs, December 2011, report no. P WMA 04/ B50/00/8310/14; K Riemann, J Human and R Hay, Support to the continuation of the water reconciliation strategy for the Western Cape Water Supply System, DWS, status report, October 2014; DWS, Support to the continuation of the water reconciliation strategy for the Western Cape Water Supply System, status report, October 2015, prepared by Umvoto Africa (Pty) Ltd in association with WorleyParsons RSA on behalf of the Directorate, National Water Resource Planning; Department of Water Affairs, Algoa reconciliation strategy, prepared by E van der Berg and MJ Shand of Aurecon, as part of the water reconciliation strategy study for the Algoa water supply area, 2011, DWA report no. WMA 15/M00/00/1409/04; PG van Rooyen and study team, Amatole Water Supply System reconciliation strategy, Department of Water Affairs, status report, September 2015; Water reconciliation strategy for the KwaZulu-Natal coastal metropolitan areas, final version, November 2009, DWA report no. PWMA 11/000/00/1107; Department of Water Affairs, Amatole Water Supply System reconciliation strategy, status report 2012, Rev 3, https://www.dwa.gov.za/projects.aspx; Department of Water Affairs, Final reconciliation strategy, water requirements and availability
reconciliation strategy for the Mbombela municipal area, February 2014; Department of Water Affairs, Reconciliation strategy report for the large bulk water supply systems of the Greater Bloemfontein area, prepared by Aurecon in association with GHT Consulting Scientists and ILISO Consulting as part of the water reconciliation strategy study for the large bulk water supply systems: Greater Bloemfontein area, 2012, DWA report no. PWMA 14/C520/00/0910/05; Department of Water Affairs, Development of a reconciliation strategy for the Luvuvhu and Letaba Water Supply System: Final reconciliation strategy, executive summary, 2014; DWS, Water reconciliation strategy for Richards Bay and surrounding towns, interventions report, prepared by Aurecon South Africa (Pty) Ltd as part of the water reconciliation strategy for Richards Bay and surrounding towns, 2015; Department of Water Affairs and Forestry, Vaal River system: Large bulk water supply reconciliation strategy, second stage reconciliation strategy, March 2009, prepared by DMM Development Consultants, Golder Associates Africa, SRK, WRP Consulting Engineers and Zitholele Consulting, DWAF report no. PRSA C000/00/4406/08; Department of Water Affairs, Development of reconciliation strategies for large bulk water supply systems Orange River: surface water hydrology and system analysis report, August 2013, prepared by WRP Consulting Engineers, Aurecon, Golder Associates Africa and Zitholele Consulting, report no. PRSA D000/00/18312/7; Department of Water Affairs, Development of reconciliation strategies for large bulk water supply systems Orange River, 2015; Department of Water Affairs and Forestry, The development of a reconciliation strategy for the Crocodile West water supply system, version 1, July 2008, DWAF report no. PWMA 03/000/00/3608; Department of Water Affairs and Forestry, Support to the implementation and maintenance of the reconciliation strategy of the Crocodile West Water Supply System, Crocodile West reconciliation strategy, December 2012, DWAF report no. PWMA 03/A31/00/6110/4.
40 FAO, Aquastat: South Africa, www.fao.org/nr/water/aquastat/countries_regions/ZAF/
41 DWS, Green Drop System, Green Drop Report, 2013, www.dwa.gov.za/dir_ws/gds/Docs/DocsDefault.aspx.
42 700 l/p/d to 500 l/p/d (converted from gallons): Alliance for Water Efficiency, Research Shows Water Conservation Helps Keep Rates Low in Arizona Communities, June 2017, www.allianceforwaterefficiency.org/Avoided-Cost-Report.aspx
43 T Gaynor, Arid Tucson leads the way in water conservation out west, Al Jazeera, June 2015, www.america.aljazeera.com/articles/2015/6/15/
arid-tucson-leads-the-way-in-water-conservation-out-west.html
44 Alliance for Water Efficiency. 2017.
45 Israel Water Authority, Y Lev, Israeli Experience in Water Saving in the Municipal Sector, State of Israel Water Authority, 2012, www.water.gov.il/Hebrew/ProfessionalInfoAndData/2012/17-Israel-Water-Sector-Water-Saving.pdf
46 AfriForum, Blue and Green Drop Project for 2017, https://www.afriforum.co.za/blue-green-drop-project-2017/
47 Ibid.
48 P Reig, A Maddocks and F Gassert, World’s most water-stressed countries, World Resource Institute, 2013, https://www.wri.org/blog/2013/12/world%E2%80%99s-36-most-water-stressed-countries
49 M Rayi, Unemployed youth get training in war on water leaks: DWS Press Release, iol, 23 April 2017, https://www.iol.co.za/capetimes/news/unemployed-youth-get-training-in-war-on-water-leaks-8785636
50 DWS, KwaZulu-Natal hosts War on Leaks Workshop with stakeholders, Press Release, 26 August 2016, www.dwa.gov.za/stories/IA%20-%20KwaZulu-Natal%20hosts%20War%20on%20Leaks%20Workshop%20with%20Stakeholders.pdf; GreenCape, Water: 2017 market intelligence report, www.greencape.co.za/assets/Uploads/GreenCape-Water-MIR-2017-electronic-FINAL-v1.pdf. ‘Increasingly, water authorities are emphasizing groundwater as a priority supply option. The total estimated yield of available, renewable groundwater in South Africa is between 7 and 10 billion m3/year, while between 2 and 4 billion m3/year is currently being used. Therefore, there is the potential to considerably increase groundwater supplies, especially in agriculture, because this is the major sector-user of groundwater (Figure 24) (WRC 2013c).’
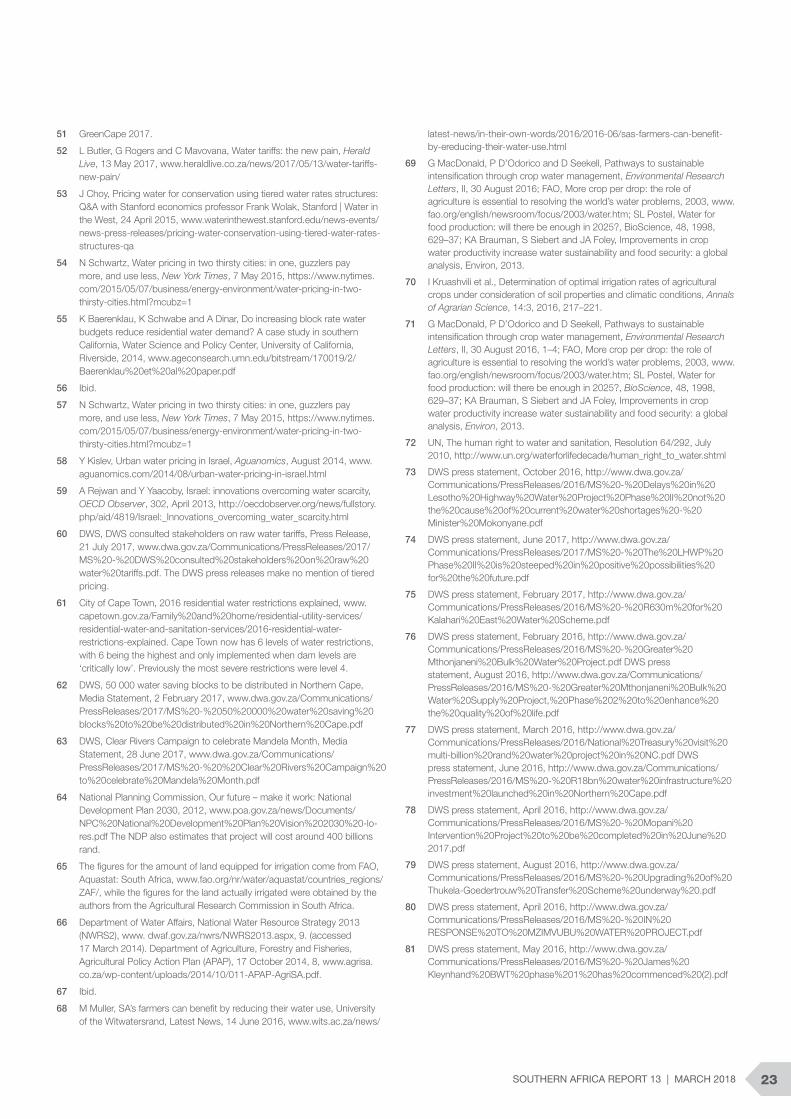
SOUTHERN AFRICA REPORT 13 | MARCH 2018 23
51 GreenCape 2017.
52 L Butler, G Rogers and C Mavovana, Water tariffs: the new pain, Herald Live, 13 May 2017, www.heraldlive.co.za/news/2017/05/13/water-tariffs-new-pain/
53 J Choy, Pricing water for conservation using tiered water rates structures: Q&A with Stanford economics professor Frank Wolak, Stanford | Water in the West, 24 April 2015, www.waterinthewest.stanford.edu/news-events/news-press-releases/pricing-water-conservation-using-tiered-water-rates-structures-qa
54 N Schwartz, Water pricing in two thirsty cities: in one, guzzlers pay more, and use less, New York Times, 7 May 2015, https://www.nytimes.com/2015/05/07/business/energy-environment/water-pricing-in-two-thirsty-cities.html?mcubz=1
55 K Baerenklau, K Schwabe and A Dinar, Do increasing block rate water budgets reduce residential water demand? A case study in southern California, Water Science and Policy Center, University of California, Riverside, 2014, www.ageconsearch.umn.edu/bitstream/170019/2/Baerenklau%20et%20al%20paper.pdf
56 Ibid.
57 N Schwartz, Water pricing in two thirsty cities: in one, guzzlers pay more, and use less, New York Times, 7 May 2015, https://www.nytimes.com/2015/05/07/business/energy-environment/water-pricing-in-two-thirsty-cities.html?mcubz=1
58 Y Kislev, Urban water pricing in Israel, Aguanomics, August 2014, www.aguanomics.com/2014/08/urban-water-pricing-in-israel.html
59 A Rejwan and Y Yaacoby, Israel: innovations overcoming water scarcity, OECD Observer, 302, April 2013, http://oecdobserver.org/news/fullstory.php/aid/4819/Israel:_Innovations_overcoming_water_scarcity.html
60 DWS, DWS consulted stakeholders on raw water tariffs, Press Release, 21 July 2017, www.dwa.gov.za/Communications/PressReleases/2017/MS%20-%20DWS%20consulted%20stakeholders%20on%20raw%20water%20tariffs.pdf. The DWS press releases make no mention of tiered pricing.
61 City of Cape Town, 2016 residential water restrictions explained, www.capetown.gov.za/Family%20and%20home/residential-utility-services/residential-water-and-sanitation-services/2016-residential-water-restrictions-explained. Cape Town now has 6 levels of water restrictions, with 6 being the highest and only implemented when dam levels are ‘critically low’. Previously the most severe restrictions were level 4.
62 DWS, 50 000 water saving blocks to be distributed in Northern Cape, Media Statement, 2 February 2017, www.dwa.gov.za/Communications/PressReleases/2017/MS%20-%2050%20000%20water%20saving%20blocks%20to%20be%20distributed%20in%20Northern%20Cape.pdf
63 DWS, Clear Rivers Campaign to celebrate Mandela Month, Media Statement, 28 June 2017, www.dwa.gov.za/Communications/PressReleases/2017/MS%20-%20%20Clear%20Rivers%20Campaign%20to%20celebrate%20Mandela%20Month.pdf
64 National Planning Commission, Our future – make it work: National Development Plan 2030, 2012, www.poa.gov.za/news/Documents/NPC%20National%20Development%20Plan%20Vision%202030%20-lo-res.pdf The NDP also estimates that project will cost around 400 billions rand.
65 The figures for the amount of land equipped for irrigation come from FAO, Aquastat: South Africa, www.fao.org/nr/water/aquastat/countries_regions/ZAF/, while the figures for the land actually irrigated were obtained by the authors from the Agricultural Research Commission in South Africa.
66 Department of Water Affairs, National Water Resource Strategy 2013 (NWRS2), www. dwaf.gov.za/nwrs/NWRS2013.aspx, 9. (accessed 17 March 2014). Department of Agriculture, Forestry and Fisheries, Agricultural Policy Action Plan (APAP), 17 October 2014, 8, www.agrisa.co.za/wp-content/uploads/2014/10/011-APAP-AgriSA.pdf.
67 Ibid.
68 M Muller, SA’s farmers can benefit by reducing their water use, University of the Witwatersrand, Latest News, 14 June 2016, www.wits.ac.za/news/
latest-news/in-their-own-words/2016/2016-06/sas-farmers-can-benefit-by-ereducing-their-water-use.html
69 G MacDonald, P D’Odorico and D Seekell, Pathways to sustainable intensification through crop water management, Environmental Research Letters, II, 30 August 2016; FAO, More crop per drop: the role of agriculture is essential to resolving the world’s water problems, 2003, www.fao.org/english/newsroom/focus/2003/water.htm; SL Postel, Water for food production: will there be enough in 2025?, BioScience, 48, 1998, 629–37; KA Brauman, S Siebert and JA Foley, Improvements in crop water productivity increase water sustainability and food security: a global analysis, Environ, 2013.
70 I Kruashvili et al., Determination of optimal irrigation rates of agricultural crops under consideration of soil properties and climatic conditions, Annals of Agrarian Science, 14:3, 2016, 217–221.
71 G MacDonald, P D’Odorico and D Seekell, Pathways to sustainable intensification through crop water management, Environmental Research Letters, II, 30 August 2016, 1–4; FAO, More crop per drop: the role of agriculture is essential to resolving the world’s water problems, 2003, www.fao.org/english/newsroom/focus/2003/water.htm; SL Postel, Water for food production: will there be enough in 2025?, BioScience, 48, 1998, 629–37; KA Brauman, S Siebert and JA Foley, Improvements in crop water productivity increase water sustainability and food security: a global analysis, Environ, 2013.
72 UN, The human right to water and sanitation, Resolution 64/292, July 2010, http://www.un.org/waterforlifedecade/human_right_to_water.shtml
73 DWS press statement, October 2016, http://www.dwa.gov.za/Communications/PressReleases/2016/MS%20-%20Delays%20in%20Lesotho%20Highway%20Water%20Project%20Phase%20II%20not%20the%20cause%20of%20current%20water%20shortages%20-%20Minister%20Mokonyane.pdf
74 DWS press statement, June 2017, http://www.dwa.gov.za/Communications/PressReleases/2017/MS%20-%20The%20LHWP%20Phase%20II%20is%20steeped%20in%20positive%20possibilities%20for%20the%20future.pdf
75 DWS press statement, February 2017, http://www.dwa.gov.za/Communications/PressReleases/2016/MS%20-%20R630m%20for%20Kalahari%20East%20Water%20Scheme.pdf
76 DWS press statement, February 2016, http://www.dwa.gov.za/Communications/PressReleases/2016/MS%20-%20Greater%20Mthonjaneni%20Bulk%20Water%20Project.pdf DWS press statement, August 2016, http://www.dwa.gov.za/Communications/PressReleases/2016/MS%20-%20Greater%20Mthonjaneni%20Bulk%20Water%20Supply%20Project,%20Phase%202%20to%20enhance%20the%20quality%20of%20life.pdf
77 DWS press statement, March 2016, http://www.dwa.gov.za/Communications/PressReleases/2016/National%20Treasury%20visit%20multi-billion%20rand%20water%20project%20in%20NC.pdf DWS press statement, June 2016, http://www.dwa.gov.za/Communications/PressReleases/2016/MS%20-%20R18bn%20water%20infrastructure%20investment%20launched%20in%20Northern%20Cape.pdf
78 DWS press statement, April 2016, http://www.dwa.gov.za/Communications/PressReleases/2016/MS%20-%20Mopani%20Intervention%20Project%20to%20be%20completed%20in%20June%202017.pdf
79 DWS press statement, August 2016, http://www.dwa.gov.za/Communications/PressReleases/2016/MS%20-%20Upgrading%20of%20Thukela-Goedertrouw%20Transfer%20Scheme%20underway%20.pdf
80 DWS press statement, April 2016, http://www.dwa.gov.za/Communications/PressReleases/2016/MS%20-%20IN%20RESPONSE%20TO%20MZIMVUBU%20WATER%20PROJECT.pdf
81 DWS press statement, May 2016, http://www.dwa.gov.za/Communications/PressReleases/2016/MS%20-%20James%20Kleynhand%20BWT%20phase%201%20has%20commenced%20(2).pdf
© 2018, Institute for Security Studies
Copyright in the volume as a whole is vested in the Institute for Security Studies and the authors, and no part may be reproduced in whole or in part without the express permission, in writing, of both the authors and the publishers.
The opinions expressed do not necessarily reflect those of the ISS, its trustees, members of the Advisory Council or donors. Authors contribute to ISS publications in their personal capacity.
About the ISSThe Institute for Security Studies (ISS) partners to build knowledge and skills that secure Africa’s future. Our goal is to enhance human security as a means to achieve sustainable peace and prosperity. The ISS is an African non-profit organisation with offices in South Africa, Kenya, Ethiopia and Senegal.For more, visit www.issafrica.org.
About the African Futures Project The African Futures Project is a collaboration between the ISS and the Frederick S. Pardee Center for International Futures at the Josef Korbel School of International Studies, University of Denver. This project uses the International Futures (IFs) model to produce forward-looking, policy relevant analysis.
About the authorsZachary Donnenfeld is a senior researcher with the African Futures and Innovation Programme. He started at the ISS in 2015 and previously worked at the Frederick S Pardee Center for International Futures, and the Environment, Food and Conflict Laboratory at the Josef Korbel School of International Studies at the University of Denver.
Courtney Crookes joined the ISS as a consultant in 2016. She is completing her MA in water resource management at the University of Pretoria, and holds a degree in Hydrology and a post-graduate diploma in Business Management from the University of KwaZulu-Natal.
Steve Hedden is a Research Systems Developer at the Frederick S Pardee Center for International Futures at the Josef Korbel School of International Studies at the University of Denver. From 2014 to 2015 he was a researcher at the ISS in the African Futures and Innovation Programme.
AcknowledgementsThis report was made possible by the support of the Water Research Commission. The ISS is also grateful for support from the following members of the ISS Partnership Forum: the Hanns Seidel Foundation, the European Union and the governments of Canada, Denmark, Finland, Ireland, the Netherlands, Norway, Sweden and the USA.