a descriptive case study: investigating the implementation
TRANSCRIPT
Purdue UniversityPurdue e-Pubs
Open Access Dissertations Theses and Dissertations
12-2016
A descriptive case study: Investigating theimplementation of web based, automated gradingand tutorial software in a freshman computerliteracy courseGlen J. CoulthardPurdue University
Follow this and additional works at: https://docs.lib.purdue.edu/open_access_dissertations
Part of the Curriculum and Instruction Commons
This document has been made available through Purdue e-Pubs, a service of the Purdue University Libraries. Please contact [email protected] foradditional information.
Recommended CitationCoulthard, Glen J., "A descriptive case study: Investigating the implementation of web based, automated grading and tutorial softwarein a freshman computer literacy course" (2016). Open Access Dissertations. 917.https://docs.lib.purdue.edu/open_access_dissertations/917
Graduate School Form30 Updated
PURDUE UNIVERSITYGRADUATE SCHOOL
Thesis/Dissertation Acceptance
This is to certify that the thesis/dissertation prepared
By
Entitled
For the degree of
Is approved by the final examining committee:
To the best of my knowledge and as understood by the student in the Thesis/Dissertation Agreement, Publication Delay, and Certification Disclaimer (Graduate School Form 32), this thesis/dissertation adheres to the provisions of Purdue University’s “Policy of Integrity in Research” and the use of copyright material.
Approved by Major Professor(s):
Approved by:Head of the Departmental Graduate Program Date

i
A DESCRIPTIVE CASE STUDY: INVESTIGATING THE IMPLEMENTATION OF
WEB BASED, AUTOMATED GRADING AND TUTORIAL SOFTWARE IN A
FRESHMAN COMPUTER LITERACY COURSE
A Dissertation
Submitted to the Faculty
of
Purdue University
by
Glen J. Coulthard
In Partial Fulfillment of the
Requirements for the Degree
of
Doctor of Philosophy
December 2016
Purdue University
West Lafayette, Indiana

ii
To our friends in Lafayette, Indiana
iii
ACKNOWLEDGEMENTS
This dissertation would not have been possible without the unwavering support of
my committee chair, Dr. Tim Newby. Along with his motivational Skype sessions,
Dr. Newby’s belief in my ability to produce high-quality work surpassed my own at
times. His feedback, guidance, and friendship will be remembered always. Another
valued committee member, Dr. James Lehman, supplied the experiential wisdom,
thought-provoking feedback, and attention to detail necessary to professionally present
the enclosed research. I would also like to express my sincere appreciation to Dr. Jennifer
Richardson and Dr. Bill Watson for their willingness to share their expertise and join the
committee later in the process. Based on Dr. Richardson’s perspicacious questioning and
feedback, chapters were rewritten and methodologies sharpened. Dr. Watson’s previous
experience in software instruction and simulation technologies provided a refreshingly
keen perspective on the content. Without the gracious assistance and wisdom of this
esteemed group, the level of quality achieved in this dissertation would not have been
possible.
I would also like to thank my cohort of scholarly peers for their support of the
“old guy” from Canada, especially Drs. Anne Ottenbreit-Leftwich, Cindy York, Chris
Mong, Jason Lei, and David Huang. A special thank you is reserved for Aggie Ward,
who shepherded me through the doctoral process with kindness and efficiency.

iv
And, lastly, I want to thank my wife, Kim, and our children, Kyra, Tessa, and
Scott for moving to Indiana and sharing in this adventure of a lifetime. When my energy
and confidence waned, their love and support helped propel me through the never-ending
writing weekends and working summers.
v
TABLE OF CONTENTS
Page
LIST OF TABLES ............................................................................................................. ix
LIST OF FIGURES ............................................................................................................ x
ABSTRACT ...................................................................................................................... xii
CHAPTER 1. INTRODUCTION .................................................................................... 1
Stakeholders in Computer Literacy and Software Proficiency Education .................... 2
Computer Literacy Instruction in Higher Education .................................................... 6
Software Instruction and Curriculum Development ..................................................... 7
Statement of the Research Problem ............................................................................ 11
Purpose and Significance of this Study ...................................................................... 12
Research Questions ..................................................................................................... 13
CHAPTER 2. REVIEW OF LITERATURE ................................................................. 15
Computer Literacy as a Research Discipline .............................................................. 15
Defining Computer Literacy ................................................................................. 16
Evaluating Software Skills and Levels of Proficiency ......................................... 19
Computer Literacy Curriculum and Automated Grading Systems ....................... 21
Simulation-Based Tutorials and Automated Grading Systems .................................. 22
Key Characteristics of Simulation-based Tutorials .............................................. 23
Educational Rationale for Simulation-based Tutorials ......................................... 24
Simulation Technology in Blended Learning Environments ................................ 25
Simulation-based Assessments for Software Proficiency ..................................... 26
Automated Grading and Feedback Systems ......................................................... 27
Assessing Computer Literacy Performance, Practices, and Technologies ................. 30
Computer Skill Proficiency................................................................................... 30
vi
Page
Computer Self-Efficacy ........................................................................................ 31
Behavior-based Measures of Technology Acceptance ......................................... 32
Object-based Measures of End-User Satisfaction ................................................. 33
Theoretical Models for Assessing Acceptance of an Educational Technology .......... 34
Theory of Reasoned Action (TRA)....................................................................... 34
Theory of Planned Behavior (TPB) ...................................................................... 35
Technology Acceptance Model (TAM) ................................................................ 36
Unified Theory of Acceptance and Use of Technology (UTAUT) ...................... 37
Wixom and Todd Integrated Research Model ...................................................... 39
Summary of Measures for Technology Acceptance and Usage ........................... 40
Determining Impact of an Educational Technology on the Computer Literacy Course
..................................................................................................................................... 41
Identifying the Theoretical Framework ................................................................ 41
Restating the Significance of this Study ............................................................... 42
CHAPTER 3. METHODOLOGY .................................................................................. 44
Case Study Design ...................................................................................................... 45
Unit of Analysis and Sampling ................................................................................... 46
Document Collection and Analysis ............................................................................ 48
Instructor Observations and Interviews ...................................................................... 50
Role of the Researcher .......................................................................................... 50
Classroom Observations ....................................................................................... 52
Instructor Interviews ............................................................................................. 54
Analysis of Qualitative Data ................................................................................. 55
Trustworthiness and Credibility ............................................................................ 58
Student Acceptance and Satisfaction Survey .............................................................. 60
Defining the Key Constructs ................................................................................. 60
Developing the Survey Instrument ....................................................................... 68
Pre-Testing the Survey Instrument ....................................................................... 70
Delivering the Student Survey .............................................................................. 71
vii
Page
Analysis of Quantitative Data ............................................................................... 72
Validity, Reliability, and Bias ............................................................................... 73
CHAPTER 4. RESULTS ............................................................................................... 77
Document Analysis ..................................................................................................... 77
Analysis of Classroom Observations .......................................................................... 79
Setting and Participants ......................................................................................... 81
Lecture Demonstration and Student Engagement ................................................. 82
Lab Time and Student Productivity ...................................................................... 83
Peer and Instructor Interactions ............................................................................ 84
Summary of Classroom Observations .................................................................. 85
Analysis of Instructor Interviews ................................................................................ 86
Course and Class Preparation ............................................................................... 88
Teaching and Lab Support .................................................................................... 90
Student Learning and Assessment ........................................................................ 92
Information Quality and Satisfaction .................................................................... 94
System Quality and Satisfaction ........................................................................... 95
Perceived Ease of Use and Usefulness ................................................................. 96
Social Influences, Attitudes, and Intentions ......................................................... 98
Summary of the Instructor Interviews ................................................................ 100
Analysis of Student Surveys ..................................................................................... 100
Overview of the Student Survey Results ............................................................ 101
Analysis of Variable Distributions...................................................................... 104
Analysis of Likert-Type Items ............................................................................ 107
Analysis of Likert-Scale Items ............................................................................ 112
Summary of the Student Survey Results ............................................................ 117
CHAPTER 5. DISCUSSION AND CONCLUSIONS ................................................ 119
Application of the Case Study Methodology ............................................................ 120
Discussion of Results ................................................................................................ 122
Research Objectives ............................................................................................ 123
viii
Page
Analytic Generalizations ..................................................................................... 136
Application of the Theoretical Framework ............................................................... 139
Limitations ................................................................................................................ 143
Implications............................................................................................................... 145
Conclusion ................................................................................................................ 147
LIST OF REFERENCES ................................................................................................ 149
APPENDICES ................................................................................................................ 168
Appendix A. BuAd 128 Course Syllabus (Fall 2011) .............................................. 168
Appendix B. Purdue Institutional Research Board Approval ................................... 172
Appendix C. Consent Form for Observation and Personal Interview ...................... 173
Appendix D. Instructor Pre-Interview Survey .......................................................... 175
Appendix E. Instructor Interview Protocol ............................................................... 176
Appendix F. Student Questionnaire Welcome Screen .............................................. 178
Appendix G. Student Survey Items .......................................................................... 179
Appendix H. Student Survey Histograms ................................................................. 182
VITA ............................................................................................................................... 189

ix
LIST OF TABLES
Table .............................................................................................................................. Page
Table 3.1 Embedded Units of Analysis for BuAd 128 (Fall 2011) ................................. 48
Table 4.1 Code Summary for Classroom Observations ................................................... 81
Table 4.2 Structural Code Summary for Instructor Interviews ........................................ 87
Table 4.3 Provisional Code Summary for Instructor Interviews ..................................... 88
Table 4.4 Student Demographic Profile ......................................................................... 101
Table 4.5 Student Distribution by Instructor with Grade Results .................................. 102
Table 4.6 Summary of Descriptive Statistics for Likert-Type Items ............................. 108
Table 4.7 Summary of Descriptive Statistics for Likert-Scale Items ............................ 114
Appendix Table
Table G.1 Survey Constructs and Measurement Items .................................................. 179
x
LIST OF FIGURES
Figure ............................................................................................................................. Page
Figure 2.1. The Theory of Reasoned Action ..................................................................... 35
Figure 2.2. The Theory of Planned Behavior ................................................................... 36
Figure 2.3. The Technology Acceptance Model ............................................................... 37
Figure 2.4. The Unified Theory of Acceptance and Use of Technology Model .............. 38
Figure 2.5. The Integrated Research Model ...................................................................... 40
Figure 3.1. The Adjusted Wixom and Todd Integrated Research Model ......................... 66
Figure 3.2. 2011 MyITLab Grader Assignment Interface for Office 2007. ..................... 76
Figure 3.3. 2016 MyITLab Grader Assignment Interface for Office 2013. ..................... 76
Figure 4.1. The Adjusted Model with Measures of Center and Dispersion ................... 103
Figure 4.2. Satisfaction Boxplots: Information (IS01) and System (SS01) .................... 109
Figure 4.3. Ease-of-Use Boxplots: Usability (EU01) and Learnability (EU02) ............. 110
Figure 4.4. Usefulness Boxplots: Feedback (PE01) and Performance (PE02) ............... 111
Figure 4.5. Intention Boxplots: Continued Use (IU01) and Renewal (IU02) ................. 111
Figure 4.6. Intention Boxplot: Recommendation (IR01) ................................................ 112
Figure 4.7. Quality Boxplots: Information (IQ) and System (SQ) ................................. 115
Figure 4.8. Social Norms (SN) Boxplot .......................................................................... 116
Figure 4.9. Attitude (AT) Boxplot .................................................................................. 117
Figure 5.1. Proposed Modifications to the Adjusted Wixom and Todd Model .............. 142

xi
Appendix Figure Page
Figure A.1. BuAd 128 Course Syllabus (page 1 of 4) .................................................... 168
Figure A.2. BuAd 128 Course Syllabus (page 2 of 4) .................................................... 169
Figure A.3. BuAd 128 Course Syllabus (page 3 of 4) .................................................... 170
Figure A.4. BuAd 128 Course Syllabus (page 4 of 4) .................................................... 171
Figure C.1. Consent Form (page 1 of 2) ......................................................................... 173
Figure C.2. Consent Form (page 2 of 2) ......................................................................... 174
Figure E.1. Interview Protocol (page 1 of 2) .................................................................. 176
Figure E.2. Interview Protocol (page 2 of 2) .................................................................. 177
Figure H.1. Information Quality (IQ) Histogram ........................................................... 182
Figure H.2. Information Satisfaction (IS01) Histogram ................................................. 182
Figure H.3. System Quality (SQ) Histogram .................................................................. 183
Figure H.4. System Satisfaction (SS01) Histogram........................................................ 183
Figure H.5. Usefulness of Feedback (PE01) Histogram ................................................. 184
Figure H.6. Usefulness of Feedback (PE02) Histogram ................................................. 184
Figure H.7. Ease-of-Use for Usability (EU01) Histogram ............................................. 185
Figure H.8. Ease-of-Use for Learnability (EU02) Histogram ........................................ 185
Figure H.9. Social Norms (SN) Histogram ..................................................................... 186
Figure H.10. Attitude (AT) Histogram ........................................................................... 186
Figure H.11. Intention to Use (IU01) Histogram ............................................................ 187
Figure H.12. Intention to Renew (IU02) Histogram ....................................................... 187
Figure H.13. Intention to Recommend (IR01) Histogram .............................................. 188

xii
ABSTRACT
Coulthard, Glen J. Ph.D., Purdue University, December 2016. A Descriptive Case Study:
Investigating the Implementation of Web-based, Automated Grading and Tutorial
Software in a Freshman Computer Literacy Course. Major Professor: Timothy Newby.
Students in higher education require satisfactory computer skills to be successful.
While today’s students may have greater exposure to technology, research shows that
their actual computer knowledge and skills are superficial and narrow. As a result, the
freshman computer literacy course remains an important curricular component. This
study investigates the implementation of an innovative Web-based technology for
delivering software proficiency training for Microsoft Office. Building upon decades of
end-user computing satisfaction and technology acceptance research, the purpose of the
study is to describe the instructor and student experiences that result from the
implementation and use of MyITLab educational software. The nature of the study is
descriptive, rather than evaluative, with the following goals: (a) to describe instructors’
experiences with the software, (b) to identify patterns of technology usage and utility, and
(c) to elucidate levels of computing satisfaction and technology acceptance among users.
The study applies a mixed-method, single-unit, embedded case study design to
focus the inquiry on an introductory computer applications course, offered in the Fall
2011 semester at a college in western Canada. The embedded units consist of five

xiii
instructors, with 322 students enrolled across 10 sections. Data were analyzed from
course documents, classroom observations, instructor interviews, and a student survey
that produced 149 satisfactory responses. The survey was constructed by adapting
instruments based on the Wixom and Todd (2005) integrated research model and the
Unified Theory of Acceptance and Use of Technology (UTAUT) model.
Results of the study are summarized into five assertions: 1) MyITLab effectively
eliminates or, at least, reduces instructor grading workloads for assignments, 2) MyITLab
provides students with frequent corrective feedback on assignments, 3) the step-by-step
presentation of instructions in MyITLab may not solely meet the needs of solution-based
learning outcomes, 4) instructors should be trained on MyITLab to maximize the
software’s utility, and 5) the MyITLab solution bank of acceptable responses should be
expanded to reduce potential grading inaccuracies. An enhanced Wixom and Todd (2005)
model is also presented for future research of educational software. Lastly, the reader is
encouraged to reconsider the information presented and generalize it for their own
purposes.
1
CHAPTER 1. INTRODUCTION
Universities and colleges nationwide currently face a wide discrepancy in the
levels of computing literacy and technical software proficiency possessed by incoming
undergraduate students. While some students' software skills rival (and, sometimes,
exceed) their instructors', other students struggle with the most basic computer tasks
necessary for academic success. Over the past two decades, instructional faculty have
worked collaboratively with educational publishers in order to introduce new
instructional practices and technologies toward helping freshman students improve their
computer literacy. At the same time, institutional and administrative stakeholders
continue to emphasize concerns over program costs, capital budgets regarding computer
labs, and facility utilization (Edmiston & McClelland, 2001). Some institutions have even
considered eliminating introductory computer courses entirely (Ciampa, 2013). In partial
response to these challenges, leading educational publishers of computer and information
technology (CIT) curriculum have been tasked with developing innovative, engaging, and
affordable Web-based teaching and learning solutions. Combining simulation-based,
multimedia tutorials with online content delivery and reporting, these products provide
interactive, self-study lessons aimed at teaching fundamental software proficiency skills
for Microsoft Office applications. While network-driven, simulated tutorials for
Microsoft Office have been available since the late 1990s, a relatively new Web-based
2
technology has been mainstreamed promoting live, in-application assessments for
Microsoft Office, complete with automated grading and feedback. This packaging of in-
application grading, personalized feedback, and simulation-based tutorial software may
offer a pedagogically-sound and cost-effective solution for undergraduate computer
literacy programs.
Stakeholders in Computer Literacy and Software Proficiency Education
Undergraduate courses in computer literacy and software proficiency are typically
grouped under the banner of information and communications technology (ICT)
programming. Primarily offered as a single-semester service course in the freshman year
of a program or discipline, the ICT course is often mandatory and focuses on either
(a) introductory computer and communications technologies, (b) digital information
literacy, related to researching and evaluating on-line content, (c) software proficiency,
including technical skills for Microsoft Office applications, or (d) a combination of the
aforementioned topics. Once the domain of the computer science faculty, most
departments or schools now prefer to design and manage the freshman ICT course
curriculum and delivery themselves. Therefore, a key stakeholder for the ICT computer
literacy course is the department or school that manages the program budget, schedules
and maintains the computer labs, and hires personnel (e.g., instructors, teaching assistants,
and lab monitors.) The primary objective of this stakeholder group, with respect to the
ICT course, is to provide a satisfactory student learning experience, while meeting
departmental, financial, capital, workplace, room capacity, and staffing needs.
Faculty members and adjunct instructional staff comprise another key stakeholder
group. First, faculty members who instruct ICT courses are the technology-savvy
3
instructors within their respective disciplines that appreciate the relationship between
computer literacy, software skills, and academic achievement. While larger schools may
assign full-time faculty to teach undergraduate service courses, smaller institutions often
choose to hire adjunct instructors who may or may not have optimal levels of content
knowledge or teaching experience. In either case, instructors attempt to provide students
with engaging learning environments that foster and support successful outcomes. As
denoted by the term “service course,” other faculty members within a department or
school are significant stakeholders, as they expect specific competency levels in
computer literacy from their incoming students. For this stakeholder group, the desire is
to receive students who possess the technical skills required to achieve academic success
in their particular program area.
Students are the most important stakeholder and the most complex puzzle piece in
planning the ICT freshman-level course curriculum. Ever since Don Tapscott’s (1998)
book entitled, “Growing Up Digital,” there has been much discourse over the types and
technical acumen of students entering higher education. Emphasizing generational
differences, Tapscott (1998, 2009) argues that because the “Net Generation” (students
born in the 1980s and 1990s) has grown up with computers and the Internet, they
naturally possess higher skill levels and aptitude for technology, more so than previous
generations. In support of this viewpoint, Prensky (2001a, 2001b) believes that students
have been radically changed by their exposure to video games, computers, and the
Internet, even to the point where they have been hardwired to “think and process
information fundamentally differently” (p. 1). In addition to presuming that incoming

4
students have higher technical skills, Oblinger and Oblinger (2005) summarize several
key characteristics of what they coin the “millennial” generation, including:
higher comfort levels with multi-tasking, especially when using various forms of
technology,
higher levels of visual literacy than previous generations,
desire for interactivity and fast-paced digital media,
preference for learning-by-doing, rather than being told what to do, and
preference for inductive, discovery learning and the social construction of
knowledge.
Besides offering competing nomenclature to label this generation of students, it
may be important to note that Tapscott (“Net Generation”), Prensky (“digital natives”),
and the Oblingers (“millennials”) also differ slightly on the birth years covered by each
definition. More importantly, however, is the supposition that radical educational reform
is required to best meet the needs of this new digital learner (Prensky, 2001a; Tapscott,
1998). Indeed, the speculations and generalizations attached to this generational discourse
have been accepted as popular truths by many, to the point of informing instructional
design and curriculum development (Reeves & Oh, 2008). Nowhere may these
suppositions be felt more acutely than in the design, budgeting, and delivery of the
freshman-level ICT computer literacy curriculum.
While most researchers agree that today’s students are active users and consumers
of technology and digital media, the generational differences argument suffers from a
lack of substantive research (Bennett, Maton, & Kervin, 2008; Bullen, Morgan, &
Qayyum, 2011; Reeves & Oh, 2008). Furthermore, Kennedy, Judd, Churchward, Gray,
5
and Krause (2008) found significant diversity among first-year students when it came to
access, use, ability, and preferences for technology. Jones, Ramanau, Cross, and Healing
(2010) found similar variations among students, describing the incoming student body as
made up of “complex minorities” that do not align with the commonalities and
homogeneity predicted by Net Generation literature. In a Canadian study, Bullen, Morgan,
and Qayyum (2011) revealed no empirically-sound basis for most of the digital native
claims and no meaningful differences between Net Generation and non-Net Generation
students. Even Oblinger and Oblinger (2005) admit that the technological sophistication
of today’s Net Generation students may be somewhat superficial and concede that “age
may be less important than exposure to technology” (p. 2.9).
With respect to ICT computer literacy courses, instructional designers and
curriculum developers must be aware of the trends impacting their audience, but should
not make the mistake of applying such generalizations to an entire generation. The higher
frequency of technology use among today’s students does not necessarily translate into
higher or more comprehensive and diverse technical skills (Eichelberger & Imler, 2015;
Jones et al., 2010). In fact, many researchers over the past decade have found that
undergraduate students possess only basic computing literacy and technology skills, even
though they are frequent users of email, Web browsing, and mobile devices (Gharawi &
Khoja, 2015; Grant, Malloy, & Murphy, 2009; Hanson, Kilcoyne, Perez-Mira, Hanson, &
Champion, 2011; Kennedy et al., 2008; Kvavkik & Caruso, 2005; Rondeau & Li, 2009).
In the most recent ECAR study of undergraduate students and information technology,
the researchers found that, while technology may now be embedded into students’ lives,
they are not any more (or less) capable of using and applying technology in academia
6
than students from a few years ago (Dahlstrom, Brooks, Grajek, & Reeves, 2015). The
study also noted that at least one third of the students “wished they were better prepared
to use basic software and applications” (2015, p. 10). Furthermore, while this discussion
focuses on students born within the past two decades, universities and colleges are
experiencing a growing number of non-traditional students (i.e., mature students)
enrolling in first-year classes, which magnifies the diversity within the computer literacy
classroom even further. To summarize, computer literacy courses must serve the needs of
a diverse student population with varying levels of software proficiency, rather than
hoping to cater to a homogeneous generation of multi-tasking, computer literate, and
technically competent students.
Computer Literacy Instruction in Higher Education
Without question, computer literacy instruction has been and continues to be a
fundamental part of the undergraduate curriculum. Andrew Molnar is credited with
coining the term “computer literacy” almost forty years ago, when he served as the
director of the Office of Computing Activities at the National Science Foundation (Gupta,
2006). More recently, Gupta (2006) defines computer literacy as
an individual’s ability to operate a computer system, have basic understanding of
the operating system to save, copy, delete, open, print documents, format a disk,
use computer applications software to perform personal or job-related tasks, use
Web browsers and search engines on the Internet to retrieve needed information
and communicate with others by sending and receiving email (p. 115).
Students’ academic success relies on being able to apply technical knowledge and
to perform computer tasks related to their major discipline of study (Grenci, 2013; Gupta,

7
2006). In his comprehensive investigation of computer literacy in higher education,
Epperson’s (2010) study noted a movement away from such computer-centric skills
toward digital literacy topics, including personal on-line privacy, data security, and
digital copyright. Similarly, Hoffman and Vance (2008) have stressed the importance of
teaching critical thinking skills and informing students about what technology enables, as
opposed to focusing on the performance skills or the technology itself. While these topics
are important for information literacy, other researchers remind us that one of the key
roles of the computer literacy service course is to meet the needs of other stakeholders by
ensuring that outgoing students have the prerequisite skills in selected software
applications (Barrera, 2013; Dednam, 2009; Grenci, 2013). The apparent divide between
information literacy and specific software proficiency necessitates flexibility in the
instructional design, development, and delivery of the ICT course curriculum.
Software Instruction and Curriculum Development
Since the first introduction of the personal computer in the early 1980s, there has
existed a need for computer software instruction. Not many industries have experienced
the rapidity of research, development, and growth that hardware and software companies
both celebrated and despaired over in the past few decades. What has remained constant
is the relentless frequency of software updates, along with ever-increasing feature-sets.
While the level of demand for software instruction may have diminished with people’s
increased exposure to computers, the need for instruction remains, especially if users
wish to move beyond the most basic levels of software functionality. While no studies
were identified that specify a percentage of features accessed by people in their everyday
use of application software, some interesting discussions were retrieved from the

8
Quora.com discussion website. Specifically, in response to a May, 2011 question, “Do
people know how to use Microsoft Office?” Tara Cain, a software trainer in the legal
industry, responds:
Many people have been using Microsoft Office for years and think they have a
high level of proficiency when in reality they use just a few basic functions. I
don’t think that people are, for the most part, deliberately misrepresenting their
skill level but they often don’t know that they are missing out on the most helpful
parts of the software (Quora website, 2011).
Garrick Saito offers “I’ve been using Excel for over ten years. I consider myself
to be an advanced user, but if someone asks me what percentage of its power I
understand, I would answer 10% (i.e., the more you know, the more you realize how little
you know)” (2011). Although anecdotal, these statements ring true for many computer
users. In order to effectively access and use the software functionality required for most
academic programs (as well as in the workplace), students require assistance and support
in learning software applications such as Microsoft’s Word, Excel, and PowerPoint
(Eichelberger & Imler, 2015).
From the mid-1980s to the mid-1990s, software instruction in higher education
largely assumed the traditional lecture plus lab format. In the lecture hall, the instructor
would demonstrate the software features and capabilities to be covered that week and
then send students to the computer lab in order to complete hands-on exercises, with or
without the guidance of a teaching assistant. While some instructors preferred to create
their own handouts, educational publishers supplied most of the curriculum materials for
lesson content, practice exercises, and summative assessments. By the late 1990s and
9
early 2000s, the enrollment in computer literacy courses had increased significantly and
faculty were having trouble keeping up with manually grading hundreds of students’
submissions across numerous sections. Because the majority of students did not have
access to mobile computing technology, large capital investments were needed for the
expansion and staffing of on-campus computer labs (Jake Block, personal
communication, 2012).
In 1997, Course Technology introduced SAM (an acronym for Skills Assessment
Manager), the first simulation-based Microsoft Office tutorial and assessment software
product. Installed locally on the computer’s hard disk or on the school’s local area
network server, SAM offered students the ability to work safely within a confined
simulated environment in performing step-by-step software tasks. Arguably, the most
important features in this product were the automated assessments and gradebook
management tools. Unfortunately, the heralded time-savings and grading efficiencies
promised by SAM were quickly eroded amid reports of mis-graded assignments, network
crashes, and general software instability. Early-adopting faculty members experienced
their in-class role switching from instruction to technical support and subsequent
adoption of the technology slowed dramatically. Sensing a competitive opportunity, other
educational publishers developed and introduced their own products to a skeptical
marketplace over the next several years – SimNet by McGraw-Hill Higher Education,
Train & Assess IT (TAIT) by Prentice Hall, and, lastly, MyITLab by Pearson Education.
By the mid-2000s, these simulation-based tutorials and task-based assessments had
matured greatly, capitalizing on Web-based connectivity for content delivery and full
integration with campus learning management systems (LMSs). With efficiencies finally

10
being realized from the software, along with declining and more manageable enrollment
levels in the mid-2000s, the typical class structure also began to move from the lecture
plus lab format to one or two computer lab meetings per week, focused mainly on gaining
hands-on software proficiency in Microsoft Office applications.
After a few years of experience with these simulation products, instructors and
students began to question the value of the prescriptive and somewhat superficial step-by-
step tutorial and grading approach. Was the software truly teaching and assessing
students’ software proficiency or simply supporting and evaluating their ability to follow
directions? Once again, educational publishers moved quickly to retain market share by
developing a more realistic “live” or “in application” assessment tool. This innovative
technology built upon the Web-based administrative and content delivery network
already established, but allowed students to prepare a contextualized response to an
exercise using a local and live session of Microsoft’s Word, Excel, PowerPoint, or
Access. Rather than grading each individual step, the new technology promised to grade
project outcomes (in this case, an entire document.) Furthermore, this “live” functionality
allowed students to search through menus and ribbon controls (as they would in a real
world context) to find what they needed, without being penalized for selecting incorrect
options. Since the outcome or result was graded rather than the individual steps taken, it
was presumed that students would feel more comfortable to explore program features and
apply their favorite methods (e.g., keyboard or menu) to perform tasks. Unfortunately,
like SAM’s initial introduction, the new live technology was plagued by errors, a limited
choice of gradable exercises, and various technical issues (Scott Davidson, personal
communication, 2012). By 2010, however, each of the major educational publishers had

11
re-introduced an in-application, automated grading and simulated tutorial solution, and
started the journey of winning back favor from faculty and students. According to
company publishing representatives at McGraw-Hill Higher Education, many schools
continue to patiently evaluate these innovative products on the sidelines, trying to
determine their potential impact on current course offerings and faculty workloads (Scott
Davidson, personal communication, 2012).
Statement of the Research Problem
More than ever before, students require adequate computer skills in order to be
successful in their undergraduate programs and in their careers (Eichelberger & Imler,
2015; Gupta, 2006). While today’s traditional college student may have spent more time
working on computers than any previous generation, their actual computer knowledge
and skills seem to be both superficial and narrow in scope (Creighton, Kilcoyne, Tarver,
& Wright, 2006; Dednam, 2009; Gharawi & Khoja, 2015; Grant et al., 2009; Hanson et
al., 2011; Hardy, Heeler, & Brooks, 2006; Rondeau & Li, 2009; Wallace & Clariana,
2005). In other words, their time spent surfing the Internet and participating on social
media sites does not necessarily translate into the computer literacy skills required for
academic or workplace success.
Microsoft Office remains the most popular software application used in both
higher education and business. To become successful undergraduate students and future
employees, freshman students need to improve upon their entry-level computer literacy
skills, and gaining software proficiency through instruction in Microsoft Office is an
optimal starting point. While introductory lab-based computer classes have existed for
decades, the emergence of Web-based, automated grading and tutorial software for
12
Microsoft Office is a relatively new phenomenon. The effectiveness and efficiency of
these products has not been rigorously examined (Varank, 2006). Furthermore, the
impact that these innovative educational products have on the design and delivery of
curriculum in traditional classrooms is not well documented. Toward filling this gap in
literature, this case study will pursue the following goals: (a) to describe how faculty may
use Web-based automated grading and tutorial software within a traditional computer
literacy classroom, (b) to identify the opportunities, challenges, and experiences
perceived by faculty in implementing automated grading and tutorial software within the
computer literacy course context, and (c) to determine the levels of technology
acceptance and satisfaction experienced by students with respect to using automated
grading and tutorial software for Microsoft Office.
Purpose and Significance of this Study
The purpose of this study is to provide insight into the impact on teaching and
learning that results from the implementation of Web-based, automated grading and
tutorial software. The research focusses on describing the perceived experiences of
faculty and students with this innovative technology within the context of a freshman
computer literacy course. It is important to note that the purpose of this study is not to
evaluate the technology, faculty, or students. Rather, the goal is to describe users'
experiences with the technology, to elucidate levels of usefulness and satisfaction, to
determine patterns of usage, and to generate insights that may be used to direct
instructional design, curriculum development, implementation planning, and the
development of evaluation instruments and strategies for future computer literacy courses.
13
The significance of this research is that it informs administrators, faculty members,
instructors, curriculum developers, and instructional designers of the perceived benefits,
challenges, and experiences related to adopting automated grading and tutorial software
for Microsoft Office. By contributing to stakeholders’ knowledge and understanding in
this area, future implementation and evaluation plans may be impacted positively. To
summarize, this study builds upon decades of technology acceptance and evaluation
research in the investigation of an innovative Web-based, educational technology, within
the important and unique context of a freshman computer literacy course.
Research Questions
The primary research question reads: How has the implementation and use of
Web based, automated grading and tutorial software for Microsoft Office impacted the
freshman computer literacy course? Specifically, the following research objectives will
be achieved:
1. To describe the ways in which instructors are incorporating automated grading
and tutorial software into their computer literacy classrooms.
2. To identify the perceptual gaps between instructors' expectations and in-class
experiences using automated grading and tutorial software.
3. To identify the opportunities and barriers perceived by instructors with respect to
the continued use of automated grading and tutorial software.
4. To describe students’ perceptions of system quality, feedback information quality,
and overall satisfaction level with the automated grading and tutorial software.
5. To describe students’ perceptions of usability, usefulness, and overall attitude
toward the automated grading and tutorial software.
14
Each of these objectives speaks to the purpose of the research by providing contextual
insight, as well as responding to the research problem and goal statements for informing
future implementation initiatives and designing more applicable evaluative models.

15
CHAPTER 2. REVIEW OF LITERATURE
A review of past research for college-level computer literacy courses and web-
based automated grading and tutorial systems elicited several key areas for investigation
and discussion. First, this literature review begins by formulating a comprehensive, yet
finite, definition of computer literacy, and then proceeds to assess the past and current
state of research for computer literacy training in higher education. Focusing on software
skill proficiency, research into simulation-based tutorials and automated grading systems
is summarized with respect to blended instructional practices and automated feedback.
Next, key metrics and constructs referenced in computer literacy research are defined,
including computer skill proficiency, computer self-efficacy, perceived usefulness,
perceived ease-of-use, and end-user satisfaction. In order to evaluate the strengths and
weaknesses of potential measurement instruments, several theoretical models for
technology acceptance and user satisfaction are described that may be used to assess
impact for web-based, automated grading and tutorial systems. Concluding the chapter, a
theoretical framework is selected and then linked back to the current research question
and study objectives.
Computer Literacy as a Research Discipline
Research into computer literacy education stems back nearly four decades, shortly after
Andrew Molnar first used the term “computer literacy” in 1972 (Gupta, 2006). Epperson

16
(2010) noted in his comprehensive literature review that most of the computer literacy
research occurred prior to 2000, with less than a dozen studies being submitted to the
Association for Computing Machinery (ACM) Digital Library in the past decade. Of the
770 articles that Epperson identified using the keywords “computer literacy in higher
education,” the majority of studies centered on computer literacy definitions, skill and
competency requirements, and descriptions of course revisions (2010). A further review
of research studies from sources outside of the ACM Digital Library mirrors these
findings and, as a result, will serve as a classification framework for discussing computer
literacy as a research discipline.
Defining Computer Literacy
Two distinct approaches for defining computer literacy appear in research. The
first approach is to focus on the effective and efficient operation of a personal computer
or mobile computing device; that is, the proficient use of hardware technology and
software applications. This performance-centered or skills-based approach typically
reveals a definition of computer literacy that emphasizes action-oriented verbs and
product-oriented outcomes, such as “to create a newsletter” or “to construct a cash-flow
budget.” Gupta’s (2006) definition provides an excellent example: Computer literacy
refers to “an individual’s ability to operate a computer system, … print documents,
format disks, and use computer applications software…” (Gupta, 2006, p. 115). In fact,
the terms “computer literacy” and “computer proficiency” are often used interchangeably
to refer to students’ knowledge and ability to use specific computer applications (Grant et
al., 2009).
17
A second approach to defining computer literacy is to focus on understanding
how computer technology and digital media affects one’s life, career, society, and the
world. Distinct from the skills-based approach, this philosophical tact emphasizes higher-
order, critical thinking skills (e.g., assessment of digital media and Internet-based
content), problem-solving capabilities (e.g., technology’s role in personal privacy and
security), and socio-cultural awareness of the impact that computer technology has on
society and the globe (e.g., social media and groundswell journalism) (Bartholomew,
2004; Hoffman & Vance, 2005; Venables & Tan, 2009). Banerjee and Kawash (2009)
argue that it is “no longer acceptable to consider computer literacy in post-secondary
education as merely knowing how to use a computer” (p. 1). Instead, the researchers
believe that the term “computer literacy” embodies a “style of thinking,” learning, and
living (2009, p. 1). Other researchers similarly extend the definition beyond the basics of
hardware terminology or the use of software applications to encompass computer fluency
and information literacy (Hoffman & Blake, 2003; Hoffman & Vance, 2005; Kalman &
Ellis, 2007). According to the National Research Council (NRC), a person with computer
fluency possesses contemporary skills in information technology (IT) applications, a
sound understanding of foundational IT concepts, and the intellectual capabilities for
reasoning and problem solving IT issues (Hoffman & Blake, 2003).
Just as Bloom’s Taxonomy (Bloom, Engelhart, Furst, Hill, & Krathwohl, 1956)
differentiates between cognitive learning at the lower levels (e.g., Knowledge and
Comprehension) versus the higher levels (e.g., Application through Evaluation),
computer literacy definitions emphasize either lower-level skill proficiencies or higher-
order critical thinking skills. This particular study is interested in assessing the impact of
18
an educational technology on students’ learning and mastery of specific software skills.
Targeted at the lower levels of Bloom’s Taxonomy (1956), computer literacy in this
context emphasizes software proficiency more so than computer fluency and information
literacy.
For the purposes of this study, computer literacy is defined as an understanding
and appreciation of personal computer hardware, software, and communications
technologies, along with specific skill proficiency in a variety of software applications,
toward the productive use of such technologies within home, academic, and workplace
settings. Regardless of the type of operating system software or physical form of the
hardware device (e.g., smartphone, tablet, laptop, or desktop computer), a computer
literate individual is able to copy, move, delete, and otherwise manage their digital files,
whether stored locally, on a private network, or on the Internet using cloud-based
applications. They are competent users of productivity software applications for word
processing, analyzing spreadsheet data, and preparing presentations. They are also
competent users of Internet-based tools for information retrieval, communication, and
publishing, including Web browsers, email clients, and communications software. Lastly,
they are technically savvy users who understand the dangers of malware, social
engineering, hacking, and other security threats, especially when participating on the
Internet. Computer literate users, in summary, are able to safely, efficiently, and
effectively use a variety of hardware devices, software applications, and communications
technologies to get stuff done.

19
Evaluating Software Skills and Levels of Proficiency
In order to design an effective, goal-oriented curriculum for computer literacy
training, educators must first identify the knowledge, skills, attitudes, and abilities
already possessed by their prospective audience (Smith & Ragan, 2005). In fact, one of
the most commonly asked questions in computer literacy research seems to be whether
such a course is truly necessary, given students’ ever-increasing exposure to and
ownership of technology at younger ages (Ciampa, 2013; Courier & Papp, 2005; Dednam,
2009). To this point, much of computer literacy research focuses on assessing incoming
students with respect to their familiarity and competency in using various hardware and
software technologies. Two key assertions may be gleaned from this well-researched area:
first, students’ experience with and knowledge of technology varies greatly and, second,
students’ increased exposure to technology does not necessarily translate into increased
computer knowledge or skill proficiency (Jones et al., 2010; Kennedy et al., 2008;
Kvavik & Caruso, 2005; Murray, Hooper, & Perez, 2007; Rondeau & Li, 2009). Students
may believe themselves to be above and beyond the freshman-level computer literacy
course, but the research proves otherwise (Creighton et al., 2006; Grant et al., 2009;
Hanson et al., 2011; Jones et al., 2010; Wallace & Clariana, 2005). Several studies report
that while freshman students possess basic skills in the areas of word processing, email,
social media, and Web surfing, they lack the breadth and depth of software skills
necessary to succeed in their academic programs or in the workplace (Courier & Papp,
2005; Creighton et al., 2006; Dednam, 2009; Eichelberger & Imler, 2015). In her study of
1310 students, Dednam (2009) explains that any increases in practical computer
experience seem to relate more to “passive Internet use” rather than the active or creative

20
use of common software applications (p. 26). Similarly, Hoffman and Blake (2003) found
that students “come to us as simple consumers” of technology, and are unable to take
advantage of the production opportunities it affords (p. 222). In their workforce readiness
study, Kaminski, Switzer, and Gloeckner (2009) felt that students’ computer fluency and
understanding of technology was disappointing and that students were ill-prepared for
their careers. In her recent dissertation, Stewart (2016) reported that students’ computer
self-efficacy was much greater than their actual knowledge and computer literacy, and
concluded that students are not entering college with the needed foundational computer
skills. From these studies, it seems apparent that the freshman-level computer literacy
course remains an important curricular component in fostering academic success and
preparing students for their workplace careers.
Research over the past decade shows clearly that the majority of freshman
students are not computer literate or proficient in the use of productivity software
applications. In the Hardy, Heeler, and Brooks (2006) study, incoming students were pre-
tested on the fundamentals of using Microsoft Office application software. Application
results were 64.68% for word processing, 47.5% in spreadsheet use, 68.15% for
presentation software, and 42.88% in database management, with an overall mean score
of 55.81% (2006). Given that greater than 60% was deemed necessary to show
proficiency and greater than 80% was required to show mastery, the results were clear in
demonstrating the need for additional training. The Grant, Malloy, and Murphy (2009)
study reveals similar results with students achieving 85% when performing basic
Microsoft Word tasks, but 54% for intermediate-level and 4% for advanced-level tasks.
In Excel, the results were 38%, 17%, and 2% for basic, intermediate, and advanced-level
21
tasks, respectively. More recently, Gharawi and Khoja (2015) reported that students’ self-
reported efficacy scores for Word and Excel were 75.6% and 50.2% respectively, yet
their actual test scores were 44.7% and 21.8%, clearly showing that students do not know
what they do not know. Although specific to one’s academic program, post-graduate
studies also report the need for student proficiency in the use of Microsoft Office
applications throughout their academic program (Courier & Papp, 2005; Gupta, 2006)
and workplace careers (Kaminski et al., 2009). Therefore, not only is the freshman
computer literacy service course necessary, but research demonstrates the need for
specific software training in the use of Microsoft Office applications as an important
curricular component across academia.
Computer Literacy Curriculum and Automated Grading Systems
Given the skill-level diversity among freshmen students and the constantly
changing technology landscape, designing curriculum to meet the demand for computer
literacy training is like throwing darts at a moving target. Hoffman and Vance (2005)
argued that the pace of change had been so rapid in this area that survey results from
previous years were of little value in supporting future curricular changes, and
emphasized the need for ongoing research. Consequently, a common research emphasis
in computer literacy education is the comparative assessment of alternative content and
delivery mechanisms, as well as instructional pedagogical practices and technologies
(Edmiston & McClelland, 2001; Hasan & Ali, 2004; Hoffman & Blake, 2003; Johnson,
Bartholomew, & Miller, 2006; Kalman & Ellis, 2007; Martin & Dunsworth, 2007; Palvia
& Palvia, 2007). Another research emphasis focuses on the use of computer-based and
web-based instruction, along with interactive practice activities, as effective methods for
22
teaching computer literacy (Martin, Klein & Sullivan, 2007). Lee, Shen, and Tsai (2010)
used web-mediated feedback in a blended learning environment to help students achieve
a higher pass rate than traditional students on industry standard software certification
exams. Other researchers have incorporated simulation-based software tutorials and
automated proficiency exams in the classroom with mixed results (Bretz & Johnson,
2000; Murray et al., 2007; Rondeau & Li, 2009; Tesch, Murphy, & Crable, 2006; Varank,
2006). Two common themes are present across these studies: first, there is a need for
ongoing research into instructional practices and innovative technologies for computer
literacy education and, second, there is a need to keep the computer literacy curriculum
current and stakeholder-focused, in order to meet the changing demands of academia and
the workplace.
Simulation-Based Tutorials and Automated Grading Systems
As in other disciplines, there has been a continuous stream of innovative
instructional practices and Web-based technologies deployed over the past two decades
for computer literacy and application software training in higher education. The first
simulation-based Microsoft Office tutorial and assessment software products arrived on
campuses in the late 1990s; although widespread adoption of these technologies in North
America did not take place until the mid-2000s (Scott Davidson, personal communication,
2012). Each of the major educational publishers currently offers a simulation-based
technology solution for Microsoft Office training and assessment, targeted at freshman-
level computer literacy courses. Pearson Education, the educational technology leader in
this area, offers the MyITLab software product (http://www.MyITLab.com/); McGraw-
Hill Higher Education provides SimNet (http://successinhighered.com/cit/simnet/); and
23
Course Technology markets SAM – the Skills Assessment Manager
(http://www.cengage.com/sam/). This section summarizes relevant research in the field of
simulation-based tutorial, practice, and assessment software, with a focus on blending
Web-based technology learning solutions into the traditional freshman-level computer
literacy course.
Key Characteristics of Simulation-based Tutorials
A simulation is a “special kind of model, representing a real system” (Crookall,
Oxford, & Saunders, 1987). A Web-based, computer simulation is an executable program
accessed through the browser that stores, processes, and delivers this model in the form
of a dynamic system or interactive process (de Jong & van Joolingen, 1998). For
simulation-based software tutorials, such as MyITLab and SimNet, learners are guided
through a replication of an application program’s real environment and directed to
perform tasks, whilst being provided with supporting resources and feedback along the
way. Gatto (1993) labels this type of instructional activity a “procedural simulation,”
whereby learners recall, perform, and practice a series or sequence of pre-determined
actions within a manufactured environment. Simulation-based software tutorials for
Microsoft Office provide learners with an opportunity to interact with and “try out” the
application programs from any location with Internet connectivity, without having the
physical limitations or restrictions of having to purchase or install the real software on
their own computers. This educational technology provides high-levels of user
interactivity, automation, and remedial feedback – all key aspects in learning a rules-
based software system (Dipietro, Ferdig, Boyer, & Black, 2007; Kirriemuir & McFarlane,
2004). Furthermore, simulation technology provides learners with the opportunity to
24
safely manipulate and explore application software programs without fear or
consequences of ruining the system or losing precious data (Aldrich, 2005).
Educational Rationale for Simulation-based Tutorials
The traditional instructor-centered transmission model for teaching computer
literacy through lecture and demonstration faces many challenges. According to Ruben
(1999), there are several key limitations of the instructor-centered paradigm, including:
(a) the implication that teaching and learning are inseparably linked activities – that one
cannot exist without the other, (b) the belief that the ultimate test of knowledge and skill
is in the reproduction of content and processes, rather than the application and transfer of
knowledge into performance, (c) the reliance on an expert’s transmission of knowledge to
novice-students, rather than fostering a social, collaborative, peer-based supportive
environment, (d) too much rigidity and emphasis on intentional, fact-based learning,
rather than unintentional, exploratory, and informal processes, and (e) the fact that
traditional show-and-tell lecture practices are boring. The inadequacies of the traditional
information-transfer approach seem to be amplified in the computer literacy classroom,
where students expect to use the technology in hands-on situations, confer with and assist
their peers, and to learn-by-doing with time-on-task practice activities. Balasubramanian
and Wilson (2005) support this viewpoint; writing that today’s students are “cognitively
more sophisticated and want learning to be fun, engaging, hands-on, challenging,
interactive, empowering, and thought provoking” (p. 1). Students crave learning
opportunities to create and do, rather than passively watch and listen. They crave
interaction and personalization; they are highly visual and adverse to reading (Aldrich,
2005). The need to move away from the traditional lecture-demonstrate model for

25
computer literacy training has never been so clear, as with this generation of learners.
Fortunately, simulation-based tutorials can provide flexibly adaptive learning for all types
of learners, and support various levels of competency in using Microsoft Office software.
Simulation Technology in Blended Learning Environments
Along with the benefits of appealing to today’s learners, there exist several
practical reasons for implementing Web-based software simulations into higher-
education learning environments (Aldrich, 2005; de Jong, 1991; Gatto, 1993), including:
simulations may be less expensive than alternative strategies, as is often the case
in large service-oriented freshman courses.
simulations may be safer and less risky than working with real-world data in
actual software programs.
simulations can be less stress-invoking, by allowing learners to focus on their
exploration and learning rather than real-life consequences.
simulations can present career-focused product outcomes and case-based
scenarios that learners would be unable or unlikely to experience directly at their
current level of knowledge, skill, or ability.
simulations can adjust (speed up or slow down) the time-scale and automate
intermediate steps so that learners can better visualize the progression from the
starting point to the final outcome.
simulations can highlight the intent of an instructional interaction, removing other
distractions and technical complexities.
26
simulations can provide instructional scaffolding, especially in terms of
personalized feedback and supporting materials, which may not be available or
readily accessible in the real world.
To take advantage of these potential benefits, simulation-based software tutorials should
be incorporated into the curriculum wisely, following proven strategies and guidelines
gleaned from blended learning research (Bonk & Graham, 2006). Akilli (2007) reminds
us that the “relative ineffectiveness of instructional technology thus far has been caused
by the application of the same old methods in new educational media” (p. 2). Fortunately,
there are well-documented principles for designing effective blended learning
environments that combine classroom instructional practices with computer-mediated and
online instructional elements (Boettcher, 2007; Bonk & Graham, 2006; de Jong & van
Joolingen, 1998; Herrington & Oliver, 1999).
Simulation-based Assessments for Software Proficiency
An integral component of the simulation-based software tutorial solution is the
assessment and grading system. Currently, simulation-based products provide two
separate approaches to evaluating learner proficiency in using Microsoft Office software.
First, learners may be assessed by performing tasks within the same simulated
environment as provided by the tutorial lesson component. In this component, learners
are directed to perform step-by-step tasks within a confined software environment and
then provided with a summary report of their results, as well as an optional feedback
report and recommended remedial lesson path. A second approach is to allow learners to
perform tasks within a live software application, in which they follow outcome-focused
directions and then upload their work for assessment into an automated grading system.
27
The live or in-application approach provides a real-life contextual evaluation of a
learner’s proficiency, with the same reporting and feedback options offered by the
simulated assessment. While simulation-based assessments for software training have
been well-studied over the past decade to measure students’ proficiency using Microsoft
Office (Grant et al., 2009; Murray et al., 2007; Rondeau & Li, 2009; Tesch et al., 2006),
the live or in-application assessment approach is relatively new.
Automated Grading and Feedback Systems
Because of the technical constraints, Web-based automated grading for computer
software training has been challenging for both educational publishers and academic
institutions. However, computer-based automated testing in the traditional sense has been
implemented in other program areas over the past few decades. For the most part,
computer-based testing has been found to give similar outcomes to conventional, written
tests (Zandvliet & Farragher, 1997). Such automated testing systems may be classified as
diagnostic, formative, or summative (Jenkins, 2004). Simulation-based software
proficiency exams, for example, would be diagnostic when used to ascertain the skill
level of incoming freshman students. These same exams would be classified as formative
when used during in-class practice exercises, and summative when used for final course
grades. Jenkins (2004) reports on several advantages of computer-based automated
grading systems, which include: repeatability, immediacy of feedback to students,
immediacy of feedback to faculty, reliability and equitability, timeliness, student
motivation, and flexibility of access. These advantages are increasingly important given
students’ desire to receive more detailed feedback, faster and more personalized than ever
before (Peat & Franklin, 2002). As noted by Chickering and Gamson (1987), students

28
need appropriate and timely feedback on their performance in order to self-assess their
knowledge and competence. Automated grading and feedback systems can provide more
consistent, helpful, constructive, and frequent feedback than is possible manually
(Debuse, Lawley, & Shibl, 2007). In a follow-up study, Debuse, Lawley, and Shibl (2008)
found that automated feedback systems also had a positive impact on instructors’
workload, costs, and time requirements, and that instructors were highly satisfied and
intended to continue using their automated grading and feedback system.
Feedback plays an important role in assessment and teaching (Mory, 2004) with
many learning theorists positing that it is essential to students’ learning (Driscoll, 2005).
Higgins, Hartley, and Skelton (2002) noted that timely and high-quality feedback helped
students become actively engaged in the content, as well as in the learning environment
itself. As mentioned previously, one of the primary advantages of using a Web-based,
automated grading system is the ability to provide immediate feedback for individual
student responses. In addition to helping learners identify errors, assessment and
feedback systems also provide a significant factor in motivating further learning (Mason
& Bruning, 2001; Mory, 2004; Narciss & Huth, 2004). Specifically, effective feedback
provides verification that the learner knows how to perform a task correctly, along with
explanation or elaboration details that guide the learner to the resources necessary for
correcting their behavior (Kulhavy & Stock, 1989; Shute, 2008). For both formative (i.e.,
lesson practice) and summative (i.e., exam) assessments in simulation-based grading and
tutorial software systems, the majority of feedback is also topic-contingent, directing (or
linking) the learner back to remedial lessons for more practice.

29
While Azvedo and Bernard (1995) demonstrated in their meta-analysis of
computer-based feedback that achievement levels were greater for students receiving
feedback, it is the individual student’s motivation to actually utilize the feedback system
that becomes the critical determining factor (Morrison, Ross, Gopalakrishnan, & Casey,
1995). Kulhavy and Stock (1989) feel that the greater the difference between a student’s
self-efficacy and actual performance, the higher their motivation to actively utilize and
process the feedback. Morrison et al. (1995) found that students’ motivation to utilize
feedback for increased learning was greater with performance-based incentives (e.g.,
grades) over task-based incentives (e.g., course credit). However, Shute (2008) cautions
that feedback research remains a controversial and imperfect science and that several
studies (Bangert-Drowns, Kulik, Kulik, & Morgan, 1991; Mory, 2004) have reported that
“feedback has either no effect or debilitating effects on learning” (Shute, 2008, p. 156).
One of the reasons for this inconsistency posits Shute (2008) is that the effects of
feedback may be a “function of individual differences among motivational prerequisites”
(p. 176). While self-regulated learners have the ability to be metacognitively,
motivationally, and behaviorally active in their own learning (Zimmerman, 1990), other
students may lack the skills necessary to apply self-regulated learning strategies or utilize
the feedback provided in a learner-controlled, blended environment. Therefore, in
assessing automated grading and tutorial software systems, it may be important to
elucidate the role that students’ perceptions, motivations, self-efficacy, and self-
regulative abilities play in the adoption and use of the educational technology.
30
Assessing Computer Literacy Performance, Practices, and Technologies
Another interesting aspect of computer literacy research involves the
methodologies and instruments used to measure technical skills and competencies. In
several computer literacy research studies, results are obtained either by surveying a
convenient sample of students within pre-existing classes or by introducing a new
instructional practice or simulation-based technology and then comparing summative
examination grades to previous classes. This section reviews and describes some of the
common constructs measured in the study of information technology, information
systems, computer literacy, and application software training.
Computer Skill Proficiency
Many higher-education programs assess incoming students’ computer proficiency
using a self-evaluation survey of their expertise with various technologies, including
email, Web browsing, computer graphics, and office productivity software (Ciampa,
2013; Courier & Papp, 2005; Gharawi & Khoja, 2015; Goodfellow & Wade, 2007; Grant
et al., 2009; Gupta, 2006; Hoffman & Vance, 2005; Hanson et al., 2011; Perez, Murray,
& Myers, 2007). Other programs use hands-on, simulation-based assessment tools to
determine incoming students’ skill proficiency with specific applications, such as
Microsoft’s Word and Excel (Rondeau & Li, 2009; Tesch et al., 2006; Wallace &
Clariana, 2005). While self-evaluation surveys seem to be non-standardized and program-
specific, the hands-on, computer-based assessments are more structured but, arguably,
confined by the questions available in the simulation-based software. In other words,
educational publishers determine and create the questions that are stored in the software
assessment tools, and then instructors select the desired items to present to students from
31
the pool of available questions. In a personal communication (September, 2011) with
Scott Davidson, the publisher of McGraw-Hill’s SimNet product, the test bank of skill
proficiency questions for their simulation software is developed using the Microsoft
Office Specialist (MOS) certification guidelines. Both the core- and expert-level
guidelines for MOS certification in Microsoft Word, Microsoft Excel, and Microsoft
PowerPoint are available online at http://www.certiport.com/ (Certiport Inc., 2012). The
majority of universities and colleges providing a freshman-level computer literacy course
require that tutorial and assessment content be provided for at least the core-level
certification objectives in Microsoft Office (Scott Davidson, email communication, 2011).
Computer Self-Efficacy
The pervasive use of self-evaluation for determining students’ level of computer
literacy and software proficiency requires further discussion. These surveys require
individuals to self-assess their knowledge and skill in using computer hardware and
software toward achieving a goal (e.g., performing a mail merge); measuring a construct
known as computer self-efficacy (Compeau & Higgins, 1995). Derived from the self-
efficacy research of Albert Bandura (1977, 1993), computer self-efficacy represents “an
individual’s perceptions of his or her ability to use computers in the accomplishment of a
task…” and has been identified as a key motivational construct in terms of technology
adoption and computer use (1995, p. 191). Karsten and Schmidt (2008) studied incoming
business students’ computer self-efficacy between 1996 and 2006 and found that,
although students’ experience with technology had increased greatly, their computer self-
efficacy scores had actually decreased. The researchers cautioned that computer self-
efficacy is a “domain-specific, dynamic construct that changes over time” and that it is

32
the “kind of experience, and not computer experience per se, that influences self-efficacy
perceptions” (2008, p. 446). In their review of nearly 8,000 students, Poelmans, Truyen,
and Desle (2009) found that the more students interacted with the Internet, the higher
their perceived degree of computer literacy, especially among males. Moreover, a
majority of researchers have found that incoming college students’ computer self-efficacy
is far greater than their actual knowledge levels (Stewart, 2016), with scores as much as
20 points higher than their actual computer skill proficiency (Johnson et al., 2006).
Although based on subjective self-assessment, the computer self-efficacy construct is
another key factor in understanding and explaining students’ motivation, usage behavior,
and attitude towards a web-based, automated grading and tutorial software system.
Behavior-based Measures of Technology Acceptance
Perceived usefulness and perceived ease-of-use are two well-researched
constructs used to inform and assess technology acceptance and usage (Davis, 1989;
Davis, Bagozzi, & Warshaw, 1989; Venkatesh, Morris, Davis, & Davis, 2003). The
perceived usefulness construct measures the “degree to which a person believes that
using a particular system would enhance his or her job performance” (Davis, 1989, p.
320). Perceived usefulness has also been shown to directly impact the sustained use of a
technology (1989). The perceived ease-of-use construct measures the “degree to which a
person believes that using a particular system would be free of effort” (1989, p. 320). If a
technology is difficult to use or learn, the physical or mental effort required may
outweigh the benefits realized by the technology. Although Davis (1989) found that both
constructs were significantly correlated with technology adoption and usage, the most
significant relationship occurred between usefulness and usage. In other words,

33
technologies that offer advantages in terms of productivity and workflow are evaluated
more favorably by users, regardless of whether they may be somewhat challenging to
learn or use. Furthermore, Davis (1989) suggests that ease-of-use may actually be “an
antecedent to usefulness, rather than a parallel, direct determinant of usage” (p. 334). The
technology acceptance model (TAM), along with survey instruments developed by Davis,
may be used to measure the impact and acceptance of new Web-based, educational
technologies.
Object-based Measures of End-User Satisfaction
End-user satisfaction is an attitudinal measure of the feelings held by a person
towards a particular technology (DeLone & McLean, 2003). Within technology and
information systems research, user satisfaction is typically measured using a survey
instrument consisting of various characteristics or attributes, including system quality
(e.g., accessibility, timeliness, and flexibility), information quality (e.g., accuracy,
reliability, and completeness), and service quality (e.g., vendor support, response time,
and technical competence) (DeLone & McLean, 2003; Doll & Torkzadeh, 1988;
Mahmood, Burn, Gemoets, & Jacquez, 2000; Palvia & Palvia, 2007). In their meta-
analysis of end-user satisfaction studies, Mahmood et al. (2000) found three main
categories impacting satisfaction – perceived benefits, user background and involvement,
and organizational attitude and support. Among the most significant variables identified,
perceived usefulness and user experience were among those with the highest effects
(2000). While user satisfaction studies consistently show that one’s behavioral beliefs and
attitudes influence their perceptions of a technology’s ease of use and usefulness, user
satisfaction itself has been found to be a relatively weak predictor for usage behavior
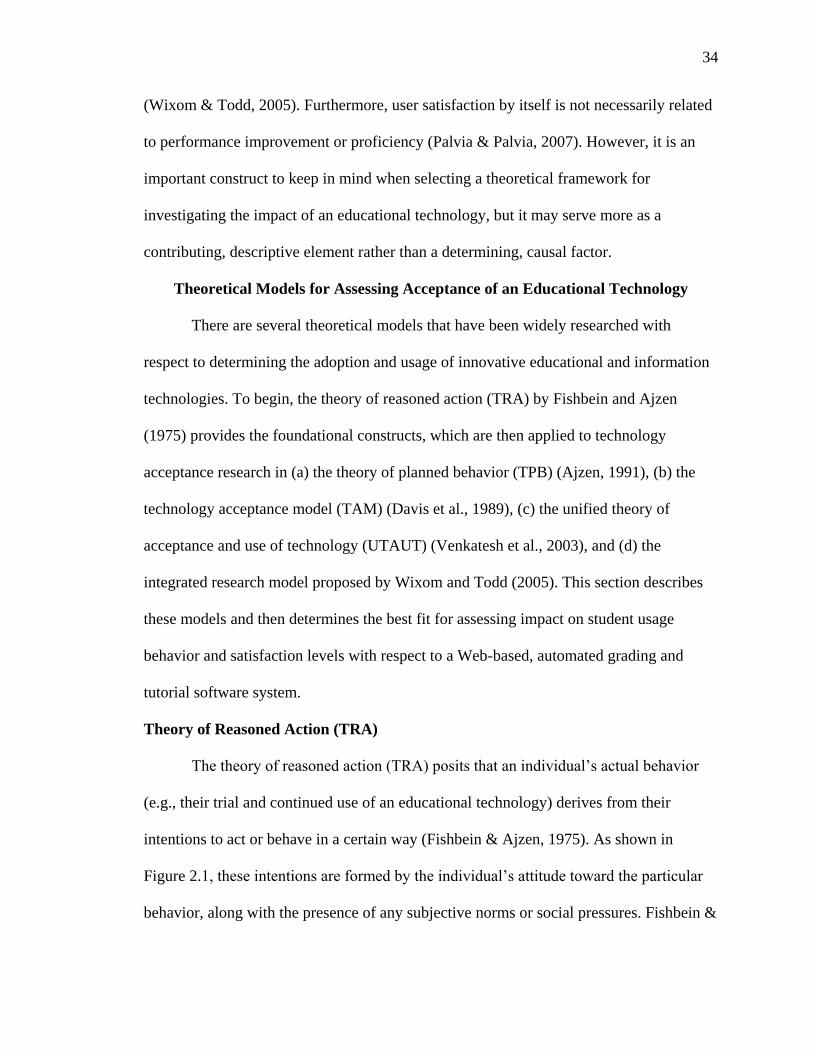
34
(Wixom & Todd, 2005). Furthermore, user satisfaction by itself is not necessarily related
to performance improvement or proficiency (Palvia & Palvia, 2007). However, it is an
important construct to keep in mind when selecting a theoretical framework for
investigating the impact of an educational technology, but it may serve more as a
contributing, descriptive element rather than a determining, causal factor.
Theoretical Models for Assessing Acceptance of an Educational Technology
There are several theoretical models that have been widely researched with
respect to determining the adoption and usage of innovative educational and information
technologies. To begin, the theory of reasoned action (TRA) by Fishbein and Ajzen
(1975) provides the foundational constructs, which are then applied to technology
acceptance research in (a) the theory of planned behavior (TPB) (Ajzen, 1991), (b) the
technology acceptance model (TAM) (Davis et al., 1989), (c) the unified theory of
acceptance and use of technology (UTAUT) (Venkatesh et al., 2003), and (d) the
integrated research model proposed by Wixom and Todd (2005). This section describes
these models and then determines the best fit for assessing impact on student usage
behavior and satisfaction levels with respect to a Web-based, automated grading and
tutorial software system.
Theory of Reasoned Action (TRA)
The theory of reasoned action (TRA) posits that an individual’s actual behavior
(e.g., their trial and continued use of an educational technology) derives from their
intentions to act or behave in a certain way (Fishbein & Ajzen, 1975). As shown in
Figure 2.1, these intentions are formed by the individual’s attitude toward the particular
behavior, along with the presence of any subjective norms or social pressures. Fishbein &
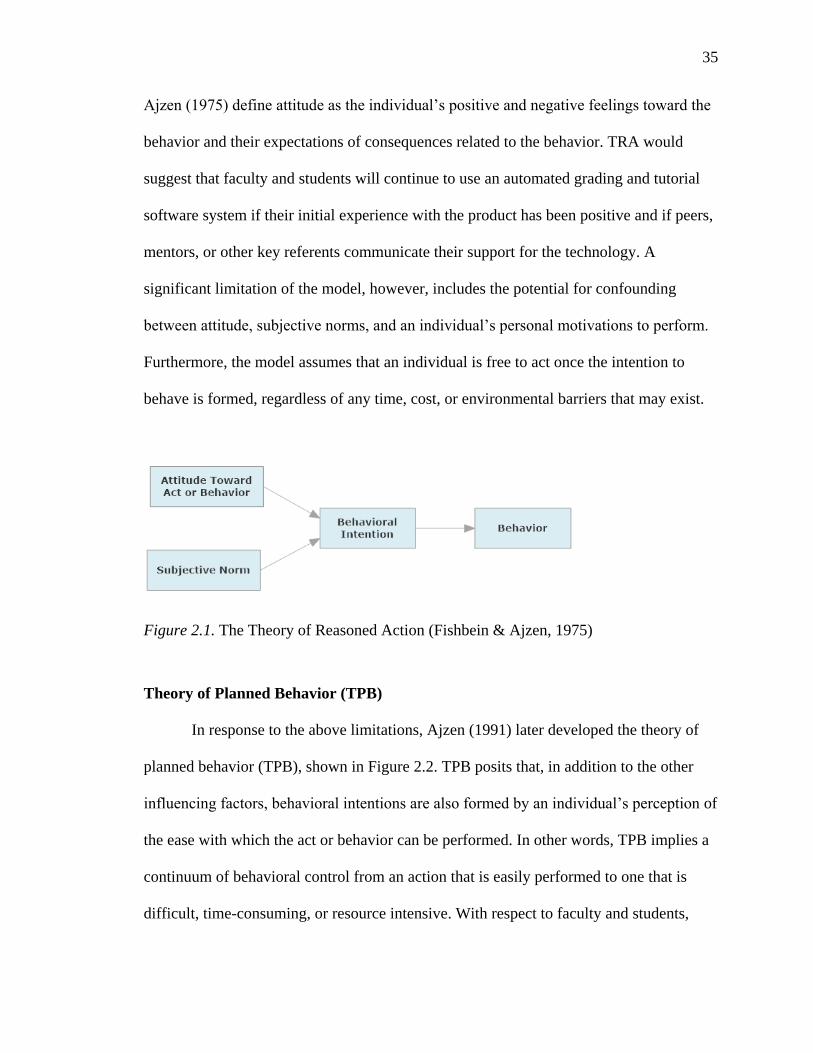
35
Ajzen (1975) define attitude as the individual’s positive and negative feelings toward the
behavior and their expectations of consequences related to the behavior. TRA would
suggest that faculty and students will continue to use an automated grading and tutorial
software system if their initial experience with the product has been positive and if peers,
mentors, or other key referents communicate their support for the technology. A
significant limitation of the model, however, includes the potential for confounding
between attitude, subjective norms, and an individual’s personal motivations to perform.
Furthermore, the model assumes that an individual is free to act once the intention to
behave is formed, regardless of any time, cost, or environmental barriers that may exist.
Figure 2.1. The Theory of Reasoned Action (Fishbein & Ajzen, 1975)
Theory of Planned Behavior (TPB)
In response to the above limitations, Ajzen (1991) later developed the theory of
planned behavior (TPB), shown in Figure 2.2. TPB posits that, in addition to the other
influencing factors, behavioral intentions are also formed by an individual’s perception of
the ease with which the act or behavior can be performed. In other words, TPB implies a
continuum of behavioral control from an action that is easily performed to one that is
difficult, time-consuming, or resource intensive. With respect to faculty and students,

36
TPB suggests that an educational technology may be more readily adopted if it is easy to
learn and use, relatively inexpensive, and/or easily deployed and maintained.
Figure 2.2. The Theory of Planned Behavior (Ajzen, 1991, p. 182)
Technology Acceptance Model (TAM)
The technology acceptance model (TAM) is an adaptation of the theory of
reasoned action (TRA) model created to predict and assess the adoption and acceptance
of information technology and information systems (Davis et al., 1989). As shown in
Figure 2.3, TAM posits that an information system’s actual usage is determined by one’s
behavioral intention to use the technology, which is in turn formed by their attitude
toward using the system and their perception of its usefulness. Similar to the theory of
planned behavior (TPB), TAM accounts for the behavioral control continuum by
measuring an individual’s perception of the system’s ease of use and accounting for
external factors which may impact one’s beliefs (Venkatesh et al., 2003). While TAM has
been frequently used in studies of technology acceptance over the past decade, the
explanatory predictive power of the model has been found lacking with only a 50%

37
accounting of the variance in actual system usage (Park, 2009; Venkatesh & Davis, 2000).
Regardless, TAM has been well-documented and empirically supported in numerous
information technology and system studies.
Figure 2.3. The Technology Acceptance Model (Davis, 1989, p. 985)
Unified Theory of Acceptance and Use of Technology (UTAUT)
The unified theory of acceptance and use of technology (UTAUT), shown in
Figure 2.4, attempts to consolidate constructs from eight prominent theories in order to
better explain information systems usage behavior (Venkatesh et al., 2003). UTAUT
posits that there are four key constructs – performance expectancy (i.e., usefulness),
effort expectancy (i.e., ease-of-use), social influence, and facilitating conditions – that act
as direct determinants of an individual’s behavioral intention to adopt and use a particular
technology (2003). Along with these direct determinants are four mediators – gender, age,
experience, and voluntariness of use – that either enhance or diminish the impact of the
key constructs (2003). Analyzing these constructs across a longitudinal study, Venkatesh
et al. (2003) were able to achieve a 70% accounting of variance in usage intention for an
information system. With its strengths as a unified, evidence-based model, UTAUT has
become one of the most popular ways to evaluate users’ acceptance of a technology.
38
Figure 2.4. The Unified Theory of Acceptance and Use of Technology Model
(Venkatesh et al., 2003, p. 447)
While technology acceptance literature has successfully predicted usage behavior
of educational technologies based on attitudes and beliefs of the system’s ease-of-use and
usefulness (Chauhan & Jaiswal, 2016; Lakhal & Khechine, 2016; Nistor, Gogus, &
Lerche, 2013), an analysis of the impact of system design and information attributes on
end-user satisfaction is lacking. Furthermore, the aforementioned models rely on
individuals’ perceptions of how they might use an information system in the future, based
upon limited exposure to the actual technology. User satisfaction research for information
technology fills this gap by focusing on the information and system design characteristics
that may promote the ongoing usage of a technology or information system (Benbasat &
Barki, 2007). Although technology acceptance and user satisfaction literature have
largely evolved as parallel research streams, the two approaches have been successfully
integrated more recently by Wixom and Todd (2005).

39
Wixom and Todd Integrated Research Model
Wixom and Todd’s (2005) research model, shown in Figure 2.5, builds out the
technology acceptance model by incorporating measures for information satisfaction and
system satisfaction. These object-based attitudes are both “assessments of the
consequences of using a system to accomplish a task” and are influential on and
predictive of behavioral dispositions towards technology acceptance (2005, p. 90). The
information satisfaction construct, as depicted in Figure 2.5, derives from an individual’s
beliefs about the quality of information, assessed according to its completeness, accuracy,
format, and currency. The level of satisfaction with information quality impacts an
individual’s performance expectancy and perception of the usefulness of the system.
System satisfaction is formed from beliefs about the quality of the system; specifically,
its reliability, flexibility, integration, accessibility, and timeliness of reporting. An
individual’s level of satisfaction with system quality impacts their effort expectancy
(i.e., beliefs regarding ease-of-use) and, in turn, their overall satisfaction with the system.
Wixom and Todd (2005) believe that these information and system characteristics may be
manipulated in the design and implementation of an information system or technology, in
order to improve overall satisfaction and to promote continued and heightened usage
behavior.

40
Figure 2.5. The Integrated Research Model (Wixom & Todd, 2005, p. 90)
Summary of Measures for Technology Acceptance and Usage
In summary, the impact and acceptance of an educational technology solution
may be explained by measuring and evaluating the beliefs and attitudes of existing users,
in a manner that is consistent in both time (e.g., a semester) and context (e.g., freshman
computer literacy class) (Fishbein & Ajzen, 1975; Ajzen & Fishbein, 1980). Especially
when combined with measures of user satisfaction, a comprehensive understanding and
appreciation for the external factors influencing users’ beliefs and attitudes towards a
technology may be derived (Wixom & Todd, 2005). Unfortunately, each student’s
experience cannot be assumed to be identical and generalizable given the voluntary
nature of the technology’s use and implementation within the context of a class section.
Therefore, the selection of a theoretical framework for data collection, analysis, and

41
interpretation becomes crucial in terms of compiling an informed description of the
perceived impact of this technology on a computer literacy course.
Determining Impact of an Educational Technology on the Computer Literacy
Course
Past research demonstrates that computer literacy education is an important
curricular component and that the majority of incoming freshman students do not possess
the level of computer competency required for academic or workplace success.
Furthermore, most of the research conducted in the area of computer literacy relates to
either evaluating incoming students’ computer self-efficacy and skill proficiency or
comparing student grade outcomes after the adoption of an instructional technology.
While research into educational simulations, blended learning environments, and
feedback can inform the area of automated grading and tutorial software, there remains
the need for a holistic study of the perceived impact on instructors, students, and the
classroom environment.
Identifying the Theoretical Framework
The theoretical underpinnings for this study are grounded in past research. First,
for assessing the perceived impact on students when introducing new technologies into
traditional situations, the well-documented theoretical models for technology acceptance
(Venkatesh et al., 2003) and end-user satisfaction (DeLone & McLean, 2003; Doll &
Torkzadeh, 1988) provide guidelines for both data collection and analysis. The integrated
research model by Wixom and Todd (2005) presents a reasonable merger of these models
and provides a proven measurement tool for the necessary constructs. Second, for
assessing the impact of contextual variables on the aforementioned results, a qualitative

42
approach is well-suited for describing the variation in people’s perceived experiences
with the technology. The nature of the research is to understand how individuals
experience important aspects of their learning environment, with the results being pooled
for analysis at the collective level in order to inform future practices. Because instructors
may voluntarily implement, use, and reference the automated grading and tutorial
software differently within their classes, the qualitative orientation provides an
appropriately holistic perspective for understanding and explaining potential variations,
as measured by the quantitative instrument results from the Wixom and Todd integrated
research model (2005).
Restating the Significance of this Study
With the diverse and, at times, disappointing technology skills of incoming
freshman students, the computer literacy course is an ongoing-concern for various
stakeholders in higher education, including program directors, faculty members,
curriculum developers, instructional designers, and future employers. To better manage
this skill diversity, many colleges and universities have adopted student-centered,
simulation-based tutorials and software proficiency exams for Microsoft Office. Past
research has competently measured the skill proficiency of incoming students and the
grade outcomes associated with implementing simulation-based tutorials. However, these
quantitative measures and self-assessment surveys do not adequately describe the
experience of instructors and students when implementing a Web-based, automated
grading and feedback system. Nor do these past studies describe students’ perceptions
and behavioral intentions towards using an automated grading system for software
training. This study focuses on better understanding the impact of this technology on the

43
computer literacy classroom toward the goal of informing curriculum development and
instructional design, as well as the development of future technology products for
computer literacy education and evaluative instruments for future research studies.

44
CHAPTER 3. METHODOLOGY
The case study research methodology was selected to investigate the experiences
of instructors and students when introducing automated grading and tutorial software into
a freshman computer literacy course. This strategy provides an “all-encompassing
method” for systematically studying and describing a phenomenon (in this case, the
implementation of an educational technology) within a real-life context (Yin, 2003, p. 14).
Furthermore, the case study method provides an empirical framework for collecting,
analyzing, and triangulating multiple sources of quantitative and qualitative evidence,
including documents, interviews, observations, and surveys (2003). And, most
importantly, the case study method was chosen because the goal is to expand and
generalize on theoretical propositions of technology acceptance by investigating an
innovative educational technology within a unique context.
The case study research strategy also provides an excellent methodological
framework for performing mixed-method research studies in the social sciences (Merriam,
1998; Yin, 2003). As an evidence-based strategy, the case study method furnishes the
researcher with a proven set of procedures for investigating an empirical topic within a
naturalistic setting (2003). In this particular study, the context of the freshman computer
literacy course, along with the implementation of an innovate technology, is hypothesized
to impact both instructor and student experiences. A descriptive case study successfully
45
provides multiple sources of qualitative and quantitative evidence for triangulating such
experiential data in an all-encompassing manner (2003). Yin (2003) also suggests that the
case study method is appropriate “when a ‘how’ or ‘why’ question is being asked about a
contemporary set of events, over which the investigator has little or no control” (p. 9).
This study’s research question aligns well with this viewpoint, asking how an innovative
technology impacts the computer literacy classroom, and why instructors and students
experienced the technology the way they did. Rather than a traditional mixed-methods
study that selects independent approaches to data collection and analysis, the case study
method offers an integrated, structured approach for a more holistic and descriptive result.
As a method of inquiry, the case study approach is further supported by the theoretical
framework of technology acceptance and user satisfaction to orient the data collection,
analysis, and interpretation of data.
Case Study Design
A mixed-method, single-unit, embedded case study design strategy has guided the
decisions, planning, and implementation of the research methodology. This design
strategy focuses the inquiry on a single context (e.g., a course), but requires collecting
and analyzing data from multiple units (e.g., instructors or course sections) within that
context. These embedded subunits are analyzed both separately and corporally in
response to the stated research questions. The analysis does not, however, focus solely on
the individual subunits, but returns to inform the wider perspective of investigating and
describing the perceived impact of an innovative educational technology on instructors,
students, and the classroom culture. This methodological approach also supports the
46
collection and analysis of qualitative and quantitative data from course documents,
classroom observations, instructor interviews, and student surveys.
Unit of Analysis and Sampling
This single-unit, embedded case study design strategy was employed to study the
perceived impact of an automated grading and tutorial system called MyITLab, produced
by Pearson Education. The specific context for this study is a freshman computer literacy
course entitled “BuAd 128 – Computer Applications I,” offered by the School of
Business at Okanagan College in British Columbia, Canada. As a required freshman
course for both the 2-year diploma and 4-year Bachelor of Business Administration
(BBA) degree, BuAd 128 receives annual enrolments of over 400 students, translating
into more than ten sections of 40 students (maximum) each Fall semester. This 3-credit
course is taught in 40-station computer labs, typically in two hour sessions twice per
week, and also offered via distance education. An approved syllabus from the 2011/2012
academic year, complete with learning outcomes (and redacted instructor names for
confidentiality), is provided in Appendix A.
Instructors in the School of Business at Okanagan College fall within two
employee groups: (a) continuing or full-time professors and (b) part-time or adjunct
lecturers. Both groups are members of the faculty association and, as such, protected
from potential abuses arising from research conducted within classrooms. In order to
receive permission to enter a classroom and conduct observations or interviews, a
research proposal and formal request was presented to the Research Ethics Board (REB)
at Okanagan College in September, 2011, and approval received in October, 2011. The
Okanagan College REB aligns their ethical review process with the Tri Council Policy

47
Statement of ethical conduct for research involving human participants (Canadian
Institutes of Health Research, Natural Sciences and Engineering Research Council of
Canada, and Social Sciences and Humanities Research Council of Canada, 2010). In
order to analyze the data archived from the 2011/2012 academic year, an application was
made to the Institutional Research Board (IRB) at Purdue University in April, 2016.
Approval for exemption status was summarily received in May, 2016 (see Appendix B).
Having already selected BuAd 128 as the single-unit under study, the individual
class sections were then grouped by instructor as the embedded units for analysis.
Arguably considered a census for the single-unit course population, these embedded
instructor units are more clearly defined as a purposeful sample from a convenient
population. A purposeful sample focuses on information-rich cases to yield insights and
depth of understanding, while a convenient sample is often void of such strategic goals
(Patton, 2002). While access to class sections at one’s home institution may be
convenient, the case study’s ultimate goal is to develop and refine analytic
generalizations within the context of a freshman computer literacy course, which aligns
well with Patton’s (2002) definition of the purposeful, typical-case sampling approach.
Data were collected during the Fall semester of the 2011/2012 academic year.
There were five instructors and 322 students included in the study, as shown in Table 3.1.
Each of these instructors were personal colleagues, and had previous experience teaching
BuAd 128. Speaking to the continued relevance of the study between the data collection
and reporting periods, four of these instructors have continued to teach BuAd 128 using
the MyITLab Grader software up to and including the Fall 2016 semester. Two distance
education sections of BuAd 128 (19 students) were left out of the study, as the research

48
purpose centers around the in-class experiences of instructors and students. Maintaining
the principle of beneficence and, specifically, respondent confidentiality, instructor
names were changed to pseudonyms upon data collection (Corti, Day, & Backhouse,
2000). The five pseudonyms were selected using an Internet-based random baby names
generator, available at http://randombabynames.com. These names were applied
sequentially to replace the existing instructor names, keeping consistent with the actual
gender distribution. Other identifying information, such as location and setting
characteristics, were also removed to ensure respondent anonymity (2000).
Table 3.1
Embedded Units of Analysis for BuAd 128 (Fall 2011)
Instructors Sections Students
Andrew 3 92
Brenda 2 63
Peter 2 71
Scott 2 61
Susan 1 35
Total 10 322
Document Collection and Analysis
The course syllabi and application quizzes for BuAd 128 were collected in
November, 2011, via personal email from the five instructors. Each syllabus was
provided as an Adobe Acrobat PDF file, and later confirmed to be the same document
that was posted to students through the college’s Blackboard Learning Management
System (LMS). While the majority of courses in the School of Business share a common
syllabus between sections, instructors are free to customize the course schedules and
49
section resources. Therefore, a comparative content analysis was performed on the syllabi
to identify any significant differences. This process entailed reviewing the four-page
documents next to one another and then manually highlighting any inconsistencies or
additions for further investigation during the personal interviews. Furthermore, a course
syllabus from the 2015/2016 academic year was collected and analyzed to determine if
the course description, learning outcomes, and course objectives had changed
significantly over the past four years. Finding only minor cosmetic changes (e.g., version
numbering updates) and wordsmithing, the relevancy of the study’s context remains
intact for this particular course.
The application quizzes were also provided as digital files. For the Microsoft
Word application quiz, three files were provided from each instructor: one Word Quiz
instruction document, one Word Quiz source document, and one target PDF output file.
For the Microsoft Excel application quiz, a single Excel workbook from each instructor
was collected for analysis. These files were then compared side-by-side to determine if
any differences appeared in the quiz instructions, question content, and/or difficulty level.
As with the syllabus, quiz documents for Microsoft Word and Microsoft Excel were
collected from the Fall 2015 semester. While some contextual content had been changed
or updated within the document files, the examined skills were almost identical to the
Fall 2011 assessments.
In January, 2012, a formal request was made to the Dean of the School of
Business for an institutional Grade Point Average (GPA) report for the Fall 2011
semester of BuAd 128. Approval was confirmed and received within one week via email
and the request was then forwarded through inter-office mail to the Okanagan College
50
Institutional Research Area. By mid-February, 2012, the GPA grade analysis report was
received via email from the Institutional Research Area. This two-page document
summary provided final enrolment and grade statistics for the semester, broken down by
instructor. The data were cataloged and recorded as another piece of confirmatory
evidence for triangulating results from the student survey.
Instructor Observations and Interviews
The five instructors provided the primary source of evidence for this case study.
The development of the interview protocol was guided by the research questions and
theoretical framework. Furthermore, classroom observations were conducted prior to the
interviews in order to clarify the direction, language, and depth of questioning. Although
the qualitative analysis had not yet occurred, the analytic memos and familiarity assisted
in the development of the instructor interview protocol. These observations also provided
an important confirmatory data source for describing the ways in which instructors
incorporated the MyITLab Grader software into their lessons. The personal interviews
with each instructor focused on the technical aspects of course preparation, lesson
delivery, assessment, and, more importantly, any perceptual gaps that existed between
instructors’ expectations and their perceived in class experiences with MyITLab Grader.
Informed by the classroom observations, these interviews also provided a flexible and
extensible vehicle for discussing potential opportunities and barriers with respect to the
continued use of MyITLab Grader in BuAd 128.
Role of the Researcher
Documenting the researcher’s roles, perceptivity, and potential biases is
especially important when conducting qualitative inquiry that employs observations and
51
interviews (Charmaz, 2003; Patton, 2002). While not affecting the collection,
measurement, or analysis of quantitative data, a researcher’s epistemological beliefs,
values, knowledge, and experience inarguably impact the interpretations of faculty-
student interactions, lecture styles, and classroom management. Furthermore, disclosing
the background, expertise, and potential biases of the researcher can enhance the
trustworthiness and credibility of the analysis (2002).
With respect to the computer literacy discipline and specific Microsoft Office
content area, I am a recognized expert with over 20 years of experience in computer
software training and assessment. I have been the lead author and editor for a successful
series of college-level, computer textbooks, published by McGraw-Hill Higher Education.
I have also reviewed articles and trade books and presented at conferences and
symposiums as an instructional expert for Microsoft Office applications. Currently, I am
a faculty member in a large Canadian college, responsible for teaching introductory and
advanced computer literacy and information technology courses for the School of
Business. I also have several years of experience teaching the course entitled “BuAd 128
– Computer Applications I,” which has been selected as the primary unit of analysis for
the case study. Since the data collection period during the 2011/2012 academic year, I
have taught an additional eight sections of the course prior to commencing data analysis.
In addition to my technical writing and teaching experience, I have been
integrally involved in planning, promoting, and designing software simulations and e
learning programs for higher education. Over the past decade, I have been an early
adopter of software simulations and other innovative technologies for classroom use.
Along with such experiences comes a certain degree of bias towards the appropriate
52
implementation and use of technology within the computer literacy context. I am
definitely a proponent for using instructional simulations and automated grading systems,
and I believe that they offer a safe, engaging, and practical learning environment for
students.
In summary, my prolonged experience, knowledge, and expertise in this area
provides a unique opportunity for describing how an educational technology is
implemented, used, and perceived by faculty and students in a freshman computer
literacy course.
Classroom Observations
Classroom observations were conducted in late November, 2011. Instructors were
first contacted in early November via telephone and a mutually-acceptable observation
date was scheduled for later in the month. Other than a confirmation email the week
before the observation, there was no other contact with or instructions given to the
instructor. The chosen methodological approach was a naturalistic, direct observation of
one complete session from each instructor’s classroom. The purpose for these
observations was twofold: first, to better understand and capture the context within which
instructors and students experienced using the MyITLab Grader software (Patton, 2002)
and, second, to inform the development of questions and probes for the interview
protocol. Another benefit would be the insights gained with respect to differentiating the
selective perceptions of instructors (collected during interviews) from the researcher’s
emic perspective moderated through direct observations (2002).
Before each observation, the researcher met with the instructor and explained the
purpose of the study and how the collected data would be used, stored, and kept secure.

53
The instructor then read and signed the informed consent form (Appendix C) for both the
observation and personal interview protocols. The observations themselves were
conducted in an overt fashion, beginning with a brief introduction to the researcher by the
instructor. Observations were conducted without a formally written protocol, following
the observer-as-participant model. As suggested by Merriam (1998), the purpose of the
observation was sensitized to and guided by the research questions and theoretical
framework. Positioned near the back corner of the computer lab, the researcher used the
Cornell note-taking method (Cornell University, 2015) to record a handwritten, direct
narrative of events, along with procedural and analytical memos. The observations were
not videotaped or audio-recorded, in order to meet the strict personal protection
guidelines set out by the Research Ethics Board (REB) of Okanagan College for
observing employees and students within the college setting. Each of the five classroom
observations took place for the duration of the two-hour class. After completing the
observation, the instructor met briefly with the instructor to review the notes and to
confirm that the observed class session was typical for the semester, especially with
respect to the activities and interactions with students and software.
Within one week after each classroom observation, the handwritten notes and
memos were scanned into the data archive for safe-keeping and then transcribed into
Microsoft Word. Procedural and content memos were added to the narrative as Microsoft
Word comments. The observation documents were then exported as Rich-Text Format
(RTF) files for subsequent analysis using the ATLAS.ti and MAXQDA qualitative data
analysis software programs (ATLAS.ti Scientific Software Development GmbH, 2016;
VERBI GmbH, 2016).
54
Instructor Interviews
Instructor interviews were conducted in mid-January, 2012. To prime the
instructors for the discussion, a pre-interview survey was sent out to each instructor via
email, requesting their response to several open-ended questions (see Appendix D). Only
two of the five instructors responded to the survey email request. Fortunately, the purpose
of this email was not for data collection, but to remind instructors of the interview topics
and to provide them with some rumination time before the actual interview. The formal
interview protocol was finalized in early January, after completing a brief analysis of the
observation data (see Appendix E). The protocol focused on four key discussion areas
around the instructor’s use of the MyITLab Grader software: 1) Class Preparation,
2) Teaching and Administration, 3) Student Learning, and 4) Perceptions and
Expectations. These categorizing areas were formulated in response to the research
objectives, while the observation analysis assisted with wording and phrasing. Once the
interview protocol had been finalized, the instructor interviews were requested and
scheduled individually via telephone for a mutually convenient time and location.
Each instructor interview lasted approximately one hour, ending with an
additional 15 minutes of informal and unrecorded debriefing. The interviews were
conducted and recorded using an Olympus WS-320M digital voice recorder (along with a
smartphone for backup). Handwritten notes were also used for taking procedural,
analytical, and content memos, and for recording potential probe questions that could be
used during the interview. The audio recordings were uploaded into the data archive and
then transcribed into Microsoft Word within two weeks of the interview date. Shortly
thereafter, each instructor was sent their interview transcript via email for member-

55
checking and instructed to use Microsoft Word’s Track Changes feature when adding,
modifying, or deleting content. After another week, follow-up emails were sent to those
instructors who had not yet returned the transcript, until all were finally received. Upon
reviewing and accepting the document changes, the files were exported to a Rich-Text
Format (RTF) in preparation for analysis using the qualitative data analysis software.
Analysis of Qualitative Data
This case study generated folders of both digital and paper-based document files,
over five hours of recorded (and transcribed) instructor interviews, and nearly 10 hours of
handwritten notes (also transcribed) from classroom observations. Preparing only a
descriptive account of these data sources, while a necessary beginning, would not do
justice to the story of instructor experiences (LeCompte, Preissle, & Tesch, 1993). A
more structured approach to the analysis would be required, which began formally in
April, 2016 after receiving the appropriate approval from Purdue University’s Human
Research Protection Program (HRPP). The following coding strategy provided a solid
foundation for data analysis (Saldana, 2009):
1. organizing and preparing the data for analysis,
2. coding and describing the data,
3. classifying and categorizing themes,
4. connecting and interrelating the data, and
5. interpreting and making sense of the data.
With the observation and interview data already stored digitally in Rich-Text Format
(RTF) files, they were readily imported into the ATLAS.ti Computer-Assisted Qualitative

56
Data Analysis Software (CAQDAS) for coding and analysis (ATLAS.ti Scientific
Software Development GmbH., 2016).
Whether manually on paper or using a CAQDAS program, the process of coding
is “primarily an interpretive act,” and must acknowledge the subjective role that the
researcher plays in transitioning the data into information and knowledge (Saldana, 2009,
p. 4). The researcher uses codes, which can be made up of words or phrases, to
“symbolically assign a summative, salient, essence-capturing” attributes to written or
digital media (p. 3). One of the key objectives in coding is to summarize the data in order
to both illuminate patterns and to generate explicit categories, implicit themes, and
analytic generalizations. Such patterns can be characterized by the similarities,
differences, frequencies, sequences, correspondence, and/or causation apparent in the
data (2009). Specific to this study, a comparative lens was applied to focus the search for
patterns on the similarities and differences in people’s in-class experiences using the
MyITLab Grader software.
For the observation data, an “Eclectic Coding” approach was employed using
both Descriptive and Initial “First Cycle” coding techniques (Saldana, 2009). In
Descriptive coding, the data are summarized and categorized using topic- versus content-
based codes, which seemed appropriate given that the specific lesson content was
unimportant. After generating and recording the main topical tags, an inductive Initial
coding approach was used to focus attention on the words, sentences, and paragraphs
used to describe the in-class procedures and experiences. Recommended by Saldana
(2009) as a starting point for developing descriptive, yet provisional codes, this approach
was selected in order re-engage line-by-line with the archived notes and memos that
57
comprised the observation data. In the “Second Cycle” of coding, the Focused coding
approach was selected to search for the most frequent and significant codes and
categories that made the most analytic sense. Using streamlined Axial coding techniques,
these individual codes and categories were confirmed, reassembled, and then connected
to one another in hopes of generating themes (Charmaz, 2003).
Two coding methods were selected for the purposes of “First Cycle” coding and
analysis of the instructor interview data. First, the Structural Coding method is
recommended for coding interrogative transcripts and for use in within-case and cross-
case analysis (Saldana, 2009). A structural code is a “content-based or conceptual phrase
representing the topic of inquiry” and serves as a way to both label and index interview
data segments (2009, p. 66). Second, the Provisional Coding technique was used to align
the qualitative analysis with Wixom and Todd’s model and the theoretical frameworks of
Technology Acceptance (TAM) and End-User Computing Satisfaction (EUCS). In
Provisional coding, a predetermined starting list of codes is developed based on past
research, literature reviews, the theoretical framework, your research questions, analytic
memos, an interview protocol, and/or the researcher’s previous knowledge and
experiences (2009). In some ways the antithesis of the Initial or Open coding approach,
Structural and Provisional coding provide another triangulating methodological process
for the purpose of informing the case study’s analytic generalizations.
While the qualitative analysis began using the ATLAS.ti CAQDAS software, the
decision was made to move the observation and interview data to MAXQDA, which
yielded a more graphical interface for coding, reporting, and analysis (VERBI GmbH.,
2016). Once the conversion was complete, the documents and code book were subjected
58
to further scrutiny, reduction, and analysis. Lastly, a comparative lens was once again
applied to highlight the unique instructor experiences related to the implementation and
use of MyITLab Grader.
Trustworthiness and Credibility
As with quantitative data collection and analysis, qualitative research requires
checks and balances to ensure that the standards of scientific inquiry are met. Rather than
validity and reliability, qualitative research often uses terms like trustworthiness,
credibility, and authenticity (Creswell & Miller, 2000). Trustworthiness results from the
rigor used in systematically collecting and analyzing data for the purpose of describing or
explaining phenomena as accurately and completely as possible (Patton, 2002).
Credibility refers to the confidence one has in the truth of the findings (Merriam, 1998).
Authenticity, on the other hand, turns the mirror upon the researcher to provide reflexive
opportunities to disclose personal perspectives and biases (2002). Additional criteria, also
referenced by Patton (2002), support the strength and believability of qualitative research,
including transferability (the ability of other researchers to apply the findings to their own
work), dependability (the stability of findings over time), and confirmability (the internal
coherence of data in relation to findings and interpretations).
In order to meet the foundational measures of trustworthiness, credibility, and
authenticity, Creswell (2003) provides eight primary strategies for qualitative scientific
inquiry.
1. Triangulate with different data sources.
2. Use member-checking for both raw data collection and interpretations.
3. Use rich, thick descriptions to convey the findings.

59
4. Clarify the bias of researchers through self-reflection.
5. Present negative or discrepant information that counters themes.
6. Spend a prolonged time in the field.
7. Use peer debriefing to enhance accuracy.
8. Use an auditor to review the research.
This particular study employs the first four of these strategies. With respect to
triangulation, this single-unit case study collects and analyzes data from a variety of
sources, including documents, observations, and interviews, and does so across multiple
embedded units of analysis. Member-checking of the transcribed interviews provided
instructors with an opportunity to correct or expand upon thoughts and comments. While
triangulation provides a means of corroboration from the researcher’s perspective,
member-checking improves the truthiness of participants’ accounts (Creswell & Miller,
2000). Furthermore, rich or thick descriptions were used in describing the setting,
participants, and themes in the study, as opposed to thin, fact-only descriptions. This
reporting style provides a context-based appreciation for the phenomena and sensitizes
readers, reviewers, and other researchers to participants’ experiences. Lastly, the role of
the researcher has been fully disclosed providing a transparent and reflexive account of
the assumptions, beliefs, and biases held by the researcher in documenting the instructor
and student experiences. Given that the researcher is the primary instrument in qualitative
research, this step is crucial in documenting potential strengths and weaknesses of the
stated interpretations and conclusions (Merriam, 1998).
60
Student Acceptance and Satisfaction Survey
Towards holistically describing the classroom experience with MyITLab Grader,
a student survey was conducted electronically through the Okanagan College Blackboard
Learning Management System (LMS). The survey was designed and assembled using
constructs and items from the Wixom and Todd (2005) Integrated Research Model, but
also from research employing the Unified Theory of Acceptance and Use of Technology
(UTAUT). These two models build directly upon the intentions of the Technology
Acceptance Model (TAM) (Davis, 1989; Davis et al., 1989), and have appeared in
numerous IS research studies. Furthermore, these models provide vetted survey
instruments with question items that have proven both valid and reliable in measuring
technology acceptance and user satisfaction (Legris, Ingham, & Collerette, 2003;
Marangunic & Granic, 2015; Xu, Benbasat, & Cenfetelli, 2013; Wixom & Todd, 2005).
Defining the Key Constructs
The Wixom and Todd (2005) Integrated Research Model combines constructs
from the technology acceptance literature (Davis, 1989; Venkatesh et. al, 2003) with
characteristics from the user satisfaction literature (DeLone & McLean, 2003). Their
model evaluates six main constructs as antecedents to determining users’ attitudes and
intentions-to-use an information technology solution. While these constructs were
originally designed to measure employees’ perceptions and attitudes toward workplace
information systems, they also provide a well-balanced framework for investigating
student perceptions and attitudes toward educational technologies, including automated
tutorial and grading solutions.
61
For the purposes of this study, the main constructs measured in the student
survey are defined in the following paragraphs.
Information Quality (IQ). Information quality is an object-based belief about the
completeness, accuracy, and format of information presented by the system. With respect
to the student survey, the focus is placed on students’ perceptions of the quality of
feedback provided by MyITLab Grader.
Information Satisfaction (IS). Information satisfaction is an object-based
attitude toward the information presented. For the student survey, the focus is placed on
measuring students’ overall satisfaction level with the feedback provided by MyITLab
Grader.
System Quality (SQ). System quality is an object-based belief about the
reliability, integration, and accessibility of the system. The focus for the student survey is
placed on students’ perceptions of the user interface, integration between the grading and
tutorial components of the software, and the uptime and availability of the online
MyITLab Grader software.
System Satisfaction (SS). System satisfaction is an object-based attitude toward
the system. Students’ overall satisfaction level with the software itself is the focus of this
construct.
Perceived Usefulness (PE). Perceived usefulness (or performance expectancy) is
a behavioral belief or expectation regarding the technology’s usefulness and its ability to
help users complete common tasks. In other words, it is the degree to which a person
believes that using a technology will enhance his or her performance (Davis, 1989;
Venkatesh et al., 2003). Furthermore, numerous studies provide evidence that perceived
62
usefulness is a primary predictor of technology acceptance and usage (Davis, 1989; Ong,
Day, & Hsu, 2009; Venkatesh & Davis, 2000). The student survey focusses on students’
perceptions regarding the ability of MyITLab Grader to help them learn and improve
upon their Microsoft Office skills, using the tutorial and feedback information available.
Perceived Ease-of-Use (EU). Perceived ease-of-use (also known as effort
expectancy or usability) is a behavioral belief or expectation regarding the ease
associated with using a technology and the effort required to learn and apply it to
common tasks. Ease-of-use may also be defined as the degree to which a person believes
that using a technology would be free of effort (Davis, 1989; Venkatesh et al., 2003).
While not as impactful as perceived usefulness on a person’s attitude toward or intention
to use a technology, the perceived ease-of-use construct may be especially important to
beginner and novice users (Venkatesh & Davis, 2000; Xu et al., 2013). The student
survey focuses on students’ perceptions of how easy MyITLab is to both use and learn.
Wixom and Todd (2005) argue that these main factors impact users’ behavioral
attitudes toward a technology solution, which in turn influence users’ desire to continue
using or to recommend such a solution. Due to the nature of the educational (as opposed
to workplace) setting, the intention-to-use and intention-to-recommend factors are
separated into specific items in the student survey. The rationale is that students may not
be able to afford an online subscription once the course ends (i.e., intention-to-use), but
they may well recommend that the software be used in future courses.
Forming the foundation of the student survey, the Integrated Research Model was
later enhanced with items from the Unified Theory of Acceptance and Use of Technology
(UTAUT) model (Venkatesh et al., 2003). Specifically, these additional items include

63
categorization variables for the respondents’ gender, age, and prior technical experience,
along with perceptual items related to peer-influence and social norms (2003). In fact,
several studies have added the Social Norms construct to the Technology Acceptance
Model’s (TAM) variables, in order to better describe the association between social and
peer influences (also referred to as subjective norms) on attitudes toward technology
adoption and use (Legris et al., 2003; Mathieson, 1991; Park, 2009; Punnoose, 2012;
Taylor & Todd, 1995; Venkatesh & Davis, 2000; Venkatesh et al., 2003). This construct
was also necessary in order to more accurately describe the use of MyITLab within a
classroom, as opposed to a mandatory workplace setting.
While the categorization items are self-explanatory, the remaining constructs that
form the foundation of the survey are defined in the following sections.
Social Norms (SN). Social norms (also known as subjective norms or social
influence) are behavioral beliefs regarding the attitudes and expectations held by an
influential or social peer group toward a technology or one’s use of that technology.
Fishbein and Ajzen (1975) define this construct as an individual’s perception that people
who are important to him think he or she should engage in a certain behavior. The
noteworthy point is that a person’s behavior is influenced by the way others will view
them for using a technology (Venkatesh et al., 2003). Research has shown that this
construct has direct influence on a person’s intention to use an innovative technology
solution, but primarily when that use is mandatory and not voluntary (Venkatesh & Davis,
2000). For the student survey, the focus is placed on students’ perceptions and beliefs
about how peers and instructors will view them for using MyITLab Grader, as well as
how these influential persons will view the technology itself.

64
Attitude (AT). Attitude is a behavioral disposition toward the technology. In
other words, an individual’s positive or negative feelings (evaluative effect) about an
object or performance behavior (Fishbein & Ajzen, 1975). The student survey focuses on
students’ overall attitude towards MyITLab Grader, especially with respect to its
perceived ability to impact their learning and skill-level through continued use and
assignment completion.
Intention to Use (IU). Intention to use is a behavioral attitude toward the system
with specific emphasis on usage patterns and future recommendations. For the student
survey, the focus is placed on students’ continued, post-course use of the software, as
well as their overall recommendation with respect to using MyITLab Grader in future
courses.
Referencing user satisfaction literature (Delone & McLean, 2003; Doll &
Torkzadeh, 1988), Wixom and Todd (2005) considered various system and information
characteristics as potential influencers on users’ perceptions of quality. In their seminal
data warehousing study, they introduced nine antecedent factors from user satisfaction
theory into their model to demonstrate the impact on users’ object-based beliefs (2005).
For technologies such as MyITLab Grader, some of these factors do not apply within the
educational context. And, for this reason, an adjusted Wixom and Todd model was
prepared that removes three of the nine factors; namely, Currency, Flexibility, and
Timeliness. Currency represents the “user’s perception of the degree to which the
information is up to date” (2005, p. 91). For MyITLab Grader, the informational content
for a particular version of the software does not change over time; thus, there is no
currency property to measure. Flexibility relates to an information system’s ability to
65
adjust and adapt to changing business requirements and environmental conditions. Once
again, the MyITLab Grader software is a fixed (i.e., inflexible) software technology that
delivers a set of predefined curriculum content, and employs a preprogrammed grading
algorithm. Lastly, Timeliness refers to the responsiveness of the technology in replying to
user requests. As described later in this section, feedback solicited during a student pre-
test of the instrument revealed a consensus that this factor overlapped with (and was
therefore redundant to) the Reliability and Accessibility factors. Obviously students want
the MyITLab software to be reliable and accessible (e.g., website is not down), but their
interaction with the site would not be centered around time-sensitive content-retrieval
activities, as would be required in data mining or online shopping scenarios. Therefore,
the Timeliness factor was removed to simplify the model and to reduce confusion among
student respondents.
An adjusted Wixom and Todd model was prepared for the student survey and is
presented in Figure 3.1.
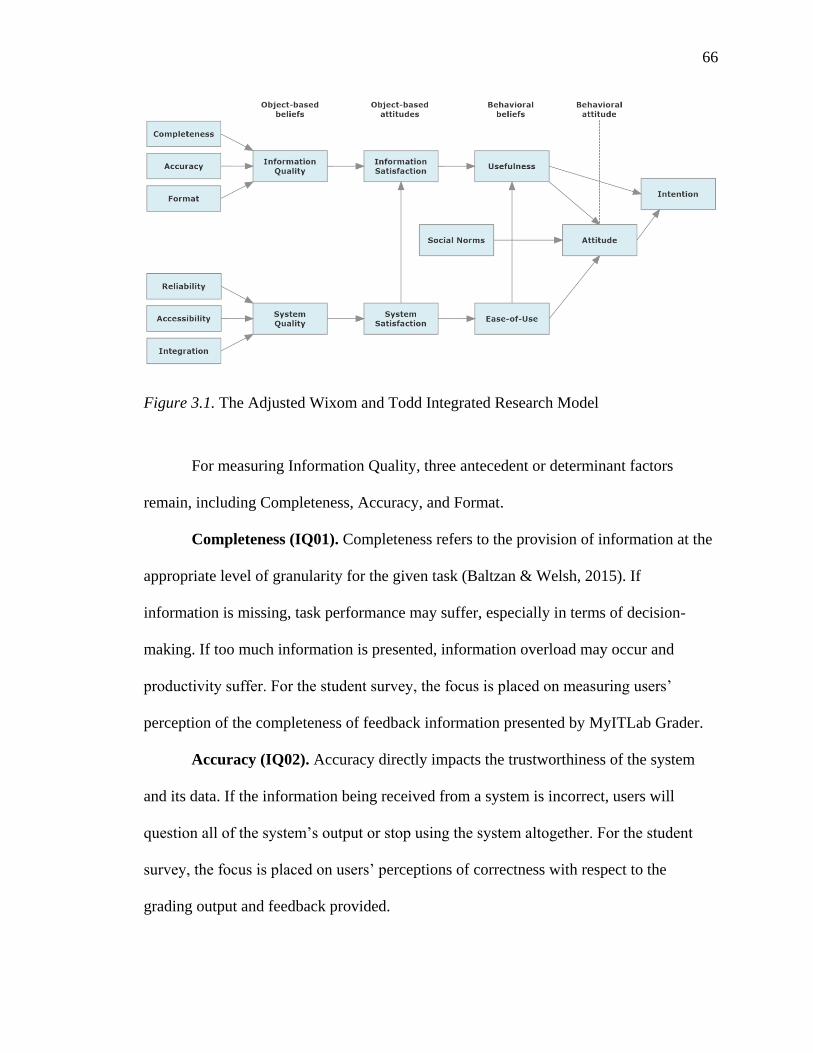
66
Figure 3.1. The Adjusted Wixom and Todd Integrated Research Model
For measuring Information Quality, three antecedent or determinant factors
remain, including Completeness, Accuracy, and Format.
Completeness (IQ01). Completeness refers to the provision of information at the
appropriate level of granularity for the given task (Baltzan & Welsh, 2015). If
information is missing, task performance may suffer, especially in terms of decision-
making. If too much information is presented, information overload may occur and
productivity suffer. For the student survey, the focus is placed on measuring users’
perception of the completeness of feedback information presented by MyITLab Grader.
Accuracy (IQ02). Accuracy directly impacts the trustworthiness of the system
and its data. If the information being received from a system is incorrect, users will
question all of the system’s output or stop using the system altogether. For the student
survey, the focus is placed on users’ perceptions of correctness with respect to the
grading output and feedback provided.
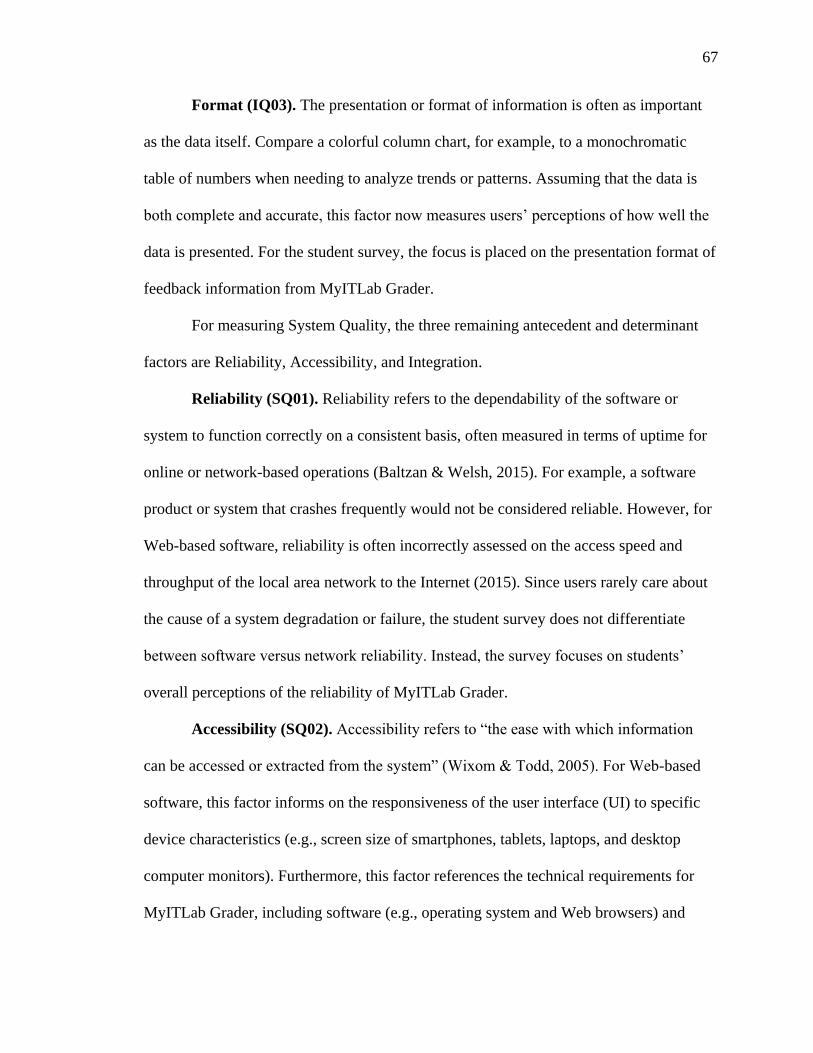
67
Format (IQ03). The presentation or format of information is often as important
as the data itself. Compare a colorful column chart, for example, to a monochromatic
table of numbers when needing to analyze trends or patterns. Assuming that the data is
both complete and accurate, this factor now measures users’ perceptions of how well the
data is presented. For the student survey, the focus is placed on the presentation format of
feedback information from MyITLab Grader.
For measuring System Quality, the three remaining antecedent and determinant
factors are Reliability, Accessibility, and Integration.
Reliability (SQ01). Reliability refers to the dependability of the software or
system to function correctly on a consistent basis, often measured in terms of uptime for
online or network-based operations (Baltzan & Welsh, 2015). For example, a software
product or system that crashes frequently would not be considered reliable. However, for
Web-based software, reliability is often incorrectly assessed on the access speed and
throughput of the local area network to the Internet (2015). Since users rarely care about
the cause of a system degradation or failure, the student survey does not differentiate
between software versus network reliability. Instead, the survey focuses on students’
overall perceptions of the reliability of MyITLab Grader.
Accessibility (SQ02). Accessibility refers to “the ease with which information
can be accessed or extracted from the system” (Wixom & Todd, 2005). For Web-based
software, this factor informs on the responsiveness of the user interface (UI) to specific
device characteristics (e.g., screen size of smartphones, tablets, laptops, and desktop
computer monitors). Furthermore, this factor references the technical requirements for
MyITLab Grader, including software (e.g., operating system and Web browsers) and
68
hardware (e.g., processor, RAM, storage, and graphics capabilities). For the student
survey, the inquiry focus is placed on students’ ability to access the software between
their home and school computers.
Integration (SQ03). Integration refers to the way that data is accessed both
within the software and between different systems. In the Wixom and Todd (2005) study,
data warehousing solutions would require high-levels of data integration. However, in
MyITLab Grader, the integration aspect centers around navigational options, such as
hyperlinks provided within and between lesson content and assessments. Also important
is the ability of MyITLab Grader results to be integrated with or exported to the college’s
learning management system (LMS). For the student survey, the focus is placed on the
navigability of the UI and students’ ability to access lesson content directly from within
an assessment module or feedback response.
Developing the Survey Instrument
The student survey instrument was constructed by listing the key constructs and
then gathering groups of validated question items from previous research instruments.
The majority of question items were extracted directly from Wixom and Todd’s
instrument (2005, pp. 93-94). Because the Social Norms construct was added to the
adjusted survey model, this group of questions needed to be included from items used in
estimating social influence in the UTAUT model (Venkatesh et al., 2003, p. 460). Six
singular (as opposed to composite or grouped) question items were selected from other
instruments in place of Wixom and Todd items, as their wording more closely aligned
with online e-learning technologies (Koh, Prybutok, Ryan, & Wu, 2010, p. 199; Lee,
2008, p. 1436). Lastly, four categorical response items were provided for classifying class
69
sections, and for collecting demographic information, such as gender, age, and prior
Microsoft Office experience (Venkatesh et al., 2003). A complete listing of the survey
constructs, measurement items, and referenced instruments appears in Appendix G.
With the survey being delivered online at the end of the semester (a busy time for
students), the number of compiled items was reduced from 37 down to 25, in order to
improve the potential response rate. As the survey would be analyzed for descriptive
purposes, and not for proving the inferential power of the adjusted model, this reduction
was not deemed threatening to the survey’s validity or reliability. Specifically, individual
question items were removed from each of the six determinant factors (i.e., completeness,
accuracy, format, reliability, accessibility, and integration) appearing to the left of the
object-based beliefs in Figure 3.1. As Wixom and Todd did not report itemized measures
for correlation or internal consistency, the most appropriate items were retained with
respect to context and the item’s perceived explanatory power for the object-based belief
it served. In the end, the object-based beliefs (i.e., information quality and system quality)
retained four items each that could be summed or averaged to create a composite Likert-
scaled item for statistical analysis.
Once the structure of the survey had been finalized, the wording of each item was
edited to reference the instructional context, learning experiences (as opposed to job
performance), and students’ perceptions regarding the use of MyITLab Grader (Moore &
Benbasat, 1991; Xu et al., 2013). The intent of the questions was not changed, so as not
to deviate from the previously defined constructs. Five questions were also rewritten as
negatively-keyed items, phrased in the semantically opposite direction of most other
items in the survey. The rationale for including these negatively-keyed items was to
70
maintain students’ attentiveness and to reduce boredom, but also to reduce the so-called
acquiescence or “yea-saying bias” (Couch & Keniston, 1960). Except for the
categorization questions, the survey employed 7-point Likert-type response items,
ranging from 1 (strongly disagree) to 7 (strongly agree), similar to the Wixom and Todd
instrument (2005). Specifically, the Information Quality, System Quality, Social Norms,
and Attitude constructs present four measurement items each, so that a composite Likert-
scale score may be calculated for analysis. Other constructs employ single- or dual-item
responses for measuring Information Satisfaction, System Satisfaction, Usefulness, Ease-
of-Use, and Intention.
Pre-Testing the Survey Instrument
The student survey instrument was initially developed and printed in Microsoft
Office Word 2010. It was then pre-tested in September, 2011, by four second-year
business students at Okanagan College. Each of the students was selected purposefully,
as they were all past students of the researcher in BuAd 128, and had experience using
MyITLab Grader the previous year. In addition to recording the time required to
complete the survey, handwritten notes were compiled in an informal focus-group
atmosphere with respect to clarity of wording, length of the instrument, scale format, and
the students’ overall comprehension of each survey question. The pre-test meeting
completed in just over one hour and the four volunteers were presented with $10 gift
cards to a local coffee shop. Some minor adjustments were made to the survey questions
as a result of the students’ pre-test comments and suggestions, and the resulting
instrument was deemed ready for conversion to the online survey delivery system.
71
Delivering the Student Survey
The student survey instrument was hosted on the researcher’s personally-managed
Canadian Web server, with adherence to strict Canadian privacy laws and security
guidelines. A free, open-source solution called LimeSurvey (http://www.limesurvey.org)
was selected as the survey management software after an extensive evaluation of several
products. The first step in preparation for online delivery was to divide the paper-based
survey instrument into seven individual screens. First, the survey’s Welcome screen was
prepared with information about the survey and its purpose, along with a respondent
consent form, required by the Research Ethics Board (REB) of Okanagan College. The
Welcome content reminded students that their participation in the study was anonymous,
voluntary, and uncompensated, and that they could withdraw at any time by simply
closing their browser window. As with the classroom observations and instructor
interviews, the student survey had to adhere to the Tri-Council Policy Statement of
ethical conduct for research involving human participants (Canadian Institutes of Health
Research, Natural Sciences and Engineering Research Council of Canada, and Social
Sciences and Humanities Research Council of Canada, 2010).
Immediately following the consent form, four categorical questions were posed to
classify students according to their instructor, gender, age, and a self-assessment of their
prior Microsoft Office skill-level. The following four screens presented the 25 Likert-
type survey questions. A concluding screen thanked respondents and provided further
information on how to contact the researcher directly. After successfully performing
multiple trials of the online delivery and database scoring system, a URL hyperlink was
provided to the BuAd 128 instructors for posting to their course pages within the
72
Blackboard learning management system (LMS). To improve the student response rate, a
prepared email announcement was sent to instructors for dissemination to their class
roster through the LMS. The launch date for the survey was Monday, November 28th,
2011, with a closing date of Friday, December 9th, 2011.
Analysis of Quantitative Data
The student survey instrument serves an exploratory and descriptive function
toward better understanding how students’ feel about MyITLab Grader’s usefulness and
utility. The general approach to producing descriptive statistics entails preparing,
organizing, and then summarizing numerical data (Gall, Gall, & Borg, 2007). For the
student survey, the data set was downloaded from the LimeSurvey website and then
prepared and validated using Microsoft Excel, which involved “cleaning” the data by
removing any empty rows and columns and adding appropriate heading labels.
Fortunately, there were no data items with incomplete results, so all data could be used in
the analysis.
The survey data set was imported into IBM’s SPSS Statistics software (IBM
Corporation, 2016). As the level of measurement for a variable determines which
descriptive statistics and mathematical techniques may be performed, a beginning step in
SPSS was to view the variables and confirm the appropriate measures as Ordinal for
categorical variables and nominal for Likert-type items (Weinberg & Abramowitz, 2008).
Next, the five negatively-keyed Likert-type items were reverse-coded using the SPSS
Transform feature, in order to standardize on a positively-keyed coding schema (2008).
Completing the preparation, four new Scale variables were created for the Likert-scale
interval constructs (Information Quality, System Quality, Social Norms, and Attitude), by
73
summing the Likert-type variables within the construct and then dividing by the number
of items to return average values. The combined constructs were computed using average
values for comparative purposes with the Likert-type items.
The first step in examining the data set was to explore the univariate distributions
using frequency and percent tables and graphics. Bar graphs and histograms were also
produced, along with descriptive statistics for calculating measures of central tendency
(e.g., mean, median, and mode), measures of variability (e.g., standard deviation,
variance, and range), and skewness. After reviewing and analyzing these results, five
number summaries and boxplots were produced for each variable, grouped by instructor
for comparative purposes. As a widely-used measure for computing test score reliability,
Cronbach’s alpha coefficient was calculated for the four Likert-scaled constructs to test
for internal consistency (Gall et al., 2007).
Validity, Reliability, and Bias
By modeling the student questionnaire after the proven Wixom and Todd
integrated research model (2005), the trustworthiness and credibility of the student survey
instrument are greatly enhanced. Validity refers to the ability of an instrument to measure
what you think it is measuring, while reliability measures the repeatability or consistency
of the measurement (Gall et al., 2007). Evidence for the validity and reliability of the
student survey is provided by the fact that the survey builds upon generally accepted
standards for studying technology acceptance and user satisfaction (Davis, 1989; DeLone
& McLean, 2003; Venkatesh et. al, 2003; Wixom & Todd, 2005). Rather than re-
validating individual items and proving its predictive power, the survey results are used
74
instead to describe overall student satisfaction and technology acceptance of MyITLab
Grader within a particular case and context.
As the survey is for descriptive purposes of the BuAd 128 students, the population
is defined as all in-class students within this particular course, as opposed to all computer
freshman students of a computer literacy course. By definition, this survey was delivered
as a census in an attempt to enumerate the entire student population. There were no
probability sampling methods applied and, therefore, no need for inferential statistics.
Similar to sampling, however, there remain opportunities for non-sampling
administrative errors and respondent bias in a census, and especially for online surveys
(Moore & McCabe, 2005). With respect to administrative error, some members of a
population may be undercounted, under-represented, or duplicated, based on the methods
and effort used to reach them (Gall et., 2007). In this study, the online survey was not
able to restrict access to students or computers (filtered by IP address) from completing
the survey more than once. Furthermore, some instructors set aside class time for students
to respond to the survey (in effect, changing voluntary to mandatory), while other
instructors asked students to complete the survey on their own time. As a result, the total
responses may be over-represented for some instructors (i.e., the embedded units under
study) and under-represented for others. Second, online voluntary surveys commonly
suffer from self-selection bias, whereby people with stronger opinions select themselves
to respond while “typical” members of a population do not bother (2005). Measuring the
extent of voluntary response bias is very difficult in online surveys, and often results in
further under-representation for certain groups. Given the unknown extent of these errors,

75
any attempt to generalize outside of the course would obviously be severely limited;
therefore, only descriptive statistics are analyzed and reported.
With respect to the relevance of measuring student acceptance and satisfaction for
a four-year old product, MyITLab Grader is a relatively static product, having not
released a major update to the user interface since 2010 (Kathaleen McCormick, personal
communication, 2016). To illustrate, the 2011 MyITLab Grader assignment screen for
Office 2007 appears in Figure 3.2 and the 2016 MyITLab Grader assignment screen for
Office 2013 appears in Figure 3.3. For all intents and purposes, MyITLab Grader’s
current user experience for delivering tutorials and taking assessments is virtually
identical to the software’s user experience four-years ago. While informational content
may have been updated with version changes of Microsoft Office, the survey results and
analysis remain as valid and relevant today as when the survey was first conducted.
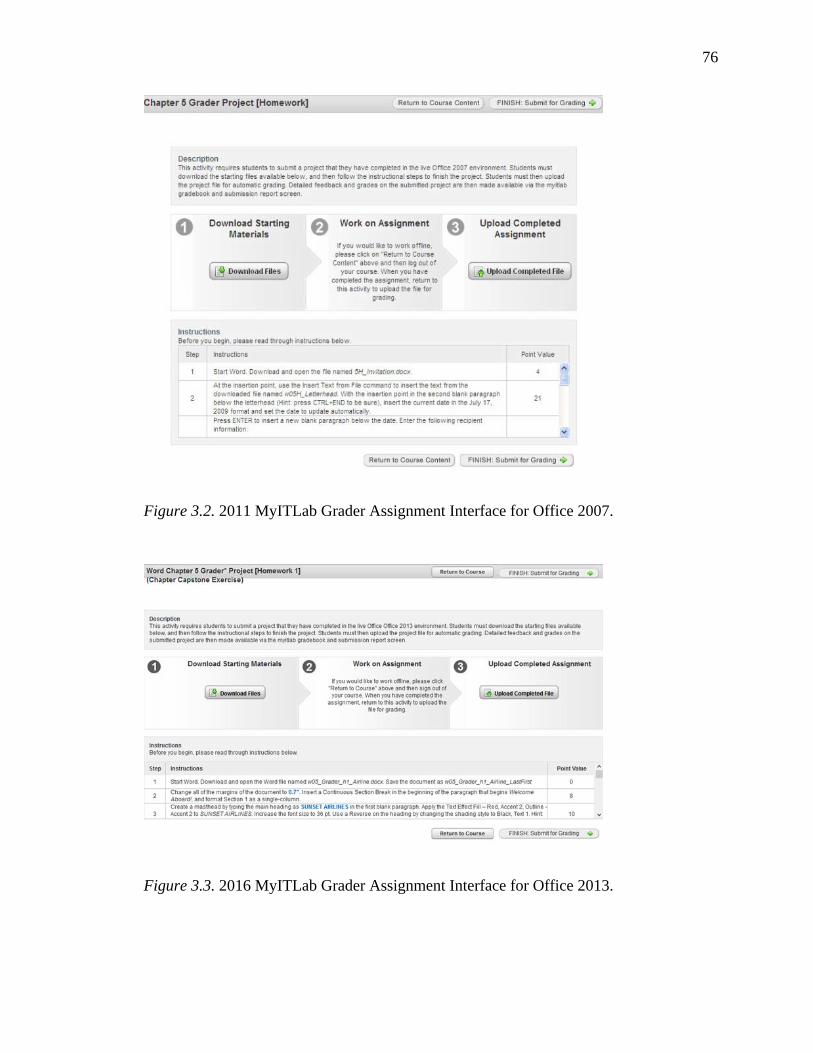
76
Figure 3.2. 2011 MyITLab Grader Assignment Interface for Office 2007.
Figure 3.3. 2016 MyITLab Grader Assignment Interface for Office 2013.

77
CHAPTER 4. RESULTS
Data analysis and summation for case study research consists of “examining,
categorizing, tabulating, testing, or otherwise recombining both quantitative and
qualitative evidence” (Yin, 2003, p. 109). In this chapter, data from documents,
observations, interviews, and surveys are analyzed using techniques appropriate to the
methodological approach used for data collection and aligned to the research purpose.
The resultant goals or outcomes for the analysis include elaborative descriptions and
pattern matching that will speak to instructor and student experiences in using the
automated grading and tutorial software known as MyITLab Grader. The following
chapter then discusses the results collectively in forming analytic generalizations,
reflexive assertions, and responses to the specific research questions.
Document Analysis
Data were collected in the form of syllabi, assignments, and exams from each of
the five instructors of BuAd 128 – Computer Applications. Using a simplified approach
to comparative content analysis, these documents were visually and electronically
compared to one another both in paper form and using software to review the original
data files. For example, the syllabi were collected in Adobe’s PDF format and printed out
for comparison, while the Excel workbooks were opened and compared side-by-side

78
across multiple monitors using Microsoft Excel 2013. This comparative process focused
on the differences between the artifacts for each instructor.
Impacting this analysis, the School of Business at Okanagan College had recently
initiated a “consistency across the curriculum” policy for learning outcomes in first- and
second-year courses, according to the department chair, Laura Thurnheer (personal
communication, 2012). The most significant element of this standardization policy
entailed assigning an experienced, continuing (tenured) professor to each course as the
“course captain,” responsible for preparing the syllabus, assignments, and calendar
schedule for all sections taught in that particular semester. As a result, the BuAd 128 Fall
2011 course sections were captained by one of the instructor participants in this study
(pseudonym withheld for confidentiality). This instructor explained, during the interview,
that he/she was responsible for the following duties:
Revising and distributing the course syllabi to the other instructors,
Preparing the MyITLab online content modules with help from Pearson Education,
Selecting the MyITLab quizzes and Grader projects to be completed by students,
and
Compiling and distributing the exam instructions and data files for Microsoft
Word, Microsoft Excel, and Microsoft PowerPoint.
Further communication with the department chair uncovered additional responsibilities
for the course captain including training instructors on the best (or preferred) practices for
teaching the course, and responding to instructor questions or concerns with respect to
content and grading.
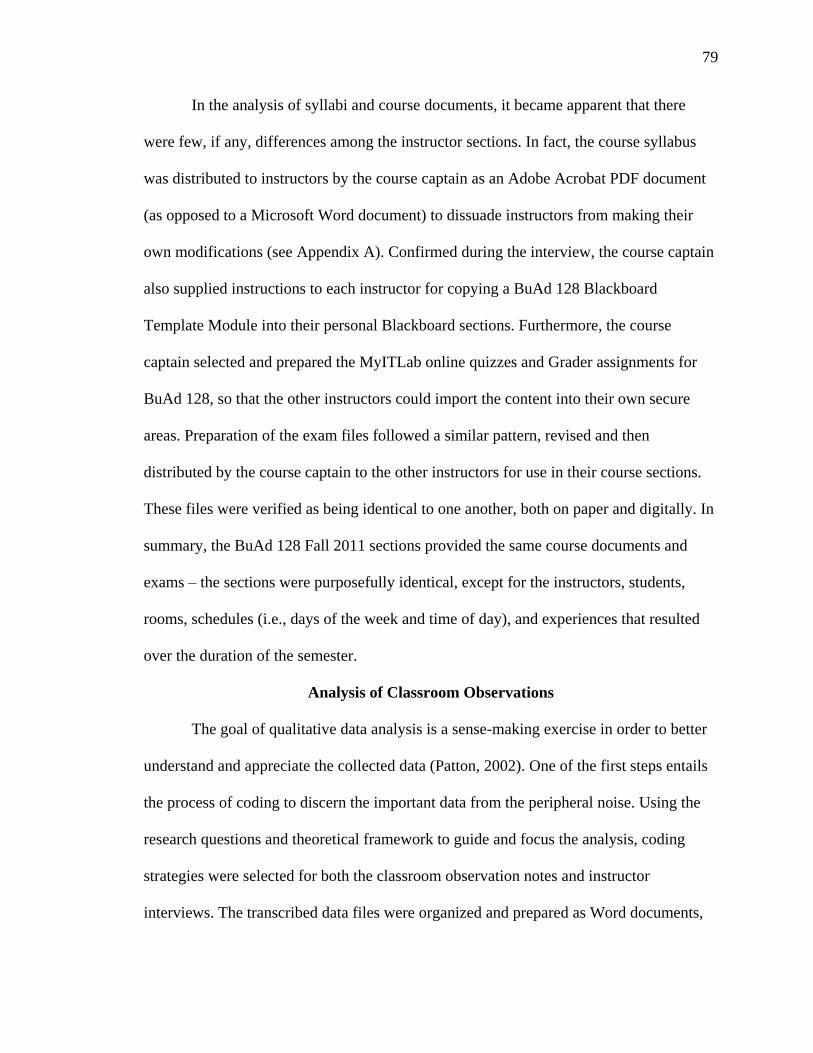
79
In the analysis of syllabi and course documents, it became apparent that there
were few, if any, differences among the instructor sections. In fact, the course syllabus
was distributed to instructors by the course captain as an Adobe Acrobat PDF document
(as opposed to a Microsoft Word document) to dissuade instructors from making their
own modifications (see Appendix A). Confirmed during the interview, the course captain
also supplied instructions to each instructor for copying a BuAd 128 Blackboard
Template Module into their personal Blackboard sections. Furthermore, the course
captain selected and prepared the MyITLab online quizzes and Grader assignments for
BuAd 128, so that the other instructors could import the content into their own secure
areas. Preparation of the exam files followed a similar pattern, revised and then
distributed by the course captain to the other instructors for use in their course sections.
These files were verified as being identical to one another, both on paper and digitally. In
summary, the BuAd 128 Fall 2011 sections provided the same course documents and
exams – the sections were purposefully identical, except for the instructors, students,
rooms, schedules (i.e., days of the week and time of day), and experiences that resulted
over the duration of the semester.
Analysis of Classroom Observations
The goal of qualitative data analysis is a sense-making exercise in order to better
understand and appreciate the collected data (Patton, 2002). One of the first steps entails
the process of coding to discern the important data from the peripheral noise. Using the
research questions and theoretical framework to guide and focus the analysis, coding
strategies were selected for both the classroom observation notes and instructor
interviews. The transcribed data files were organized and prepared as Word documents,

80
stored in Rich Text Format (RTF) for analysis, and then imported into computer-assisted
qualitative data analysis software (CAQDAS) for coding, describing, and reporting on the
data.
The analysis of classroom observations began with an “Eclectic Coding” strategy
that required a two-pass approach for the “First Cycle” coding of data, as advocated by
Saldana (2009). First, using Descriptive coding, topical tags such as
DEMONSTRATION, OPEN LAB, and TROUBLESHOOTING were used to label and
summarize what was going on during the observations. For the second pass, the Initial
(also called Open) coding technique was used to focus line-by-line on the data,
generating codes such as STUDENT-STUDENT INTERACTION, SHARING
PERSONAL EXPERIENCE, and QUESTIONING “WHY”. The MAXQDA (version 12)
software was then used to select, arrange, and print data segments for the 31 generated
codes (VERBI GmbH., 2016). After several sweeps of the data, the most appropriate
codes were chosen, combined, and/or renamed during the “Second Cycle” of Focused
coding to yield the five major categories of 11 codes appearing in Table 4.1. The data
segments assigned to these categories were then analyzed and summarized by instructor
with respect to the similarities and differences that presented themselves, grounded in the
data.

81
Table 4.1
Code Summary for Classroom Observations
Code Identifier Categories and Codes
D01 Setting
Participants
D02 Attitude
D03 Engagement
Interactions
D04 Student-Student
D05 Instructor-Student
D06 Demonstrations
Lab Time
D07 Troubleshooting
D08 Working from Textbook
D09 Working on MyITLab Quizzes
D10 Working on MyITLab Tutorials
D11 Working on MyITLab Grader
Setting and Participants
Most computer labs at Okanagan College are equipped similarly with 40
networked workstations, one instructor workstation, a digital projector and screen, laser
printer, white boards, and fluorescent lighting. However, Susan’s classroom was
scheduled in an awkwardly-configured computer lab with 30 workstations. Her room was
long and narrow with three banks of 10 computers each, separated by a wide walkway
down the center of the room. The instructor workstation was placed in the top right-hand
corner (assuming one is facing the projection screen), far away from students in the
bottom left-hand corner of the room. With an enrolment of 35 students and only 30
82
workstations, Susan had to ask students to bring their personal portable computers from
home, in order to complete the assigned work. Furthermore, she began the observed class
by informing students that the building was once again experiencing “Internet
connectivity problems,” so patience would be needed.
While registrations ranged from 26 to 35 students per class section, the observed
attendance figures were between 16 and 25 for each of the five instructors. For the most
part evenly split by gender, students were primarily Caucasian, in their early 20s, and
with relatively few visible minorities or international students. At this late point in the
semester, friendships had already been formed as students clustered into pods of two to
four people around the computer lab. Generally speaking, half of the students brought
their textbooks to class; however, only six of the 23 students did so in Andrew’s class.
Lecture Demonstration and Student Engagement
All of the instructors began their class by introducing the session’s agenda, and
then proceeded through a guided demonstration of the content lasting between 45 minutes
to one hour. The remainder of the two-hour class was left for “Open Lab” time to
complete the assigned work. With the application software projected on the screen under
dimmed lighting, most instructors used a “Show Me/Guide Me” method for lecture and
demonstration purposes. Students were directed to download and open data files, and
follow along step-by-step as the instructor performed the exercise from a workstation at
the front of the room. Andrew and Peter were the only instructors who used their own
data files and examples, while other instructors simply selected an exercise out of the
textbook. Because of Susan’s awkward room layout, she appointed a student to perform
the designated steps from the instructor’s corner workstation. She then stood at the front
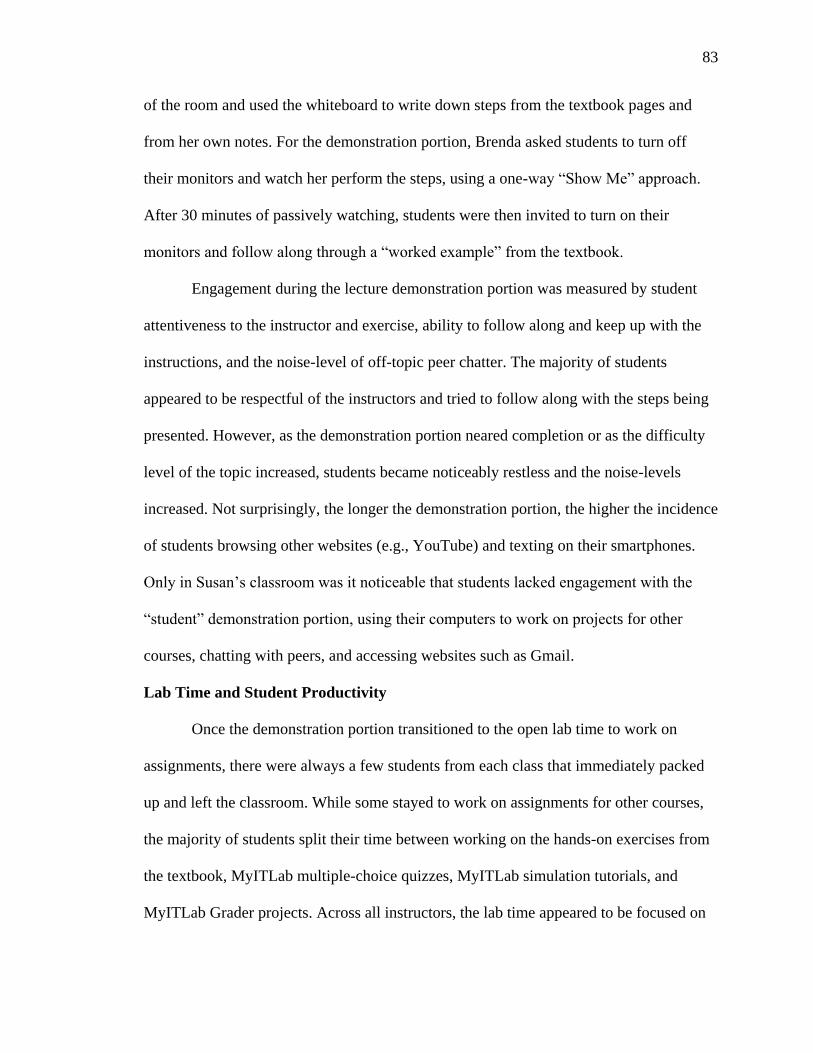
83
of the room and used the whiteboard to write down steps from the textbook pages and
from her own notes. For the demonstration portion, Brenda asked students to turn off
their monitors and watch her perform the steps, using a one-way “Show Me” approach.
After 30 minutes of passively watching, students were then invited to turn on their
monitors and follow along through a “worked example” from the textbook.
Engagement during the lecture demonstration portion was measured by student
attentiveness to the instructor and exercise, ability to follow along and keep up with the
instructions, and the noise-level of off-topic peer chatter. The majority of students
appeared to be respectful of the instructors and tried to follow along with the steps being
presented. However, as the demonstration portion neared completion or as the difficulty
level of the topic increased, students became noticeably restless and the noise-levels
increased. Not surprisingly, the longer the demonstration portion, the higher the incidence
of students browsing other websites (e.g., YouTube) and texting on their smartphones.
Only in Susan’s classroom was it noticeable that students lacked engagement with the
“student” demonstration portion, using their computers to work on projects for other
courses, chatting with peers, and accessing websites such as Gmail.
Lab Time and Student Productivity
Once the demonstration portion transitioned to the open lab time to work on
assignments, there were always a few students from each class that immediately packed
up and left the classroom. While some stayed to work on assignments for other courses,
the majority of students split their time between working on the hands-on exercises from
the textbook, MyITLab multiple-choice quizzes, MyITLab simulation tutorials, and
MyITLab Grader projects. Across all instructors, the lab time appeared to be focused on
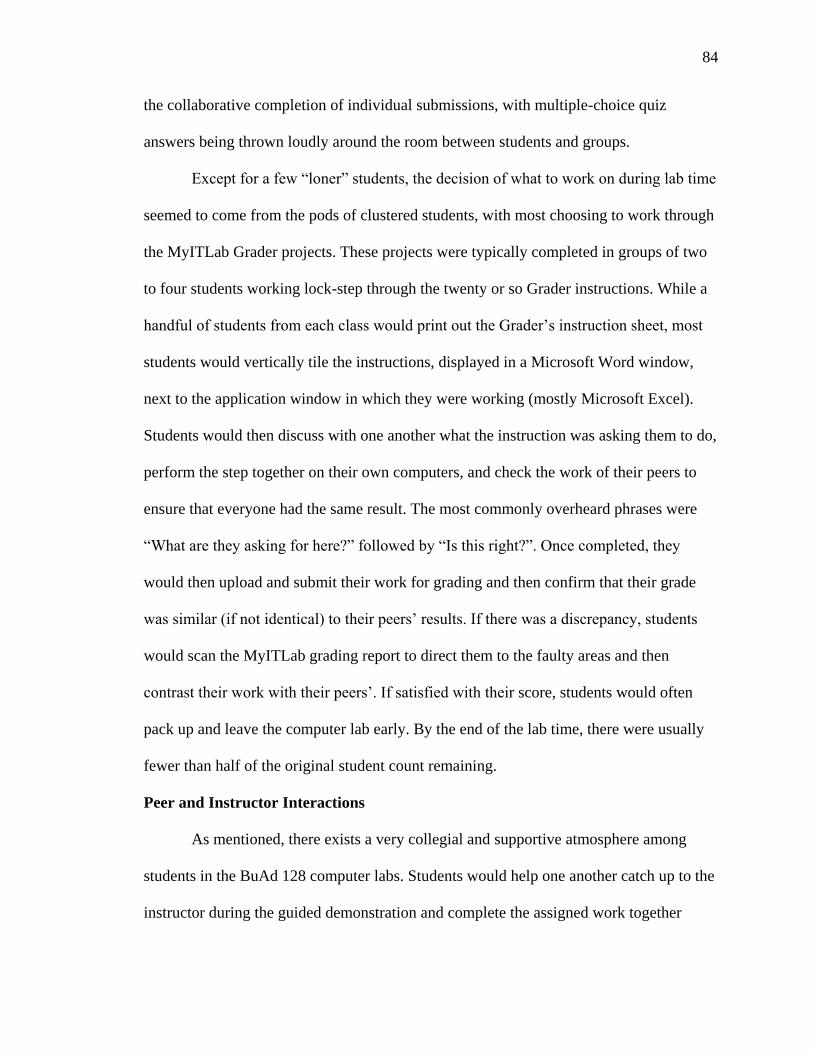
84
the collaborative completion of individual submissions, with multiple-choice quiz
answers being thrown loudly around the room between students and groups.
Except for a few “loner” students, the decision of what to work on during lab time
seemed to come from the pods of clustered students, with most choosing to work through
the MyITLab Grader projects. These projects were typically completed in groups of two
to four students working lock-step through the twenty or so Grader instructions. While a
handful of students from each class would print out the Grader’s instruction sheet, most
students would vertically tile the instructions, displayed in a Microsoft Word window,
next to the application window in which they were working (mostly Microsoft Excel).
Students would then discuss with one another what the instruction was asking them to do,
perform the step together on their own computers, and check the work of their peers to
ensure that everyone had the same result. The most commonly overheard phrases were
“What are they asking for here?” followed by “Is this right?”. Once completed, they
would then upload and submit their work for grading and then confirm that their grade
was similar (if not identical) to their peers’ results. If there was a discrepancy, students
would scan the MyITLab grading report to direct them to the faulty areas and then
contrast their work with their peers’. If satisfied with their score, students would often
pack up and leave the computer lab early. By the end of the lab time, there were usually
fewer than half of the original student count remaining.
Peer and Instructor Interactions
As mentioned, there exists a very collegial and supportive atmosphere among
students in the BuAd 128 computer labs. Students would help one another catch up to the
instructor during the guided demonstration and complete the assigned work together
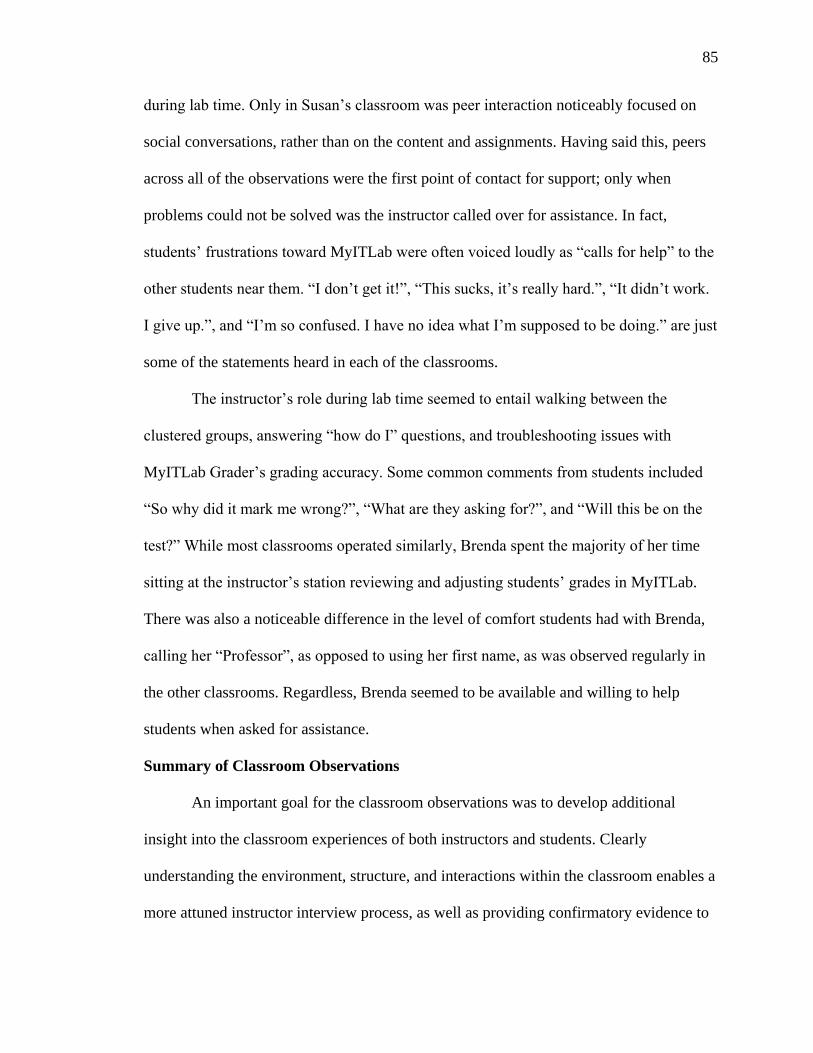
85
during lab time. Only in Susan’s classroom was peer interaction noticeably focused on
social conversations, rather than on the content and assignments. Having said this, peers
across all of the observations were the first point of contact for support; only when
problems could not be solved was the instructor called over for assistance. In fact,
students’ frustrations toward MyITLab were often voiced loudly as “calls for help” to the
other students near them. “I don’t get it!”, “This sucks, it’s really hard.”, “It didn’t work.
I give up.”, and “I’m so confused. I have no idea what I’m supposed to be doing.” are just
some of the statements heard in each of the classrooms.
The instructor’s role during lab time seemed to entail walking between the
clustered groups, answering “how do I” questions, and troubleshooting issues with
MyITLab Grader’s grading accuracy. Some common comments from students included
“So why did it mark me wrong?”, “What are they asking for?”, and “Will this be on the
test?” While most classrooms operated similarly, Brenda spent the majority of her time
sitting at the instructor’s station reviewing and adjusting students’ grades in MyITLab.
There was also a noticeable difference in the level of comfort students had with Brenda,
calling her “Professor”, as opposed to using her first name, as was observed regularly in
the other classrooms. Regardless, Brenda seemed to be available and willing to help
students when asked for assistance.
Summary of Classroom Observations
An important goal for the classroom observations was to develop additional
insight into the classroom experiences of both instructors and students. Clearly
understanding the environment, structure, and interactions within the classroom enables a
more attuned instructor interview process, as well as providing confirmatory evidence to

86
the instructor interviews and student survey results. The primary differences in terms of
themes or patterns that arose in the analysis seemed to center on Brenda’s and Susan’s
classrooms. The three male instructors seemed to share similar rooms, teaching styles, lab
processes, and interactions with students. Brenda’s classroom, on the other hand, seemed
more passive and structured, almost sterile. While the demonstrated content seemed
competently delivered, the student-student interactions during lab time were quieter, and
the instructor-student interactions were less frequent than in other classrooms. Susan’s
classroom experience seemed to be challenging for both herself and her students. Located
in a new building apart from the other classrooms, Susan had to deal with a poorly-
configured computer lab, network connectivity issues, and a student cohort who did not
seem engaged with the material. Another prevalent theme was the expressive voicing of
student frustrations with MyITLab to one another. While these viewpoints may have been
announced prominently for the benefit of the observer, meetings with the individual
instructors after each observation confirmed that it was a “typical class” and those were
“typical comments.” These summations will serve to further inform the analysis of
instructor interview data, which follows.
Analysis of Instructor Interviews
As with the observation data, the interview transcripts were imported, organized,
and coded using the MAXQDA software (VERBI GmbH., 2016). The analytical process
followed the guidelines presented by Saldana (2009) for employing Structural and
Provisional coding of interview data. Table 4.2 summarizes the structural codes revealed
after several passes through the “First Cycle” coding of transcripts. The four code
categories mirror the line of questioning presented in the interview protocol, but with the
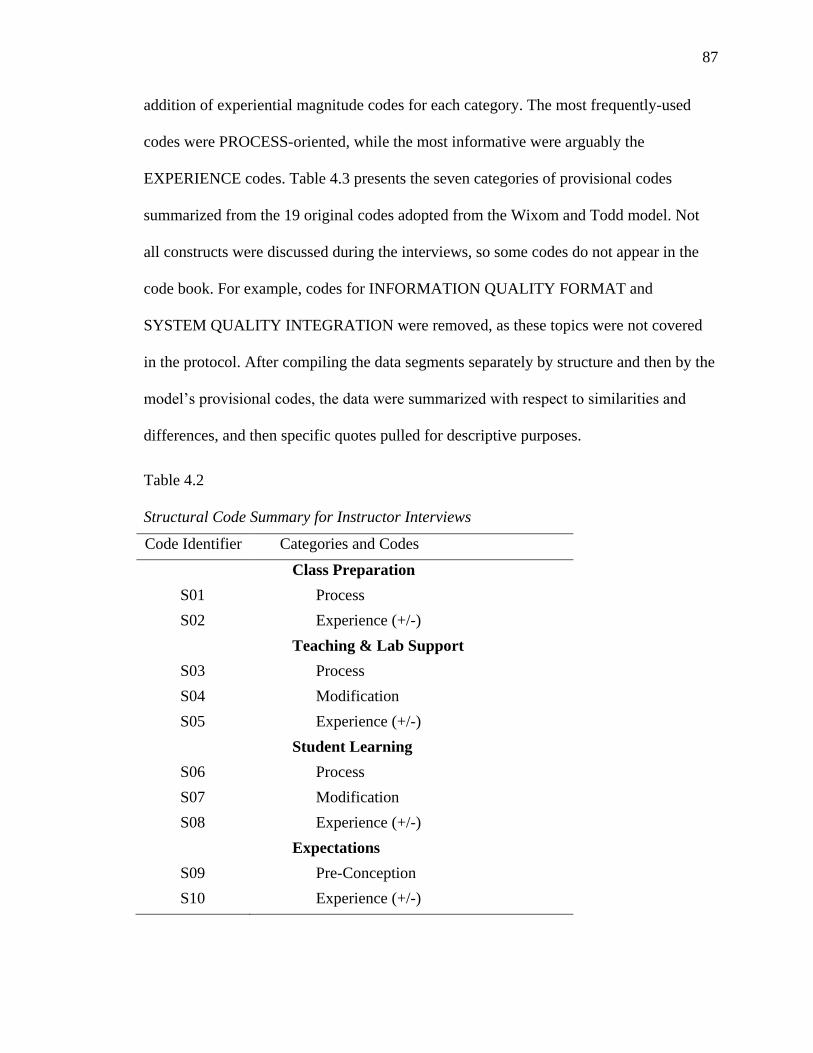
87
addition of experiential magnitude codes for each category. The most frequently-used
codes were PROCESS-oriented, while the most informative were arguably the
EXPERIENCE codes. Table 4.3 presents the seven categories of provisional codes
summarized from the 19 original codes adopted from the Wixom and Todd model. Not
all constructs were discussed during the interviews, so some codes do not appear in the
code book. For example, codes for INFORMATION QUALITY FORMAT and
SYSTEM QUALITY INTEGRATION were removed, as these topics were not covered
in the protocol. After compiling the data segments separately by structure and then by the
model’s provisional codes, the data were summarized with respect to similarities and
differences, and then specific quotes pulled for descriptive purposes.
Table 4.2
Structural Code Summary for Instructor Interviews
Code Identifier Categories and Codes
Class Preparation
S01 Process
S02 Experience (+/-)
Teaching & Lab Support
S03 Process
S04 Modification
S05 Experience (+/-)
Student Learning
S06 Process
S07 Modification
S08 Experience (+/-)
Expectations
S09 Pre-Conception
S10 Experience (+/-)
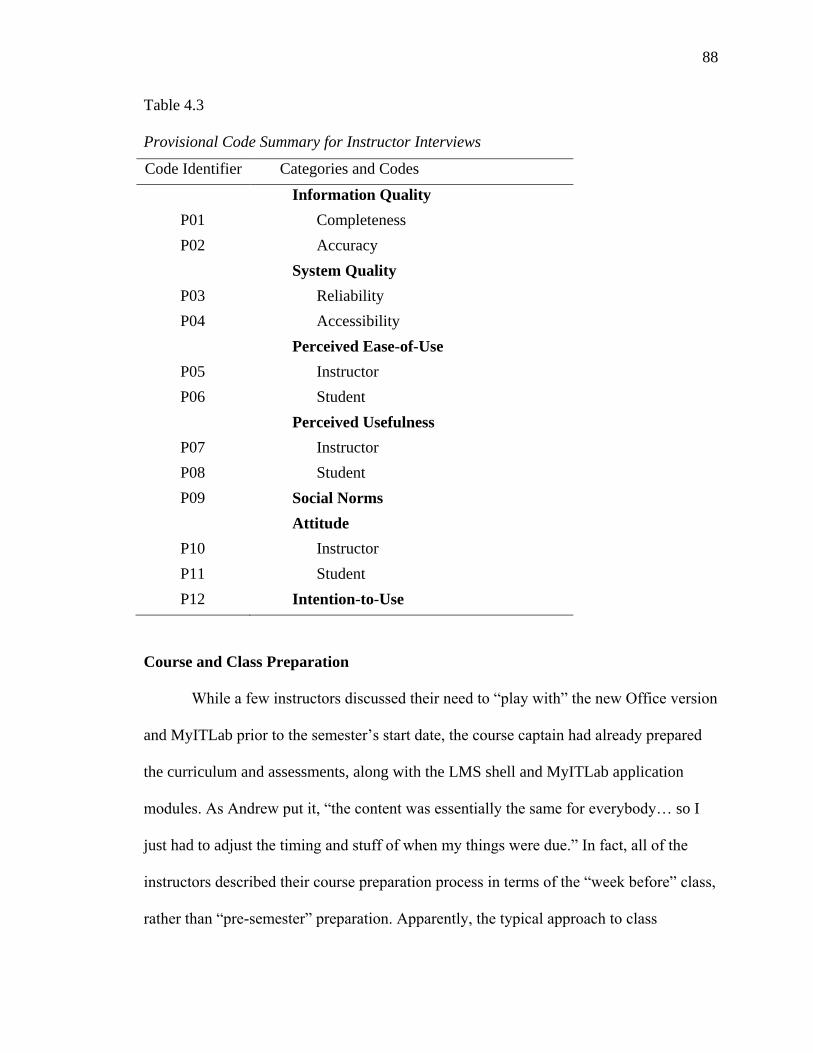
88
Table 4.3
Provisional Code Summary for Instructor Interviews
Code Identifier Categories and Codes
Information Quality
P01 Completeness
P02 Accuracy
System Quality
P03 Reliability
P04 Accessibility
Perceived Ease-of-Use
P05 Instructor
P06 Student
Perceived Usefulness
P07 Instructor
P08 Student
P09 Social Norms
Attitude
P10 Instructor
P11 Student
P12 Intention-to-Use
Course and Class Preparation
While a few instructors discussed their need to “play with” the new Office version
and MyITLab prior to the semester’s start date, the course captain had already prepared
the curriculum and assessments, along with the LMS shell and MyITLab application
modules. As Andrew put it, “the content was essentially the same for everybody… so I
just had to adjust the timing and stuff of when my things were due.” In fact, all of the
instructors described their course preparation process in terms of the “week before” class,
rather than “pre-semester” preparation. Apparently, the typical approach to class
89
preparation was for instructors to select exercises and data files that would be used for
demonstrations that week, and then to prepare the lecture notes of what needed to be
covered, assigned, and completed.
Regarding MyITLab, three of the instructors (Andrew, Brenda, and Peter)
completed the first few Grader projects to confirm the trustworthiness of the system, with
Peter stating “just the first few, and just out of curiosity, to make sure that it was grading
properly; as did a couple of other profs, and they found the same thing. It was grading
just fine.” Scott and Susan, on the other hand, commented that they felt the need to
complete each and every student assignment in MyITLab, in order to be able to respond
to student questions in-class. Susan was the only instructor to mention how her class
preparation changed “part way through the semester,” to cover “more about what I
thought was important” rather than the prepared curriculum. She had also struggled with
the MyITLab Grader projects, stating “I would always submit it for grading and I
couldn’t figure out why I was losing marks, because I was pretty sure that I did
everything right. And, I’m going, well if I can’t figure it out, they’re going to be totally
frustrated!” Susan did concede, however, that she had not taught the course in six years,
unlike her peers, and was less comfortable with the Office software and technical aspects
of the material.
When asked to compare the level of preparation to previous semesters, the
instructors did not perceive any significant differences in either the time or effort required
to prepare for the semester or for the weekly classes. Andrew explained, “…working with
MyITLab didn’t really impact the content delivery.” Scott concurred that moving to
90
MyITLab “didn’t really add to the workload” in terms of class preparation, as did Brenda
who thought that it was “about the same” as previous years.
Teaching and Lab Support
Four of the five instructors followed a similar pattern with respect to their in-class
lesson structure and instructional approach. The majority described demonstrating the
most important and relevant software features to students in the first 45 minutes to one
hour of class time, and then “letting them loose” in the second hour to apply these
features and to work on their assignments (e.g., MyITLab Grader projects). For
demonstrations, Andrew attempted to introduce “real world experiences” and “as many
different things as I can get my hands on” to keep students engaged, including past
workbooks that he had created for clients. Being the odd person out, Susan found that her
students were attending the Wednesday class, but often skipping Friday afternoons.
Therefore, her solution was to emphasize the teaching of new content on Wednesdays,
and to provide only review and lab time on Fridays. In reflection, Susan divulged “I
really struggled with the whole course… I never found a method [or structure] that
worked for them…, and it wasn’t [long before] they had figured out that I wasn’t going to
teach them anything new on Friday.” Both Peter and Scott also revealed that they had
changed their classroom approach for teaching Microsoft PowerPoint. The two
instructors had dropped the MyITLab Grader projects and produced their own examples
and exercises to focus the class on specific content that they felt students needed to know.
Peter’s argument was that “most important to me is that they understand why this is
relevant” and, sometimes, the “skills that we test, don’t really fit” with what MyITLab
Grader assesses.

91
Each instructor also stressed the importance of fostering a collaborative classroom,
whereby students were “encouraged to help one another” during the demonstrations and
lab assignments. Andrew explained his stance as, “if they can’t figure something out,
[they should] ask the person beside them, ask a bigger group of people, [ask] Google,
look in the book, and then ask me.” Scott adopted a similar position: “My policy was if
they skipped right to MyITLab, I wouldn’t help them with it. They had to show me first
that they did the [textbook] exercises… I wanted them to get peer-reviewed from the
friend sitting next to them first.” Scott’s justification was that the MyITLab Grader
projects provided comprehensive “feedback that students could access after the class” or
at home, but that the lab time provided an opportunity to learn from and assist one
another.
Most of the instructors acknowledged that they needed to adjust their teaching in
order to “focus on the Grader projects, as it was the one that counted” for term work. As
Peter noted, “I’m here to help, but the end result is that [students] are going to be marked
on what [they] do in the Grader.” For “[students] who did one out of five” Grader
projects, he continued, “their marks were low,…but if you were getting 90s and 100s [in
Grader], you passed the class.” In line with this comment, Susan admitted to “teaching to
the Grader projects, absolutely!” for her students’ benefit and Andrew described his need
to make “minor adjustments based on what they were going to be assessed on.” However,
after a brief pause, Andrew followed up with “And I don’t believe that’s how we should
be doing things!” Only Brenda did not feel the need to adjust her lesson coverage to meet
the assessment requirements of MyITLab.
92
Student Learning and Assessment
When asked about their perceptions regarding student learning and performance,
instructors generally divided the student body into two types: the “keeners” and the “kids.”
The keeners were described by both Andrew and Peter as “more mature students” who
“tended to come prepared” for class. This group completed their assigned work and used
the feedback provided by MyITLab Grader to improve upon their scores. The “high-
school kids,” on the other hand, were described by Peter as the “younger generation, that
while they may type better,…they don’t realize that the skills they’re learning here aren’t
things that they’ve learnt previously.” Andrew reported that, out of his 93 students, only
eight or nine had completed the optional simulation tutorials in MyITLab, while Peter
found that only three of his students had engaged the tutorials. Peter further explained
that “with first year students,…it’s just about getting the grade,” so they would call a
friend over to “click, click, click, and that’s it. They haven’t really learned how to do it,
they just want to get the Grader project done.” Scott confirmed this assessment, stating
that “Some students view it more in the sense that they want to learn the material,” while
other students focus on “getting the highest grade, regardless of whether or not their
friend told them exactly what to do.” Scott followed up with, “they think they’ll be able
to figure it out later,” but that was rarely the case. All of the instructors agreed that the
majority of students had not read the chapters prior to class or completed the hands-on
practice exercises available in the textbook.
One of the more interesting discussions revolved around the transfer of learning
that occurred from MyITLab Grader formative assessments to the summative exams.
According to all instructors, students who successfully completed the assigned work in

93
MyITLab Grader seemed to do better on the exams, but that did not necessarily mean that
they earned high scores. Peter recalled students approaching him after class with “I got
90% on the MyITLab Grader stuff, so why did I do so poorly on the test?” While this
may have had something to do with the “kids” discussion in the previous paragraph,
Andrew believed that there existed a “big disconnect between MyITLab” and the exams
(also referred to as quizzes). He explained that “MyITLab gives you 24 steps and, at the
end, you have a result that is then graded. In our quizzes, we generally present problems
that you have to solve” through the application of the software to a scenario. Peter also
supported the differences between the “prescriptive, step-by-step Grader” approach
versus the problem-based module exams. However, Susan defended the task-based
similarities between the two assessments, feeling that neither was truly “problem-based.”
Susan also disagreed with her students who told her “the quiz was nothing like the Grader
projects or the work they’d been doing on their own.” While she did grant that the Grader
projects may have been “too simplistic,” Susan believed the disconnect may have been
related to how the topics were taught and whether the content and structure was properly
aligned with the learning outcomes.
Scott returned the spotlight onto the students and how they approached the
material, stating that it depended on “how much they allowed a friend to guide them
[through Grader] without understanding what they were doing.” Peter also argued for
accountability from the individual students, but at the same time lauded the collaborative
peer environment. Both Scott and Brenda believed that the content, supplementary
material, and instructor support were made available for students to learn the software
successfully, but that it was up to the students to put in the effort. Brenda later clarified,

94
however, that the difficulty-level of the content was also a significant factor: “Word and
PowerPoint [are] relatively simple. I don’t think there was a major issue that we didn’t
prepare them for. Excel’s always the problem.” Susan confirmed this sentiment stating
that her class quite enjoyed MyITLab until Excel; after which, “they hated it and they
were really mad at me.” Andrew expressed that his class had fun with PowerPoint with
“most of them [getting] 100 on each of the assignments.” Unfortunately, Peter’s and
Scott’s classes did not get to use MyITLab Grader for PowerPoint, which may or may not
have impacted their final attitudes toward the software.
Information Quality and Satisfaction
Focusing the inquiry on the MyITLab software itself, the quality of information
was discussed in terms of two key attributes: completeness of the feedback information
and accuracy of the student grading reports. For the most part, the instructors believed
that the software provided timely and quality feedback to students. Andrew appreciated
that the feedback was “tied specifically to what they did and [that] they got it
immediately” after completing the project, but felt that a larger “acceptable solution bank”
would have helped in terms of grading accuracy. Scott also expressed his satisfaction
with the student grading and feedback reports, commenting that many students seemed to
be using the reports successfully in-class and that he had “not heard any complaints.” On
the other hand, Susan seemed concerned that students were “not given enough detail to
figure out what they had done wrong” and, therefore, were not able to self-correct their
work without her assistance. Like Andrew, she felt that a wider and more comprehensive
solution bank would be helpful, so that students could “answer something in more than
one way” to get the points.

95
MyITLab Grader’s grading accuracy provided far more controversy and
frustration among both instructors and students. While a couple of instructors were
delighted with how far the software had come since they had previously used it, others
expressed their frustration in dealing with student complaints. Scott spoke expressively
about how “the previous version was absolutely brutal” in comparison, and that he was
now quite satisfied with the grading accuracy. Andrew rationalized to students that, “you
have to understand there are always eight different ways to do things, especially in Excel.
And, it’s looking for you to follow an instruction in a very particular way.” Brenda found
the grading accuracy to be “pretty good,” only having to adjust “four grades through the
whole semester.” “When it works, it’s very good,” noted Peter, although he ended up
instituting a blanket policy of adding 5% to each student’s score halfway into the
semester in order to cover potential grading errors and ward off student complaints.
Andrew also began “fixing students’ grades” at first, but then stopped after he found the
time spent doing this in MyITLab had negatively impacted his availability to work with
students during lab time. In fact, a few instructors commented on how lab time had
become more about troubleshooting MyITLab’s grading reports than helping students
learn the software, which required them to change their approach.
System Quality and Satisfaction
With respect to system quality, the inquiry process focused on the software’s
reliability and accessibility in the computer labs. The instructors again perceived the
software to be high quality and were generally satisfied with its performance. There were
no issues of instability or reported crashes during the semester, other than a few slow
network days experienced by Andrew and Susan (which could not be attributed to
96
MyITLab). “When we started using MyITLab three years ago,” recalled Peter, “stability
was the key issue. It was very unstable!” Continuing, he described how some students
had to wait 20 to 40 minutes for exercises and projects to load in their Web browsers.
Now, the system has “worked flawlessly 90 to 95% of the time. So, when you consider
that compared to what we were doing before, I’m quite happy.” The instructor
perceptions related to accessibility were also positive. The system was always online and
ready according to Andrew, but Brenda and Peter mentioned some issues students
experienced in getting the software to work correctly on Apple computers. Related to this
point, a few instructors expressed their disappointment with the technical support services
provided by Pearson Education, when asked questions about system compatibility and
access to MyITLab from home computers.
Perceived Ease of Use and Usefulness
From the instructors’ standpoint, MyITLab did not present any insurmountable
challenges in terms of ease-of-use. While there were comments from Brenda and Scott on
the time-consuming nature of exporting student grades, the majority of instructors found
no issues in learning to use the administrative panel or gradebook. Susan was the least
experienced with MyITLab, as exemplified by her comment “I didn’t know how to edit
their grades when the Grader messed up… That’s something I didn’t teach myself in
August (laughs).” She also had difficulty moving “stuff in and out of the course, that I
shouldn’t have been doing… I don’t think I really understood how that all worked.” She
had later discovered that the course captain had done all the “moving [of content] that
was required.” The instructors believed that MyITLab was also relatively easy for
students to navigate. Except for some difficulties finding and interpreting the detailed

97
grading feedback, as noted previously by Andrew and Susan, students seemed
comfortable opening and completing the assignments.
With respect to usefulness, the instructors were unanimous in their belief that the
MyITLab Grader software was a worthwhile tool for both teaching and learning
Microsoft Office. For Scott, one of the key benefits was that the feedback and reporting
system “lessened the amount of time he needed to spend with students” getting caught up.
Students could go home and review the grading reports and figure out for themselves
where they had gone wrong. Not surprisingly perhaps, Susan believed that she “could
have done it better” in regards to providing students with useful feedback, but admitted
that “the workload would be a problem.” Brenda also focused on the workload
advantages, explaining that with MyITLab students “get graded on a regular basis, not
just every one or two weeks or so, but actually every chapter that we cover [has] an
opportunity to practice that gets evaluated… I couldn’t possibly grade those by myself.”
Peter described these benefits further, “If you have two sections, you’re going to end up
with 80 students, twice a week, so there’s 160 things to mark each week and it just
couldn’t be done… That’s why we went to the Grader system.” And, the result concluded
Peter was that the weekly grading workload was “almost eliminated this term” by
MyITLab and had “better accuracy than me trying to grade all of them in a week.” Peter
also believed that the software provided evidence of students’ efforts in the course,
stating “when students complain, I can look and say ‘you only did four of the 11 chapters
in MyITLab,’ and that’s a huge justification to be able to tell students that’s why you
struggled on this [exam].”

98
When asked about the perceived benefits or usefulness to students, Andrew
explained that “it’s a great tool to have them sit there in lab with their hands on the
keyboard, interacting with Excel… And the fact that they get an evaluation of what they
did immediately after it is a positive… They don’t have to wait a week” to learn if they
did it correctly, since the “feedback and assessment are tied directly to the activity in an
immediate way.” Brenda also felt that benefit was “just being able to practice, but still get
feedback.” Similarly, Peter liked the fact that students “had something to do every class”
with a grade attached. “I think from the students’ perspective,” explained Scott, “you can
finish it at midnight on Sunday or whatever, and you’ll still get some feedback.” Students
can “learn at their own pace.” Susan also felt that MyITLab provided a “cool” alternative
for students to a textbook exercise, but felt that her implementation of MyITLab did not
elicit the same benefits that students in other classes may have experienced.
Social Influences, Attitudes, and Intentions
With respect to social peer pressure, the instructors did not communicate that they
felt pressured to use MyITLab and, in fact, Peter and Scott removed it from their
PowerPoint modules entirely. However, the course captain did exert some compliance
pressure halfway through the term, via an email directive, regarding the adjustment of
MyITLab grades. It seemed that one or two instructors were “gifting” assignment points
only to those students who “whined” loudly enough. Concerned with the fairness of this
practice, the course captain directed professors to formalize a classroom policy that was
equitable to all students and not only to those who complained.
Susan’s classroom had the most distinct culture in comparison to other
instructors’, whereby “10 high achievers were pretty vocal… and when they got
99
frustrated, they communicated that, and they felt that they weren’t learning anything”
using MyITLab. Statements from this group, according to Susan, greatly impacted other
students’ attitudes in the class. As noted previously, Susan’s class “did not like
[MyITLab] as a whole, but not until they got to that failing exam.” However, she felt
obliged to continue using the software, since the students had paid “money for the
textbook and [MyITLab] code, so you have to use it or else they’re angry.”
Unsurprisingly, Susan would not recommend using MyITLab Grader as an assessment
tool, even though she did value the “extra practice that it provided” as a tutorial.
While Andrew’s overall assessment of MyITLab was relatively positive and he
recommended its continued use, he also felt that it may be necessary to “change the way
we use it.” He also believed that some of his students thought “MyITLab sucked and
hated it, and on a scale of one to five would give it a zero.” However, “other students
didn’t have a low opinion of it” and it seemed to work fine for them. Meanwhile, Brenda
was decidedly for the continued use of MyITLab in future semesters, and both Peter’s
and Scott’s overall impression was “favorable.” Peter projected his students’ acceptance
of MyITLab as being “very positive” with “90% of the students being as happy as could
be.” Scott also recommended the continued use of MyITLab but was somewhat more
tentative, explaining that “when it’s right, there are no issues. But as soon as something
goes wrong,… [students] lose confidence in the system. It really freaks them out.”
However, Scott admitted that “overall, the complaints were never that they didn’t like
MyITLab. The complaints were that ‘I didn’t get the grade’.” Evidently, four of the five
instructors’ opinions and attitudes were favorable toward the MyITLab Grader software,
with each of them recommending its continued use for BuAd 128.
100
Summary of the Instructor Interviews
Implementing a new, innovative technology into a performance-based classroom
environment is rarely an easy and straight-forward undertaking. However, the consensus
among these instructors was that MyITLab Grader proved to be a valuable educational
technology. The software was believed to be successful in enhancing student learning
with frequent and continual feedback, while reducing the instructors’ grading workload.
While there were some software quality issues in terms of student grading accuracy,
instructors were able to adjust their practices to deal with these challenges and focus
instead on the greater benefits. As noted in the analysis of observations, Susan’s difficult
classroom environment, lack of training in MyITLab, and lack of familiarity with
teaching Office seemed to contribute to her (and her students’) negative attitude and
experiences with MyITLab Grader. Given this qualitative picture of instructor
experiences, it’s now time to investigate and add to our understanding of students’
perceptions and attitudes towards MyITLab, through the quantitative analysis of the
student survey results.
Analysis of Student Surveys
As in the analysis of observations and interviews, the case study methodology
uses quantitative data analysis to inform analytic generalizations through description,
pattern matching, explanation building, and cross-case synthesis (Yin, 2003). The
quantitative survey results and analyses provide evidence of the perceived educational
experiences of students with respect to MyITLab Grader. The following sections reveal
not only a summary of the survey results, but serve to enlighten the previous qualitative
descriptions from the student perspective.
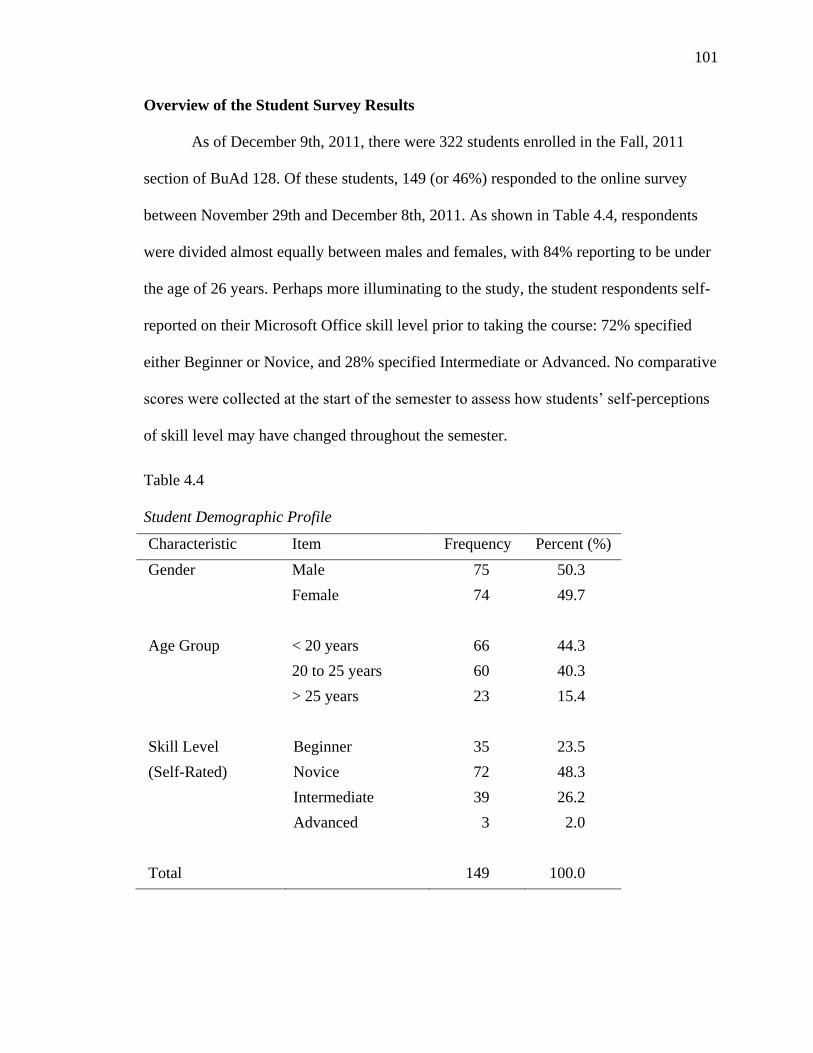
101
Overview of the Student Survey Results
As of December 9th, 2011, there were 322 students enrolled in the Fall, 2011
section of BuAd 128. Of these students, 149 (or 46%) responded to the online survey
between November 29th and December 8th, 2011. As shown in Table 4.4, respondents
were divided almost equally between males and females, with 84% reporting to be under
the age of 26 years. Perhaps more illuminating to the study, the student respondents self-
reported on their Microsoft Office skill level prior to taking the course: 72% specified
either Beginner or Novice, and 28% specified Intermediate or Advanced. No comparative
scores were collected at the start of the semester to assess how students’ self-perceptions
of skill level may have changed throughout the semester.
Table 4.4
Student Demographic Profile
Characteristic Item Frequency Percent (%)
Gender Male 75 50.3
Female 74 49.7
Age Group < 20 years 66 44.3
20 to 25 years 60 40.3
> 25 years 23 15.4
Skill Level Beginner 35 23.5
(Self-Rated) Novice 72 48.3
Intermediate 39 26.2
Advanced 3 2.0
Total 149 100.0
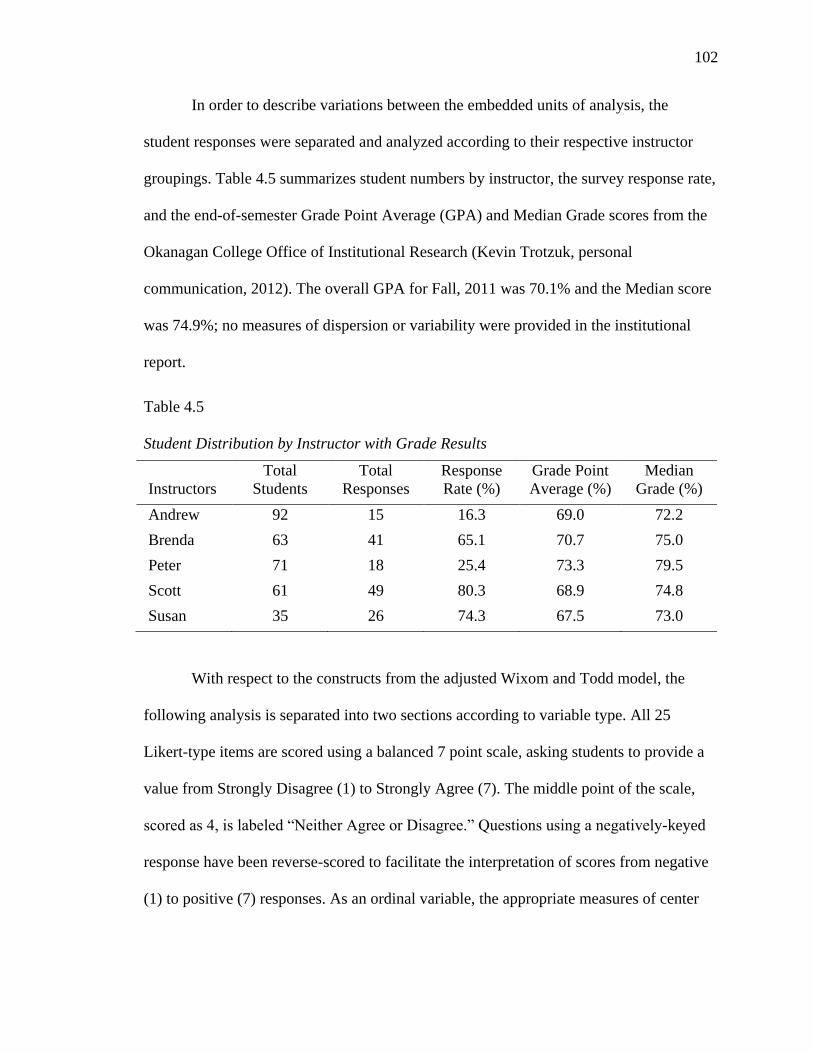
102
In order to describe variations between the embedded units of analysis, the
student responses were separated and analyzed according to their respective instructor
groupings. Table 4.5 summarizes student numbers by instructor, the survey response rate,
and the end-of-semester Grade Point Average (GPA) and Median Grade scores from the
Okanagan College Office of Institutional Research (Kevin Trotzuk, personal
communication, 2012). The overall GPA for Fall, 2011 was 70.1% and the Median score
was 74.9%; no measures of dispersion or variability were provided in the institutional
report.
Table 4.5
Student Distribution by Instructor with Grade Results
Instructors
Total
Students
Total
Responses
Response
Rate (%)
Grade Point
Average (%)
Median
Grade (%)
Andrew 92 15 16.3 69.0 72.2
Brenda 63 41 65.1 70.7 75.0
Peter 71 18 25.4 73.3 79.5
Scott 61 49 80.3 68.9 74.8
Susan 35 26 74.3 67.5 73.0
With respect to the constructs from the adjusted Wixom and Todd model, the
following analysis is separated into two sections according to variable type. All 25
Likert-type items are scored using a balanced 7 point scale, asking students to provide a
value from Strongly Disagree (1) to Strongly Agree (7). The middle point of the scale,
scored as 4, is labeled “Neither Agree or Disagree.” Questions using a negatively-keyed
response have been reverse-scored to facilitate the interpretation of scores from negative
(1) to positive (7) responses. As an ordinal variable, the appropriate measures of center

103
are either the mode or median, while measures of variability may use either the range or
interquartile range (IRQ) (Moore & McCabe, 2005). When a single Likert-type item,
however, is combined with three or more additional questions measuring the same
construct, the result is a composite Likert-scale variable that may be evaluated using an
interval scale (Boone & Boone, 2012). As such, Likert-scale items may use the mean as a
measure of center and the standard deviation as a measure of variability. The student
survey instrument employs both Likert-type items (median and IQR) and Likert-scale
items (mean and standard deviation). Each of these variable types are discussed in the
following sections.
Before proceeding with the detailed analysis, a summary of these calculations
across all instructor sections appears superimposed over the adjusted Wixom and Todd
model in Figure 4.1.
Figure 4.1. The Adjusted Model with Measures of Center and Dispersion
104
As shown in Figure 4.1, the general survey results indicate that students were not
overwhelmingly pleased with the implementation and use of the MyITLab Grader
software. In fact, only the Ease-of-Use construct scored positively with medians
surpassing the scale’s midpoint. Besides the two low median values attributed to the
Intention-to-Use construct (IU01 and IU02), which measures whether students will
continue using the software beyond the course completion date, the remaining means and
medians seem to hover around the midpoint with some significant variability. On the
other hand, the least variability once again appears for Intention-to-Use, which
emphasizes the presumptive behavioral choice to let the MyITLab Grader subscription
lapse upon completion of the course.
Analysis of Variable Distributions
For the ordinal and interval quantitative variables, the characteristics of interest
include each distribution’s center, spread, modality, shape, and outliers (Moore &
McCabe, 2005). Especially true in exploratory data analysis, histograms provide an
excellent starting point for reviewing these characteristics. Appendix H provides
histograms for each Likert-type item and Likert-scale composite construct. While the
composite variable histograms for Information (IQ) and System Quality (SQ) present
mostly bell-shaped distributions around the midpoint of the Likert scale, the Information
(IS) and System Satisfaction (SS) constructs are flattened across all data points except for
a few Strongly Agree (7) responses. As Likert-type items from a non-probability sample,
these two satisfaction constructs could not be reliably tested for significant categorical
differences between the medians.

105
Similar to the satisfaction constructs, the Perceived Usefulness (PE01) of
feedback for learning Microsoft Office is relatively flat, other than a handful of Strongly
Agree (7) data points. In fact, 35 respondents chose the purely negative stance (1 and 2
on the scale) that MyITLab Grader did not help them to learn Microsoft Office, while 30
respondents chose the positive stance (6 or 7 on the scale) that the software did help their
learning. Unfortunately, such varied responses along the x-axis hinder any reliable
interpretation (Weinberg & Abramowitz, 2008). The Perceived Usefulness (PE02) for
skill improvement, on the other hand, is arguably bell-shaped with a slight tendency to
skew left. With a mode of 5.0 and a median of 4.0, 64% of respondents reported values
between 4 and 6, a somewhat more concrete response than the previous Likert-type items.
Although not a glowing report on the usefulness of MyITLab Grader in terms of
improving students’ Microsoft Office skills, the distribution’s shape more clearly
illustrates students’ perceptual beliefs.
For the Ease-of-Use construct, the usability (EU01) histogram presents a slightly
skewed left distribution, with a mode of 6.0 and a median of 5.0. Similar in shape to the
PE02 distribution, the learnability (EU02) histogram provides a mode of 5.0, but with a
more pronounced left skew. Regardless of what students may think about MyITLab
Grader’s feedback and system quality, these results provide evidence that the majority of
students perceive MyITLab Grader to be a relatively easy program to learn and use.
However, the question remains on whether students actually used the full complement of
MyITLab’s features (e.g., audio PowerPoints, simulation tutorials, and hands-on videos),
or were they only accessing the assignments and gradebook. As in Microsoft Office,

106
students may be able to perform the 20% of features and functions that they know exist,
but they may not be aware of the other 80% of available functionality.
Both the Social Norms (SN) and Attitude (AT) constructs present bell-shaped
distributions, as one might expect with composite variables, but the AT construct tends to
skew slightly left. When collapsing the bin intervals, the normal shapes become more
prominent. However, the constructs contain several lower data points that serve to pull
the distributions’ means left of their medians of 4.0. From these measures, students’
behavioral attitudes toward MyITLab Grader seem to be in line with their behavioral
beliefs regarding the influence of peers. In other words, students seem to possess a non-
committal attitude toward MyITLab Grader (mode=4.5, median=4.0, and mean=3.7), and
believe that their peers and instructor have similar non-committal attitudes (mode=4.0,
median=4.0, and mean=3.8).
Some of the more predictable results are illustrated by the Intention-to-Use
histograms (Figures H.11 and H.12). For the Intention-to-Continue (IU01) using
MyITLab Grader beyond the course completion date, the distribution’s shape is clearly
right-skewed with a mode of 1.0 and a median of 2.0. For the Intention-to-Renew (IU02)
the software’s subscription, the distribution’s shape is once again right-skewed with both
a mode and median of 1.0. Obviously students do not perceive the benefits of continuing
to use MyITLab Grader outweighing the costs of time (IU01) or renewal fees (IU02). The
Intention-to-Recommend (IR01) histogram proves more challenging to describe. With a
mode of 1.0 and a median of 4.0, there are obviously a range of student opinions with
respect to recommending the use of MyITLab for future courses. Of the 149 respondents,
48 students chose the purely negative stance (1 and 2 on the scale) – in essence that

107
MyITLab Grader should no longer be used in BuAd 128 – and only 27 respondents chose
the purely positive stance (6 or 7 on the scale). The majority of respondents (71) had no
definitive position on the matter.
To summarize, the analysis of frequency histograms can provide some interesting
insight into the shapes of the distributions for a particular data set. However, Gliem &
Gliem (2003) remind us that single Likert-type items may have considerable
measurement error and are, therefore, unreliable for use in making inferences about
complex theoretical constructs. While the Likert-type item scores provide a descriptive
snapshot of students’ perceptions of MyITLab Grader in the context of the BuAd 128
case, their use in drawing inferences about other freshman computer literacy courses is
severely restricted. Composite Likert-scaled items are undoubtedly more valid (given the
reduced error), but these results are also limited to case-based analytic generalizations
given the use of nonprobability, voluntary survey methods.
Analysis of Likert-Type Items
Nine of the 25 survey questions are classified as Likert-type items. Although
progressively-increasing numbers are assigned to the response items, representing an
ordinal relationship, the extent of that relationship cannot be implied (Boone & Boone,
2012). For the student survey, Likert-type items are used to focus the spotlight upon five
constructs – Information Satisfaction (IS01), System Satisfaction (SS01), Ease-of-Use
(EU01 and EU02), Usefulness or Performance Expectancy (PE01 and PE02), and
Intention (IU01, IU02, and IR01). Notice that the Intention construct provides separate
question items for measuring Intention-to-Use (IU) and Intention-to-Recommend (IR).
Table 4.6 displays a summary of descriptive measures for these Likert-type items. Notice
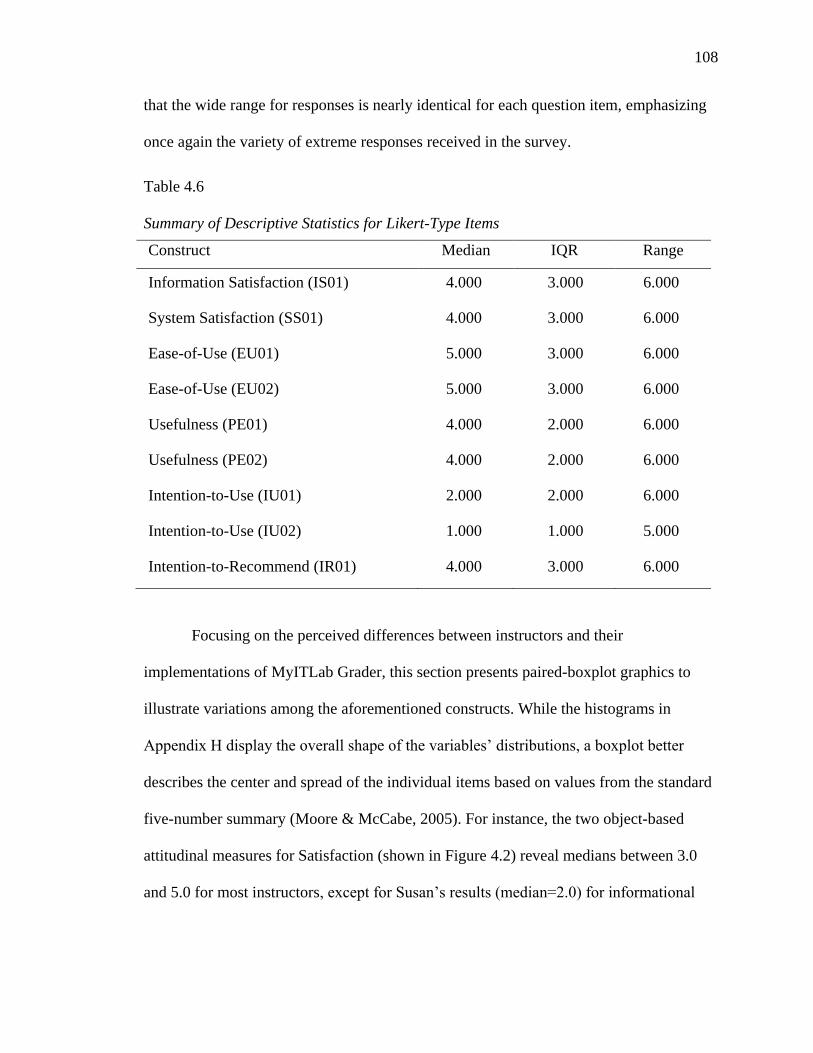
108
that the wide range for responses is nearly identical for each question item, emphasizing
once again the variety of extreme responses received in the survey.
Table 4.6
Summary of Descriptive Statistics for Likert-Type Items
Construct Median IQR Range
Information Satisfaction (IS01) 4.000 3.000 6.000
System Satisfaction (SS01) 4.000 3.000 6.000
Ease-of-Use (EU01) 5.000 3.000 6.000
Ease-of-Use (EU02) 5.000 3.000 6.000
Usefulness (PE01) 4.000 2.000 6.000
Usefulness (PE02) 4.000 2.000 6.000
Intention-to-Use (IU01) 2.000 2.000 6.000
Intention-to-Use (IU02) 1.000 1.000 5.000
Intention-to-Recommend (IR01) 4.000 3.000 6.000
Focusing on the perceived differences between instructors and their
implementations of MyITLab Grader, this section presents paired-boxplot graphics to
illustrate variations among the aforementioned constructs. While the histograms in
Appendix H display the overall shape of the variables’ distributions, a boxplot better
describes the center and spread of the individual items based on values from the standard
five-number summary (Moore & McCabe, 2005). For instance, the two object-based
attitudinal measures for Satisfaction (shown in Figure 4.2) reveal medians between 3.0
and 5.0 for most instructors, except for Susan’s results (median=2.0) for informational

109
feedback. The variability within Andrew’s section on the same variable also seems
significant, with an elongated interquartile range (IQR). However, these student
responses tighten up somewhat around the same median-level when asked about their
satisfaction with the MyITLab Grader software itself.
Figure 4.2. Satisfaction Boxplots: Information (IS01) and System (SS01)
The Ease-of-Use response items earn the highest median scores of any construct,
and seem to possess reasonable IQR variability levels. However, the interesting point of
the boxplots shown in Figure 4.3 is the wide range of student responses, using the entire
scale from 1 through 7 across multiple instructors. In essence, students of the same
instructor have polar opposite perceptions regarding the difficulty level in learning and
using the MyITLab Grader software.
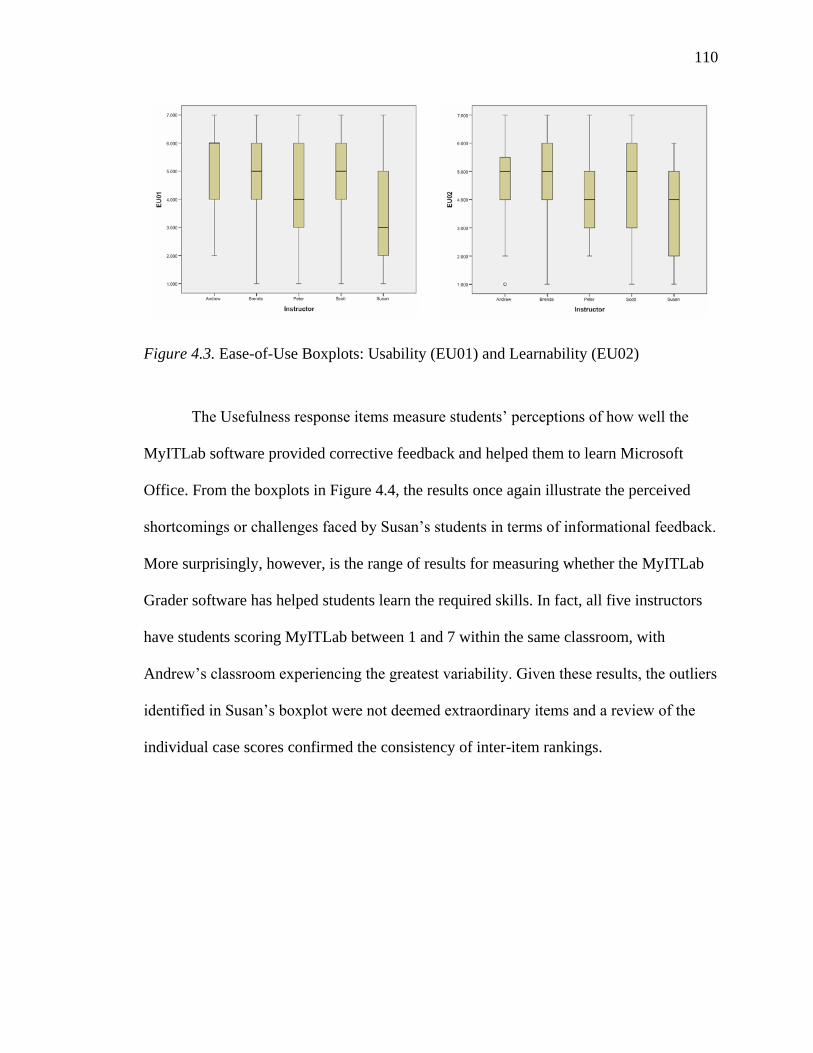
110
Figure 4.3. Ease-of-Use Boxplots: Usability (EU01) and Learnability (EU02)
The Usefulness response items measure students’ perceptions of how well the
MyITLab software provided corrective feedback and helped them to learn Microsoft
Office. From the boxplots in Figure 4.4, the results once again illustrate the perceived
shortcomings or challenges faced by Susan’s students in terms of informational feedback.
More surprisingly, however, is the range of results for measuring whether the MyITLab
Grader software has helped students learn the required skills. In fact, all five instructors
have students scoring MyITLab between 1 and 7 within the same classroom, with
Andrew’s classroom experiencing the greatest variability. Given these results, the outliers
identified in Susan’s boxplot were not deemed extraordinary items and a review of the
individual case scores confirmed the consistency of inter-item rankings.

111
Figure 4.4. Usefulness Boxplots: Feedback (PE01) and Performance (PE02)
The lowest median scores were reported for the two Intention constructs shown in
Figure 4.5, as might be expected in a college freshman computer class. With relatively
similar medians and IQR results, the noteworthy data points are actually found in the
higher ranges. Appreciating the small number of responses, there are students in the
upper quartile (including those labeled as outliers) who would consider using or renewing
the MyITLab Grader software after the course completion date.
Figure 4.5. Intention Boxplots: Continued Use (IU01) and Renewal (IU02)
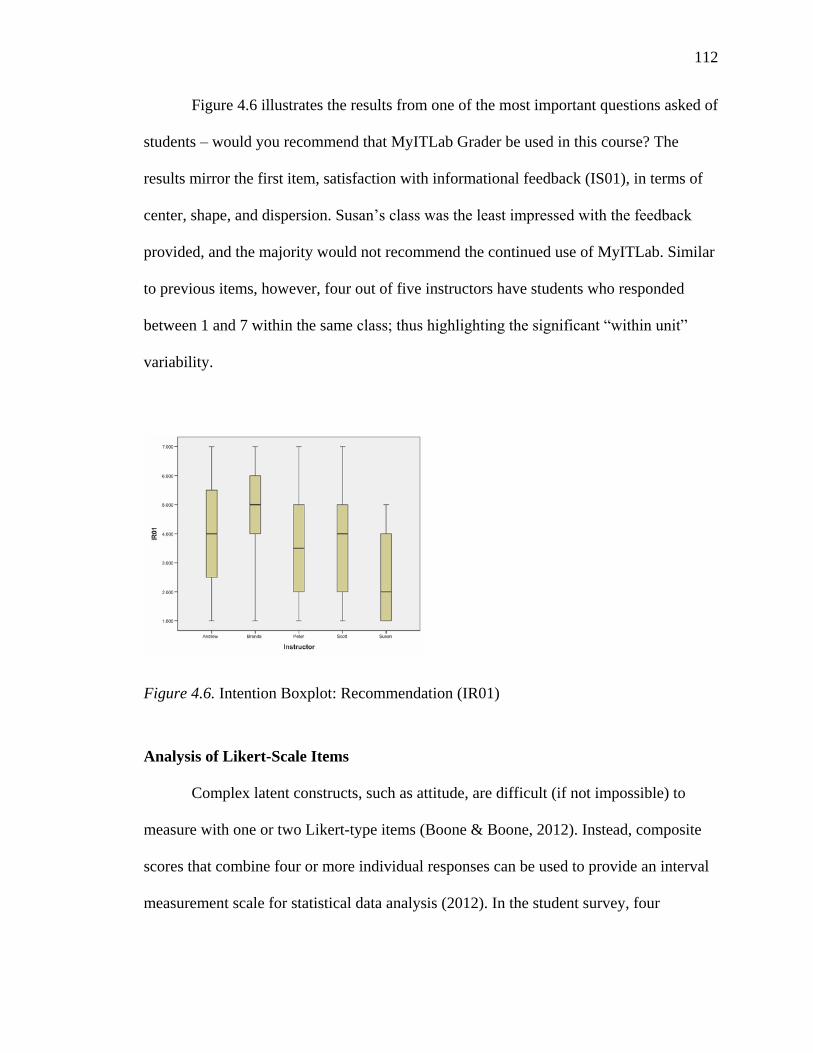
112
Figure 4.6 illustrates the results from one of the most important questions asked of
students – would you recommend that MyITLab Grader be used in this course? The
results mirror the first item, satisfaction with informational feedback (IS01), in terms of
center, shape, and dispersion. Susan’s class was the least impressed with the feedback
provided, and the majority would not recommend the continued use of MyITLab. Similar
to previous items, however, four out of five instructors have students who responded
between 1 and 7 within the same class; thus highlighting the significant “within unit”
variability.
Figure 4.6. Intention Boxplot: Recommendation (IR01)
Analysis of Likert-Scale Items
Complex latent constructs, such as attitude, are difficult (if not impossible) to
measure with one or two Likert-type items (Boone & Boone, 2012). Instead, composite
scores that combine four or more individual responses can be used to provide an interval
measurement scale for statistical data analysis (2012). In the student survey, four

113
constructs – Information Quality, System Quality, Social Norms, and Attitude – are
measured using Likert-scale items, comprising 16 survey questions or four items each.
The Likert-scale composite variables are calculated by averaging the Likert-type item
results from each construct. Given the use of a nonprobability, voluntary survey method,
there was no reliable basis for calculating factorial weightings on the items; therefore,
equal weightings (i.e., averages) were applied in computing the values for comparative
purposes.
Descriptive measures for the Likert-scale items appear in Table 4.7, along with
Cronbach’s coefficient alpha for testing reliability, accuracy, and internal consistency.
The closer that Cronbach’s alpha is to 1.0 the greater the internal consistency (i.e., the
degree of interrelatedness) of the individual items that make up the composite scale
(Gliem & Gliem, 2003). All measures fulfilled the suggested levels with composite
reliability scores exceeding the .70 threshold (Lund Research, 2016; Nunnally &
Bernstein, 1994). Similar to the median scores for the Likert-type items, the mean scores
tend to group around the midpoint of the scale. Referencing the central limit theorem for
sufficiently large sample sizes (Moore & McCabe, 2005), the Likert-scale histograms
largely present as bell-shaped and symmetrical distributions (although once again, a
voluntary census was conducted so inferences are both troublesome and unnecessary.)
With reasonable justification, these distributions seem to be congruent with Pukelsheim’s
(1994) Three-Sigma Rule for descriptive purposes. In other words, 68% of the values
should appear within one standard deviation from the mean, 95% of values should fall
within two standard deviations, and 99.7% of values should fall within three standard

114
deviations. The face validity of these measures seems to be in-line with the values
appearing in Table 4.7.
Table 4.7
Summary of Descriptive Statistics for Likert-Scale Items
Construct
Likert-Type
Items Mean
Standard
Deviation
Cronbach’s
Alpha (α)
Information Quality (IQ) 4 3.930 1.358 .802
System Quality (SQ) 4 3.987 1.278 .703
Social Norms (SN) 4 3.775 1.403 .897
Attitude (AT) 4 3.730 1.311 .778
For the purposes of analytic generalization, as opposed to inferential
generalization, the Likert-scale items provide meaningful, and arguably conservative,
measures for comparison to other Likert-type items. Because the mean is more sensitive
to extreme observations (or outliers) than the median, boxplots are once again selected to
best describe the center-points and levels of variability within the composite distributions
(Moore & McCabe, 2005). Beginning with an analysis of the object-based beliefs for
Information and System Quality in Figure 4.7, there appears to be some significant
variability in Brenda’s and Scott’s sections, while Susan’s students consistently rate the
quality somewhat lower than the students of other instructors. Only Peter’s section seems
to be tightly grouped around the median, perhaps articulating a more common and
consistent set of object-based beliefs.

115
Figure 4.7. Quality Boxplots: Information (IQ) and System (SQ)
The Social Norms composite scores in Figure 4.8 illustrate some apparent
differences between the instructors. Remembering that this construct measures students’
perceptions of other people’s beliefs about using MyITLab Grader, Susan’s students are
clearly sending a message with their tightly grouped responses around the lower extremes
on the scale. The dispersion of results for other instructors seems similar in shape to most
constructs; but, the large range of opinions remains a consistent theme. Investigating the
histograms of individual Likert-type items that make up the Social Norms construct
shows that students believe that their instructors, in general, feel more positive about the
software than do their immediate peers.
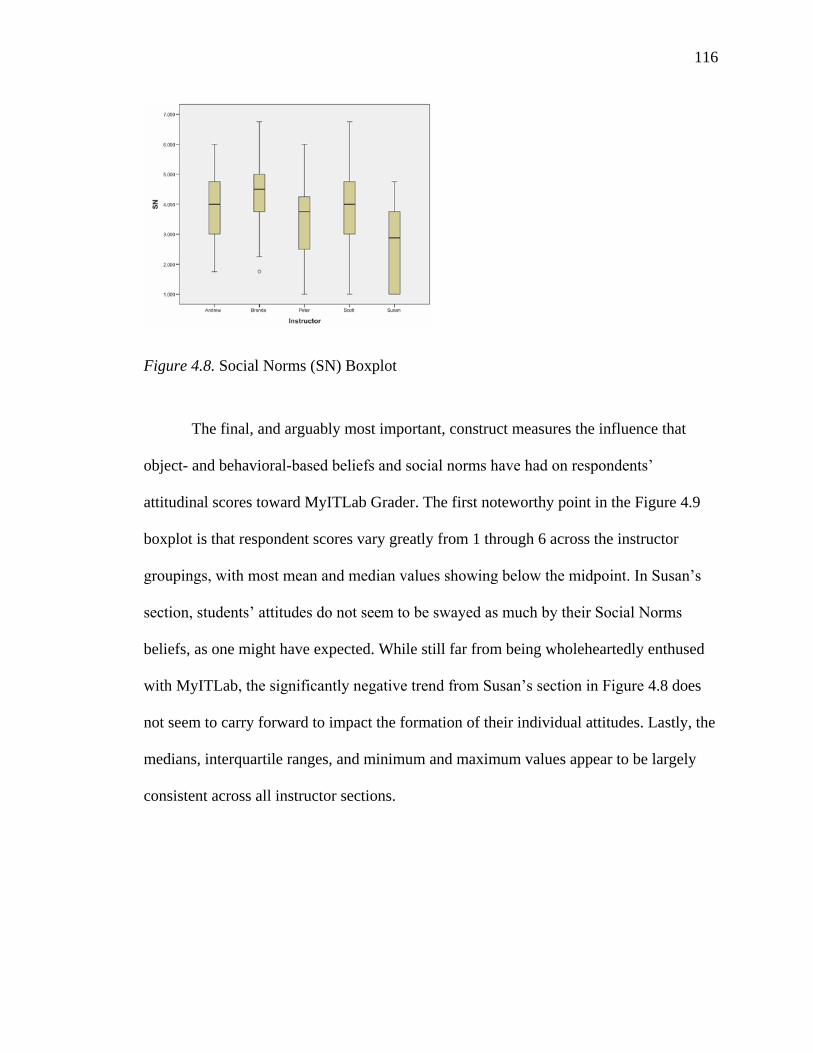
116
Figure 4.8. Social Norms (SN) Boxplot
The final, and arguably most important, construct measures the influence that
object- and behavioral-based beliefs and social norms have had on respondents’
attitudinal scores toward MyITLab Grader. The first noteworthy point in the Figure 4.9
boxplot is that respondent scores vary greatly from 1 through 6 across the instructor
groupings, with most mean and median values showing below the midpoint. In Susan’s
section, students’ attitudes do not seem to be swayed as much by their Social Norms
beliefs, as one might have expected. While still far from being wholeheartedly enthused
with MyITLab, the significantly negative trend from Susan’s section in Figure 4.8 does
not seem to carry forward to impact the formation of their individual attitudes. Lastly, the
medians, interquartile ranges, and minimum and maximum values appear to be largely
consistent across all instructor sections.

117
Figure 4.9. Attitude (AT) Boxplot
Summary of the Student Survey Results
An adjusted Wixom and Todd instrument was used to survey students in
BuAd 128 – Computer Applications. The purpose of the survey was not to provide
evidence as to the instrument’s inferential or predictive capabilities, but to provide
triangulating and confirmatory evidence for use in describing students’ classroom
experiences with the MyITLab Grader software. For this reason, a voluntary census was
conducted and descriptive graphics and tables were analyzed to better appreciate students’
perceived beliefs, attitudes, and intentions.
The online survey was conducted near the end of the semester and produced 149
valid submissions for a 46% response rate. Reviewing the individual embedded units, the
response rates varied from 16.3% for Andrew’s sections to 80.3% for Scott’s sections.
While the reasons for the disparity are largely unknown, the assumption is that three of
the instructors provided class time for students to complete the survey (65.1% to 80.3%),
while two instructors asked students to complete it at home or on their own time (16.3%

118
and 25.4%). The low response rate may also indicate some voluntary response bias,
whereby the data is collected from self-selected respondents who hold extreme opinions,
either positive or negative, which may further explain the variability in histograms and
boxplots.
As for the survey data itself, nearly three quarters of the respondents self-reported
as being either a beginner or novice in using Microsoft Office at the beginning of the
course. Overall, the measures for technology acceptance and user satisfaction reveal
students at either end of the spectrum. While some students possess a positive attitude
towards the MyITLab Grader, the majority are either non-committal or possess negative
beliefs and attitudes. The highest scores were returned on the ease-of-use constructs,
while the lowest scores were for respondents’ intention to continue using MyITLab
Grader beyond the course completion date. One embedded unit, Susan’s section, had
consistently lower scores with respect to their beliefs and opinions of the software, while
other units hovered around the scale’s midpoint. Further summations and interpretations
of the data are provided in the following chapter.

119
CHAPTER 5. DISCUSSION AND CONCLUSIONS
When it comes to computer literacy and software proficiency, today’s university
and college students are not that different from students of the past two decades. Their
assumed levels of technological sophistication, having grown up as millennials with
smartphones, tablets, and Facebook, are overstated and arguably superficial (Dednam,
2009; Eichelberger & Imler, 2015; Jones et al., 2010). Even though students are
competent users of email, messaging, and the Internet, their computing and technology
skills, required for both academic and workplace success, have been described as both
rudimentary and basic (Gharawi & Khoja, 2015; Hanson et al., 2011; Kennedy et al.,
2008; Rondeau & Li, 2009). In order to provide students with the skills necessary to
perform at a satisfactory level, computer literacy courses in higher education need to
continuously evolve and improve in order to meet the needs of a diverse population with
disparate technical competencies. One example of an evolutionary step forward involves
the development and implementation of Web-based, automated tutorial and grading
software for Microsoft Office training and assessment. Unfortunately, the effectiveness
and efficiency of this type of software has not been rigorously examined, nor well-
documented (Varank, 2006). To close this gap in research, this study describes the use
and implementation of MyITLab, an innovative software technology developed by
Pearson Education, and its impact on a freshman-level computer literacy course.
120
Application of the Case Study Methodology
This research study applied the case study methodology to frame the inquiry
process within an empirical, scientific approach. Merriam (1998) emphasizes that the
case study methodology is appropriate when needing to “gain an in-depth understanding
of the situation” and when the “interest is in process rather than outcomes, in context
rather than a specific variable, in discovery rather than confirmation” (p. 19). Through
descriptive analyses and generalization, the case study strategy presents a concrete and
contextual summarization that allows for the reader’s (and not just researcher’s)
interpretation (1998). In order to foster a well-rounded and informed perspective for the
context of the computer literacy classroom, data in this study were collected and analyzed
from multiple sources, including course documents, classroom observations, instructor
interviews, and student survey results. According to Yin (2003), every “good case
study… uses as many sources as possible,” even when such sources may not provide any
new, confirmatory, or contradictory information (p. 85). In this study, the course
documents, including syllabi and examination files, provided a stable, exact, and precise
source of evidence. Classroom observations provided the contextual reality checks and
balances necessary for interpretation and generalization. As the embedded units within
the case analysis, instructors provided targeted and insightful interview sources. And,
lastly, a survey instrument integrated the research areas of user satisfaction and
technology acceptance in order to provide quantitative results from students in an
unobtrusive, albeit voluntary, manner.
Yin (2003) strongly encourages the use of multiple sources of evidence for
triangulating on the same set of research questions. With converging lines of inquiry,

121
potential problems of construct validity are addressed, in that “multiple sources of
evidence essentially provide multiple measures of the same phenomenon” or experience
(2003, p. 99). Yin also advocates that this “chain of evidence” explicitly link the research
questions to the data collected and, ultimately, the conclusions drawn (2003). In essence,
Yin’s case study approach, on which this study is modeled, assists both the reader and
researcher in following the derivation of evidence, addressing the “methodological
problem of determining construct validity, [and] thereby increasing the overall quality of
the case study” (2003, p. 105) Consistent with Yin’s (2003) recommendations for
reporting high-quality research, this study provides sufficient citations and quotes from
the qualitative field data, an appropriate database for storing and querying the evidence,
comprehensive research-based protocols driven by the theoretical framework and
research questions, and analytical processes suitable for the methodologies selected
(p. 105). The study’s resultant trustworthiness and credibility involves an interweaving
among the methodological procedures followed, the theoretical frameworks selected, the
analytical lens applied, and the researcher’s own experience and expertise.
With respect to the mixed-methods case study approach, the researcher's role and
personal biases have been fully documented and the procedures for data collection and
analysis described in detail for reliability purposes. Attention was focused on the
experiential similarities and differences among the embedded case units (i.e., the
instructors). And, to further ensure high-quality data analysis, Yin’s (2003) principles
were followed by (a) attending to all the collected evidence, (b) addressing the most
significant themes, and (c) applying the researcher’s own prior, expert knowledge to
demonstrate awareness and thoughtfulness of the contextual issues. The analytical and
122
interpretive results have been presented in a descriptive narrative, supported by
instructors’ quotations and the researcher’s personal insights. Results from the student
survey have been tabulated, and descriptive statistics generated, using categories
abstracted from the literature. Internal validity was addressed through the use of
published protocols derived from the research questions and survey questions adapted
from previously-vetted instruments, in line with the theoretical framework. External
validity for any case study, however, must be addressed in terms of reader
generalizability, which involves “leaving the extent to which the study’s findings apply to
other situations up to the people in those situations” (Merriam, 1998, p. 211.) Having
presented an overview of the research and the selected methodology, the following
section discusses and summarizes the results of the study.
Discussion of Results
The purpose of this study is to describe the experiences and impact on teaching
and learning that resulted from the use of MyITLab Grader in BuAd 128, a computing
applications course in the School of Business at Okanagan College. This study builds
upon decades of end-user computing satisfaction and technology acceptance research.
The primary focus of the research is descriptive, as opposed to evaluative, with the
following goals: (a) to describe instructors’ experiences with using MyITLab Grader in
the classroom, (b) to identify patterns of technology usage, implementation, and delivery,
and (c) to elucidate levels of user satisfaction, attitudes, and intentions regarding
MyITLab Grader. The aspirant outcome of the research is to inform future decision-
making regarding the use and implementation of similar educational technology products,

123
within alike contexts, and the design and development of course curricula that utilize
automated grading and tutorial software.
Research Objectives
Before putting forward analytic generalizations, this section presents direct
responses to the research question and objectives. These summations also serve to extend
the prior analysis with specific insights related to the overall research purpose. The
following section then encapsulates these insights into generalized assertions, or
“statements of truth”, which are based on and derived from the data.
Research Objective 1: To describe the ways in which instructors are
incorporating automated grading and tutorial software into their computer literacy
classrooms. BuAd 128 follows a traditional approach to teaching computer applications
to freshman-level business students. Within a typical computer lab classroom, instructors
separate their two-hour class time, more or less equally, into demonstration (“Show
Me/Guide Me”) and open lab time. The lecture demonstrations introduce the topics,
features, or skills required for Microsoft Word, Excel, and PowerPoint, while the lab time
provides opportunities for students to practice, engage the instructor for individual help,
and complete the assigned term work. Students are assessed using weekly assignments
(30%), module exams (60%) for each of the Microsoft Office applications, and a
Microsoft PowerPoint group presentation (10%) during the final week. There is no final
exam in the course. MyITLab, a Web-based automated grading and tutorial software
from Pearson Education, is used to deliver and grade the weekly assignments but, more
importantly, provides corrective feedback for each assignment with links to simulation-
based tutorials for adaptive, mastery learning. The majority of students work on the
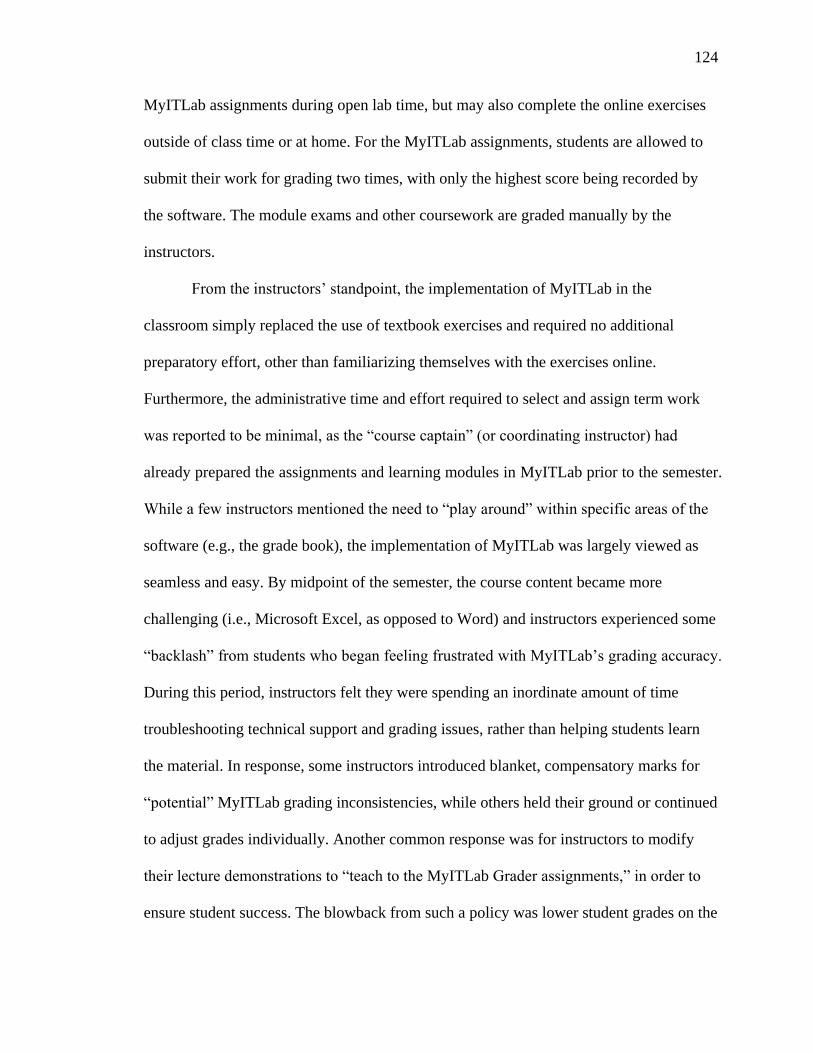
124
MyITLab assignments during open lab time, but may also complete the online exercises
outside of class time or at home. For the MyITLab assignments, students are allowed to
submit their work for grading two times, with only the highest score being recorded by
the software. The module exams and other coursework are graded manually by the
instructors.
From the instructors’ standpoint, the implementation of MyITLab in the
classroom simply replaced the use of textbook exercises and required no additional
preparatory effort, other than familiarizing themselves with the exercises online.
Furthermore, the administrative time and effort required to select and assign term work
was reported to be minimal, as the “course captain” (or coordinating instructor) had
already prepared the assignments and learning modules in MyITLab prior to the semester.
While a few instructors mentioned the need to “play around” within specific areas of the
software (e.g., the grade book), the implementation of MyITLab was largely viewed as
seamless and easy. By midpoint of the semester, the course content became more
challenging (i.e., Microsoft Excel, as opposed to Word) and instructors experienced some
“backlash” from students who began feeling frustrated with MyITLab’s grading accuracy.
During this period, instructors felt they were spending an inordinate amount of time
troubleshooting technical support and grading issues, rather than helping students learn
the material. In response, some instructors introduced blanket, compensatory marks for
“potential” MyITLab grading inconsistencies, while others held their ground or continued
to adjust grades individually. Another common response was for instructors to modify
their lecture demonstrations to “teach to the MyITLab Grader assignments,” in order to
ensure student success. The blowback from such a policy was lower student grades on the

125
module exams, which focused more on the applications of Microsoft Office for creating
solutions (e.g., newsletters, budgets, and sales presentations). On the positive side,
instructors enthusiastically reported that their weekly grading workload was all but
eliminated using MyITLab.
From students’ standpoint, the MyITLab software provided weekly focus and
grade-based motivation to complete the assigned term work. Instructors encouraged a
collaborative, peer support environment during the open labs, and many students took
advantage of this time to work as partners or groups on their MyITLab assignments.
Students would submit their work for grading, open the gradebook to see their score
(which MyITLab returned immediately), and, if necessary, review the Grader feedback
report to see where marks were lost. While students could launch an adaptive simulation
tutorial directly from the Grader feedback report, most students chose to seek assistance
from peers or call over the instructor to help fix their assignment in order to earn back the
missed points for a second submission attempt. Soon after the assignments were
completed and submitted in the open lab, students would pack up and depart the
classroom (again as a group) regardless of the class time remaining.
To summarize, the MyITLab software was implemented into BuAd 128 as a
substitute for the weekly textbook exercises. As explained by the course captain, the goal
was to provide both a grade and corrective feedback to students on their term work,
which had not been possible before due to the sizeable workload. Overall, instructors
were pleased with the seamless integration of the software into their classrooms, but
found that their role changed from teaching to troubleshooting when faced with
MyITLab’s grading inaccuracies. During open lab time, students worked through the
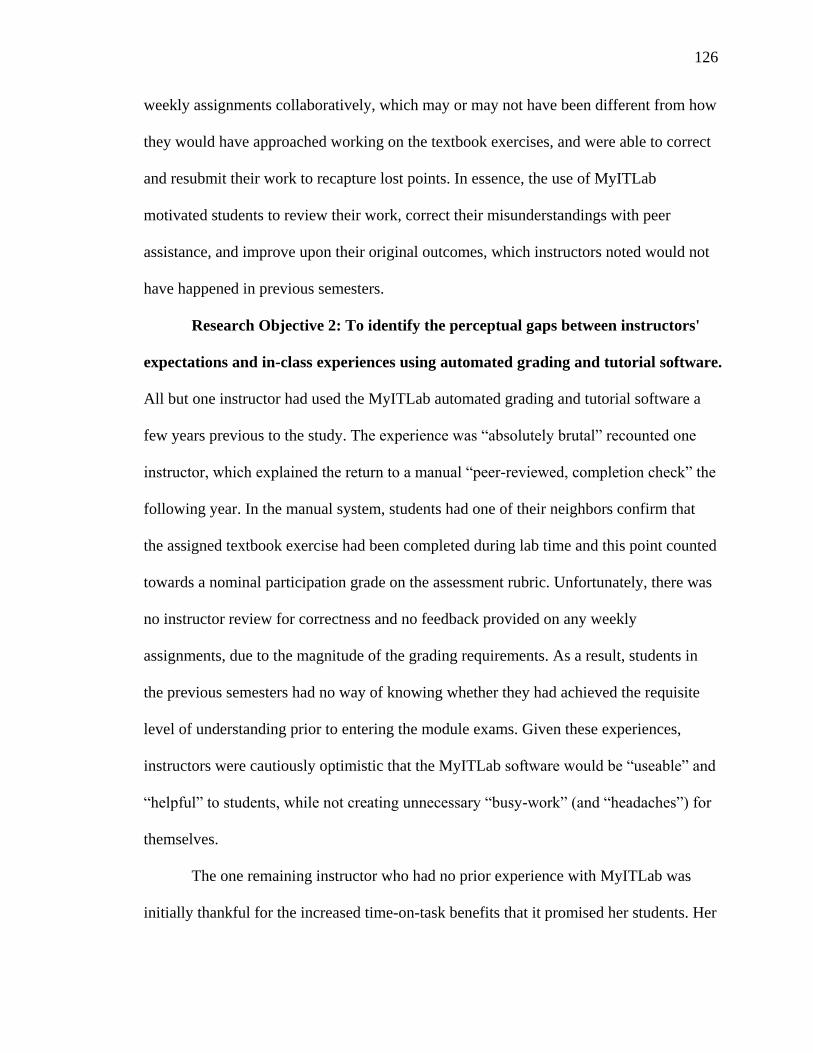
126
weekly assignments collaboratively, which may or may not have been different from how
they would have approached working on the textbook exercises, and were able to correct
and resubmit their work to recapture lost points. In essence, the use of MyITLab
motivated students to review their work, correct their misunderstandings with peer
assistance, and improve upon their original outcomes, which instructors noted would not
have happened in previous semesters.
Research Objective 2: To identify the perceptual gaps between instructors'
expectations and in-class experiences using automated grading and tutorial software.
All but one instructor had used the MyITLab automated grading and tutorial software a
few years previous to the study. The experience was “absolutely brutal” recounted one
instructor, which explained the return to a manual “peer-reviewed, completion check” the
following year. In the manual system, students had one of their neighbors confirm that
the assigned textbook exercise had been completed during lab time and this point counted
towards a nominal participation grade on the assessment rubric. Unfortunately, there was
no instructor review for correctness and no feedback provided on any weekly
assignments, due to the magnitude of the grading requirements. As a result, students in
the previous semesters had no way of knowing whether they had achieved the requisite
level of understanding prior to entering the module exams. Given these experiences,
instructors were cautiously optimistic that the MyITLab software would be “useable” and
“helpful” to students, while not creating unnecessary “busy-work” (and “headaches”) for
themselves.
The one remaining instructor who had no prior experience with MyITLab was
initially thankful for the increased time-on-task benefits that it promised her students. Her
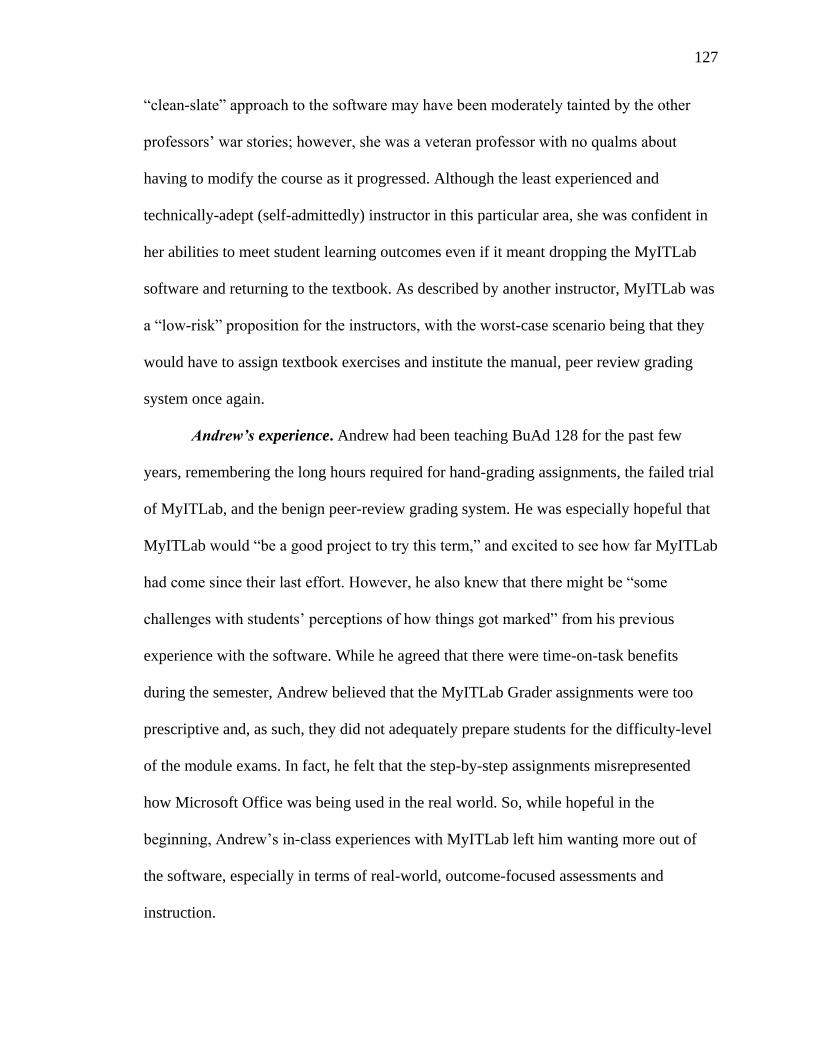
127
“clean-slate” approach to the software may have been moderately tainted by the other
professors’ war stories; however, she was a veteran professor with no qualms about
having to modify the course as it progressed. Although the least experienced and
technically-adept (self-admittedly) instructor in this particular area, she was confident in
her abilities to meet student learning outcomes even if it meant dropping the MyITLab
software and returning to the textbook. As described by another instructor, MyITLab was
a “low-risk” proposition for the instructors, with the worst-case scenario being that they
would have to assign textbook exercises and institute the manual, peer review grading
system once again.
Andrew’s experience. Andrew had been teaching BuAd 128 for the past few
years, remembering the long hours required for hand-grading assignments, the failed trial
of MyITLab, and the benign peer-review grading system. He was especially hopeful that
MyITLab would “be a good project to try this term,” and excited to see how far MyITLab
had come since their last effort. However, he also knew that there might be “some
challenges with students’ perceptions of how things got marked” from his previous
experience with the software. While he agreed that there were time-on-task benefits
during the semester, Andrew believed that the MyITLab Grader assignments were too
prescriptive and, as such, they did not adequately prepare students for the difficulty-level
of the module exams. In fact, he felt that the step-by-step assignments misrepresented
how Microsoft Office was being used in the real world. So, while hopeful in the
beginning, Andrew’s in-class experiences with MyITLab left him wanting more out of
the software, especially in terms of real-world, outcome-focused assessments and
instruction.

128
Brenda’s experience. Brenda was happy to see a return to MyITLab Grader
because it would potentially “take some of the grading away.” Her expectations were
relatively pragmatic, having had some past trouble with the software, but hopeful (like
Andrew) that these issues were resolved and that the software would work this time. “I
know it’s not going to be perfect,” exclaimed Brenda, “but it’s way better than doing [the
grading] manually or not giving them any opportunities to practice.” She summarized her
thoughts with “those were my expectations and they were pretty much met, because
[MyITLab] does grade correctly most of the time… It was way better than in the past for
sure.” She believed the software achieved its goals for the semester and that her students’
grades were more reflective of their motivation and effort than the strengths or
weaknesses of MyITLab.
Peter’s experience. As one of the primary proponents for MyITLab, Peter
initially hoped it would ease the weekly grading workload, which he believed it did
successfully and with “no more preparation time required.” He had witnessed the less
than successful peer-review grading of the previous years, and believed that receiving
automated feedback for weekly assignments would better students’ chances at improving
their grades. While he believed the overall student performance to be lower this semester
than in previous years, Peter found that the “people who worked on MyITLab certainly
got better grades” than other students; thus, confirming his expectations for the software.
However, his early experiences with MyITLab were that it consumed too much of his in-
class time in reviewing grading inaccuracies. As a result, he adjusted his assignment
grading policy by adding 5% to each students’ score, in order to reduce the “whining”
and “complaining.” Like Andrew, Peter perceived MyITLab to be somewhat misleading

129
for students, in that they could earn 100% on the assignments and yet still do poorly on
the exams. Coming to his own defense, Peter postulated that “this was not a hardworking
cohort” and questioned whether students made sufficient use of the resources and
tutorials available to them in MyITLab.
Scott’s experience. Scott had also used MyITLab in the past and was especially
wary of the software’s reliability at the beginning of the semester. Like the others, he was
hopeful that the past problems had been corrected and that “all the assignments were
going to work” this time. He was one of two instructors, along with Andrew, who voiced
their readiness to “jump ship” or “opt out of MyITLab should [problems] occur.”
Fortunately, Scott found his in-class experiences to be generally positive and that
MyITLab had significantly decreased the time previously set aside for reviewing material.
Rather than creating frustration among students, Scott believed that MyITLab “helped
carry them through” the content, especially when working outside of the classroom. He
noted some minor grading errors throughout the semester, but summarized his
experiences with “Overall, I liked it… It’s a good tool.”
Susan’s experience. Susan’s expectations were the least informed by personal
experience, in that she had not used the software before and was largely unfamiliar with
its features: “I figured it out enough to make it work, but I don’t think I ever actually
understood the fastest way to do things.” Susan also expected more direct linkages
between her interpretation of the learning outcomes, module exams, and MyITLab
Grader assignments. “I was getting a little frustrated because I didn’t find that the book
was teaching them what I wanted them to know.” Her experience with MyITLab was
further impacted by classroom culture, technical problems, and negative student attitudes.
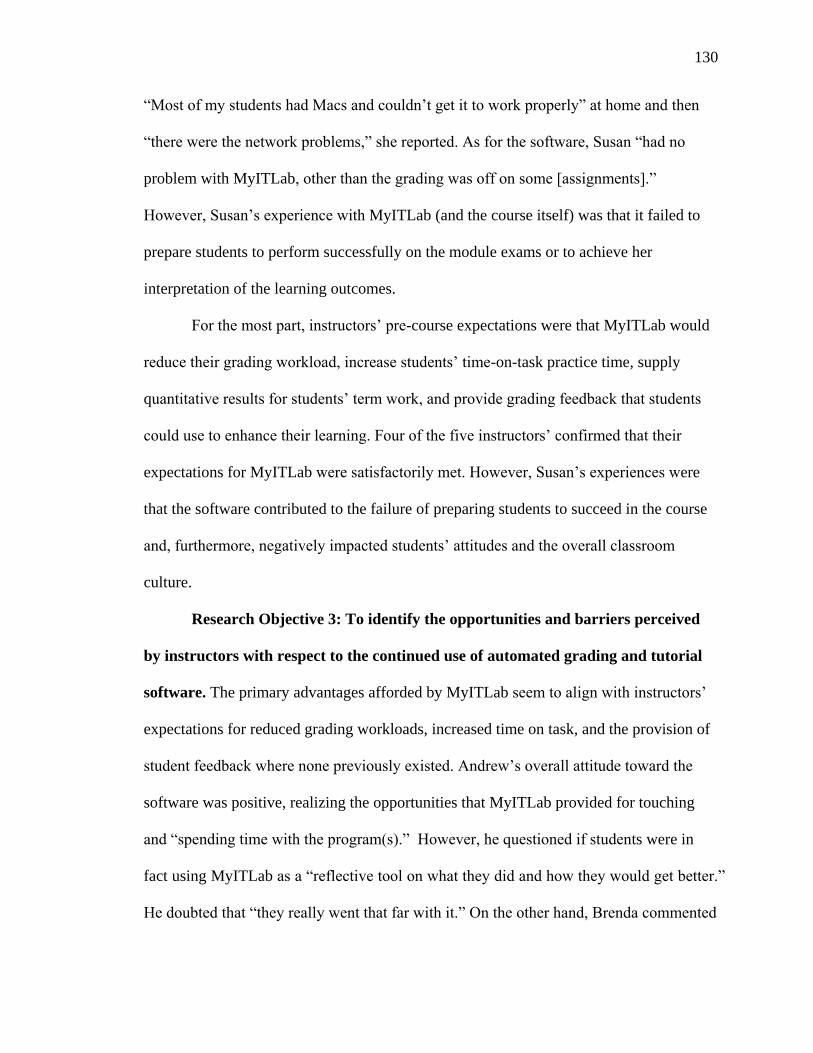
130
“Most of my students had Macs and couldn’t get it to work properly” at home and then
“there were the network problems,” she reported. As for the software, Susan “had no
problem with MyITLab, other than the grading was off on some [assignments].”
However, Susan’s experience with MyITLab (and the course itself) was that it failed to
prepare students to perform successfully on the module exams or to achieve her
interpretation of the learning outcomes.
For the most part, instructors’ pre-course expectations were that MyITLab would
reduce their grading workload, increase students’ time-on-task practice time, supply
quantitative results for students’ term work, and provide grading feedback that students
could use to enhance their learning. Four of the five instructors’ confirmed that their
expectations for MyITLab were satisfactorily met. However, Susan’s experiences were
that the software contributed to the failure of preparing students to succeed in the course
and, furthermore, negatively impacted students’ attitudes and the overall classroom
culture.
Research Objective 3: To identify the opportunities and barriers perceived
by instructors with respect to the continued use of automated grading and tutorial
software. The primary advantages afforded by MyITLab seem to align with instructors’
expectations for reduced grading workloads, increased time on task, and the provision of
student feedback where none previously existed. Andrew’s overall attitude toward the
software was positive, realizing the opportunities that MyITLab provided for touching
and “spending time with the program(s).” However, he questioned if students were in
fact using MyITLab as a “reflective tool on what they did and how they would get better.”
He doubted that “they really went that far with it.” On the other hand, Brenda commented

131
“If you don’t grade it, they don’t care,” and believed that MyITLab’s grading and
feedback motivated students to delve into the software and work harder. Brenda’s
primary concern was that “students have to understand that it’s not perfect; it’s just a tool”
and that they must take responsibility for their own learning, rather than blaming the
software.
The greatest barrier to the acceptance of MyITLab as an ongoing curriculum
resource seems to be the perceived grading inaccuracies (and the resulting student
frustrations) that occurred across the classes. Peter confirmed that the “grading ability
and consistency” in MyITLab could pose a barrier for implementing the software in
future semesters, but was pleased overall with the 90-95% accuracy experienced in his
sections. Other instructors voiced their satisfaction with the grading accuracy,
appreciating that MyITLab could never account for every possible method used to
achieve a particular outcome. Having said that, a few of the instructors recommended that
additional methods be added to the “solution bank” in order to make the software more
flexible and forgiving. A related barrier to the acceptance of MyITLab transcends the
grading issues to focus on the diagnostic reports provided to students. One of the key
value propositions for MyITLab is its ability to guide students to mastery learning
through the use of corrective feedback, simulation tutorials, exercise videos, and other
resources. Andrew and Susan both mentioned that their students had difficulty finding the
detailed feedback required to correct their misunderstandings or improve upon their
assignment scores. Regardless of whether this failure was caused by usability issues or a
lack of training, the usefulness of the software is blocked when detailed assignment
132
feedback and relevant learning resources cannot be accessed easily and in a timely
manner by students.
Similar to when computer training simulations for Microsoft Office were first
introduced, many of the instructors also questioned the value of the prescriptive, step-by-
step MyITLab Grader assignments. Although technically and programmatically
necessary, the relatively inflexible and linear approach to exercise construction and skills
assessment provides another barrier to the adoption of MyITLab. A common theme arose
during the instructor interviews, “Are we teaching and assessing students on how to apply
software to solve problems, or are we simply supporting their ability to follow directions
mindlessly?” When asked about the transference of learning from MyITLab to the
module exams, instructors perceived a disconnect between the task-based assignments
and the outcome-based exams. “Wait just a minute, this [MyITLab] isn’t teaching us
anything,” complained one student after receiving her exam results. In another class,
students argued with the instructor about how they could earn such high marks in
MyITLab and then nearly fail the exam. The presumed disconnect between learning
individual features of a software program (e.g., how to change print margins in Microsoft
Word) and applying that software to problem-solving scenarios, became apparent in the
module exams. This disconnect between procedural learning versus real-world
applications presents a potential barrier for MyITLab, not to mention automating grading
and tutorial software in general.
Although a significant barrier in the previous failed trial of MyITLab, the
technology infrastructure and, specifically, Internet-speed were no longer perceived to be
a problem. The instructors did not experience issues accessing the software, launching
133
assignments, or downloading feedback from the gradebook. While Susan’s classroom did
have network connectivity issues, these problems were campus-based and unrelated to
MyITLab. Along with everything else, however, the network issues may have negatively
impacted students’ attitudes toward MyITLab in Susan’s classroom. Overall, given
adequate Internet bandwidth and sufficiently powerful lab computers, MyITLab was
perceived to “work as advertised.” While some students did experience intermittent
problems with their personal Apple computers, these issues do not seem to pose an
insurmountable barrier to the classroom adoption of MyITLab.
Research Objective 4: To describe students’ perceptions of system quality,
feedback information quality, and overall satisfaction level with the automated
grading and tutorial software. The results from the adjusted Wixom & Todd student
survey instrument may be divided into end-user computing satisfaction measures and
technology acceptance measures. With respect to the computing satisfaction constructs,
the survey data were literally positioned all over the map, often equally distributed
between lower and upper values on the 7-point Likert scale. With measures of center
closely grouped near the midpoint, the real story presents itself in the dispersion and
variability of data points. Taken as a group, students’ perceptions regarding their
satisfaction with the MyITLab software are distributed across the entire spectrum.
When analyzed comparatively between instructors, many of the negative
responses seemed to originate from Susan’s students and, to a lesser extent, Andrew’s
and Peter’s classrooms. Even though they initially liked MyITLab, Susan’s students
obviously did not feel that they had “enough detail to figure out what they did wrong” on
assignments and, therefore, rated the information quality lower than other groups. As
134
described by Susan, students lost confidence in the ability of MyITLab to “teach” them
the skills necessary to be successful on the module exams. Furthermore, the classroom’s
technical problems and students’ Mac-based issues would explain the lower satisfaction
scores for MyITLab’s reliability and accessibility measures, respectively. While students
in Brenda’s classroom reported the highest levels of overall satisfaction for both
information and system quality, the values were still mediocre at best.
As explained by Weinberg & Abramowitz (2008), interpretations are challenging
when students’ responses are distributed so widely across the spectrum, with some
students emphatically dissatisfied with MyITLab and others quite pleased with its quality.
Research Objective 5: To describe students’ perceptions of usability,
usefulness, and overall attitude toward the automated grading and tutorial software.
For the technology acceptance measures, the data paint a similar picture to the end-user
computing satisfaction results. Some students demonstrated a positive attitude towards
MyITLab and, most likely, recommended its continued use in BuAd 128. Other students
trashed the software with low behavior-based ratings and suggested that it never be used
again. Mostly, however, students seemed rather non-committal in their attitudes and
opinions, opting for the impuissant midpoint on the Likert scale.
While it is not possible to link student responses to instructor labels used during
the interviews, one might conjecture that the “good” or “keener” students learned how to
use MyITLab for their benefit, while the “bad” students or “kids” failed to complete the
term work or draw from the software as a learning resource. On the other hand, negative
attitudes may have also resulted when “good” students earned top scores in MyITLab, but
then failed to perform acceptably on the module exams. Likewise, positive attitudes may
135
have resulted when “bad” students worked through assignments at home and successfully
practiced the skills necessary to succeed on exams. Again, it is impossible to determine
which truths are hidden in the data, which is why triangulating the methods and data
analysis are so important. For example, Peter perceived that 90% of his class was happy
with the performance and usefulness of the software, which was unsupported by his
students’ survey responses. His reasoning was that the “most common mark [was] 100%”
and that “a majority of students who used [MyITLab] never questioned the grade they
got.” Similarly, Scott “never heard any complaints saying it wasn’t useful” or that
students “couldn’t understand the feedback,” yet his students rated MyITLab as being
neither useful or useless and varied greatly on their assessment of the quality of feedback
information.
Upon further review of the survey data, Susan’s and Andrew’s sections once
again provided many of the negative responses regarding perceived usefulness, attitudes,
and intentions. When asked about peer influences, Susan’s students clearly sent a
message with their tightly grouped responses at the lower end of the scale. Students’
perceptions, seemingly, were that both Susan and their peers had low opinions of
MyITLab. But, generally speaking across classrooms, students reported that their
instructors thought more positively about the software than did their peers.
While far from being enthused with MyITLab, the attitudinal distributions seemed
to group around the midpoint for all instructors. The Ease-of-Use construct was the only
one to score positively, indicating that students perceived the software to be relatively
easy to navigate, learn, and use. The two measures with the least variability were the
Intention-to-Use constructs, which measures whether students will continue to use the
136
software after the end of the course. The results for these constructs were
overwhelmingly negative, which may be attributable to the financial obligation of
maintaining the subscription. Having said that, several students responded affirmatively,
that they would continue using the software, highlighting once again the significant
“within-unit” variability.
As with computing satisfaction, measures for technology acceptance seemed to be
distributed across the spectrum, with half the students leaning positively and half the
students leaning negatively when asked about the usefulness and their overall attitude
toward MyITLab.
Analytic Generalizations
Synthesizing the results of the data analysis with the researcher’s own experience,
several assertions are now presented for the purpose of informing the research purpose,
and specifically the design and development of future curricula for computer literacy
education.
Assertion 1: MyITLab can effectively eliminate or, at least, reduce instructor
grading workloads for weekly assignments. Automated grading and feedback systems,
such as MyITLab, can provide more consistent, helpful, constructive, and frequent
feedback than is possible manually (Debuse et al., 2007). These systems have also been
proven to have a positive impact on instructors’ workloads and time commitments, along
with reporting high levels of instructor satisfaction (Debuse et al., 2008). The instructors
in this study experienced similar workload benefits when implementing MyITLab for
weekly term assignments, and the majority recommended its continued use, based largely
on this premise.

137
Assertion 2: MyITLab provides the opportunity for students to get frequent
corrective feedback on their assignment submissions. Jenkins (2004) reported on
several advantages of computer-based automated grading systems, which include:
repeatability, immediacy of feedback, trackability by faculty, reliability and equitability,
timeliness, and flexibility of access. These characteristics align with the benefits
espoused by the instructors in this study. Not only were students provided with
continuous assignment feedback throughout the term, but also provided with adaptive
links to simulation tutorials and video resources to enhance their learning. Whether
students made optimal use of the resources is another matter entirely. Furthermore,
instructors were able to track students’ workflow and produce progress reports as
evidence of student progress and engagement.
Assertion 3: The prescriptive, step-by-step presentation of instructions in
MyITLab assignments may not solely meet the needs of solution-focused learning
outcomes. Learning transfer has been studied for many years, and is especially important
in the design of effective e-learning software (Clark & Mayer, 2002). Although admirable
for meeting time-on-task practice requirements, this study illustrates how student learning
from step-by-step assignments in MyITLab Grader is not easily transferred to solution-
based exams. Clark and Mayer (2002) describe the use of varied and realistic worked
examples for learning the “near-transfer skills” necessary for procedural tasks, such as
those present in application software (p. 186). In BuAd 128, the instructors’ lecture
demonstrations must be used to present worked examples that bring together the learning
that takes place in MyITLab assignments with real world applications of the software.
138
Assertion 4: Instructors should be trained on MyITLab, in order to
maximize the software’s utility and usefulness. Especially critical for technology
acceptance, a person’s self-efficacy impacts their ability to learn and perform tasks using
computer software (Compeau & Higgins, 1995; Karsten & Schmidt, 2008; Stewart, 2016).
MyITLab is not merely an educational website: it is a complex, Web-based technology
that encapsulates simulation tutorials, online exercises and assessments, an automated
grading engine, student grade book, diagnostic feedback and reporting tools, eBook
resources, audio PowerPoint lectures, and hands-on videos. As witnessed during Susan’s
classroom observation and discussed later in her interview, MyITLab can be
overwhelmingly feature-rich with many teaching, learning, and administrative
capabilities. In comparison to the more technically-savvy instructors, Susan struggled
with basic tasks in MyITLab, such as how to adjust students’ grades, how to remove
exercise steps that were not grading correctly, and how to set assignment due dates. In
order to implement and utilize these features and tools in the curriculum, instructors
require sufficient training and mentoring. The successes and shortcomings in this study
were largely a factor of instructors’ prior knowledge and experience using the software,
confirming the importance of formalizing a pre-semester training and mentorship
program.
Assertion 5: The MyITLab solution bank of acceptable responses should be
expanded by Pearson Education, in order to reduce the potential for grading
inaccuracies. The most frequent complaint expressed by both instructors and students,
with respect to using MyITLab, was that the software would at times grade correct work
as being incorrect. Not only are there multiple ways to perform a particular software task,
139
there are often multiple steps that must be completed. The existing number of potential
correct solutions, given the variety of performed behaviors and progressive ordering of
steps, appears to be inadequate. By increasing the number of correct responses available,
the assumption is that grading concerns would be minimized and the need for instructor
troubleshooting reduced.
Application of the Theoretical Framework
The Wixom and Todd (2005) integrated research model integrates two parallel
streams in software and information systems research, specifically end-user computing
satisfaction (EUCS) and technology acceptance (TAM). Combining these two streams
provides a “conceptual bridge from design and implementation decisions to system
characteristics to the prediction of usage” (p. 86). Most end-user computing satisfaction
research focuses on informational content and system attributes, such as accuracy,
completeness, flexibility, and reliability, to illuminate development decisions (Davis et al.,
1989). Unfortunately, these object-based attributes have proven to be weak predictors of
system usage. Technology acceptance literature, on the other hand, has established
proven predictive linkages between system usage and users’ attitudes and beliefs
regarding a system’s ease of use and perceived usefulness (Venkatesh et al., 2003). The
Wixom and Todd (2005) model successfully illustrates how users’ object-based beliefs
and attitudes about a system can act as influencers on their behavioral beliefs and
attitudes about using a system.
While several applications of the Wixom and Todd (2005) model appear in the
field of information systems research, its application for the study of innovative
educational technologies is sparse. Some possible explanations for its limited use may be
140
revealed by the differences that exist within the workplace and classroom environments.
In a typical workplace, standardized technologies and systems are provided to employees
to help them achieve specific goals efficiently and effectively, measured by deadlines,
productivity, and return on investment. Issues including data compatibility and employee
training are forefront in the decision to implement such workplace systems. In a college
or university classroom, instructors typically act unilaterally in choosing the educational
technologies they wish to adopt and then either recommend or require those resources to
be used by students. Students must make their own decisions on whether the resources
are necessary or worth it for earning the desired grade. These purchase decisions are
often influenced by the instructor, their in-class peers, their prior-learning and self-
efficacy, and various external sources (e.g., social media reviews). A limitation of the
Wixom and Todd (2005) model is that it does not differentiate between voluntary and
mandatory system usage, nor does it account for the impact of social influences on usage
behavior.
To make up for these shortcomings in studying the classroom environment, an
adjusted Wixom and Todd (2005) model was developed in this study to incorporate
elements from the Unified Theory of Acceptance and Use of Technology (UTAUT)
model (Venkatesh et al., 2003). The Social Norms construct was added as an influencer
of users’ behavioral attitudes (Legris et al., 2003; Mathieson, 1991; Park, 2009; Punnoose,
2012; Taylor & Todd, 1995; Venkatesh & Davis, 2000; Venkatesh et al., 2003). This
construct measured both instructor and peer influence, to determine how students’
attitudes might have been impacted by other’s opinions. Secondly, several moderating
factors including gender, age, and past experience were added as mediators, which may

141
enhance or diminish the impact of the direct determinants (Venkatesh et al., 2003). While
the statistical significance of these factors was not assessed, their inclusion provided
confirmatory descriptive evidence for use in analyzing and interpreting student
experiences and in forming data-based assertions.
While the brevity of the Wixom and Todd (2005) model is one of its more
appealing factors, other constructs were identified during the study for future
consideration, including: Autonomy, Instructor Quality, and Service Quality. Autonomy
refers to the degree to which students perceive the ability to take responsibility for and
control of their own learning (Lakhal, Khechine, & Pascott, 2013). Technology
acceptance researchers have successfully incorporated the autonomy construct into the
UTAUT model to better reflect the importance and convenience of online access as an
influencer of Perceived Usefulness and Behavioral Intentions (Chauhan & Jaiswal, 2016;
Lakhal et al., 2016). In addition, the Instructor Quality construct has been studied by
Lwoga (2014) as an influencer of Perceived Usefulness and User Satisfaction regarding
learning management systems. Together with the Social Norms construct, the quality of
the instructor, and their ability to integrate a complex educational technology into the
classroom, undoubtedly impacts students’ quality perceptions and acceptance of e-
learning software. The Instructor Quality construct includes metrics for response
timeliness, teaching style, and helpfulness towards learners (Cheng, 2012). Lastly,
Service Quality, or technical support, has proven to be a significant contributing factor in
end-user computing satisfaction research (Cheng, 2012; Ong et al., 2009; Xu et al., 2013).
Delone and McLean’s (2003) Updated IS Success model portrays the Service Quality
construct alongside Information Quality and System Quality, although “each of these

142
quality dimensions [would] have different weights depending upon the level of analysis,”
context, and research purpose (p. 18). Xu et al. (2013) developed their 3Q Model for
e-service usability as an extension of the Wixom and Todd (2005) model by
incorporating Perceived Service Quality as another object-based belief. The researchers
provided evidence that Service Quality beliefs shaped users’ attitudes about service
satisfaction (an object-based attitude), which in turn positively influenced behavioral
beliefs regarding enjoyment, ease of use, and usefulness of a Web-based application
(2013). Figure 5.1 provides a second iteration of the adjusted Wixom and Todd model for
use in future survey research, with the proposed additional constructs highlighted.
Figure 5.1. Proposed Modifications to the Adjusted Wixom and Todd Model
Comments gleaned from the instructor interviews further support the addition of
these constructs, especially Service Quality, to the adjusted Wixom and Todd model. For
143
example, Brenda recited instances whereby students “never got a response back” from
MyITLab’s Online Student Support and that they had to access “the live chat, and
actually say, [the instructor] is here right now, why is this not working? Anything else,
like writing an e-mail, would just take forever.” Scott concurred that a number of students
“either called or wrote in and nobody got feedback or acknowledgment” from Pearson
regarding their problems. Andrew noted that “on the front page it says if you’ve got
issues with grading, contact MyITLab rather than your professor.” However, he found
that “students did not receive great support from MyITLab in terms of getting [their]
questions answered.” Some descriptive terms, such as “a black hole” and an “empty box”
where “there’s nobody home” were used by the instructors to chide the support services.
These negative experiences would undoubtedly impact one’s attitude towards an
educational technology solution, and should be included in future iterations of the
adjusted Wixom & Todd research model and survey instrument.
Limitations
The limitations of this study relate primarily to role of the researcher, context, and
methodology. To begin, the researcher, as the primary instrument for gathering and
analyzing data, is “limited by being human - that is, mistakes are made, opportunities are
missed, and personal biases interfere” (Merriam, 1998, p. 20). Especially given that the
research was conducted by a single person, these potential biases may have gone
unchecked possibly during data collection and analysis (Yin, 2003). As Merriam (1998)
writes, “all observations and analyses are filtered through that human being’s worldview,
values, and perspective,” which may or may not align with the readers’ (p.22). Patton
(2002) also emphasizes that qualitative analysis often benefits by the triangulation of
144
competencies and viewpoints of different investigators. To mitigate this limitation, the
role of the researcher has been fully documented in the methodology, in order to provide
the reader with an informed perspective for making their own judgements.
The context of this case study is a single computer literacy course in a large
community college in Western Canada. As a descriptive case study, the resulting analysis
and assertions should not be generalized outside of this context. Instead, the purpose of
the case study is to fully appreciate and understand this particular phenomenon (i.e., the
implementation of MyITLab) within this particular context (i.e., BuAd 128) at this
particular time (i.e., Fall, 2011). Regarding contextual validity, the course syllabus and
MyITLab software from Fall 2011 have been proven to be similar, if not identical, to
current offerings. So, while the data is four years old and limited in its generalizability to
other contexts, the study’s results may be used to inform on and generalize to theoretical
propositions and model construction for future research.
Methodological limitations refer to the data collection methods and analytical
techniques performed in the study. Assessing the validity and reliability of a case study
involves “examining its component parts — the validity and reliability of the
instrumentation, the appropriateness of the data analysis techniques, and the degree of
relationship between the conclusions drawn and the data upon which they presumably
rest.” (Merriam, 1998, p. 199). The purposeful selection of instructors and students from
a convenient population, together with the voluntariness of the online survey, limited the
data analysis to certain techniques. With respect to instrumentation, the student survey
incorporated previously-vetted questions; however, it had not been (and could not be due
to the sampling methodology) statistically tested as a complete instrument to confirm its

145
validity. This limitation was not deemed significant, given that the application of the
survey was for descriptive and not inferential purposes, and that the face validity of the
survey aligned directly with the two proven instruments from past empirical research.
With respect to the appropriateness of the data analysis techniques, the data
collection methods informed the analytical procedures directly. One analytical limitation
related to the use of Likert-type items for several model constructs, instead of creating
composite measures. Due to the voluntary nature of the student survey, along with the
late-semester timing, it was necessary to reduce the length of time required to complete
the survey in order to ensure an acceptable response rate. Therefore, questions were
removed that would have otherwise been combined to form more desirable summated
Likert scales; thus limiting the ability to standardize on means and variances for
comparative purposes. As it was, the survey response rate was only 46%, suggesting a
potential for voluntary response bias. Understanding these limitations, it is important to
note that the conclusions drawn in this study were based directly in the data, as shown by
the ample use of interview quotes, observations, and descriptive statistics.
Implications
Besides the future research opportunities already described for the adjusted
Wixom and Todd model, the practical implications of this case study are not surprisingly
rooted in both the technical and human elements. From a technical standpoint, any
educational technology that is adopted by instructors must work properly and seamlessly
in the classroom environment – advice which seems “Cubanesque” from Teachers and
Machines. For another example of “the more things change, the more they stay the same,”
Jenkins (2004) reported over a decade ago that the strengths of automated grading
146
systems included the following aspects: repeatability, reliability, accessibility, and the
immediacy of feedback. MyITLab certainly displays these student-centered
characteristics, and without question positively impacts instructors’ grading workloads.
However, students’ problems with the repeatability or accuracy of grading measures
negates all of these other positives. Even though the grading accuracy in MyITLab is
probably higher, stated one instructor, than what it would have been if he had done it
manually, students are not satisfied (nor should they be) with less than 100% accuracy.
Without this level of confidence and trustworthiness, the technology should be adopted
sparingly for assessment purposes. And, that is the critical point. MyITLab effectively
delivers time-on-task practice exercises, along with immediate feedback and access to
remedial learning resources, but instructors should not base students’ final grades on a
technology that is suspect. As witnessed with automated grading systems for essay
writing, the human grader cannot yet be replaced entirely, although the technology is
developing rapidly with recent advances in artificial intelligence. To summarize,
MyITLab should be implemented for the advantages the software provides in teaching
and learning, but used cautiously in computing students’ final grades.
Moving on to the human element, this research illustrates the need for instructors
and students to be fully trained on the use of an educational technology, such as
MyITLab. Additionally, instructors must feel knowledgeable, comfortable, and confident
in their understanding of how the technology will impact students, before being asked to
communicate and demonstrate its value in the classroom. As any software developer or
instructional designer will attest, the client (or instructor, in this case) should be involved
throughout the planning, design, development or acquisition, and implementation of an

147
educational technology in order to ensure “buy-in” and acceptance. Furthermore, to
maximize the potential benefit of the technology in the classroom, instructors must set
aside time to teach students how to navigate and access the features of the software and to
set realistic expectations for its implementation. These steps were largely bypassed in this
particular case, which may have impacted the instructors’ and students’ attitudes toward
and experiences with MyITLab in BuAd 128.
Conclusion
Computer literacy necessitates an understanding and appreciation of personal
computer technologies, along with specific skill proficiency in Microsoft Office
applications. Past research has demonstrated that computer literacy is an important
curricular component in higher education and that the majority of students do not possess
the level of software proficiency required for academic or workplace success. This
particular case study described and analyzed the impact and user experience of
implementing the MyITLab automated tutorial and grading software in a college-level
computer literacy course. Using a Web-based delivery system, this curriculum resource
promises to alleviate professor grading workloads and enhance student learning for
Microsoft Office training.
Using the case study methodology, data were collected from course documents,
classroom observations, instructor interviews, and student surveys. Using qualitative and
quantitative techniques, the data were analyzed and summarized to inform the research
purpose of providing insight into both instructor and student experiences with the
software, describing how instructors implement the software in a traditional classroom
environment, identifying opportunities or barriers for implementing the software, and
148
determining the levels of satisfaction and acceptance for students, with respect to learning
Microsoft Office. In addition to responding directly to the research objectives, several
analytic generalizations were formulated from the data to inform future curriculum
design and development decisions, including how:
1. MyITLab can effectively eliminate or, at least, reduce instructor grading
workloads for weekly assignments.
2. MyITLab provides the opportunity for students to get frequent corrective
feedback on their assignment submissions.
3. The prescriptive, step-by-step presentation of instructions in MyITLab
assignments may not solely meet the needs of solution-focused learning outcomes.
4. Instructors should be trained on MyITLab, in order to maximize the software’s
utility throughout the term.
5. The MyITLab solution bank of acceptable responses should be expanded by
Pearson Education, in order to reduce the potential for grading inaccuracies.
These assertions are grounded in the data and the researcher’s personal expertise in
Microsoft Office training. As a descriptive case study, these results are just one person’s
encounter with an innovative educational technology in a complex setting. The reader is,
therefore, encouraged to reconsider the information presented and generalize it for their
own purposes.

149
LIST OF REFERENCES
149
LIST OF REFERENCES
Ajzen, I. (1991). The theory of planned behavior. Organizational Behavior and Human
Decision Processes, 50, 179–211.
Ajzen, I., & Fishbein, M. (1980). Understanding attitudes and predicting social behavior.
Boston: Pearson Education.
Akilli, G. K. (2007). Games and simulations: A new approach in education? In D. Gibson,
C. Aldrich, & M. Prensky (Eds.), Games and simulations in online learning.
Research and development frameworks (pp. 1–20). Hershey: Information Science
Publishing.
Aldrich, C. (2005). Learning by doing: A comprehensive guide to simulations, computer
games, and pedagogy in e-learning and other educational experiences. San
Francisco: Pfeiffer.
ATLAS.ti Scientific Software Development GmbH. (2016). ATLAS.ti. Berlin, Germany.
Retrieved from http://atlasti.com/
Azevedo, R., & Bernard, R. M. (1995). A meta-analysis of the effects of feedback in
computer-based instruction. Journal of Educational Computing Research, 13(2),
111–127. doi:10.2190/9LMD-3U28-3A0G-FTQT
Balasubramanian, N., & Wilson, B. G. (2005). Games and simulations. ForSITE.
Retrieved from http://site.aace.org/pubs/foresite/GamesAndSimulations1.pdf
150
Baltzan, P., & Welsh, C. (2015). Business driven information systems (Fourth Canadian
edition). Whitby, Ontario: McGraw-Hill Ryerson.
Bandura, A. (1977). Self-efficacy: Toward a unifying theory of behavioral change.
Psychological Review, 84(2), 191–215. doi:10.1037/0033-295X.84.2.191
Bandura, A. (1993). Perceived self-efficacy in cognitive development and functioning.
Educational Psychologist, 28(2), 117–148. doi:10.1207/s15326985ep2802_3
Banerjee, S., & Kawash, J. (2009). Re-thinking computer literacy in post-secondary
education. In R. Brouwer, D. Cukierman, & G. Tsiknis (Eds.), Proceedings of the
14th Western Canadian Conference on Computing Education (WCCE 2009)
(pp. 17–21). New York, N.Y: ACM Press.
Bangert-Drowns, R. L., Kulik, C.-L. C., Kulik, J. A., & Morgan, M. (1991). The
instructional effect of feedback in test-like events. Review of Educational
Research, 61(2), 213–238. doi:10.3102/00346543061002213
Barrera, J. C. (2013). Computer literacy in undergraduate business education: The case
for the adult fast track programs. American Journal of Business Education, 6(4),
471–482. Retrieved from
http://www.cluteinstitute.com/ojs/index.php/AJBE/article/viewFile/7946/8001
Bartholomew, K. W. (2004). Computer literacy: Is the emperor still exposed after all
these years? Journal of Computing Sciences in Colleges, 20(1), 323–331.
Benbasat, I., & Barki, H. (2007). Quo vadis, TAM? Journal of the Association for
Information Systems, 8(4), 211–218.
151
Bennett, S., Maton, K., & Kervin, L. (2008). The ‘digital natives’ debate: A critical
review of the evidence. British Journal of Educational Technology, 39(5), 775–
786. doi:10.1111/j.1467-8535.2007.00793.x
Bloom, B. S., Engelhart, M. D., Furst, E. J., Hill, W. H., & Krathwohl, D. R. (1956).
Taxonomy of educational objectives: The classification of educational goals.
London, WI: Longmans, Green and Company.
Boettcher, J. V. (2007). Ten core principles for designing effective learning environments:
Insights from brain research and pedagogical theory. Innovate, 3(3). Retrieved
from http://www.innovateonline.info/index.php?view=article&id=54
Bonk, C. J., & Graham, C. R. (Eds.). (2006). The handbook of blended learning: Global
perspectives, local designs. San Francisco: Jossey-Bass.
Boone, H. N., & Boone, D. A. (2012). Analyzing Likert data. Journal of Extension, 50(2),
Art. 2TOT2. Retrieved from http://www.joe.org/joe/2012april/tt2.php
Bretz, R., & Johnson, L. (2000). An innovative pedagogy for teaching and evaluating
computer literacy. Information Technology and Management, 1(4), 283–292.
Bullen, M., Morgan, T., & Qayyum, A. (2011). Digital learners in higher education:
Generation is not the issue. Canadian Journal of Learning and Technology, 37(1),
1–24. Retrieved from http://www.cjlt.ca/index.php/cjlt/article/view/550

152
Canadian Institutes of Health Research, Natural Sciences and Engineering Research
Council of Canada, & Social Sciences and Humanities Research Council of
Canada. (2010). Tri-Council Policy Statement: Ethical conduct for research
involving humans. Retrieved from
http://www.pre.ethics.gc.ca/pdf/eng/tcps2/TCPS_2_FINAL_Web.pdf
Certiport Inc. (2012). Microsoft Office specialist 2010: Certify to succeed. Retrieved
from http://www.certiport.com/Portal/desktopdefault.aspx
Charmaz, K. (2003). Grounded theory: Objectivist and constructivist methods. In N. K.
Denzin & Y. S. Lincoln (Eds.), Strategies of qualitative inquiry (2nd ed., pp. 249–
291). Thousand Oaks, CA: SAGE Publications.
Chauhan, S., & Jaiswal, M. (2016). Determinants of acceptance of ERP software training
in business schools: Empirical investigation using UTAUT model. The
International Journal of Management Education, 14(3), 248–262.
doi:10.1016/j.ijme.2016.05.005
Cheng, Y.-M. (2012). Effects of quality antecedents on e-learning acceptance. Internet
Research, 22(3), 361–390.
Chickering, A. W., & Gamson, Z. F. (1987). Seven principles for good practice in
undergraduate education. AAHE Bulletin, 39(7), 3–7.
Ciampa, M. (2013, May). Student perceived importance and correlations of selected
computer literacy course topics. Journal of Instructional Pedagogies, 11.
Retrieved from http://www.aabri.com/manuscripts/131490.pdf
153
Clark, R. C., & Mayer, R. E. (2002). e-Learning and the science of instruction: Proven
guidelines for consumers and designers of multimedia learning. San Francisco:
Jossey-Bass Publishers.
Compeau, D. R., & Higgins, C. A. (1995). Computer self-efficacy: Development of a
measure and initial test. MIS Quarterly, 19(2), 189–211.
Cornell University. (2015). The Cornell note-taking system. Retrieved from
http://lsc.cornell.edu/wp-content/uploads/2015/10/Cornell-Note_Taking-
System.pdf
Corti, L., Day, A., & Backhouse, G. (2000). Confidentiality and informed consent: Issues
for consideration in the preservation of and provision of access to qualitative data
archives. Forum Qualitative Sozialforschung / Forum: Qualitative Social
Research, 1(3), Art. 7. Retrieved from http://nbn-resolving.de/urn:nbn:de:0114-
fqs000372
Couch A., & Keniston, K. (1960). Yeasayers and naysayers: Agreeing response set as a
personality variable. Journal of Abnormal and Social Psychology, 60, 151–174.
Courier, M., & Papp, R. (2005). Software applications in higher education: Necessary
evil? In Proceedings of the 2005 Southern Association of Information Systems
Conference (pp. 54–61).
Creighton, W., Kilcoyne, M., Tarver, R., & Wright, S. (2006). Computer literacy levels
of students enrolling in a post-secondary computer applications/information
technology course. Information Technology, Learning, and Performance Journal,
24(1), 15–23.
154
Creswell, J. W. (2003). Research design: Qualitative, quantitative, and mixed method
approaches (2nd ed.). Thousand Oaks, CA: SAGE Publications.
Creswell, J. W., & Miller, D. L. (2000). Determining validity in qualitative inquiry.
Theory into Practice, 39(3), 124–130. Retrieved from
https://people.ucsc.edu/~ktellez/Creswell_validity2000.pdf
Crookall, D., Oxford, R., & Saunders, D. (1987). Towards a reconceptualization of
simulation: From representation to reality. Simulation/Games for Learning, 17(4),
147–171.
Dahlstrom, E., Brooks, D. C., Grajek, S., & Reeves, J. (2015, December). The
ECAR study of undergraduate students and information technology, 2015.
Louisville, CO: EDUCAUSE Center for Applied Research (ECAR). Retrieved
from http://net.educause.edu/ir/library/pdf/ss15/ers1510ss.pdf
Davis, F. D. (1989). Perceived usefulness, perceived ease of use, and user acceptance of
information technology. MIS Quarterly, 13(3), 319–340.
Davis, F. D., Bagozzi, R. P., & Warshaw, P. R. (1989). User acceptance of computer
technology: A comparison of two theoretical models. Management Science, 35(8),
982–1003. doi:10.1287/mnsc.35.8.982
de Jong, T. (1991). Learning and instruction with computer simulations. Education and
Computing, 6(3-4), 217–229. doi:10.1016/0167-9287(91)80002-F
de Jong, T., & van Joolingen, W. R. (1998). Scientific discovery learning with computer
simulations of conceptual domains. Review of Educational Research, 68(2), 179–
201. doi:10.3102/00346543068002179
155
Debuse, J. C. W., Lawley, M., & Shibl, R. (2007). The implementation of an automated
assessment feedback and quality assurance system for ICT courses. Journal of
Information Systems Education, 18(4), 491–502.
Debuse, J. C. W., Lawley, M., & Shibl, R. (2008). Educators’ perceptions of automated
feedback systems. Australasian Journal of Educational Technology, 24(4), 374–
386.
Dednam, E. (2009). Away with computer literacy modules at universities, or not? In
Proceedings of SACLA '09 (pp. 23–32). New York: ACM Press.
DeLone, W. H., & McLean, E. R. (2003). The DeLone and McLean model of
information systems success: A ten-year update. Journal of Management
Information Systems, 19(4), 9–30.
Dipietro, M., Ferdig, R. E., Boyer, J., & Black, E. W. (2007). Towards a framework for
understanding electronic educational gaming. Journal of Educational Multimedia
and Hypermedia, 16(3), 225–248.
Doll, W. J., & Torkzadeh, G. (1988). The measurement of end-user computing
satisfaction. MIS Quarterly, 12(2), 259–274.
Driscoll, M. P. (2005). Psychology of learning for instruction (3rd ed.). Boston, MA:
Pearson Education.
Eichelberger, M., & Imler, B. B. (2015). "How do I send email?": Technology challenges
for first-year students in the college library. Library Hi Tech, 33(3), 329–339.
doi:10.1108/LHT-03-2015-0027
156
Edmiston, E., & McClelland, M. (2001). A conversation about ensuring computer
literacy of first-year students. Journal of Computing Sciences in Colleges, 16(2),
306–316.
Epperson, A. (2010). Computer literacy revisited: A comprehensive investigation of
computer literacy. ACM Inroads, 1(2), 30–33. doi:10.1145/1805724.1805736
Fishbein, M., & Ajzen, I. (1975). Belief, attitude, intention and behavior: An introduction
to theory and research. Reading, MA: Addison-Wesley. Retrieved from
http://people.umass.edu/aizen/f&a1975.html
Friese, S. (2012). Qualitative data analysis with ATLAS.ti. Thousand Oaks, CA: SAGE
Publications.
Gall, M. D., Gall, J. P., & Borg, W. R. (2007). Educational research: An introduction
(8th ed.). Boston: Pearson Education.
Gatto, D. (1993). The use of interactive computer simulations in training. Australasian
Journal of Educational Technology, 9(2), 144–156.
Gharawi, M. A., & Khoja, M. M. (2015). Assessing basic computer applications' skills of
college-level students in Saudi Arabia. International Journal of Social,
Behavioral, Educational, Economic, Business, and Industrial Engineering, 9(4),
1240–1245. Retrieved from http://scholar.waset.org/1999.10/10001078
Gliem, J. A., & Gliem, R. R. (2003). Calculating, interpreting, and reporting Cronbach's
alpha reliability coefficient for Likert-type scales. 2003 Midwest Research to
Practice Conference in Adult, Continuing, and Community Education.
157
Goodfellow, M., & Wade, B. (2007). The digital divide and first-year students. Journal of
College Student Retention, 8(4), 425–438.
Grant, D. M., Malloy, A. D., & Murphy, M. C. (2009). A comparison of student
perceptions of their computer skills to their actual abilities. Journal of Information
Technology Education, 8, 141–160.
Grenci, R. T. (2013). Positioning computer literacy as a value-added business core course.
Business Education and Accreditation, 5(1), 67–80. Retrieved from
ftp://ftp.repec.org/opt/ReDIF/RePEc/ibf/beaccr/bea-v5n1-2013/BEA-V5N1-2013-
6.pdf
Gupta, G. K. (2006). Computer literacy: Essential in today's computer-centric world.
ACM Inroads, 38(2), 115–120.
Hanson, B., Kilcoyne, M., Perez-Mira, B., Hanson, T., & Champion, S. (2011). Digital
knowledge and application skills: A comparison study of entering freshman.
Journal of Research in Business Information Systems, 4(4), 60–68.
Hardy, C., Heeler, P., & Brooks, D. W. (2006). Are high school graduates
technologically ready for post-secondary education? Journal of Computing
Sciences in Colleges, 21(4), 52–60.
Hasan, B., & Ali, J. M. H. (2004). An empirical examination of a model of computer
learning performance. Journal of Computer Information Systems, 44(4), 27–33.
Herrington, J., & Oliver, R. G. (1999). Using situated learning and multimedia to
investigate higher-order thinking. Journal of Interactive Learning Research, 10(1),
3–24.

158
Higgins, R., Hartley, P., & Skelton, A. (2002). The conscientious consumer:
Reconsidering the role of assessment feedback in student learning. Studies in
Higher Education, 27(1), 53–64. doi:10.1080/03075070120099368
Hoffman, M. E., & Blake, J. (2003). Computer literacy: Today and tomorrow. Journal of
Computing Sciences in Colleges, 18(5), 221–233.
Hoffman, M. E., & Vance, D. R. (2005). Computer literacy: What students know and
from whom they learned it. In SIGCSE '05 Proceedings of the 36th Technical
Symposium on Computer Science Education (pp. 356–360). New York:
ACM Press.
Hoffman, M. E., & Vance, D. R. (2008). Computer literacy: A student-oriented
perspective. Journal of Computing Sciences in Colleges, 23(5), 90–100.
IBM Corporation. (2016). IBM SPSS Statistics. Retrieved from
http://www.ibm.com/analytics/us/en/technology/spss/
Jenkins, M. (2004). Unfulfilled promise: Formative assessment using computer-aided
assessment. Learning and Teaching in Higher Education, 2004-05(1), 67–80.
Johnson, D. W., Bartholomew, K. W., & Miller, D. (2006). Improving computer literacy
of business management majors: A case study. Journal of Information
Technology Education, 5, 77–94.
Jones, C., Ramanau, R., Cross, S., & Healing, G. (2010). Net generation or digital natives:
Is there a distinct new generation entering university? Computers & Education,
54(3), 722–732. doi:10.1016/j.compedu.2009.09.022

159
Kalman, H. K., & Ellis, M. L. (2007). Improving undergraduate computer instruction:
Experiments and strategies. AACE Journal, 15(1), 23–38.
Kaminski, K., Switzer, J., & Gloeckner, G. (2009). Workforce readiness: A study of
university students’ fluency with information technology. Computers &
Education, 53(2), 228–233. doi:10.1016/j.compedu.2009.01.017
Karsten, R., & Schmidt, D. (2008). Business student computer self-efficacy: Ten years
later. Journal of Information Systems Education, 19(4), 445–453.
Kennedy, G. E., Judd, T. S., Churchward, A., Gray, K., & Krause, K.-L. (2008). First
year students’ experiences with technology: Are they really digital natives?
Australasian Journal of Educational Technology, 24(1), 108–122.
Kirriemuir, J., & McFarlane, A. (2004). Report 8: Literature review in games and
learning. FutureLab Series. Retrieved from
http://www.futurelab.org.uk/resources/documents/lit_reviews/Games_Review.pdf
Koh, C. E., Prybutok, V. R., Ryan, S. D., & Wu, Y. (2010). A model for mandatory use
of software technologies: An integrative approach by applying multiple levels of
abstraction of informing science. Informing Science: The International Journal of
an Emerging Transdiscipline, 13, 177–203. Retrieved from
http://www.inform.nu/Articles/Vol13/ISJv13p177-203Koh561.pdf
Kulhavy, R. W., & Stock, W. A. (1989). Feedback in written instruction. Educational
Psychology Review, 1(4), 279–308.
160
Kvavik, R. B., & Caruso, J. B. (2005). Study of students and information technology,
2005: Convenience, connection, control, and learning. Boulder, CO: EDUCAUSE
Center for Applied Research (ECAR). Retrieved from
http://www.educause.edu/ers0506
Lakhal, S., & Khechine, H. (2016). Student intention to use desktop web-conferencing
according to course delivery modes in higher education. International Journal of
Management Education, 14(2), 146–160. doi:10.1016/j.ijme.2016.04.001
Lakhal, S., Khechine, H., & Pascott, D. (2013). Student behavioural intentions to use
desktop video conferencing in a distance course: Integration of autonomy to the
UTAUT model. Journal of Computing in Higher Education, 25(2), 93–121.
doi:10.1007/s12528-013-9069-3
LeCompte, M. D., Preissle, J., & Tesch, R. (1993). Ethnography and qualitative design in
educational research (2nd ed.). San Diego: Academic Press.
Lee, T.-H., Shen, P.-D., & Tsai, C.-W. (2010). Enhance students' computing skills via
web-mediated self-regulated learning with feedback in blended environment.
International Journal of Technology and Human Interaction, 6(1), 15–32.
doi:10.4018/jthi.2010091702
Lee, Y.-C. (2008). The role of perceived resources in online learning adoption.
Computers & Education, 50(4), 1423–1438. doi:10.1016/j.compedu.2007.01.001
Legris, P., Ingham, J., & Collerette, P. (2003). Why do people use information
technology? A critical review of the technology acceptance model. Information
& Management, 40(3), 191–204. doi:10.1016/S0378-7206(01)00143-4
161
Lund Research. (2016). Laerd Statistics. Retrieved from http://statistics.laerd.com
Lwoga, E. T. (2014). Critical success factors for adoption of web-based learning
management systems in Tanzania. International Journal of Education and
Development using Information and Communication Technology, 10(1), 4–21.
Mahmood, M. A., Burn, J. M., Gemoets, L. A., & Jacquez, C. (2000). Variables affecting
information technology end-user satisfaction: A meta-analysis of the empirical
literature. International Journal of Human-Computer Studies, 52(4), 751–771.
doi:10.1006/ijhc.1999.0353
Marangunić, N., & Granić, A. (2015). Technology acceptance model: A literature review
from 1986 to 2013. Universal Access in the Information Society, 14(1), 81–95.
doi:10.1007/s10209-014-0348-1
Martin, F., & Dunsworth, Q. (2007). A methodical formative evaluation of computer
literacy course: What and how to teach. Journal of Information Technology
Education, 6.
Martin, F., Klein, J. D., & Sullivan, H. (2007). The impact of instructional elements in
computer-based instruction. British Journal of Educational Technology, 38(4),
623–636. doi:10.1111/j.1467-8535.2006.00670.x
Mason, B. J., & Bruning, R. (2001). Providing feedback in computer-based instruction:
What the research tells us. Retrieved from
http://dwb.unl.edu/Edit/MB/MasonBruning.html

162
Mathieson, K. (1991). Predicting user intentions: Comparing the technology acceptance
model with the theory of planned behavior. Information Systems Research, 2(3),
173–191.
Merriam, S. B. (1998). Qualitative research and case study applications in education
(2nd ed.). San Francisco: Jossey-Bass Publishers.
Moore, D. S., & McCabe, G. P. (2005). Introduction to the practice of statistics (5th ed.).
New York: W.H. Freeman & Co.
Moore, G. C., & Benbasat, I. (1991). Development of an instrument to measure the
perceptions of adopting an information technology innovation. Information
Systems Research, 2(3), 192–222.
Morrison, G. R., Ross, S. M., Gopalakrishnan, M., & Casey, J. (1995). The Effects of
feedback and incentives on achievement in computer-based instruction.
Contemporary Educational Psychology, 20(1), 32–50.
doi:10.1006/ceps.1995.1002
Mory, E. H. (2004). Feedback research revisited. In D. H. Jonassen (Ed.), Handbook of
research on educational communications and technology (2nd ed., pp. 745–783).
Mahwah, NJ: Lawrence Erlbaum Associates.
Murray, M., Hooper, J., & Perez, J. (2007). A project-based approach to assessing student
competency with productivity software. In Proceedings of SIG-ED IAIM 2007
Conference .

163
Narciss, S., & Huth, K. (2004). How to design informative tutoring feedback for
multimedia learning. In H. M. Niegemann, D. Leutner, & R. Brünken (Eds.),
Instructional design for multimedia learning (pp. 181–195). Münster: Waxmann.
Nistor, N., Gögüs, A., & Lerche, T. (2013). Educational technology acceptance across
national and professional cultures: A European study. Educational Technology
Research and Development, 61(4), 733–749. doi:10.1007/s11423-013-9292-7
Nunnally, J. C., & Bernstein, I. H. (1994). Psychometric theory (3rd ed.). McGraw-Hill
series in psychology. New York, NY: McGraw-Hill.
Oblinger, D. G., & Oblinger, J. L. (2005). Is it age or IT: First steps toward understanding
the net generation. In D. G. Oblinger, J. L. Oblinger, & C. Windham (Eds.),
Educating the net generation (pp. 2.1-2.20). Boulder, CO: EDUCAUSE.
Ong, C.-S., Day, M.-Y., & Hsu, W.-L. (2009). The measurement of user satisfaction with
question answering systems. Information & Management, 46(7), 397–403.
doi:10.1016/j.im.2009.07.004
Palvia, S. C. J., & Palvia, P. C. (2007). The effectiveness of using computers for software
training: An exploratory study. Journal of Information Systems Education, 18(4),
479–489.
Park, S. Y. (2009). An analysis of the technology acceptance model in understanding
university students' behavioral intention to use e-learning. Educational
Technology & Society, 12(3), 150–162.
Patton, M. Q. (2002). Qualitative research & evaluation methods (3rd ed.). Thousand
Oaks, CA: SAGE Publications.
164
Peat, M., & Franklin, S. (2002). Supporting student learning: The use of computer-based
formative assessment modules. British Journal of Educational Technology, 33(5),
515–523.
Perez, J., Murray, M., & Myers, M. (2007). An information technology literacy self-
assessment instrument: Development and pilot results. In Proceedings of 13th
Americas Conference on Information Systems (AMCIS) .
Poelmans, S., Truyen, F., & Desle, R. (2009). Perceived computer literacy among
different types of (under)grad students: Findings of a survey. ICERI2009
Proceedings, 4910–4921.
Prensky, M. (2001a). Digital natives, digital immigrants. On the Horizon, 9(5).
Prensky, M. (2001b). Do they really think differently? On the Horizon, 9(6).
Pukelsheim, F. (1994). The Three Sigma Rule. The American Statistician, 48(2), 88.
doi:10.2307/2684253
Punnoose, A. C. (2012). Determinants of intention to use eLearning based on the
technology acceptance model. Journal of Information Technology
Education: Research, 11, 301–337.
Quora website. (2011). Do people know how to use Microsoft Office? Quora.com.
Retrieved from http://www.quora.com/Microsoft-Word/Do-people-know-how-to-
use-Microsoft-Office

165
Reeves, T. C., & Oh, E. (2008). Generational differences. In J. M. Spector, M. D. Merrill,
J. J. G. van Merrienboer, & M. P. Driscoll (Eds.), Handbook of research on
educational communications and technology (3rd ed., pp. 295–303). New York:
Lawrence Erlbaum Associates.
Rondeau, P. J., & Li, X. (2009). The impact of a computer proficiency exam on business
students' admission to and performance in a higher-level IT course. Journal of
Information Systems Education, 20(4), 477–485.
Ruben, B. D. (1999). Simulations, games, and experience-based learning: The quest for a
new paradigm for teaching and learning. Simulation & Gaming, 30(4), 498–505.
doi:10.1177/104687819903000409
Saldaña, J. (2009). The coding manual for qualitative researchers. Thousand Oaks, CA:
SAGE Publications.
Shute, V. J. (2008). Focus on formative feedback. Review of Educational Research, 78(1),
153–189. doi:10.3102/0034654307313795
Smith, P. L., & Ragan, T. J. (2005). Instructional design (3rd ed.). Hoboken, N.J: J.
Wiley & Sons.
Stewart, A. N. (2016). An assessment comparing community college students' computer
self-efficacy and task-based computer knowledge (Doctoral Dissertation).
University of Southern Mississippi. Retrieved from
http://aquila.usm.edu/dissertations/354/
Tapscott, D. (1998). Growing up digital: The rise of the net generation. New York:
McGraw-Hill.
166
Tapscott, D. (2009). Grown up digital: How the net generation is changing your world.
New York: McGraw-Hill.
Taylor, S., & Todd, P. A. (1995). Understanding information technology usage: A test of
competing models. Information Systems Research, 6(2), 144–176.
doi:10.1287/isre.6.2.144
Tesch, D. B., Murphy, M. C., & Crable, E. (2006). Implementation of a basic computer
skills assessment mechanism for incoming freshmen. Information Systems
Education Journal, 4(13).
Varank, I. (2006). A comparison of a computer-based and a lecture-based computer
literacy course. Eurasia Journal of Mathematics, Science and Technology
Education, 2(3), 112–123.
Venables, A., & Tan, G. (2009). Realizing learning in the workplace in an undergraduate
IT program. Journal of Information Technology Education, 8, 17–26. Retrieved
from http://www.jite.informingscience.org/documents/Vol8/JITEV8IIP017-
026Venables706.pdf
Venkatesh, V., & Davis, F. D. (2000). A theoretical extension of the technology
acceptance model: Four longitudinal field studies. Management Science, 46(2),
186–204. doi:10.1287/mnsc.46.2.186.11926
Venkatesh, V., Morris, M. G., Davis, G. B., & Davis, F. D. (2003). User acceptance of
information technology: Toward a unified view. MIS Quarterly, 27(3), 425–478.
VERBI GmbH. (2016). MAXQDA. Berlin, Germany. Retrieved from
http://www.maxqda.com/

167
Wallace, P., & Clariana, R. B. (2005). Perception versus reality - Determining business
students’ computer literacy skills and need for instruction in information concepts
and technology. Journal of Information Technology Education, 4, 141–151.
Weinberg, S. L., & Abramowitz, S. K. (2008). Statistics using SPSS: An integrative
approach (2nd ed.). Cambridge, New York: Cambridge University Press.
Wixom, B. H., & Todd, P. A. (2005). A theoretical integration of user satisfaction and
technology acceptance. Information Systems Research, 16(1), 85–102.
doi:10.1287/isre.1050.0042
Xu, J., Benbasat, I., & Cenfetelli, R. T. (2013). Integrating service quality with system
and information quality: An empirical test in the e-service context. MIS Quarterly,
37(3), 777–794.
Yin, R. K. (2003). Case study research: Design and methods (3rd). Applied social
research methods series, Volume 5. Thousand Oaks, CA: SAGE Publications.
Zandvliet, D., & Farragher, P. (1997). A comparison of computer-administered and
written tests. Journal of Research on Computing in Education, 29(2), 423–438.
Zimmerman, B. J. (1990). Self-regulated learning and academic achievement: An
overview. Educational Psychologist, 25(1), 3–17.
doi:10.1207/s15326985ep2501_2

APPENDICES

168
Appendix A. BuAd 128 Course Syllabus (Fall 2011)
Figure A.1. BuAd 128 Course Syllabus (page 1 of 4)
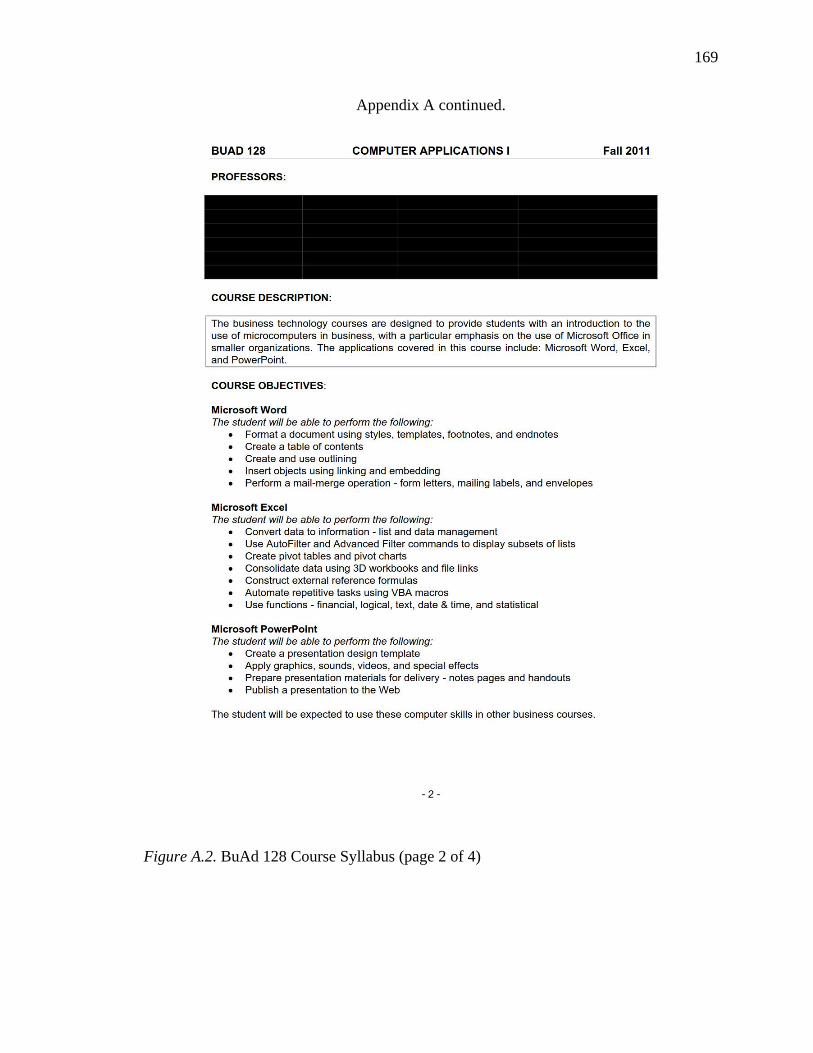
169
Appendix A continued.
Figure A.2. BuAd 128 Course Syllabus (page 2 of 4)
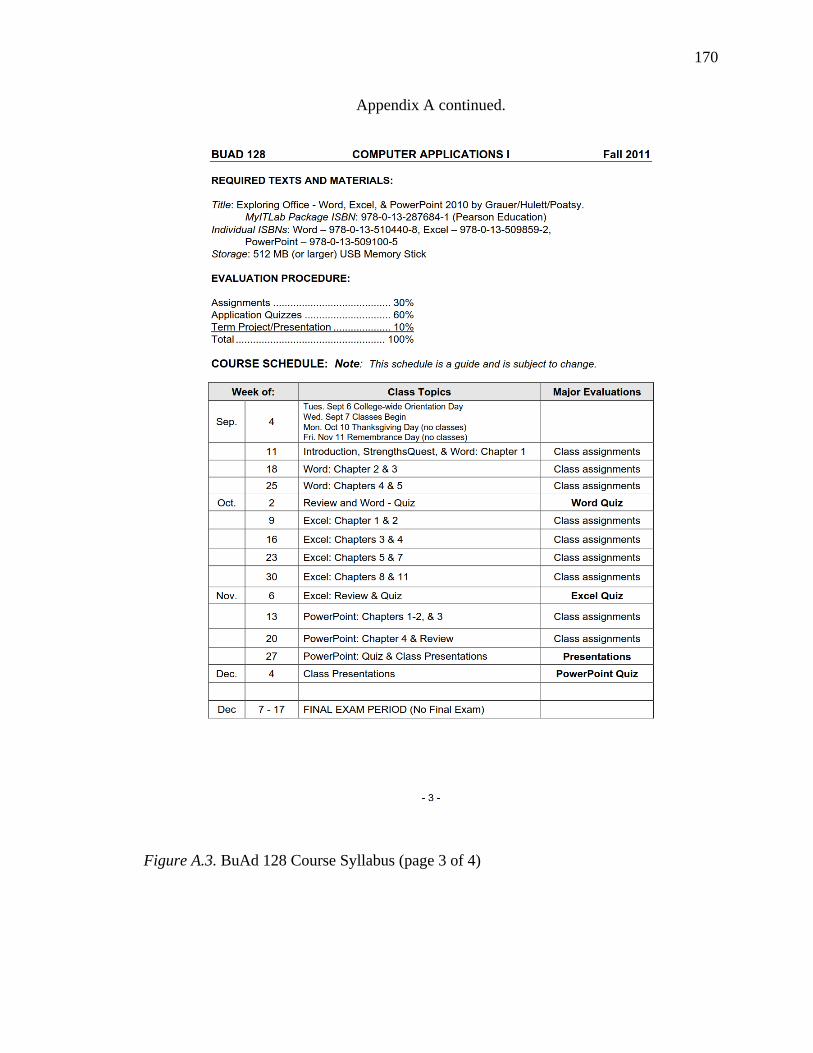
170
Appendix A continued.
Figure A.3. BuAd 128 Course Syllabus (page 3 of 4)
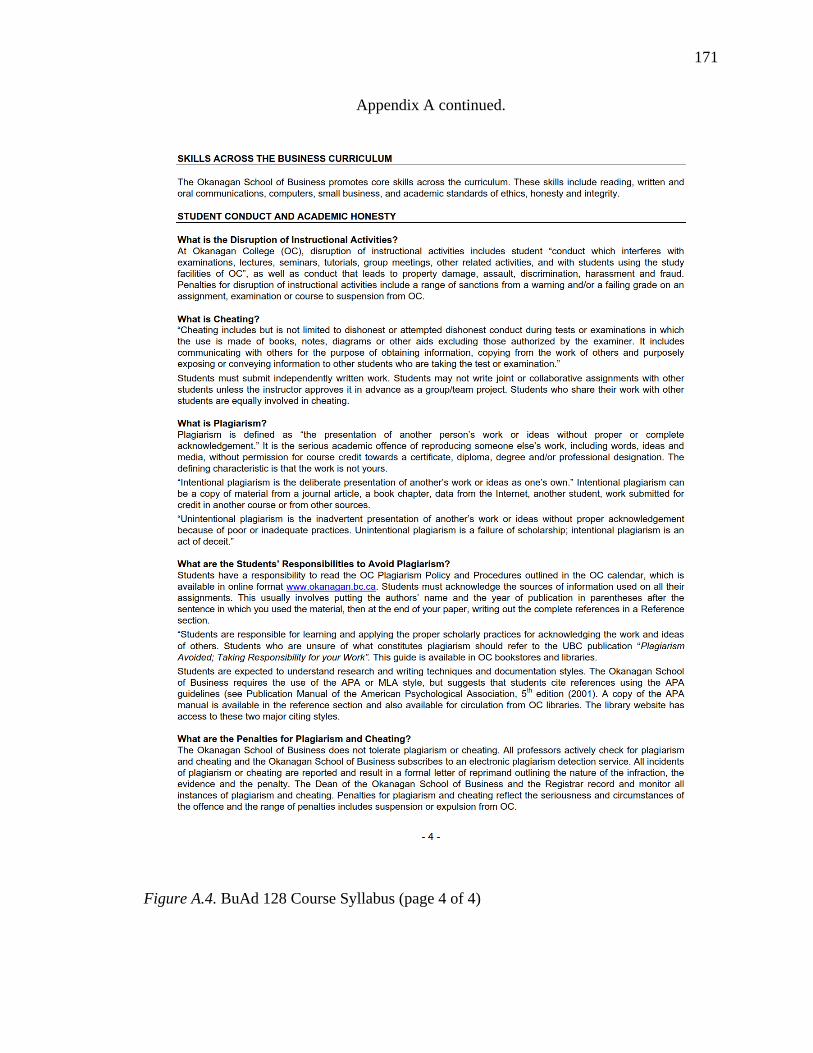
171
Appendix A continued.
Figure A.4. BuAd 128 Course Syllabus (page 4 of 4)
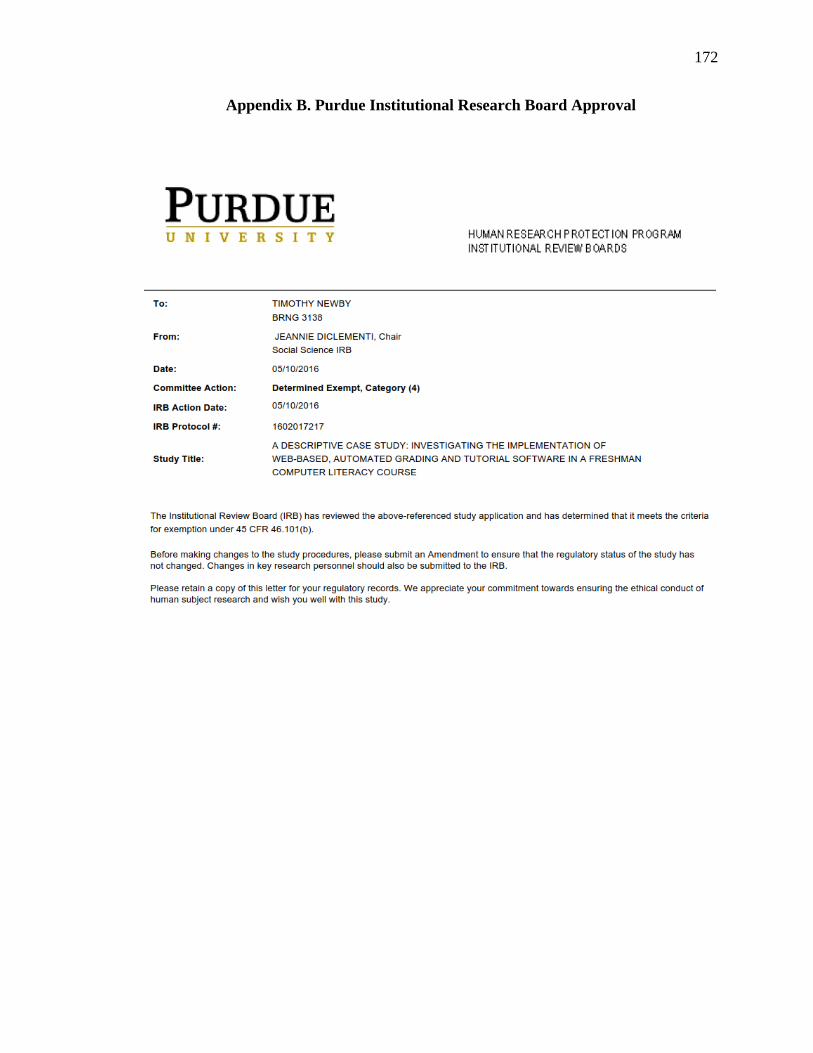
172
Appendix B. Purdue Institutional Research Board Approval
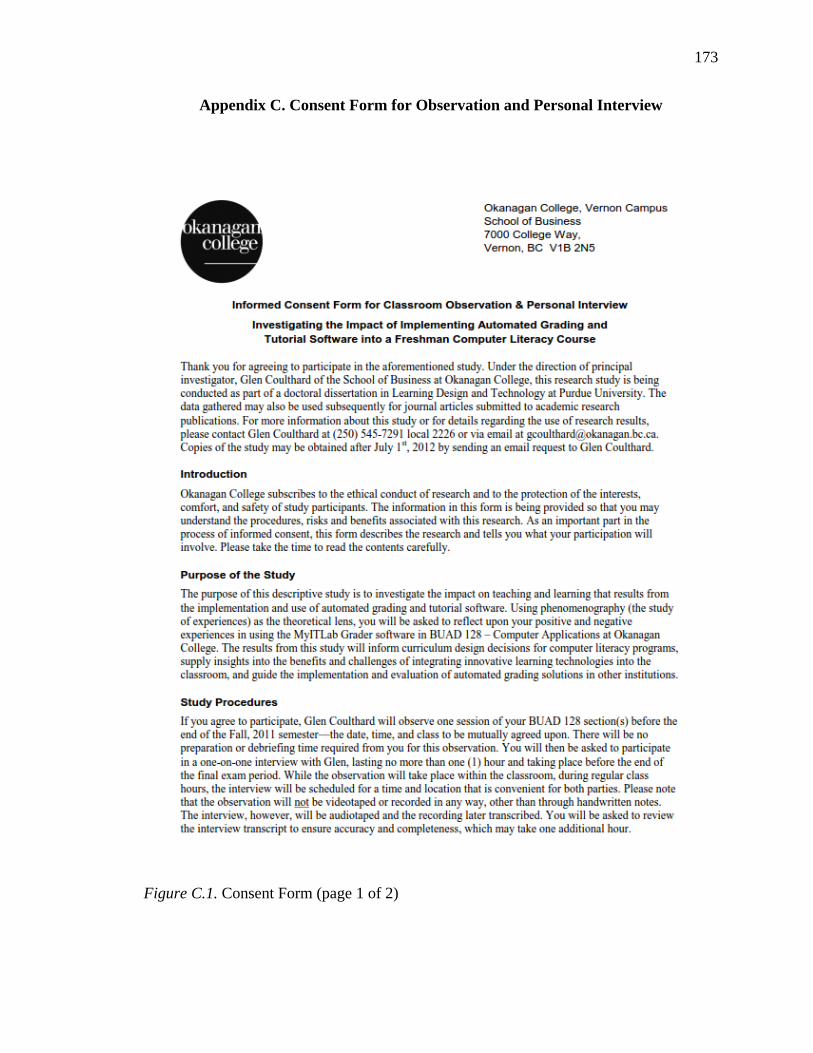
173
Appendix C. Consent Form for Observation and Personal Interview
Figure C.1. Consent Form (page 1 of 2)

174
Appendix C continued.
Figure C.2. Consent Form (page 2 of 2)
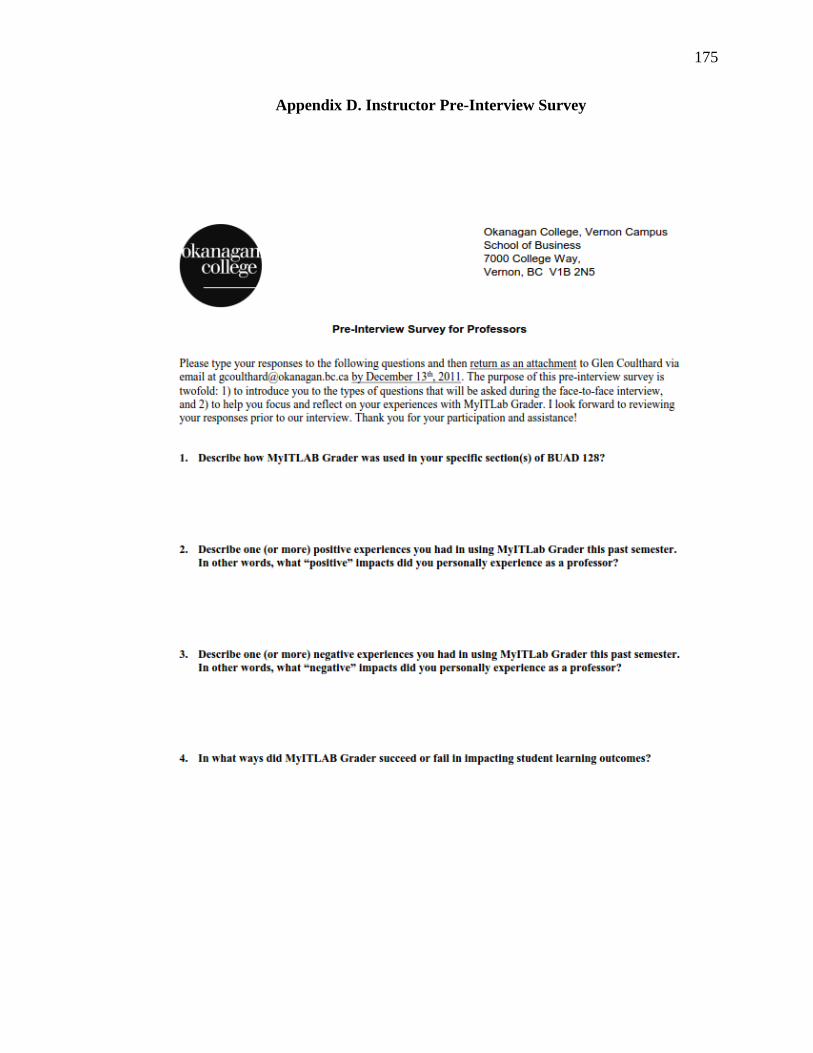
175
Appendix D. Instructor Pre-Interview Survey
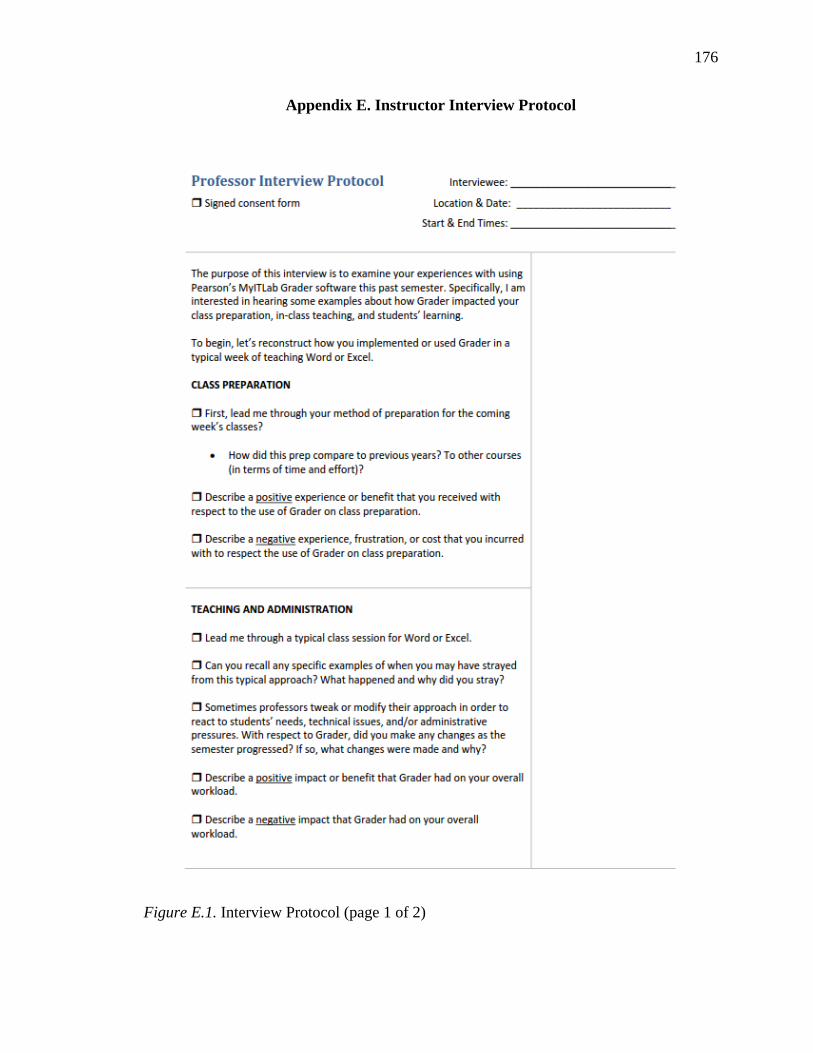
176
Appendix E. Instructor Interview Protocol
Figure E.1. Interview Protocol (page 1 of 2)
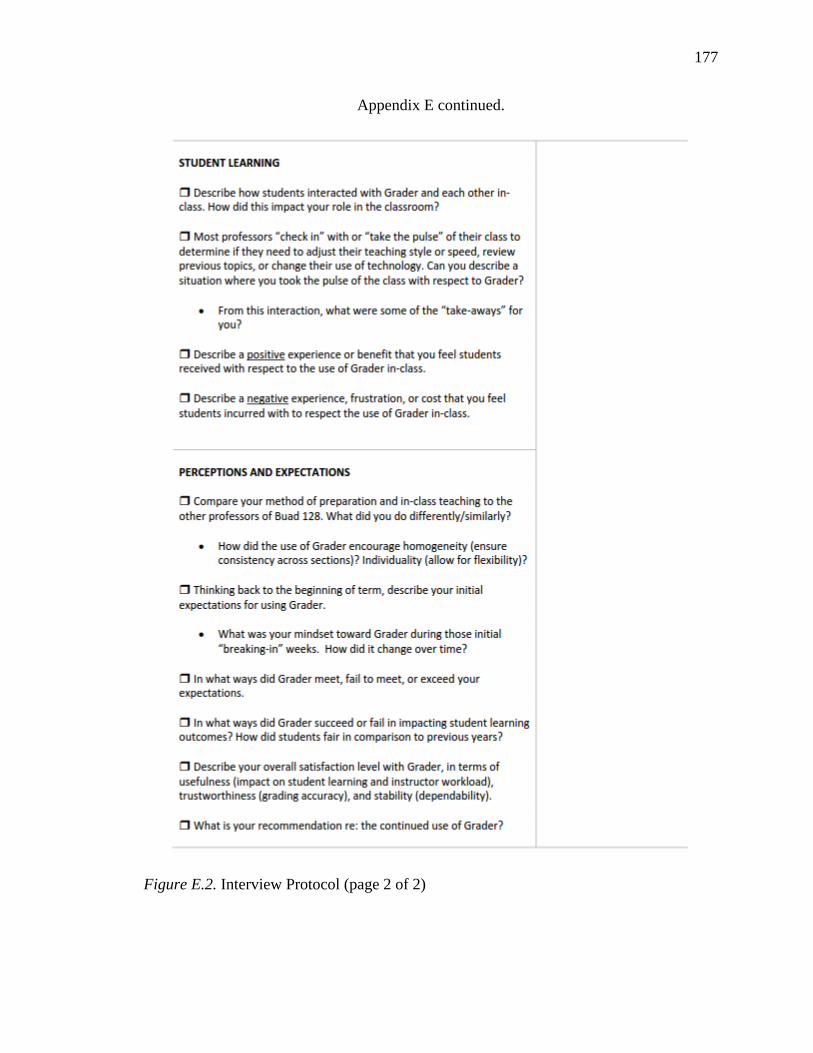
177
Appendix E continued.
Figure E.2. Interview Protocol (page 2 of 2)
178
Appendix F. Student Questionnaire Welcome Screen
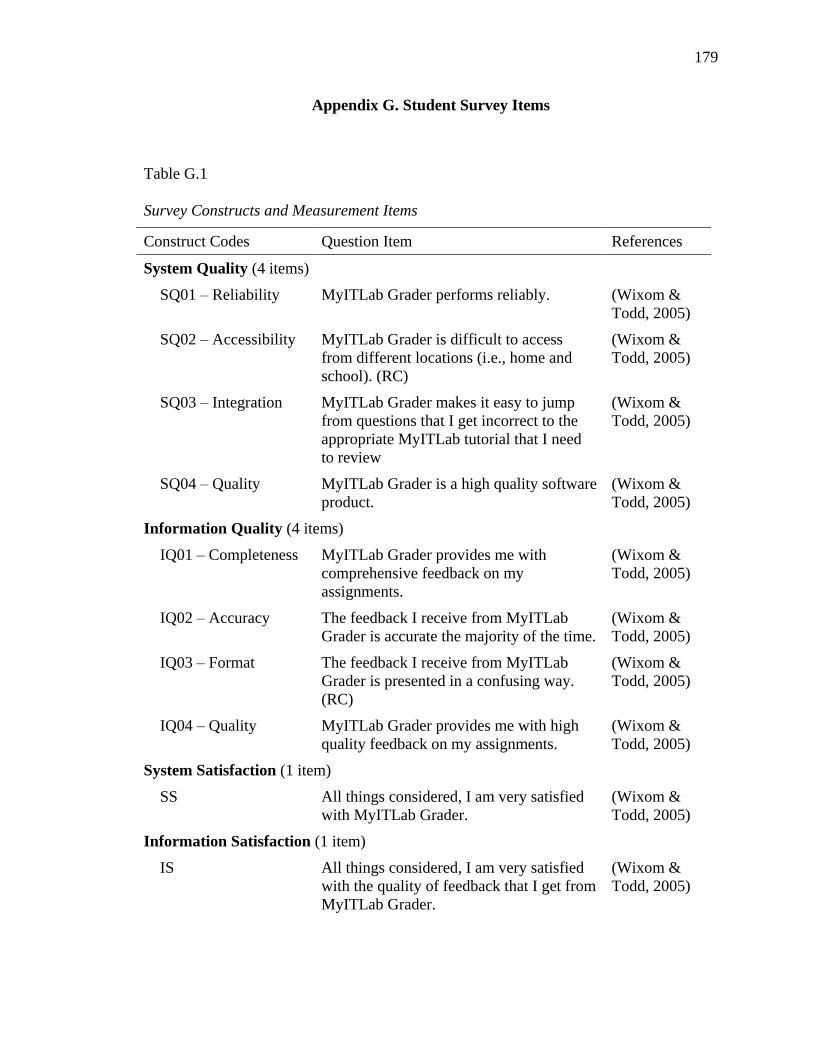
179
Appendix G. Student Survey Items
Table G.1
Survey Constructs and Measurement Items
Construct Codes Question Item References
System Quality (4 items)
SQ01 – Reliability MyITLab Grader performs reliably. (Wixom &
Todd, 2005)
SQ02 – Accessibility MyITLab Grader is difficult to access
from different locations (i.e., home and
school). (RC)
(Wixom &
Todd, 2005)
SQ03 – Integration MyITLab Grader makes it easy to jump
from questions that I get incorrect to the
appropriate MyITLab tutorial that I need
to review
(Wixom &
Todd, 2005)
SQ04 – Quality MyITLab Grader is a high quality software
product.
(Wixom &
Todd, 2005)
Information Quality (4 items)
IQ01 – Completeness MyITLab Grader provides me with
comprehensive feedback on my
assignments.
(Wixom &
Todd, 2005)
IQ02 – Accuracy The feedback I receive from MyITLab
Grader is accurate the majority of the time.
(Wixom &
Todd, 2005)
IQ03 – Format The feedback I receive from MyITLab
Grader is presented in a confusing way.
(RC)
(Wixom &
Todd, 2005)
IQ04 – Quality MyITLab Grader provides me with high
quality feedback on my assignments.
(Wixom &
Todd, 2005)
System Satisfaction (1 item)
SS All things considered, I am very satisfied
with MyITLab Grader.
(Wixom &
Todd, 2005)
Information Satisfaction (1 item)
IS All things considered, I am very satisfied
with the quality of feedback that I get from
MyITLab Grader.
(Wixom &
Todd, 2005)

180
Table G.1 continued.
Construct Codes Question Item References
Ease-of-Use (2 items)
EU01 I found MyITLab Grader difficult to use.
(RC)
(Wixom &
Todd, 2005)
EU02 I found MyITLab Grader easy to learn. (Venkatesh
et al., 2003)
Social Norms (4 items)
SN01 My instructor thinks that MyITLab Grader
is a high-quality software product.
(Venkatesh
et al., 2003)
SN02 My instructor believes that the feedback
from MyITLab Grader helps me to learn
Microsoft Office.
(Venkatesh
et al., 2003)
SN03 My peers think that MyITLab Grader is a
high-quality software product.
(Venkatesh
et al., 2003)
SN04 My peers think that the feedback from
MyITLab Grader helps them to learn
Microsoft Office.
(Venkatesh
et al., 2003)
Usefulness (2 items)
PE01 MyITLab Grader provides feedback that
helps me to learn Microsoft Office.
(Lee, 2008)
PE02 The feedback from MyITLab Grader did
not improve my skills in working with
Microsoft Office. (RC)
(Lee, 2008)
Attitude (4 items)
AT01 I dislike the idea of using an automated
grading system like MyITLab Grader.
(RC)
(Wixom &
Todd, 2005)
AT02 My attitude toward using MyITLab Grader
is very favorable.
(Wixom &
Todd, 2005)
AT03 MyITLab Grader has made me better
aware of my skill level in using Microsoft
Office.
(Venkatesh
et al., 2003)
AT04 Overall, my use of MyITLab Grader has
improved my skills in working with
Microsoft Office.
(Koh et al.,
2008)
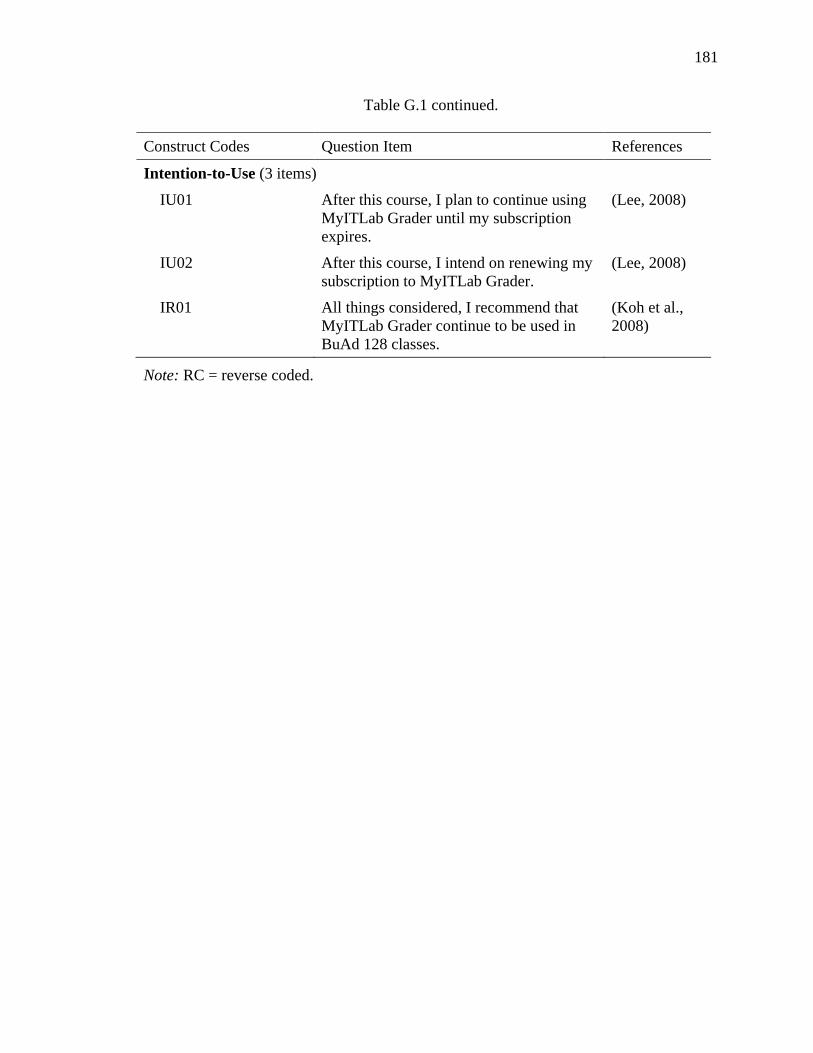
181
Table G.1 continued.
Construct Codes Question Item References
Intention-to-Use (3 items)
IU01 After this course, I plan to continue using
MyITLab Grader until my subscription
expires.
(Lee, 2008)
IU02 After this course, I intend on renewing my
subscription to MyITLab Grader.
(Lee, 2008)
IR01 All things considered, I recommend that
MyITLab Grader continue to be used in
BuAd 128 classes.
(Koh et al.,
2008)
Note: RC = reverse coded.
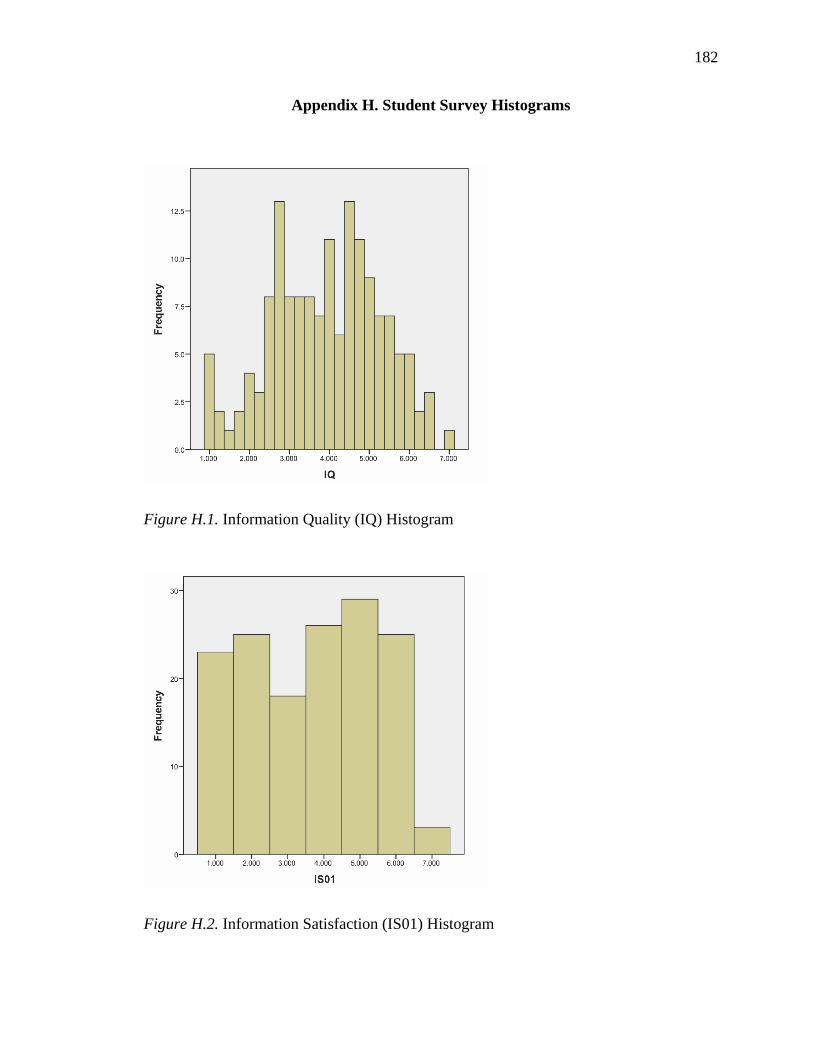
182
Appendix H. Student Survey Histograms
Figure H.1. Information Quality (IQ) Histogram
Figure H.2. Information Satisfaction (IS01) Histogram
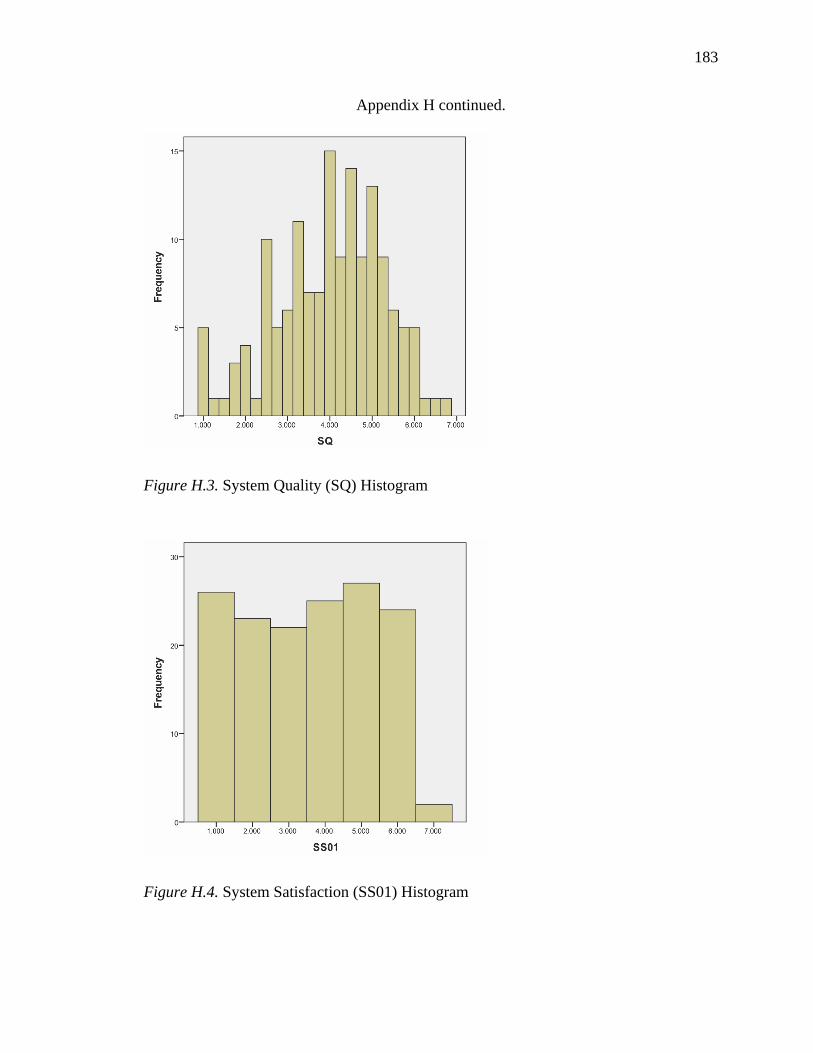
183
Appendix H continued.
Figure H.3. System Quality (SQ) Histogram
Figure H.4. System Satisfaction (SS01) Histogram

184
Appendix H continued.
Figure H.5. Usefulness of Feedback (PE01) Histogram
Figure H.6. Usefulness of Feedback (PE02) Histogram

185
Appendix H continued.
Figure H.7. Ease-of-Use for Usability (EU01) Histogram
Figure H.8. Ease-of-Use for Learnability (EU02) Histogram
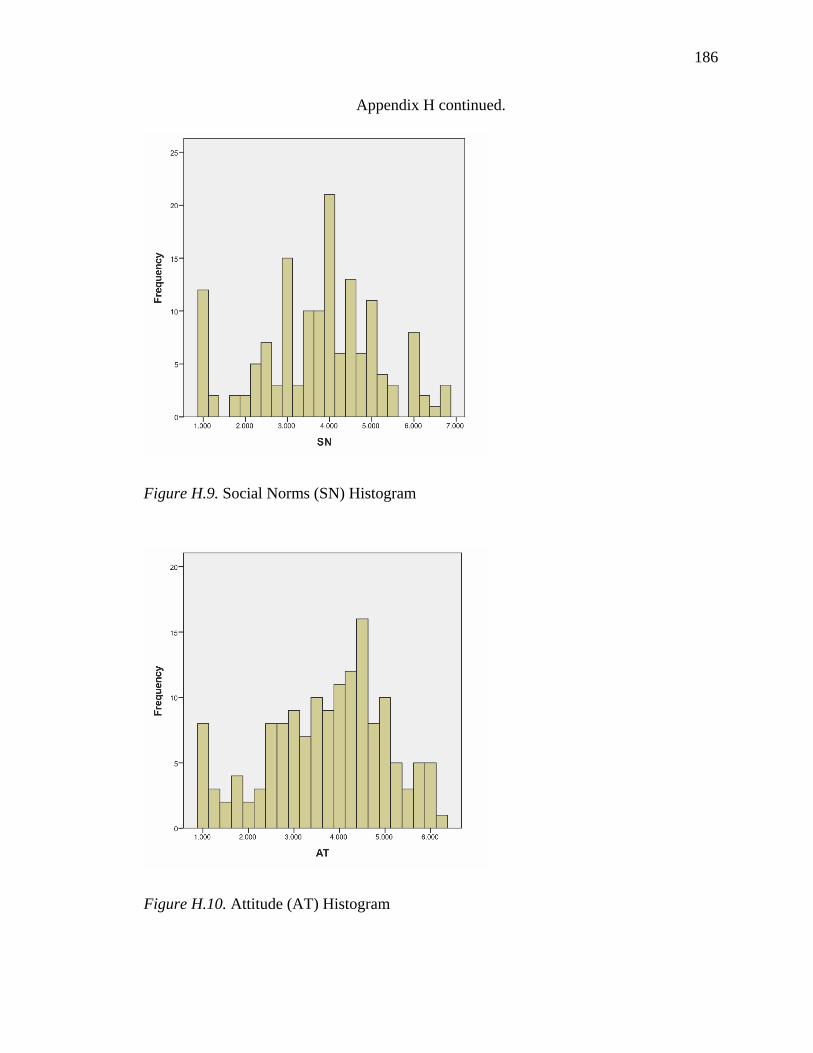
186
Appendix H continued.
Figure H.9. Social Norms (SN) Histogram
Figure H.10. Attitude (AT) Histogram
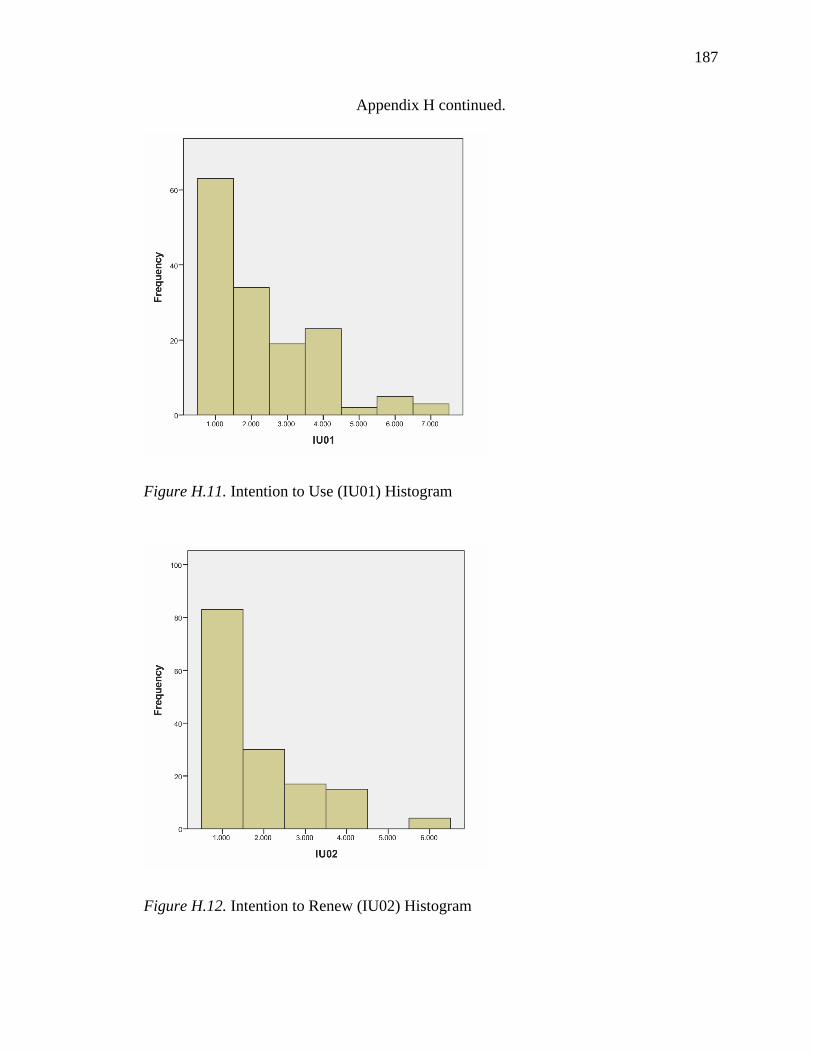
187
Appendix H continued.
Figure H.11. Intention to Use (IU01) Histogram
Figure H.12. Intention to Renew (IU02) Histogram

188
Appendix H continued.
Figure H.13. Intention to Recommend (IR01) Histogram

13
VITA

189
VITA
Glen J. Coulthard
EDUCATION
Ph.D. December, 2016
Learning Design & Technology, Department of Curriculum and Instruction
Purdue University, West Lafayette, Indiana
Dissertation: A Descriptive Case Study: Investigating the Implementation of Web-based,
Automated Grading and Tutorial Software in a Freshman Computer Literacy Course
Major Professor: Dr. Timothy J. Newby
M.A. May, 2001
Educational Technology Leadership, School of Education and Human Development
George Washington University, Washington, DC
B.Com. May, 1988
Marketing, Faculty of Commerce and Business Administration
University of British Columbia, Vancouver, British Columbia, Canada
ACADEMIC APPOINTMENTS
College Professor 2002 – present
Okanagan College, School of Business, Vernon, British Columbia, Canada
Lecture/Lab Instructor: BuAd 128 – Computer Applications, BuAd 200 – Digital
Marketing, BuAd 210 – Marketing Research, BuAd 247 – Training and Development,
BuAd 283 – Management Information Systems, BuAd 333 – Internet Marketing, and
BuAd 335 – Electronic Commerce.
Graduate Assistant 2005 – 2007
Educational Technology Program, Department of Curriculum and Instruction
Purdue University, West Lafayette, Indiana
Lab Instructor: EDCI 270 – Introduction to Educational Technology and Computing
Program Administrator 1994 – 1998
Technology Program, Faculty of Adult and Continuing Education
Okanagan University College, Vernon, British Columbia, Canada

190
SELECTED ARTICLES AND PRESENTATIONS
Ertmer, P. A., Richardson, J. C., Belland, B., Camin, D., Connolly, P., Coulthard, G. J., et
al. (2007). Using peer feedback to enhance the quality of student online postings:
An exploratory study. Journal of Computer-Mediated Communication, 12(2),
article 4. Retrieved from http://jcmc.indiana.edu/vol12/issue2/ertmer.html
Simons, K., Oakes, W., Coulthard, G., Stickman, E., & Goktas, Y. (2006). A framework
for supporting cross-disciplinary education-engineering collaboration. Presented
at the 2006 National Service Learning Conference, Washington, DC.
Ertmer, P., Richardson, J., Belland, B., Camin, D., Coulthard, G., & Mong, C. (2006).
Efficacy of peer feedback in online learning environments. Presented at the 2006
Annual Meeting of the American Educational Research Association, San
Francisco, CA.
Ertmer, P., Belland, B., Camin, D., Coulthard, G., & Mong, C. (2006). Perceptions of the
challenges/benefits of a methods course. Presented at the 2006 Annual Meeting of
the American Educational Research Association, San Francisco, CA.
Newby, T. & Coulthard, G. (2006). Creating Presentations with Articulate - Beyond
PowerPoint. Presented at a Teaching & Technology Brown Bag Seminar for the
Center of Instructional Excellence at Purdue University, West Lafayette, IN.
Coulthard, G. (2005). Evaluating the SimNet software tutorial and assessment solution in
a computing literacy course. Presented at the League for Innovation in the
Community College: 2005 Conference on Information Technology, Dallas , TX.
Coulthard, G. (2005). A review of software tools for managing your personal
knowledgebase. Presented for the Purdue Association of Educational Technology
(PAET) at Purdue University, West Lafayette, IN.
Coulthard, G. (2002). Integrating Microsoft Office into the curriculum. Presented at San
Diego State University's Professional Development Conference, San Diego, CA.
Coulthard, G. (2002). Teaching and learning Microsoft Office. Presented at the Texas
Community College Teachers Association's 2002 Annual Conference, Houston,
TX.
Coulthard, G. (2002). Innovative teaching practices for Microsoft Office. Presented at the
West Valley College's Professional Development Day, Saratoga, CA.
Coulthard, G. (1998). Integrating technology into your curriculum. Presented at the
League for Innovation in the Community College: 1998 Annual Conference, San
Francisco, CA.
191
PROFESSIONAL AND CORPORATE EXPERIENCE
President/Director 1995 – present
Current Communications Inc., Coldstream, British Columbia, Canada
Executive Director 1991 – 1994
Computer Consultants International, Maple Ridge, British Columbia Canada
Management Consultant 1998 – 1991
Laventhol and Horwath, Vancouver, British Columbia, Canada
BOOK PUBLICATIONS
Coulthard, G. J. & Orwick, M. (2013). Project Learn for Microsoft Office 2013. Burr
Ridge, IL: McGraw-Hill Higher Education.
Coulthard, G. J. (2012). Computing Now! New York, NY: McGraw-Hill Higher
Education.
Coulthard, G. J. & Triad Interactive, Inc. (2009). SimNet for Office: A workbook tutorial
guide. New York, NY: McGraw-Hill Higher Education.
Coulthard, G. & Clifford, S. (2004). Advantage series for computer education: Microsoft
Office 2003. New York, NY: McGraw-Hill Technology Education.
Hutchinson, S. & Coulthard, G. (2002). Advantage series for computer education:
Microsoft Office XP. Burr Ridge, IL: McGraw-Hill Higher Education.
Hutchinson, S. & Coulthard, G. (2000). Advantage series for computer education:
Microsoft Office 2000. Burr Ridge, IL: McGraw-Hill Higher Education.
Hutchinson, S. & Coulthard, G. (1997-1998). Advantage series for computer education:
Microsoft Office 97. Burr Ridge, IL: McGraw-Hill Higher Education.
ACADEMIC SERVICE
Grant-in-Aid (GIA) Committee, Okanagan College (2012-present)
Extended Study Leave (ESL) Committee, Okanagan College (2012-2015)
Research Ethics Board (REB), Okanagan College (2008-2012)
Fellow, Institute for Learning & Teaching (ILT), Okanagan College (2010-2013)
Queen’s University Inter-Collegiate Business Competition (ICBC) Team Coach
(MIS national finalist in 2011, 2013, 2015, 2016)
Vice President, Purdue Association of Educational Technology (2006-2007)