a dft analysis for the electronic structure, mulliken
TRANSCRIPT

769 International Journal of Progressive Sciences and Technologies (IJPSAT) ISSN: 2509-0119. © 2019 International Journals of Sciences and High Technologies http://ijpsat.ijsht-journals.org Vol. 16 No. 1 August 2019, pp. 51-65
Corresponding Author: Anant Babu Marahatta 51
A DFT Analysis for the Electronic Structure, Mulliken Charges
Distribution and Frontier Molecular Orbitals of Monolayer
Graphene Sheet
Anant Babu Marahatta1, 2 1Department of Chemistry, Amrit Science Campus, Tribhuvan University, Kathmandu, Nepal 2Department of Research, University Block, Southwestern State College, Kathmandu, Nepal
Abstract - As a density functional theory (DFT) offers a wide variety of calculations for computing structures and properties of multi-electron atomic or molecular systems, the two-dimensional (2D) periodic boundary condition (PBC) calculations of it is especially recommended for investigating ground state electronic structure of the graphene like materials. In this study, the 2D PBC calculations of DFT are performed on the 2D monolayer graphene sheet and produced its ground state electronic structure. The hexagonal, honeycomb-like pattern of the carbon rings are confirmed in its optimized geometry. The inhomogeneous partial atomic charges in its terminal and nonterminal carbon atoms are observed by the Mulliken population analysis method, which is in accordance with the experimental findings. The HOMO−LUMO energy gap calculated from their DFT computed eigenvalues is ∆E = 0.0018 eV, indicating a facile redistribution of electrons in them. Such unique characteristic of the monolayer graphene sheet has not only unlocked the superconducting tendency of the graphene-based materials but also speculated a high possibility of involving such frontier molecular orbitals (FMOs) in the chemical reactions that usually take place as a result of giving and/or taking electrons. The electron density surface of FMOs computed by the DFT model are mostly found to localize at terminal regions of the graphene sheet, particularly indicating such regions as chemically more active. It is believed that the theoretical findings presented here will be very useful while tuning graphene properties either by doping with metals/metalloids or by adding functional molecular parts in the graphene rings.
Keywords - DFT, Monolayer graphene sheet, Frontier molecular orbitals, Mulliken charges, and Electron density surface maps.
I. INTRODUCTION
The ground state electronic structure that is referred to the structure having a minimum electronic energy can be probed directly by both experimental and theoretical methods. In experimental research, the X−ray photoelectron spectroscopy (XPS), and X-ray emission spectroscopy (XES) are most commonly used methodologies [1] but in theoretical research, a series of computing process or repeated mathematical calculations have to be performed on the molecular specimen [2]. Such computational procedure calculates the wave function and energy at a starting molecular geometry and then proceeds to search a new geometry until the most stable electronic structure is
produced. This repeated mathematical process that tests various possibilities to see which atomic arrangements and the electrons around the atom will give the lowest energy value is called geometry optimization [2]. Such computational methodology generates atomic coordinates of the most stable electronic structure of the molecule, dimension of the optimized parameters such as atomic distances and angles, information about the frontier molecular orbitals (hereafter, FMOs), Mulliken atomic charges distribution, and electric dipole moments [3]. The Gaussian calculation package [4] offers the wide verities of computational models for implementing such useful methodology in theoretical research. A density functional

DFT Analysis for the Electronic Structure, Mulliken Charges Distribution and Frontier Molecular Orbitals of Monolayer Graphene Sheet
Vol. 16 No. 1 August 2019 ISSN: 2509-0119 52
theory (hereafter, DFT) model is one of them. It is a renowned quantum mechanical model for investigating ground state electronic structures of the multi-electron atomic or molecular systems [5], [6] in spite of its many notable limitations while applying to large molecular/atomic assemblies [7]. Even though it involves a formalism for approximately solving Schrodinger's wave equation that associates a molecular Hamiltonian in terms of a Hamiltonian operator, it produces better results than ab
initio electronic structure methods at the similar computational cost [8], [9]. It offers very promising calculations such as one-dimensional, two-dimensional (hereafter, 2D), and three-dimensional periodic boundary condition (hereafter, PBC) for analytic energy and optimizations, and numerical frequencies [3]. Among them, the 2D PBC calculations of DFT are very suitable to produce the energetically most stable electronic structure of monolayer graphene sheet and graphene-based materials due to their 2D lattice and unit cell structure.
The monolayer graphene sheet is a single-atom thick layer of sp2 hybridized carbon atoms that are arranged in flat, hexagonal lattice structure [10], [11], [12], [13] in 2D plane with the thickness of 0.335 nm [14], [15], [16]. Each carbon atom of it has an unhybridized atomic orbital with a nonbonding electron, meaning many free electrons are present in the giant carbon network of the graphene sheet. They remain highly mobile and form an electron cloud over the graphene layer. While bonding carbon atoms together, the resulting molecular orbitals (hereafter, MOs) which mostly provide space for the electrons split into two FMOs known as “highest occupied molecular orbital” (hereafter, HOMO) and “lowest unoccupied molecular orbital” (hereafter, LUMO) [17], [18]. The former type molecular orbitals are known for their low energy and high electron occupancy whereas the latter type molecular orbitals are known for their high energy and zero occupancy (vacant) in the ground state. The proper estimation of the energy gap (band gap) between them would be a key to unlock many useful characteristics of graphene such as superconductivity of the graphene-based materials, lowest possible transition frequency in UV visible spectroscopy, high stability of the graphene like large conjugated π orbital systems, high flow rate of the electrons (electrical current), chemical reactions mechanisms that take place on the graphene surface etc. On the one hand, graphene possesses very impressive characteristics that not only enable it to show many extraordinary properties in terms of strength (200×stronger than steel), electrons mobility (100×faster than silicon), electricity (13×better than copper) and heat conduction
(2×better than diamond) but also make it an emerging 2D nanomaterial for many applications such as water purification, electronics and biomedical applications, and building other sp2 carbon nanomaterials (nanographite sheets and carbon nanotubes) [19], [20], [21] etc., but on the other hand, in-depth investigation about what makes it such an amazing material carrying tremendous potentialities is still being under consideration. Even though, several past intensive researches on doped graphene [10], [11], [12] have created many opportunities to encounter with previously under-researched or over-looked super-materials, the frequently released research reports and the concerned technological development has still made graphene a hot topic in chemistry and materials science. More specifically, comparatively better theoretical/computational methodologies that can be used to analyze the FMOs and their charge density contours, availability for bond formation, specific localizations, eigenvalues (E) and band gap (∆E), and electronic occupancy in the ground state as well as to determine the ground state electronic structure and Mulliken charges distribution in the monolayer graphene sheet are being widely sought. At present, the DFT analysis for the electronic structure, FMOs, Mulliken charges distribution, and electronic configuration in the MOs of the monolayer graphene sheet is reported. It is believed that this theoretical contribution has unveiled an extensive knowledge for explaining at least few unique characteristic features of such 'wonder carbon material'. The structure of this paper is as follows. The computational methods are outlined in section 2. The results and discussion are presented in section 3. A summary and conclusions are given in section 4.
II. COMPUTATIONAL METHODS
A trial structure of the monolayer graphene sheet with 18 carbon atoms and 14 dummy atoms in two lattice dimension was built by using GaussView visualization application software [22] as shown in chart 1. This initial unit cell structure has each C−C bond length 1.4113Å, each C−C−C bond angle 119.973°, and two sets of C−C−C−C dihedral angles: C3−C15−C7−C16 type = 0° and C15−C7−C16−C8
type = 180°. The edge or terminal carbon atoms were left as an incomplete bonding in order to realize the original graphene sheet computationally. The initial atomic Cartesian coordinates were extracted and used them manually to prepare Gaussian input file for the geometry optimization. All the Gaussian keywords and methodologies were selected as instructed in Gaussian 09 manual [3]. The hybrid functional based DFT method known as B3LYP was used with the basis set of this type: 3−21G i.e. the

DFT Analysis for the Electronic Structure, Mulliken Charges Distribution and Frontier Molecular Orbitals of Monolayer Graphene Sheet
Vol. 16 No. 1 August 2019 ISSN: 2509-0119 53
methodology used was DFT: B3LYP/3−21G; the periodic systems were specified with a normal trial molecule specification for the unit cell; and the additional two translational vectors (hereafter, TVs) were appended to the molecule specification with no intervening blank line. By utilizing such TVs, the DFT method was forced to replicate the unit cell in the specific direction(s) and to create a supercell. In this way, the 2D PBC calculations in B3LYP/3−21G was set for approximating an infinite 2D solid state graphene system. Moreover, to solve the electronic Schrodinger equation iteratively, the self-consistent field (SCF) with both default SCF procedure (SCF=Tight) and Berny algorithm for optimizations to a local minimum were selected in Gaussian 09 [4]. The Gaussian output files such as log, checkpoint (.chk), and formatted checkpoint (.fchk) files were read by using the Gaussian graphical interface i.e. GaussView [22] and various chemical data displayed in three dimensions were extracted. And then the optimized structures, optimized parameters such as bond lengths, bond angles, and torsional angles, Mulliken population analysis, electrons distribution in the molecular orbitals, surface contour maps for the frontier molecular orbitals etc. of the monolayer graphene sheet were analyzed thoroughly.
III. RESULTS AND DISCUSSION
3.1 Ground state electronic structure
A DFT optimized geometry of the monolayer graphene sheet is shown in Figure 1 where the grey spheroids represent C atoms and the x-axis and y-axis represents the first two dimensions and the z-axis, a third dimension. For analyzing the optimized geometry and partial atomic charge distribution more clearly, all the atoms present in the graphene structure are leveled as C1, C2, C3, etc. By looking at the optimized structure carefully, one can confirm that the graphene sheet that is composed entirely of single layer of carbon atoms has hexagonal, honeycomb-like pattern of carbon rings. The structure viewed through z-axis (Figure 1(a)) demonstrates that graphene sheet consists of only two dimensions: length and width represented in x-y coordinate axis. As the optimized geometry is specified mostly in terms of the three parameters namely bond length: an average distance between the nuclei of two atoms bonded together in any given molecule; bond angle: angle formed between three atoms across the two bonds; and torsional angle: angle between the plane formed by the first three atoms and the plane formed by the last three atoms, the explicitly measured theoretically calculated values of them are listed in Table 1.
All the C−C bond lengths and the C−C−C bond angles in the optimized monolayer graphene sheet are found to be in the range of 1.44 Å (Trial structure: C−C bond length = 1.41 Å) and 120° (Trial structure: C−C−C bond angle = 119.973°) respectively, and the dihedral angles are either 0°
or 180° (depending on the plane formed by the atoms) as in the trial structure. Such DFT computed values are found to be consistent with the experimentally determined values: C−C bond length = 1.42Å, and C−C−C bond angle = 120° [23] and dynamically simulated (molecular dynamics simulation) values: C−C bond length = 1.418 Å, and C−C−C bond angle = 120° [24]. As in experiment, the DFT computed C−C bond length (=1.44 Å) of the graphene is intermediate while comparing it with the lengths of a C=C double bond (= 1.35 Å) in ethane (H2C=CH2) and a C−C single bond (= 1.47 Å) in ethane (H3C−CH3). It indicates that each C−C bond in graphene rings has partial double bond character, means the electrons inside the graphene rings are not associated with any single atom or single covalent bond but are likely to be found equally anywhere along the chemical bonds as in other conjugatedx π electron systems such as benzene etc. Such resonating behavior of electrons is most commonly called electrons delocalization. In order to accurately reflect the nature of bonding and the electrons resonance, the carbon rings of the graphene are depicted with a conjugated double bonds, as shown in Figure 1(a). The genius of the electrons delocalization model can be further explained by both hybridization and valence bond theory (hereafter, VBT) concepts [25]. As each interior and exterior C−C−C bond angle of the optimized graphene carbon rings is measured as 120° which is exactly equal to C−C−C bond angle in its graphite structure and in its aromatic conjugated π electron system
(benzene ring) but slightly larger than the prospective value of 109.5° in its diamond structure, these three carbon atoms must be bonded each other by forming trigonal units with no angular strain at all (i.e. bond angle = 120°), which then unite together and produce a regular hexagonal shape of the graphene rings. According to the VBT, such regular hexagonal shape of the carbon rings will only be formed whenever each carbon atom has 3sp2 hybrid orbitals bonded covalently to three other carbon atoms (pi (π) bond) on the 2D plane and the remaining one non-bonding half-filled atomic orbital (i.e. unhybridized orbital) on the third dimension. It means, each carbon atom has an electron leftover (i.e. non-bonding electron) on the third dimension. So, the giant carbon network of the graphene sheet contains many free electrons (π electrons) which may form electron cloud spreading above and below the graphene sheet. This is

DFT Analysis for the Electronic Structure, Mulliken Charges Distribution and Frontier Molecular Orbitals of Monolayer Graphene Sheet
Vol. 16 No. 1 August 2019 ISSN: 2509-0119 54
one of the reasons why the monolayer graphene sheet has shown remarkable electrical and heat conductivity.
3.2 Mulliken population analysis
A Mulliken population analysis [26] is the cheapest but fastest way to compute Mulliken atomic charges theoretically even though it tends to produce qualitative results at best. Such atomic charges can be used to characterize the electronic charge distribution in a molecule. More specifically, they are very useful to estimate the partial atomic charges qualitatively. The DFT computed charge distribution in the carbon atoms of the monolayer graphene sheet can be observed directly by the color of the spheroids in Figure 2 (color index and range are given), where the most red colored (C2), and the most green colored (C6) spheroids represent the most negatively and the most positively charged carbon atoms respectively; the second most red colored (C14) and the second most green colored (C4, C8, and C10) spheroids represent the second most negatively and the second most positively charged carbon atoms respectively; the most black colored (C12, C13, C15, C9, and C5) and the most purple colored (C7 and C3) spheroids represent completely neutral and the least negatively charged carbon atoms (neglecting -0.000 range) respectively. The Mulliken atomic charges in numerals are listed in Table 2, where the color of the spheroids are shown in accordance with the partial atomic charge distributions shown in Figure 2 and the assigned atom numbers are in accordance with Figure 1(a). By carefully analyzing such charge distributions, one can find that partial atomic charges of the terminal carbon atoms (represented by red and green colored spheroids in Figure 2) differ in wide range from those of the non-terminal and central atoms (represented by black and dark purple spheroids in Figure 2). As the graphene sheet is a 2D network of carbon atoms bound to one another by covalent bond, the terminal atoms obviously miss some C−C bonds unlike by the non-terminal and central atoms, resulting the difference in their charges. The same charge inhomogeneity in the graphene terminals and edges has been observed experimentally by the scanning gate microscopy [27]. Moreover, the central carbon atoms of the graphene sheet which forms three covalent bonds with the neighboring carbon atoms are found to possess least or almost no charge (Table 2). This can be explained simply by calculating formal charge of an atom: Formal atomic charge
= number of valence electrons − [(�
�×number of bonding
electrons) + number of non-bonding electrons]. To make it easier, the formal atomic charge of each carbon atom present in the central graphene ring encircled in Figure 2 is
calculated as: Formal atomic charge of carbon = 4 − [(�
�×
6) + 1] = 0. This should not be the case for the terminal carbon atoms because they have less number of bonding electrons due to missing some C−C bonds, and whenever they are made saturated with hydrogen atoms, more stabilization occur as reported earlier by Y. Miyamoto et
al. [28] and then only they may behave like central carbon atoms in terms of their formal atomic charges. However, the tunneling electron microscopy revealed that the graphene sheet with unsaturated terminal carbon atoms forms triple bonds itself (as in central carbon) along the edges and terminals under vacuum and attains self-stability [29]. If so, the terminal carbon atoms of the monolayer graphene sheet under vacuum should also possess formal atomic charge zero. This sort of contradictions are still under consideration. Even though, the absolute magnitude of the atomic charges computed by Mulliken populations analysis displays a high degree of sensitivity to the types of basis set used, the qualitative values of them that are produced by DFT:B3LYP/3−21G method are presented. In future studies, the natural bond orbital (NBO) analysis [30] can be performed for more accurate distribution of the charges.
3.3 Frontier molecular orbitals
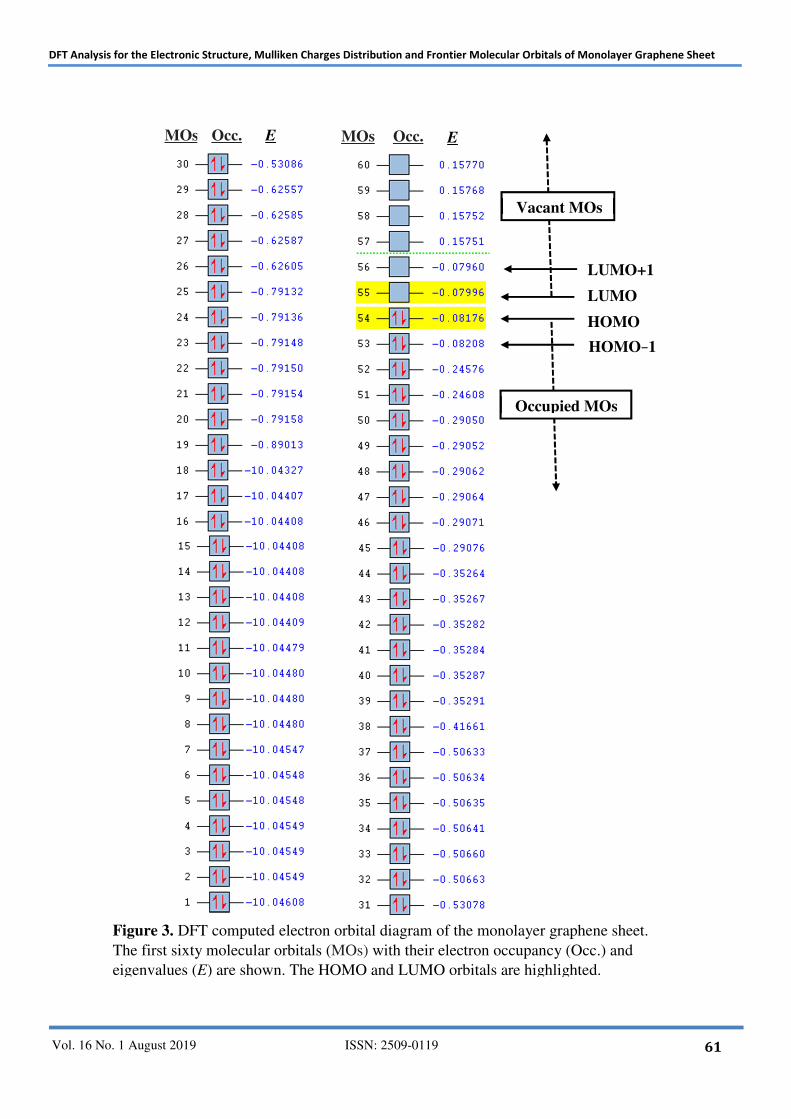
According to the molecular orbital theory, the molecular orbitals (hereafter, MOs) are formed by the linear combination of atomic orbitals (LCAO) or more specific, by the wave interaction of the atomic orbitals of two bonding atoms. In a monolayer graphene sheet, the MOs are formed while bonding carbon atoms together in its giant network. According to the DFT calculation, the total number of MOs formed while bonding 18 carbon atoms present in a unit cell structure (trial structure) of the graphene sheet are ninety. Out of them, the first sixty MOs with their occupancy (Occ.) and the eigenvalues in eV (E) are shown in Figure 3, where HOMO, HOMO−1, LUMO, and LUMO+1 are also marked. Among ninety MOs, the first fifty four MOs are completely filled with electrons called occupied MOs and the remaining thirty six MOs are vacant called unoccupied MOs. The energy level alignment of these orbitals shown in Figure 3 indicates that the 54th MO is the highest energy orbital among the occupied MOs and the 55th MO is the lowest energy orbital among the unoccupied one. As the HOMO type molecular orbitals are low in energy than the LUMO type molecular orbitals, it is obvious for the electrons to be held in the former type orbitals by leaving the latter type orbitals vacant or unoccupied in the ground state. It can be seen in Figure 3 that all the occupied MOs have a pair of

DFT Analysis for the Electronic Structure, Mulliken Charges Distribution and Frontier Molecular Orbitals of Monolayer Graphene Sheet
Vol. 16 No. 1 August 2019 ISSN: 2509-0119 55
electrons that usually have either alpha (ms = +1/2) or beta (ms = −1/2) spins, giving a net spin of 0 as all the alpha electrons cancel all of the beta electrons. Similarly, no any MOs are found to contain unpaired electron, indicating a total spin of 0 with a multiplicity of one or the singlet monolayer graphene sheet. Such DFT predicted electronic distribution in the MOs suggests that HOMO is the orbital of highest energy that is still occupied (in this case, 54th MO) and the LUMO is the lowest lying orbital that remains empty (in this case, 55th MO). Therefore, removing electrons from the HOMO and adding more electrons into the LUMO orbitals would be the easiest process energetically. It can further be explained by calculating energy gap between them. As the DFT computed eigenvalues for the HOMO and LUMO orbitals are of − 0.08176 eV and − 0.07996 eV respectively (Figure 3), the energy gap between them is calculated as: ∆E = [− 0.07996− (− 0.08176)] = 0.00180 eV. This extremely low or almost zero energy gap between these two FMOs suggest that the HOMO electrons in the ground state can shift easily to the LUMO. Such facile tendency of undergoing electronic redistribution in the FMOs of the graphene sheet indicates that they can take part in the chemical reaction mechanisms (if they are of the correct symmetry) that usually proceed by giving and/or taking electrons. Such type of reaction mechanisms involve creation or destruction of the covalent bonds through reduction, oxidation, and physisorption/chemisorption [31]. Doping many types of physisorbed molecules or atoms in the graphene rings is one of such reactions in which the FMOs can show active participation by donating electrons to the adsorbate molecules [32], [33]. Whenever the HOMO and LUMO orbitals don't present correct symmetry during chemical reactions, the HOMO−1 and LUMO+1 orbitals may show active involvement as their DFT computed eigenvalues ( = − 0.08208 eV and − 0.07960 eV respectively) are found to be as close as those of the HOMO and LUMO respectively. Additionally, if we analyze the HOMO and LUMO surfaces shown in Figure 4 carefully, the most probable chemically active regions in the graphene sheet can be identified. Since, these orbitals are found to be localized mostly in the terminal regions of the graphene sheet and the HOMO electrons are the most available electrons to participate in a reaction, the terminal regions would be chemically more active. More specifically, the image of the HOMO surface depicts that the frontier electron density is highest at C8, C6, C13, and C9 atoms (terminal carbon atoms) of the unit cell structure, meaning similar dense electron density will be at the corresponding replicate atoms of them in a super cell structure (infinitely long graphene sheet) that is created
while the 2D PBC calculations are on the fly. It causes these atoms (and their replicate atoms) to become the most probable chemically active sites. Such inhomogeneous chemical reactivity of the terminal and nonterminal regions of the graphene sheet is in accordance with the research findings that were achieved while reacting graphene flakes with water and binding lithium ions on their terminal regions [32]. Hence, above results predicted by DFT would be very much applicable to understand many potential and functional characteristics shown by the single layer graphene sheet such as hosting adsorbate molecules/atoms as a substrate, easy accepting many chemical groups while tailoring functionalized graphene, easy constructing varieties of the 2D graphene sheets‐based photocatalysts [34] etc.
Moreover, the HOMO−LUMO energy gap ∆E for the graphene sheet also approximates band gap between the valence band and the conductance band of this material as well as its lowest energy transition frequency in UV visible spectroscopy. In principle, if the distribution of the energy throughout the molecule occurs, the HOMO−LUMO gap will be smaller that corresponds to better stability. It particularly happens in a large conjugated π orbital systems such as single layer or a multilayered graphene sheet due to
the greater mobility of the π electrons [35]. Such electronic mobility further means that large aromatic systems like graphene sheets and graphene-based materials have good heat and electric conductivity and hence, can be used them as a building block to fabricate many types of graphene-based semiconductors. In short, the HOMO−LUMO gap determines the flow rate of electrons which in turn is an electrical current: whenever the gap approaches to zero, the electrons in the HOMO move easily into the LUMO (i.e. requires very little energy) meaning free movement of the electrons. Therefore, the DFT computed HOMO−LUMO energy gap ∆E for the monolayer graphene sheet have added an extra strength to the graphene materials for being one of the most promising superconducting materials or more specifically being the exceptional electric conductors with no resistance. The same is the experimental finding that says "the graphene sheet would become zero-gap semiconductors as its conduction and the valence bands meet at the Dirac points exactly" [19]. Such unique property of the monolayer graphene sheet has captivated many researchers to explore the complex physics of superconductivity in easy-to-make bilayer and trilayer graphene sheets. The results that are achieved here even by employing computationally cheap yet decent theoretical model have guaranteed the remarkable tendency of showing electric and heat conductivity of the

DFT Analysis for the Electronic Structure, Mulliken Charges Distribution and Frontier Molecular Orbitals of Monolayer Graphene Sheet
Vol. 16 No. 1 August 2019 ISSN: 2509-0119 56
monolayer graphene sheet, which eventually makes it to stand as a gifted carbon allotrope.
As it is discussed in subsection 3.2, the spheroids C2 and C14 are the most and second most negatively charged carbon atoms predicted by the Mulliken population analysis. Interestingly, the LUMO and LUMO+1 molecular orbitals are found to localize in these atoms (along with other atoms) as well unlike HOMO and HOMO−1 molecular orbitals. It can be clearly observed in Figure 4(b) and Figure 5(b) respectively. Such specific localization of the molecular orbitals might be due to increasing in-phase type of electron waves interaction caused by the excessive accumulation of the negative charge on the C2 and C14 atoms. The molecular orbital resulting from such in-phase type of electron wave interaction would be bonding LUMO or LUMO+1. This bound state of LUMO and LUMO+1 orbitals is due to increase in attractions between electrons and nuclei that is again caused by the excessive negative charge deposited on the C2 and C14 atoms. The same can be justified by the DFT predicted negative eigenvalues for LUMO (− 0.07996 eV) and LUMO+1 (− 0.07960 eV) orbitals (only the bonding orbitals have negative eigenvalues). Moreover, in order to examine the maximum concentration of the orbital charge density on the C−C bond axis of the graphene rings, the transparent surfaces of the molecular orbitals analyzed above (i.e. HOMO and LUMO) are computed. For this, the charge density contours mode that allows one to display volumetric results in a plane is selected. Among them, the contours in a plane for the HOMO type MOs are shown in Figure 6, where one can find that the simple LCAO description has accounted the principal features of this molecular orbital. More concrete information that can be drawn from the contours map is: the orbital charge density is found to be concentrated fully along each C−C bond axis that draws the carbon nuclei together, which ultimately binds all the bonding carbon atoms. Thus, being able to generate transparent surfaces of the orbitals, the charge density contour maps became very useful to reconfirm the hexagonal bonding pattern of the carbon atoms in the graphene rings.
IV. CONCLUSION
In this research work, the theoretical results computed by the density functional theory (DFT) model are presented while applying to the system of two dimensional (2D) monolayer graphene sheet. Even though it is computationally cheap quantum mechanical model (compare to ab initio models), it has unveiled an extensive knowledge for interpreting at least few unique
characteristics of monolayer graphene sheet. At first, the energetically most stable electronic structure of the graphene sheet is produced by DFT: B3LYP/3−21G methodology under 2D periodic boundary condition (PBC) and then confirmed its hexagonal, honeycomb-like pattern of the carbon rings. The measured values of the bond length, bond angle, and torsional angle of such optimized geometry are found in excellent agreement with the experimental and molecular dynamics simulated values. Interestingly, the intermediate length of C−C bond (=1.44 Å) measured in the DFT optimized structure of the graphene sheet has elucidated the conjugate double character of each C−C bond in the graphene rings. In order to characterize the electronic charge distribution qualitatively, the cheapest but fastest Mulliken population analysis method has been applied and found that the partial atomic charges of the terminal carbon atoms differ in wide range from those of the non-terminal and central carbon atoms of the same graphene sheet as observed experimentally. Similarly, the DFT computed electronic configuration in different molecular orbitals clarified that HOMO is the orbital of highest energy (�1= −0.08176 eV) that is still occupied and LUMO is the lowest lying orbital (�2 = −0.07996 eV) that remains empty. The energy gap between these frontier molecular orbitals (FMOs) is determined as, ∆E = [�2 − �1] = 0.0018 eV, indicating the facile redistribution of electrons in them. Such free movement of the electrons in FMOs of the graphene sheet and graphene-based materials has not only made them promising superconducting materials but also proved their tendency for involving in the chemical reaction mechanisms that proceed by giving and/or taking electrons. Furthermore, the electron density surface maps of the HOMO and LUMO orbital depicted their maximum localized sites at the terminal regions of the graphene sheet, indicating such regions chemically more active. The charge density contours in a plane for the HOMO type molecular orbitals has shown that the orbital charge density is fully concentrated along each C−C bond axis of the graphene sheet that further draws the bonding carbon nuclei together and binds them tightly. In this way, the hexagonal bonding pattern of the carbon atoms in the graphene structure is reconfirmed.
The results achieved in this study even by using computationally cheap yet decent theoretical model will be very useful while tuning graphene properties by doping metals/metalloids in its carbon rings or by involving its surface for hosting many chemical reactions or by adding functional molecular parts in the terminal regions of the graphene sheet. It is believed that present theoretical contribution has not only unveiled an extensive knowledge

DFT Analysis for the Electronic Structure, Mulliken Charges Distribution and Frontier Molecular Orbitals of Monolayer Graphene Sheet
Vol. 16 No. 1 August 2019 ISSN: 2509-0119 57
for explaining at least few unique characteristics of such 'wonder monolayer carbon sheet' but also disclosed the extraordinary skills of DFT model for computing ground state electronic structures and frontier molecular orbitals of different types of graphene-based materials. In particular, the 2D DFT method under the PBC puts considerable demands on the accuracy of the computational/theoretical methods for investigating electronic structures of the 2D graphene like materials.
REFERENCES
[1] Yu. Khyzhun, T.Strunskus, S.Cramm and Yu. M. Solonin, J. Alloys Compd. 389, 14 (2005).
[2] R. Daudel, Electronic Structure of Molecules (Elsevier, 1966).
[3] Gaussian 09 manual. http://gaussian.com/geom/?tabid=1#GeomkeywordReadOptimizeop tion
[4] M. J. Frisch, G. W. Trucks, H. B. Schlegel, G. E. Scuseria, M. A. Robb, J. R. Cheeseman, G. Scalmani, V. Barone, G. A. Petersson, H. Nakatsuji et al. Gaussian 09, Revision C.01 (Gaussian, Inc. 2004).
[5] R. D. Madan, Modern Inorganic Chemistry (S. Chand & Company, 1997).
[6] D. A. McQuarrie and J. D. Simon, Physical Chemistry: Molecular Approach (Viva Books, 1998).
A. J. Cohen, P. M. Sánchez and W. Yang, Science 321, 792 (2008).
[7] P. Hohenberg and W. Kohn, Phys. Rev. B. 136, 864 (1964).
[8] W. Kohn and L. Sham, Phys. Rev. J. 140, A1133 (1965).
[9] Shtepliuk, N. M. Caffrey, T. Iakimov, V. Khranovskyy, I. A. Abrikosov and R. Yakimova, Scien. Rep.7, 3934 (2017).
[10] H. Tachikawa, T. Iyama and H. Kawabata, Thin Solid Films 554,199 (2014).
[11] E.C. Anota, A. R. Juarez, M. Castro and H. H. Cocoletzi, J. mol. Model. 19, 321 (2013).
[12] Graphene: The Carbon-Based ‘Wonder Material’. https://www.compoundchem.com/ 2015 /06/23/ graphene/
[13] B. T. Kelly, Physics of Graphite (Applied Science: London, 1981).
[14] M. S. Dresselhaus, G. Dresselhaus and P. C. Eklund, Science of Fullerenes and Carbon Nanotubes (Academic Press: San Diego, 1996).
[15] Z. H. Ni, H. M. Wang, J. Kasim, H. M. Fan, T. Yu, Y. H. Wu, Y. P. Feng and Z. X. Shen, Nano Lett. 7, 2758 (2007).
[16] Hunt, Ch 10: Introduction to MO Theory (Department of Chemistry, University of Calgary).
[17] W. Locke, Introduction to Molecular Orbital Theory (ICSTM Chemistry Department, 1996).
[18] E. D. Bautista and D. J. Fernandez, Graphene coherent states, (Physics Department, Cinvestav, 2018).
[19] L. Cox, The amazing potential of Graphene…The world’s wonder material. https://disrup tionhub.com/graphene-amazing-potential-worlds-wonder-material/
[20] J. de La Fuente, Graphenea, https://www.graphenea.com/pages/graphene-properties#.X S8C-_IzbIU
[21] Æ. Frisch, H. P. Hratchian, R. D. Dennington II, T. A. Keith and J. Millam, Gauss view 5 Reference, (Gaussian, Inc. 2009).
[22] D. R. Cooper, B. D'. Anjou, N. Ghattamaneni, B. Harack, M. Hilke, A. Horth, N. Majlis, M. Massicotte, L. Vandsburger, E. Whiteway and V. Yu, Experimental review of graphene, (McGill University, 2011).
[23] B. Al-Muhit and F. Sanchez, Carbon 146, 680 (2019). [24] S. Böhm and O. Exner, Org. Biomol. Chem. 5 (13),
2081 (2007). [25] R.S. Mulliken, J. Chem. Phys. 23, 1833 (1955). [26] R. Jalilian, L. A. Jauregui, G. Lopez, J. Tian, C.
Roecker, M. M. Yazdanpanah, R. W. Cohn, I. Jovanovic and Y. P. Chen, Nanotechnology 22, 295705 (2011).
[27] Y. Miyamoto, K. Nakada and M. Fujita, Phys. Rev. B 59, 9858 (1999).
[28] K. He, G. D. Lee, A. W. Robertson, E. Yoon and J. H. Warner, Nat. Comm. 5, 3040 (2014).
[29] F. Weinhold, C. R. Landis and E. D. Glendening, Int. Rev. Phy. Chem. 35(3), 399 (2016).
[30] K. Fukui, T. Yonezawa and H. Shingu, J. Chem. Phys. 20(4), 722 (1952).
[31] H. Tachikawa and H. Kawabata, J. Phys. B: At. Mol. Opt. Phys. 44, 205105 (2011).
[32] Y. Tang, W. Chen, J. Zhou, H. Chai, Y. Li, Y. Cui, Z. Feng and X. Dai, Fuel 253, 1531 (2019).
[33] Q. Xiang and J. Yu, J. Phys. Chem. Lett. 4, 753 (2013). [34] M. S. Dresselhaus, P. C. Eklund and G. Dresselhaus,
Carb. Mat. Adv. Tech. 36, 35 (1999).

DFT Analysis for the Electronic Structure, Mulliken Charges Distribution and Frontier Molecular Orbitals of Monolayer Graphene Sheet
Vol. 16 No. 1 August 2019 ISSN: 2509-0119 58
Chart 1
Dummy atoms
Trial structure of monolayer graphene sheet in two lattice dimension
Terminal Carbon atoms
1.411 Å
119.97°

DFT Analysis for the Electronic Structure, Mulliken Charges Distribution and Frontier Molecular Orbitals of Monolayer Graphene Sheet
Vol. 16 No. 1 August 2019 ISSN: 2509-0119 59
Figure 1. DFT optimized geometry of monolayer graphene sheet viewed through (a) z-axis (b) xy plane and (c) yx plane
1.443 Å
119.99°

DFT Analysis for the Electronic Structure, Mulliken Charges Distribution and Frontier Molecular Orbitals of Monolayer Graphene Sheet
Vol. 16 No. 1 August 2019 ISSN: 2509-0119 60
Negative Positive
Figure 2. Mulliken charge distribution in DFT optimized geometry of monolayer graphene sheet. All the atoms are numbered as in Figure 1(a).
The central graphene ring is encircled.
Color range: -0.004 to 0.004
DFT Analysis for the Electronic Structure, Mulliken Charges Distribution and Frontier Molecular Orbitals of Monolayer Graphene Sheet
Vol. 16 No. 1 August 2019 ISSN: 2509-0119 61
Figure 3. DFT computed electron orbital diagram of the monolayer graphene sheet. The first sixty molecular orbitals (MOs) with their electron occupancy (Occ.) and eigenvalues (E) are shown. The HOMO and LUMO orbitals are highlighted.
HOMO
HOMO−1
LUMO
LUMO+1
Occupied MOs
Vacant MOs
MOs Occ. E MOs Occ. E

DFT Analysis for the Electronic Structure, Mulliken Charges Distribution and Frontier Molecular Orbitals of Monolayer Graphene Sheet
Vol. 16 No. 1 August 2019 ISSN: 2509-0119 62
Figure 4. DFT calculated (a) highest occupied molecular orbital (HOMO) and, (b) lowest unoccupied molecular orbital (LUMO) surfaces at an isosurface value of 0.02.

DFT Analysis for the Electronic Structure, Mulliken Charges Distribution and Frontier Molecular Orbitals of Monolayer Graphene Sheet
Vol. 16 No. 1 August 2019 ISSN: 2509-0119 63
Figure 5. DFT calculated (a) HOMO−1 and, (b) LUMO+1 surfaces at an isosurface value of 0.02.

DFT Analysis for the Electronic Structure, Mulliken Charges Distribution and Frontier Molecular Orbitals of Monolayer Graphene Sheet
Vol. 16 No. 1 August 2019 ISSN: 2509-0119 64
Bond length (Å) Bond angle (°) Dihedral angle (°)
C1-C9 = 1.44359 C1-C5 = 1.44383 C1-C15 = 1.44324 C15-C7 = 1.44392 C15-C3 = 1.44374 C3-C6 = 1.44317 C7-C10 = 1.44303 C7-C16 = 1.44383 C16-C11 = 1.44387
C9-C1-C5 = 120.01 C15-C1-C5 = 119.99 C15-C1-C9 = 119.99
C10-C7-C15 = 120.01 C15-C3-C6 = 120.01 C6-C3-C17 = 120.01 C3-C17-C4 = 120.03
C3-C17-C11 = 119.99 C17-C11-C16 = 120.03
C5-C1-C15-C3 = 0.00 C5-C1-C15-C7 = 180.00 C6-C3-C15-C7 = 180.00
C6-C3-C17-C4 = 0.00 C4-C17-C11-C16 = 180.00
C4-C17-C11-C18 = 0.00 C17-C11-C18-C13 = 0.00 C12-C18-C11-C16 = 0.00
C8-C16-C7-C10 = 0.00
Figure 6. The charge density contours map for the HOMO type molecular orbital of the monolayer graphene sheet.
Table 1. DFT optimized parameters of the monolayer graphene sheet

DFT Analysis for the Electronic Structure, Mulliken Charges Distribution and Frontier Molecular Orbitals of Monolayer Graphene Sheet
Vol. 16 No. 1 August 2019 ISSN: 2509-0119 65
C11-C17 = 1.4404 C17-C4 = 1.44280 C11-C18 = 1.44280 C12-C18 = 1.44413 C18-C13 = 1.44387 C8-C28 = 1.44416
C5-C25 = 1.44309 etc.
C11-C16-C7 = 119.99 C16-C8-C29 = 120.04 C16-C11-C18 = 119.99 C12-C18-C13 = 119.96 C18-C13-C30 = 119.99 C18-C13-C29 = 120.04
C16-C7-C10 = 120.01 etc.
C38-C14-C35-C12 =180.00 C25-C5-C20-C2 = 180.00
etc.
Atom numbers/colors Charge Atom numbers/colors Charge 1 -0.000 10 0.002
2 -0.004 11 -0.000
3 -0.001 12 0.000
4 0.002 13 0.000
5 0.000 14 -0.003
6 0.003 15 0.000
7 -0.001 16 -0.000
8 0.002 17 -0.000
9 0.000 18 -0.000
Table 2. Mulliken charge distribution in the carbon atoms of the graphene a
a atom numbers and color of the spheroids are in accordance with the optimized geometry and Mulliken Charge distribution shown in Figure 1(a) and Figure 2 respectively.