a diagnostic framework - | independent evaluation...
TRANSCRIPT
IEG WORKING PAPER 2016/NO.1
A Diagnostic Framework:
How to Assess the Capacity of a Government’s Financial
Management Information System as a Budget Management Tool
IEG Working Paper <2016/No.1>
A Diagnostic Framework to Assess the Capacity of a Government’s Financial Management Information System as a Budget Management Tool
Ali Hashim Moritz Piatti

© 2016
Independent Evaluation Group, The World Bank Group
1818 H St., NW
Washington, DC 20433
IEG: Improving World Bank Group Development Results through Excellence in Evaluation
The Independent Evaluation Group (IEG) is an independent unit within the World Bank Group; it reports directly to the World Bank’s Board of Executive Directors. IEG assesses what works and what does not; how a borrower plans to run and maintain a project; and the lasting contribution of the World Bank to a country’s overall development. The goals of evaluation are to learn from experience, to provide an objective basis for assessing the results of the World Bank’s work, and to provide accountability in the achievement of its objectives. It also improves World Bank work by identifying and disseminating the lessons learned from experience and by framing recommendations drawn from evaluation findings. IEG Working Papers are an informal series to disseminate the findings of work in progress to encourage the exchange of ideas about development effectiveness through evaluation. The findings, interpretations, and conclusions expressed here are those of the author(s) and do not necessarily reflect the views of the Board of Executive Directors of the World Bank or the governments they represent or IEG management. The World Bank cannot guarantee the accuracy of the data included in this work. The boundaries, colors, denominations, and other information shown on any map in this work do not imply on the part of the World Bank any judgment of the legal status of any territory or the endorsement or acceptance of such boundaries. Attribution: Please cite the work as follows: Hashim, Ali, and Moritz Piatti. 2016. “A Diagnostic Framework to Assess a Government’s Financial Management System as a Budget Management Tool.” IEG Working Paper 2016/1. World Bank, Washington, DC. Corresponding author: Moritz Piatti: [email protected].
ISBN-10: 1-60244-262-2 ISBN-13: 978-1-60244-262-7 Contact: IEG Knowledge and Communications E-mail: [email protected] http://ieg.worldbank.org

Contents
Abbreviations ............................................................................................................................ v
Acknowledgments................................................................................................................... vii
Summary .................................................................................................................................. ix
1. Introduction and Motivation ............................................................................................... 11
2. Methodology ....................................................................................................................... 13
TSA Coverage ..................................................................................................................... 14
FMIS Coverage ................................................................................................................... 15
Core Functionality of the FMIS .......................................................................................... 16
Ancillary Features ............................................................................................................... 17
Technical Aspects ............................................................................................................... 17
Total System Score ............................................................................................................. 17
3. A Preliminary Assessment Based on the Methodology ...................................................... 18
TSA Coverage ..................................................................................................................... 18
FMIS Coverage ................................................................................................................... 19
Core Functionality of the FMIS .......................................................................................... 21
Overall Assessment ............................................................................................................. 21
4. Correlation with Other Budget Management Indexes ........................................................ 23
Sensitivity Analysis ............................................................................................................ 25
5. Concluding Remarks ........................................................................................................... 27
References ............................................................................................................................... 29
Appendix A. TSA Scoring Scheme ........................................................................................ 21
Appendix B. FMIS Coverage Scoring Scheme ...................................................................... 22
Appendix C. Core Functionality Scoring Scheme .................................................................. 24
Appendix D. Ancillary Features Scoring Scheme .................................................................. 28
Appendix E. Technical Aspects Scoring Scheme ................................................................... 29
Appendix F. Total Score Assessment ..................................................................................... 30

Tables
Table 1.1 Integrated FMIS Objectives by Area of Focus ....................................................... 11
Table 3.1 Overall Assessment of FMIS in Sample Countries ................................................ 22
Figures
Figure 3.1 TSA Coverage Score by Country .......................................................................... 19
Figure 3.2 FMIS Coverage Score of Select Countries ............................................................ 20
Figure 3.3 Core System Functionality Score of Select Countries .......................................... 21
Figure 4.1. Scatter Plot of PEFA Average Score and Total System Strength Score .............. 23
Figure 4.2. Countries Sorted into Three Groups on Total System Strength ........................... 24
Figure 4.3. Countries Sorted into Three Groups on PEFA scores .......................................... 25
Figure 4.4. PEFA Data Scrambled: Average Scores Plotted against TSS Score .................... 25
Figure 4.5 PEFA Average Plotted against TSS (1)................................................................. 26
Figure 4.6. PEFA Average Plotted against TSS (2)................................................................ 27

v
Abbreviations and Acronyms
BEF budget execution reports
COA Chart of Accounts
EBF Extra-Budgetary Funds
GFS Government Financial Statistics
IEG Independent Evaluation Group
IMF International Monetary Fund
FMIS financial management information system
MOF Ministry of Finance
MTEF medium-term expenditure framework
PFM public financial management
PEFA Public Expenditure and Financial Accountability
PPAR Project Performance Assessment Report
SU spending unit
TSA treasury single account
TSS total system strength


vii
Acknowledgments
This paper was written under the stewardship of Nick York, director IEGHE, and Mark
Sundberg, manager IEGEC. The paper benefitted substantially from various Project
Performance Assessment Reports to which Iradj Alikhani, Arun Arya, Salvatore Schiavo-
Campo, and Michael Stevens importantly contributed.
The authors are grateful to Cem Dener who has made available an extensive database of
FMIS World Bank projects and leads the World Bank financial management information
system (FMIS) community of practice which provides a useful forum for discussing FMIS-
related developments and issues.
Scores for the Philippines, Myanmar, Thailand, Lao PDR, and Malaysia are based on data
generously provided by country staff participating in a conference on Public Expenditure
Management Network in Asia, in Seoul, December 2–4, 2015. Leah April circulated the
template to the staff and asked them to complete the survey. Janis Platais provided additional
information that validated the scores for Lao PDR. Scores for Vietnam are based on data
provided by Mr. Nquyen Minh of the World Bank and the Vietnamese Treasury; scores for
Pakistan are based on data provided by Mr. Khuram Farooq of the World Bank and Mr.
Shezad Hasan of the Government of Pakistan; scores for Maldives and Nepal were provided
by Mr. Khuram Farooq; scores for Cambodia, the Russian Federation, and Kazakhstan are
based on data provided by Ali Hashim; scores for Zambia, Ghana, Malawi, Sierra Leone,
Zimbabwe, Mozambique, and Liberia are based on data provided by Mr. Khuram Farooq;
scores for Indonesia are based on data provided by Mr. Hari Purnomo of the World Bank.
Scores for Afghanistan were provided by Paul Welton and Vishal Gandhi.
Peer review comments were gratefully received from Guy Anderson, Michael Stevens, and
Clay Wescott. These were incorporated and tremendously improved the quality and clarity of
the report.


ix
Summary
A government’s capacity to manage its public finances is central to its ability to deliver
services. Well-functioning accounting and financial management systems are among the
basics that facilitate this, and significant resources and time have been invested for the
procurement and implementation of such systems across the world. Implementation is,
however, often associated with disappointing results and attribution to higher-level public
financial management (PFM) objectives difficult to establish.
On the basis of five in-depth project-level evaluations of World Bank investments, this paper
proposes a diagnostic framework that can be used to assess the utility of a Financial
Management Information System (FMIS) as a budget management tool. The purpose of this
is threefold:
To provide a better understanding of how an FMIS can contribute to larger PFM
objectives, such as improved use of resources or improved budget management.
Articulating the baseline and change in critical dimensions will establish a clearer log
frame and make more apparent the contribution of FMIS investments to improved
budget management. Applying this framework should do away with the notion that
implementing an FMIS alone is sufficient for better budget management.
To point out whether the system has the capacity to serve as a good budget
management tool and whether its functionality, coverage, and scope can have a
significant impact on a government’s ability to deliver services. Such an assessment
would also highlight any weaknesses and areas that need attention and help develop a
road map for further reform. As such, it will not only serve as a baseline but should
inform project design and strengthen the relevance of interventions. For example, a
country that scores highly on technical and reporting aspects but falls short with
regard to coverage may not need another information technology (IT) infrastructure
investment. Instead, a push to route more transactions and more types of transactions
through the system may be warranted.
To allow for comparison across countries within specific dimensions. This will
generate opportunities for learning: countries can draw on the experience of others
who may have successfully implemented certain reforms. For example, an analysis of
the treasury single account status can quickly provide an overview of good
performers, who may subsequently be drawn on as reference points.
The paper develops a total system strength score and weighs various dimensions according to
importance. The total system strength score is mapped to corresponding Public Expenditure
and Financial Accountability assessment dimensions to assess any correlation between the
two, and extensive sensitivity analysis suggests a positive correlation. This is interpreted as
an indication that the framework is robust.
A preliminary application of the methodology to a sample set of countries finds that in many
cases further reforms would be most effective if, at this stage, they pertained to expanding
treasury single account and FMIS coverage (and its associated controls) rather than
additional technological investments.


11
1. Introduction and Motivation
1.1 Financial Management Information Systems (FMISs) for government constitute a
fundamental part of public expenditure management. Automation of government financial
management processes has become an integral part of most public expenditure management
reform programs, because the availability of timely and accurate information is critical to the
economic management of government finances. As such, well-functioning accounting and
financial management systems underpin governments’ capacity to allocate and use resources
efficiently and effectively. The potential of such systems to improve effective service
delivery, and increase participation, transparency, and accountability to citizens, their elected
representatives, and creditors is widely recognized by the literature and practitioners (Chan
and Zhang, 2014: 243; Dener and others 2011; Dener and Min 2013; Hashim 2014).
1.2 As a consequence, investments in FMIS systems have been made on a large scale
around the world. The World Bank alone invested about US$3.5 billion across 74 countries.
Information and communication technology components tend to be the largest investment
item in such projects and make up, on average, about 50 percent of the cost (World Bank
2016). Project commitments have varied, depending on size and scope, ranging from
US$3.0 million (Cabo Verde) to US$231.0 million (Russian Federation).
1.3 Recognizing the potential payoffs, World Bank FMIS projects have had high-level
objectives along the lines of improved service delivery, improved public sector effectiveness,
better expenditure management, or improved transparency and accountability. Reviewing all
objectives of the 126 FMIS World Bank projects (table 1.1) shows that the majority
(40.5 percent) were focused on accountability, fiduciary responsibility, and oversight,
followed by transparency (39.7 percent), efficiency (35.7 percent), and effectiveness (20.6
percent).1
Table 1.1 Integrated FMIS Objectives by Area of Focus
Area of focus Number of projects Share (%)
Accountability, fiduciary responsibility, and oversight 51 40.5
Transparency 50 39.7
Efficiency 45 35.7
Effectiveness 26 20.6
Capacity and coverage 20 15.9
Public service delivery and access to services 12 9.5
Credibility 9 7.1
Allocation 7 5.6
Quality and timeliness of reporting and information 5 4.0
Utilization 5 4.0
Equity in resource sharing and inclusiveness 3 2.4
1 Categories per project are not mutually exclusive and thus add up to more than 100 percent.

12
Reliability 3 2.4
Total 126 100.0
Source: World Bank project portal.
Note: Categories per project are not mutually exclusive and thus add up to more than 100 percent.
1.4 In other words, projects were implementing FMIS systems expecting to achieve these
objectives. Although this is in principle reasonable, what is frequently lacking is a
sufficiently granular framework on the transmission channels on how the FMIS investment
would facilitate improvements in any given area of focus. The Independent Evaluation Group
(IEG) considered 77 percent of closed FMIS projects2 to have a modest or negligible
monitoring and evaluation framework. This figure gives little confidence that progress in
investments can adequately be tracked to intermediate or final outcomes, or that
improvements in outcomes are attributable to, and a reflection of, the FMIS investment.
Moreover, anecdotal evidence suggests that FMIS investments were often viewed as all-
encompassing and the adoption of a comprehensive system sufficient to achieve outcomes. A
recent literature review noted a “dearth of rigorous knowledge” (Combaz 2015, p. 3), with
evidence being mostly anecdotal and evaluation methods being insufficiently systematic.
Contributing to this situation is not only the lack of rigorous ex post evaluations but also the
apparent lack of adequate logical frameworks with sufficient baselines, intermediate outcome
indicators, and mechanisms to track progress.
1.5 Given the critical importance of FMISs, the apparent lack of rigorous evidence,
insufficient monitoring and evaluation frameworks, and a perception of poor performance,
this paper proposes a methodology that assesses the adequacy of FMISs as a budget
management tool. Conducting such an assessment would have the following benefits:3
It can identify critical areas of need in the current system. Thus, rather than an all-
encompassing engagement, interventions could be more targeted on the identified
bottlenecks and thus be more relevant for the achievement of the overall project
objective—which would also mean better value for money for project funds. Both of
these dimensions feed into IEG outcome ratings and could thus improve portfolio
performance.
It lends itself to the identification of critical indicators of the progress of FMIS as a
functioning budget management tool. Evidencing progress would facilitate attribution
to final outcomes and thereby strengthen the argument for better efficacy
performance—a factor critical to project outcome ratings.
Documenting progress at project end using relevant indicators will, over time,
generate the necessary evidence base that will better facilitate learning. As such, this
2 Of the 86 closed projects, 51 were assigned a monitoring and evaluation rating. Others have either
not been evaluated yet or were too old to have been assigned a rating.
3 Existing frameworks such as Public Expenditure and Financial Accountability (PEFA) assessments
cannot by themselves be used for this purpose. Although they provide good criteria for assessing the
quality of budget management across multiple dimensions, they do not connect any identified
deficiencies to specific features of the FMIS. However, if used along with this diagnostic framework,
the PEFA could form a better basis for developing a targeted reform program.

13
can improve portfolio performance, hold stakeholders accountable, and deliver
systems that facilitate improved management of public resources.
1.6 The proposed diagnostic framework is based on the experience of rigorous field-
based World Bank project-level evaluations with substantial FMIS components (see IEG
2016a–e). Additional desk-based studies were conducted for cases that may offer important
lessons, and a set of critical success factors and key failure points have been identified for the
entire system’s life cycle. Key observations derived from actual experience have informed a
checklist of functions and features in an FMIS that were found important for implementing
effective budget management and control. They cover the underlying enabling policy and the
institutional environment under which the systems operate, their functionality, the controls
they incorporate, and their actual use and coverage.
1.7 This checklist is presented as a diagnostic framework to determine whether an FMIS
has the basic design capacity to serve as a good budget management tool and whether its
coverage and scope of use is sufficient for fiscal management. Secondly, this study applies
the framework to assess the strength of the FMIS in terms of its effectiveness for budget
management and control as they exist in several (22) countries, and to highlight areas of
weakness where further reform efforts could focus.
1.8 To assess whether the system strength, as calculated above, can be used as a valid
indicator of its capacity for effective budget management, the total system strength (TSS)
scores, as calculated from the diagnostic, have been analyzed in conjunction with
corresponding PEFA scores to see whether there is any correlation between the two.
2. Methodology
2.1 Based on the experience in the IEG evaluations and building on work done by Dener
and others (2011) and Hashim (2014), this paper identifies a set of features that were found
to be critical for determining the effectiveness of an FMIS as a budget management tool.
These are discussed under the following five categories:
1. Treasury single account (TSA). This includes an assessment of the degree of
consolidation of government cash balances and the extent to which they are under the
direct purview of the treasury.
2. FMIS coverage. This category serves as a proxy for measuring the extent to which
government financial transactions are covered by the FMIS.
3. Core system functionality. This includes an assessment of core functionality
features of the system that are critical for it to act as a budget management tool.
Among others, it includes issues relating to budget management; commitment
management; payments management and associated controls; payroll-related
payments; debt service payments; fiscal transfers and subsidies; and tax and nontax
receipts.
4. Ancillary features. This category includes use of systems modules and interfaces
with other systems, such as budget preparation, Medium-Term Expenditure
Framework (MTEF) capability, establishment control and its integration with payroll
payments, debt management, fixed assets, and auditing.

14
5. Technical aspects. This provides an assessment of the nature of the underlying
information systems support for budget execution or treasury processes, systems
architecture, and the use of a data warehouse and associated analytical tools.
2.2 The diagnostic framework consists of a set of questions under these categories and
assigns scores to them depending on their relative importance. The templates for the various
categories are provided in appendixes A–E.4 From these questions, a total systems score is
derived based on Organisation for Economic Co-Operation and Development (OECD)
guidance on constructing composite indicators (Nardo and others, 2005). The authors
recognize that the total system score may be difficult to interpret, and hides important
granularity. Enumeration is only used to correlate FMIS TSS aggregates with PEFA scores.
Interpretation of findings pertains to the various subsections only. A detailed discussion on
the relevance of the various categories and methods for assessment is provided below.
TSA Coverage
2.3 The presence of a comprehensive TSA is a critical enabling condition for a
functioning budget execution system. From a cash management perspective it is important to
have all government moneys in a TSA at the central bank so asto avoid large idle balances in
commercial bank accounts outside the purview of the treasury and the control of the ministry
of finance. Placing money outside the TSA and the central bank means that government
would not be able to draw on these funds for investment (or fund requests from other
spending units). Further, commercial banks where this money is held can use it to buy
government borrowing instruments (such as T-bills) meaning they re-lend to government its
own money, at interest.
2.4 Ideally extra-budgetary funds and donor funds are also placed in a TSA and under the
purview of the Treasury. A root–branch arrangement can be set up such that donor funds can
be ring-fenced even though they are part of the TSA. However, as a second-best arrangement
several countries have adopted a modality where these funds are banked in the central bank,
but outside the TSA. This arrangement would lower the overdraft limit for government
borrowing from the central bank, and users could still have access through zero-balance
accounts in commercial banks where balances are swept periodically. The situation that
needs to be corrected is where such funds are banked in commercial banks which are not
zero-balance accounts of a main account in the central bank.
2.5 Linking accounts is not a different TSA modality; nor should it be viewed as a viable
alternative. Although linking accounts means that balances would be known, all of the
problems outlined above would still remain as long as the treasury cannot access these funds
directly. An International Monetary Fund (IMF) guidance note on TSAs makes this quite
clear, stating that for a TSA to work effectively, accounts should operate on a zero-balance
basis, and balances need to be swept into the central bank unconditionally (Pattanayak and
Fainboim 2011).
4 Important additional informational items such as staff and budgetary resources available for ongoing
system maintenance are discussed separately in appendix G.

15
2.6 To assess the comprehensiveness and scope of the TSA, the following scoring
mechanism was applied: If a TSA has been established, a base score of 10 points is given.
Subsequently, two points are deducted if (i) advances are given out to line ministries at the
start of the year and these are banked in commercial banks that are not linked to the TSA; (ii)
large extra-budgetary funds exist and are banked in commercial banks not linked to the TSA;
(iii) internally generated funds are banked in commercial banks owned by the line agencies;
and (iv) donor funds are banked in commercial banks not linked to the TSA. In all of the
above, if the magnitude of these funds is not high compared with the total budget, then a
deduction of only 1 point is made. The scoring system used in this category gives higher
marks for cases where these funds are banked in the central bank and are part of the TSA,
compared to the situation where they are banked in the central bank but are NOT part of the
TSA. If commercial bank accounts are merely linked, points are deducted for reasons
outlined above. A maximum score of 10 is possible, which is a proxy for all government
financial resources banked in the central bank or TSA. The full set of questions and scoring
sheet are provided in appendix A.
FMIS Coverage
2.7 The objective of this dimension is to identify which payments and receipt transactions
are routed through the FMIS and which bank accounts (where government financial
resources are banked) are covered by the FMIS. Coverage of the FMIS is critical because
partial budget and execution reports derived from the FMIS only give a partial picture.
Further, benefits related to commitment and expenditure controls would apply only to funds
covered by the FMIS; thus the usefulness of the FMIS as a budget management tool is a
function of the amount of government financial resources covered. Transactions can only be
considered as being routed through the system if subjected through system internal ex ante
budgetary controls. Posting transactions into the system after they have occurred only gives
the illusion of comprehensiveness, while integrity cannot be ensured and controls are not
applied.
2.8 Project advances and internally generated funds are a part of the government’s own
budgetary resources and should be transacted through the FMIS (banked in the TSA) and
therefore be subject to budgetary controls. Transactions related to extra-budgetary funds and
donor funds can also be routed through the FMIS even if they are not part of the TSA,
because these accounts can be defined in the FMIS and the agencies that are responsible for
transacting them can use the same system as is used for government funds. The following
scoring mechanism was applied: If an FMIS was set up and is being used, a basis score of 25
points is given. Deductions are made in the following scenarios:
a. Deductions of up to 4 points are made if transactions handled by the central
ministry of finance, such as debt servicing, fiscal transfers, and subsidies to state-
owned enterprises are not routed through the system and are carried out directly
by the ministry of finance communicating with the central bank. As noted above,
posting transactions into the system after they have occurred cannot be considered
the same as routing them through the FMIS.

16
b. A deduction of 4 points is made if the system is implemented only at the central
level. A deduction of only 2 points is made if it has also been implemented at the
provincial level. No deductions are made if it has been implemented countrywide.
c. A deduction is made depending on the extent to which transactions against the
recurrent budget are processed through the FMIS. If they are not, a deduction of
up to 4 points is made, with lower deductions depending on the amount of the
transactions compared with the total budget.
d. A deduction is made if transactions against the capital budget are processed
through the FMIS, depending on whether the advance accounts are controlled by
the FMIS. If they are not, a deduction of up to 5 points is made, with lower
deductions depending on the magnitude of the advances compared with the total
budget.
e. A deduction is made if transactions against extra-budgetary funds are processed
through the FMIS, depending on whether the extra-budgetary fund accounts are
controlled by the FMIS. If they are not, a deduction of up to 4 points is made,
with lower deductions depending on the magnitude of the extra-budgetary funds
compared with the total budget.
f. A deduction is made if transactions against IGFs are processed through the FMIS,
depending on whether internally generated funds accounts are controlled by the
FMIS. If they are not, a deduction of up to 4 points is made, with lower
deductions depending on the magnitude of the IGFs compared with the total
budget.
g. A deduction is made if transactions against donor funds are processed through the
FMIS, depending on whether donor fund special accounts are controlled by the
FMIS. If they are not, a deduction of up to 4 points is made, with lower
deductions depending on the magnitude of the donor funds compared with the
total budget.
2.9 A maximum score of 25 is possible, which is a proxy for all government financial
resources routed through the FMIS.
Core Functionality of the FMIS
2.10 This category attempts to establish the quality of the core functionality provided by
the system and the controls it incorporates. The concept of core functionality is outlined in
more detail in Hashim and Allan (2001). Points are given for individual features and added
up. The following evaluation questions are applied:
a. How does the FMIS accommodate budget management? What is the budget
classification structure in use, and is it compliant with IMF’s Government Finance
Statistics (GFS)? Is the chart of accounts for budgeting the same as that for
accounting, and is it the same across various levels of government? How are the
initial budget and in-year budget transactions loaded in the system?
b. How has commitment control been implemented, and is it applied to all
transactions? Is commitment control integrated with payment processing?
c. What are the controls exercised for the various types of payments that are handled
by the system?

17
d. How are tax and nontax receipts data recorded in the system?
e. What is the type of interface used with the banking system?
f. What is the quality of fiscal and financial reporting available from the system?
2.11 A maximum score of 40 points is possible as a proxy for all core functionality
requirements in place. Scoring details for the individual evaluation questions are outlined in
appendix C.
Ancillary Features
2.12 This category assesses ancillary features related to FMIS functionality, such as the
use of other modules and their interfaces with other systems. Modules scored under this
category include the nature of the budget preparation system, whether an medium-term
expenditure framework capability exists and is integrated with the budget preparation
module, the nature of the capacity to perform establishment control prior to making payroll
payments, the nature of the debt management system in place, whether a fixed-assets
management module is part of the FMIS in use, and whether oversight institutions have
independent access to the FMIS transaction databases. Points are given for each evaluation
question. A maximum of 15 points is possible. Details on individual evaluation questions and
scoring are provided in appendix D.
Technical Aspects
2.13 This category covers issues such as the nature of technology used, whether the FMIS
is custom developed or uses a commercial off-the-shelf application software package, the
scope of the functionality provided by the software, and the FMIS and its deployment
architecture. A maximum score of 10 points is possible. Evaluation questions are outlined in
appendix E.
Total System Score
2.14 The total system score is created based on OECD guidance for creating composite
indicators (Nardo and others, 2005). The total score is derived from aggregating the various
sub-dimensions, with a maximum score of 100 points being possible. Because not all of
features have the same importance, dimensions were weighted by how relevant the literature
perceives them for budget management (see Bartel 1996; Dener and others 2011; Diamond
and Khemani 2005; Hashim 2014; Hashim and Moon 2004; Premchand 2000; and Schick
1998). In particular, the scoring scheme allocates more points for the critical elements of the
policy, institutional, and systems elements required for effective budget management. These
include the status of the TSA (10 points), the coverage of the FMIS (25 points), and the core
functionality of the FMIS and the essential controls that it embodies (40 points). Non-core
functionality features (15 points) and the nature of the technology used and its deployment
(10 points) are viewed as secondary.
2.15 Authors are cognizant of shortcomings, including that the total score hides important
granularity, weighting can be perceived as subjective, and scores across dimensions are not
perfectly interchangeable (meaning that one could have two systems with the same score that

18
are different). Comparison across countries should thus be done with caution, and
interpretation, as done by this paper, should focus on the relative achievements of the various
sub-dimensions. In this paper, enumeration of the total system score is only used for plotting
results against PEFA scores to assess whether the diagnostic framework can serve as a proxy
for FMIS contribution to budget management.
3. A Preliminary Assessment Based on the Methodology
3.1 In this section, the methodology described above has been applied to assess the
strength of the FMIS in terms of its effectiveness for budget management and control in 22
countries. The various categories and sub-categories have been scored with the help of
several World Bank staff, country ministry of finance staff, and treasury staff.5 The following
are preliminary observations:
TSA Coverage
3.2 In several African countries, including Ghana, Liberia, , Sierra Leone, and Zambia,
the coverage of the TSA is very low. Although a TSA has been established, funds are
transferred to line agency advance accounts in commercial banks under the control of line
ministries. These accounts are not linked to the TSA by zero-balance clearing arrangements,
so the government does not have an accurate idea of the total amount of financial resources
in these accounts at a point in time. In addition, large extra-budgetary funds exist (such as
road funds) that are banked outside of the central bank and outside the control of the central
treasury. The same situation exists for internally generated funds, which line agencies are
allowed to bank in commercial banks under their own control; these are not linked to the
TSA. Further, locally denominated donors’ funds can constitute a large share of the total
government financing envelope and are typically banked in special accounts held in
commercial banks. These amounts outside the TSA can become quite large and, in effect,
represent financial resources over which the MOF has no control. These large balances
outside the TSA are generally not remunerated; they can also be used by the commercial
banks where they are banked to buy treasury bills floated by the government to manage its
liquidity, in which case the government effectively would pay interest on financial resources
which belong to it.
3.3 In South Asian countries such as Bangladesh, Myanmar, and Pakistan, this is less of a
problem. On the downside, donor funds in these countries are also usually banked outside the
central bank. The TSA composite scores are provided in figure 3.1.
5 Data for scores were generously provided by ministry of finance and treasury staff of various
countries, and World Bank staff. A detailed list is provided in the acknowledgements.

19
Figure 3.1 TSA Coverage Score by Country
Note: The following abbreviations apply to all figures and tables in this paper: Fed. = Federation; PDR = People’s
Democratic Republic.
FMIS Coverage
3.4 The coverage of the FMIS is very low in several countries, as shown in figure 3.2. It
is noted that in this group there are some countries, such as the Philippines and Myanmar,
where a budget execution system is still to be established and low coverage is to be expected.
However, this low coverage is also evident in several other African countries where costly
FMIS projects have been implemented over long periods of time. Prominent among these are
Ghana, Liberia, Malawi, Sierra Leone, and Zambia. The low scores in these countries
indicate that transactions related to advance accounts, internally generated funds, extra-
budgetary funds, and donor funds, which constitute a large percentage of the total
government resources for these countries, are not routed through the FMIS. Further, in some
cases domestic debt servicing as well as wages and salaries are not routed through the system
and are only posted to the general ledger after the transaction has occurred.
2 2 2 2 23 3
56 6 6
7 7 7 7 7 7 78 8 8 8
10
0
2
4
6
8
10
TS
A C
om
po
site
Sco
re

20
Figure 3.2 FMIS Coverage Score of Select Countries
3.5 It is also noted that in these countries, the core functionality score of the system that
determines its capacity for budget execution and control, as shown in figure 3.3, is quite
high, and the technology used is state of the art (see comparison table 3.1). In these countries,
the low coverage of the FMIS means that a sophisticated system is in place, but only a small
percentage of the transactions related to government financial resources are being channeled
through it and subjected to the ex-ante controls that are necessary for good fiscal
management. Therefore, to this extent, the investment is not being properly used.
3.6 The relatively low scores for Pakistan reflect the fact that large sections of the
economy, such as defense, railways, and departmentalized accounting agencies, do not use
the system for ex ante control of transactions. Further, the ministry of finance generates
transactions related to debt servicing and subsidies (for example, to the power sector) that
amount to billions of U.S. dollars, and then instructs the central bank to pay directly without
these transactions passing through the FMIS prior to payment. In the case of Maldives, the
system is operational only at the center.
3.7 In all these countries, the low coverage of the systems means that the overall fiscal
management reports and statutory financial statements produced by the system are not
complete. The reports as they stand are not useful to finance managers at the ministry of
finance for economic management. Various additions from manual systems need to be made
before a complete countrywide picture is obtained (this has been repeatedly stated by, for
example, the finance managers in the ministry of finance in Pakistan). Therefore, the focus of
the reform in these countries should be to close the gaps in coverage instead of making more
technological investments, as is being planned for in Zambia and Malawi, among others.
2 2
9 9 9 10 11 1113 14 15 15 15
1719
23 23 23 2325 25 25 25
0
5
10
15
20
25F
MIS
Co
ver
age
Sco
re

21
Core Functionality of the FMIS
3.8 This category assesses the core functionality and the controls incorporated in the
system for budget execution or treasury processes. For countries with no effective budget
execution system in place (for example, Myanmar and the Philippines), scores are
understandably low. Bangladesh scores poorly because the system in place does not integrate
budget data with budget execution data and does not carry out an ex ante check on budget
availability and therefore lacks critical controls. In Lao and Nepal the reason for the low
scores is that the systems in place are still rudimentary and lack core functionality such as
commitment control. The reform programs in these countries should therefore focus on
enhancing the FMIS functionality and its controls.
3.9 A notable point is that some countries with high scores in core system functionality,
such as Kazakhstan, Russia, and Vietnam, received low scores for ancillary features. In these
cases the core functionality required for budget execution has been established and the TSA
coverage is fairly comprehensive. Subsidiary systems (such as a budget preparation system
integrated with the budget execution system and a centralized payroll system) have been
given lower priority and are not in place (see table 3.1).
Figure 3.3 Core System Functionality Score of Select Countries
Overall Assessment
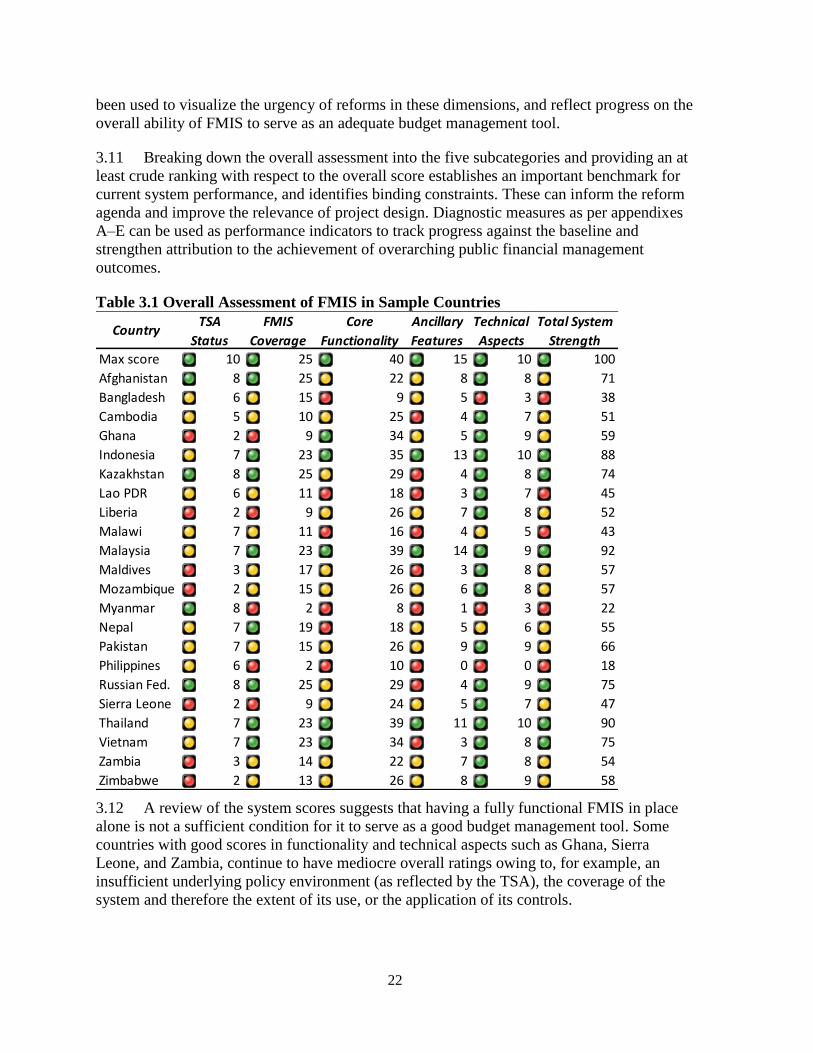
3.10 The overall scores show whether countries have a fully functioning financial
management system in place, and the extent of its ability to serve effectively as a budget
management tool. The total system strength score is a composite rating of the five
dimensions discussed above: (i) TSA, (ii) FMIS coverage, (iii) Core functionality of FMIS,
(iv) ancillary features, and (v) technical aspects. Table 3.1 summarizes performance of the
sample set of countries against these dimensions and ranks them by tertile. Traffic lights have
8 9 10
16 18 1822 22 24 25 26 26 26 26 26
29 2934 34 35
39 39 40
0
5
10
15
20
25
30
35
40
Co
re F
unct
ional
ity S
core
22
been used to visualize the urgency of reforms in these dimensions, and reflect progress on the
overall ability of FMIS to serve as an adequate budget management tool.
3.11 Breaking down the overall assessment into the five subcategories and providing an at
least crude ranking with respect to the overall score establishes an important benchmark for
current system performance, and identifies binding constraints. These can inform the reform
agenda and improve the relevance of project design. Diagnostic measures as per appendixes
A–E can be used as performance indicators to track progress against the baseline and
strengthen attribution to the achievement of overarching public financial management
outcomes.
Table 3.1 Overall Assessment of FMIS in Sample Countries
3.12 A review of the system scores suggests that having a fully functional FMIS in place
alone is not a sufficient condition for it to serve as a good budget management tool. Some
countries with good scores in functionality and technical aspects such as Ghana, Sierra
Leone, and Zambia, continue to have mediocre overall ratings owing to, for example, an
insufficient underlying policy environment (as reflected by the TSA), the coverage of the
system and therefore the extent of its use, or the application of its controls.
CountryTSA
Status
FMIS
Coverage
Core
Functionality
Ancillary
Features
Technical
Aspects
Total System
Strength
Max score 10 25 40 15 10 100
Afghanistan 8 25 22 8 8 71
Bangladesh 6 15 9 5 3 38
Cambodia 5 10 25 4 7 51
Ghana 2 9 34 5 9 59
Indonesia 7 23 35 13 10 88
Kazakhstan 8 25 29 4 8 74
Lao PDR 6 11 18 3 7 45
Liberia 2 9 26 7 8 52
Malawi 7 11 16 4 5 43
Malaysia 7 23 39 14 9 92
Maldives 3 17 26 3 8 57
Mozambique 2 15 26 6 8 57
Myanmar 8 2 8 1 3 22
Nepal 7 19 18 5 6 55
Pakistan 7 15 26 9 9 66
Philippines 6 2 10 0 0 18
Russian Fed. 8 25 29 4 9 75
Sierra Leone 2 9 24 5 7 47
Thailand 7 23 39 11 10 90
Vietnam 7 23 34 3 8 75
Zambia 3 14 22 7 8 54
Zimbabwe 2 13 26 8 9 58

23
4. Correlation with Other Budget Management Indexes
4.1 To assess whether the system strength, as calculated above, can be used as a valid
indicator of its capacity for effective budget management, the TSS scores as calculated above
for several countries have been compared with the corresponding PEFA scores for these
countries. For this purpose, the PEFA scores used are the latest available from the PEFA site,
and these scores have been converted to a numerical scale using the conversion scheme A =
4, B = 3, C = 2, and D = 1. This methodology has been used by others, for example de
Renzio (2009). It has some limitations: inter alia, the various indicators measure very
different things that are not equally important, and definitions used in different assessments
(for example, “arrears”) may not be the same (Ibid.).
4.2 The scatter diagram in figure 4.1 plots the PEFA scores for the countries included in
the survey against the corresponding TSS scores and shows a linear regression. This diagram
shows that there is a fairly high correlation between the TSS score and the PEFA average
value for these countries. It is observed that countries that have a comprehensive TSA, a
standardized budget classification structure and chart of accounts, and a good-quality FMIS
implemented with high coverage along with its controls do have significantly higher PEFA
scores.
Figure 4.1. Scatter Plot of PEFA Average Score and Total System Strength Score
4.3 To establish whether there is indeed an underlying correlation between the TSS score
and the PEFA average scores, it is necessary to suppress the scatter in the diagram because
part of the variation may be to the effect of inaccuracies in the indexes. To do this, the data
have been divided into three almost equal groups: (i) countries with the lowest scores, (ii)
countries with middle scores, and (iii) countries with the highest scores. The system score
values and the PEFA values have been averaged for these three groups. The averaged system
score values have then been plotted against the correspondingly averaged PEFA values. This
is shown in figure 4.2.
y = 0.016x + 1.4297
R² = 0.5698
1
1.5
2
2.5
3
3.5
0 10 20 30 40 50 60 70 80 90 100
PE
FA
Aver
age
Sco
re
Total System Strength Score

24
Figure 4.2. Countries Sorted into Three Groups on Total System Strength
4.4 This chart shows that there is indeed a very strong correlation between the systems
scores and the averaged PEFA values. To this extent, figure 4.2 also confirms that the
systems score calculated as above can be used as a fairly good indicator of the quality of the
FMIS as a tool for budget management, as implemented in a given country. It also shows that
countries with a strong FMIS do have significantly higher PEFA scores. However, it is noted
that improvements in the PEFA score are relatively modest, ranging from 2.05 to 2.65, which
represents a move from an overall C score to an overall C+ score. This emphasizes the
findings of the aforementioned project-level evaluations, which show that FMIS are
necessary but not a sufficient condition for good budget management. A multitude of other
factors also contribute to better results.
4.5 However, the critical requirement of a good FMIS for even a modest improvement in
the PEFA scores is shown by figure 4.3, in which the TSS scores are plotted against the
PEFA scores. This diagram implies that a steep improvement in FMIS strength would be
required (from 44 to 72) for even a modest improvement (1.9 to 2.8) in PEFA average scores
for a country.
y = 0.0165x + 1.4049
R² = 0.9161
1
1.5
2
2.5
3
3.5
0 10 20 30 40 50 60 70 80 90 100
PE
FA
Aver
age
Sco
re
Total System Strength Score

25
Figure 4.3. Countries Sorted into Three Groups on PEFA scores
Sensitivity Analysis
An extensive sensitivity analysis was carried out to test whether the correlation observed is
merely a spurious artifact of the methodology employed and the extent to which it was
dependent on the relative values and relative weights of the scores for the five categories.
Several tests were carried out.
4.6 First, to see whether there is indeed a causal relationship between an improvement in
the PEFA average score and the FMIS strength and to eliminate the possibility that the
improvement in the scores is merely a result of the data sample used, the TSS scores were
scrambled and plotted against the corresponding PEFA scores. This showed no correlation
with a low R-squared value (figure 4.4).
Figure 4.4. PEFA Data Scrambled: Average Scores Plotted against TSS Score
4.7 Second, a test was carried out to assess the sensitivity of the correlation to the relative
weights of the various components that were used in the calculation of system strength. For
this purpose, the calculation of the system strength was done according to three different
y = 32.735x - 19.533
R² = 0.9999
0
10
20
30
40
50
60
70
80
90
100
0 0.5 1 1.5 2 2.5 3 3.5
To
tal
Syst
em S
tren
ght
Sco
re
Average PEFA Score
y = 0.0046x + 2.0737
R² = 0.0435
1
1.5
2
2.5
3
3.5
0 20 40 60 80 100 120
PE
FA
Aver
age
Sco
re
Total System Strength Score

26
schemes: (i) the system strength was calculated as a sum of the scores for the TSA coverage,
the FMIS coverage, and the functionality and technical features; (ii) the FMIS coverage was
normalized to have the same weight as TSA coverage plus core and ancillary functionality
and technical features; and (iii) the TSS score was calculated as a product of the normalized
system’s strength with the sum of core functionality, ancillary functionality, and technical
features. To do this test, the system strength as calculated in the methodology has been
further summed up.
4.8 The total scores for the core and non-core functionality and the technical features
have been summed up into one variable named SUMtech. The total maximum score for
SUMtech in this scheme is 65. The total maximum score for the FMIS coverage is 25, and the
maximum score for the TSA is 10. The TSS is then calculated in two ways: first, as a sum of
TSA plus FMIS coverage and SUMtech (TSS = TSA + FMISnorm + SUMtech) (figure 4.5) and
second as a sum of TSA plus the product of the FMIS coverage and SUMtech (SS = TSA +
FMISnorm × SUMtech) (figure 4.6). These two indicators are plotted against the PEFA average
scores for these countries, and the results are shown in figures 4.5 and 4.6.
Figure 4.5 PEFA Average Plotted against TSS (1)
y = 0.0079x + 1.5482
R² = 0.5667
1
1.5
2
2.5
3
3.5
0 20 40 60 80 100 120 140 160 180
PE
FA
Aver
age
Sco
re
TSS = TSA + FMISnorm + SUMtech

27
Figure 4.6. PEFA Average Plotted against TSS (2)
4.9 It is seen that the value of R-squared for the case in which FMIS coverage is
normalized to have the same weight as that of SUMtech is essentially the same as the value of
R-squared for the calculation in which the system strength is calculated as a product of the
normalized FMIS coverage score with SUMtech.
4.10 It is also seen that there are no significant changes in the values of R-squared for the
samples as shown above compared with the values for R-squared for a simple summation of
the scores for TSA coverage, FMIS coverage (not normalized), and the functionality (core +
ancillary) and technical features. This value is R2 = 0.5647, and interpreted to mean that the
value of the system strength as used in the paper’s TSS approach is not excessively sensitive
to the relative weights assigned to the various categories.
5. Concluding Remarks
5.1 Given the increasing complexity of financial transactions and data management
needs, most countries have invested in some sort of automated FMIS to support their budget
management processes. The quality, scope, and coverage of these systems, however, varies
considerably across countries; consequently, there is also large variation in their ability to
effectively apply controls and manage the budget process. It is therefore necessary to
determine why in some cases desired results have remained elusive, while in others
significant improvements are apparent. A second generation of reforms may be necessary for
countries that have made limited progress, and investment strategies should be carefully built
upon evidence of why the previous attempt did not lead to an effective budget management
system.
5.2 This paper identifies a number of key factors that are necessary conditions for FMIS
to act as an effective budget management tool. These include:
The system needs to have core budget execution processes in place to enable
meaningful fiscal control and cash management.
Banking arrangements must be in place, such that all government finances are banked
in a TSA at the central bank or in zero-balance accounts in commercial banks. If large
y = 0.0002x + 1.8726
R² = 0.5996
1
1.5
2
2.5
3
3.5
0 1,000 2,000 3,000 4,000 5,000 6,000 7,000
PE
FA
Aver
age
Sco
re
TSS = TSA + FMISnorm × SUMtech

28
balances reside outside this arrangement and transactions are not routed through the
FMIS, these will not be subject to system controls and undermine basic budget
management.
The system needs to be comprehensive of all government expenditures. Otherwise
controls are only partial, and the system cannot be effective for fiscal management.
Entering expenditures into the general ledger after they have occurred (that is,
without subjecting them to FMIS budgetary controls), only gives the illusion of
control, while the system is de facto not comprehensive.
5.3 The lack of progress in any one of these dimensions will fundamentally undermine
the core objective of the system.6 This paper proposes a diagnostic framework that can be
applied to assess where core shortcomings are, and where future investments may best be
placed; interventions could thus be more focused and targeted. It would also provide for an
overall monitoring and evaluation framework: it can establish a baseline, progress indicators
can be derived from the desired intervention dimension, and eventual public financial
management outcomes will be more credibly attributable to the FMIS intervention. Applying
a consistent and objective evaluation methodology will, over time, build the necessary
evidence to inform as to what worked, provide better value for money, and build confidence
that any such system can help manage budgets effectively, has integrity, facilitates an
effective oversight function, and serves to institute fiscal discipline.
6 It should be noted that the political will to enforce compliance to protocols will also be necessary.
Controls can be in place, but are ineffective if they are being bypassed.
29
References
Bartel, Margaret. 1996. Integrated Financial Management Systems: A Guide to Implementation - Based on the
Experience in Latin America. Public Sector Modernization Division, Technical Department, Latin
America and the Caribbean Region; LATPS Occasional Paper Series No. 19. Washington, DC: World
Bank.
Chan, James L. and Qi Zhang. 2013. Government Accounting Standards and Policies. In Richard Allen,
Richard Hemming and Barry H. Potter. The International Handbook of Public Financial Management.
New York: Palgrave Macmillan: 742-766
Combaz, Emilie. 2015. Implementing Integrated Financial Management Information Systems. GSDRC
Helpdesk Research Report 1229. Birmingham, UK: GSDRC, University of Birmingham.
de Renzio, Paolo, 2009. Taking Stock: What do PEFA Assessments tell us about PFM systems across
countries? London: Overseas Development Institute. https://www.odi.org/sites/odi.org.uk/files/odi-
assets/publications-opinion-files/4359.pdf
Dener, Cem, Joanna Watkins, and William Leslie Dorotinsky. 2011. Financial Management Information
Systems: 25 Years of World Bank Experience on What Works and What Doesn’t. A World Bank Study.
Washington, DC: World Bank.
Dener, Cem, and Saw Young Min. 2013. Financial Management Information Systems and Open Budget Data:
Do Governments Report on Where the Money Goes? A World Bank Study. Washington, DC: World
Bank.
Diamond, Jack, and Pokar Khemani. 2005. “Introducing Financial Management Information Systems in
Developing Countries.” Working Paper WP/05/196. International Monetary Fund, Washington, DC.
Hashim, Ali, and Bill Allan. 2001. Treasury Reference Model. World Bank Technical Paper WTP 505.
Washington, DC: World Bank.
Hashim, Ali, and Allister J. Moon. 2004. Treasury Diagnostic Toolkit. World Bank Working Paper 19. World
Bank, Washington, DC.
Hashim, Ali. 2014. A Handbook on Financial Management Information Systems for Government: A
Practitioners Guide for Setting Reform Priorities, Systems Design, and Implementation. Africa
Operations Services Series. Washington, DC: World Bank.
Independent Evaluation Group (IEG). 2016a. Cambodia Public Financial Management and Accountability
Project. Project Performance Assessment Report. Washington, DC: World Bank. Forthcoming.
______. 2016b. PPAR Ghana E-Ghana Project. Project Performance Assessment Report. Washington, DC:
World Bank. Forthcoming.
______. 2016c. Malawi Financial Management, Transparency, and Accountability Project. Project
Performance Assessment Report. Report No. 103060. Washington, DC: World Bank.
______. 2016d. Vietnam Public Finance Management Reform Project, and Multi-Donor Trust Fund for Public
Financial Management Modernization Project. Project Performance Assessment Report. Report No.
106635. Washington, DC: World Bank.
______. 2016e. Zambia Public Sector Management Program Support Project. Project Performance Assessment
Report. Report No. 106280. Washington, DC: World Bank.
Nardo, Michael, Michaela Saisana, Andrea Saltelli, Stefano Tarantola, Anders Hoffman, and Enrico
Giovannini. 2005. "Handbook on Constructing Composite Indicators: Methodology and User
Guide", OECD Statistics Working Papers, No. 2005/03, OECD Publishing, Paris.
Pattanayak, Sailendra, and Israel Fainboim. 2011. Treasury Single Account: An Essential Tool for Government
Cash Management. Technical Notes and Manuals. Washington, DC: International Monetary Fund.
https://www.imf.org/external/pubs/ft/tnm/2011/tnm1104.pdf

30
Premchand, Arigapudi. 2000. Control of Public Money: The Fiscal machinery in developing countries. Oxford
University Press, USA.
Schick, Allan. 1998. A Contemporary Approach to Public Expenditure Management. Washington, DC: World
Bank.
World Bank. 2016. Financial Management Information Systems Database. FMIS Community of Practice.
http://www.worldbank.org/en/topic/governance/brief/financial-management-information-systems-fmis.
31
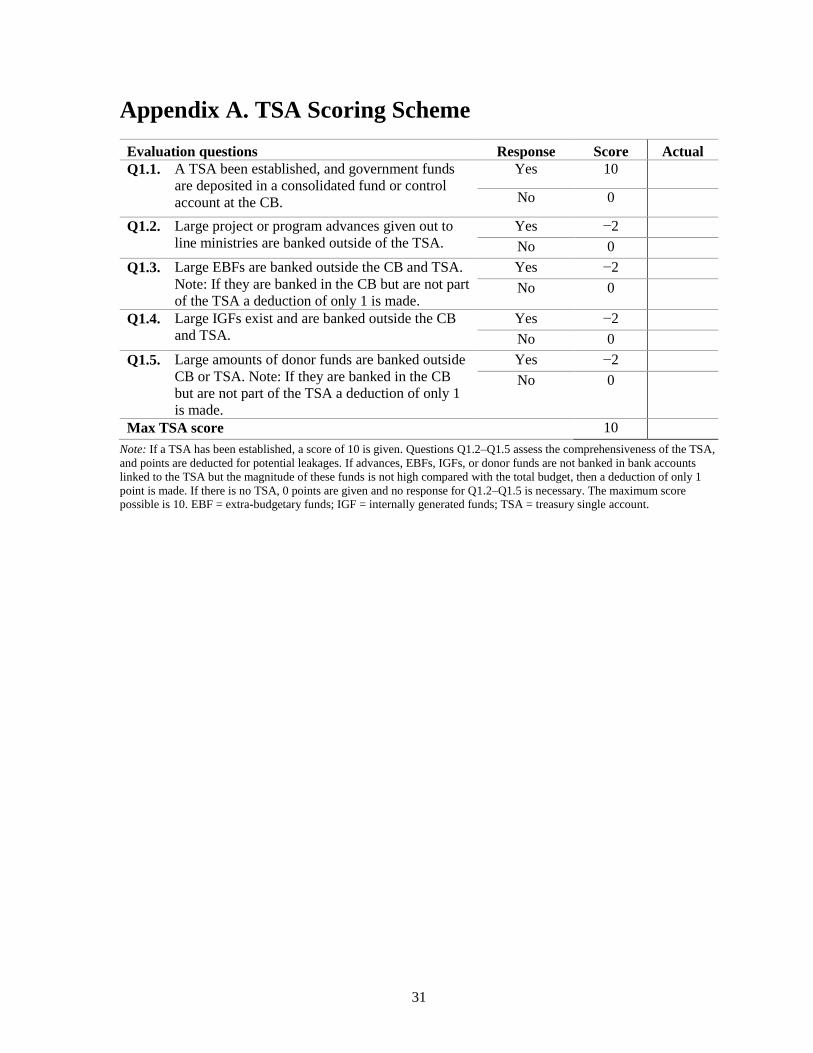
Appendix A. TSA Scoring Scheme
Evaluation questions Response Score Actual
Q1.1. A TSA been established, and government funds
are deposited in a consolidated fund or control
account at the CB.
Yes 10
No 0
Q1.2. Large project or program advances given out to
line ministries are banked outside of the TSA.
Yes −2
No 0
Q1.3. Large EBFs are banked outside the CB and TSA.
Note: If they are banked in the CB but are not part
of the TSA a deduction of only 1 is made.
Yes −2
No 0
Q1.4. Large IGFs exist and are banked outside the CB
and TSA.
Yes −2
No 0
Q1.5. Large amounts of donor funds are banked outside
CB or TSA. Note: If they are banked in the CB
but are not part of the TSA a deduction of only 1
is made.
Yes −2
No 0
Max TSA score 10
Note: If a TSA has been established, a score of 10 is given. Questions Q1.2–Q1.5 assess the comprehensiveness of the TSA,
and points are deducted for potential leakages. If advances, EBFs, IGFs, or donor funds are not banked in bank accounts
linked to the TSA but the magnitude of these funds is not high compared with the total budget, then a deduction of only 1
point is made. If there is no TSA, 0 points are given and no response for Q1.2–Q1.5 is necessary. The maximum score possible is 10. EBF = extra-budgetary funds; IGF = internally generated funds; TSA = treasury single account.

32
Appendix B. FMIS Coverage Scoring Scheme
Category Evaluation questions Response Score Actual
Q2.1. An FMIS has been
established.
An FMIS has been
established, and government
funds are routed through it.
25
There is no FMIS in place. 0
Cover
age
of
paym
ents
han
dle
d b
y t
he
MO
F
Q2.2. Are debt service payments
included?
Debt service payments are
sent directly to the CB and
then posted ex post in the
accounting system.
−2
Debt service payments are
routed through FMIS and
subject to ex ante budget
control.
0
Q2.3. Are fiscal transfers or
subsidies included?
Fiscal transfers, subsidies, or
transfers to state-owned
enterprises are not routed
through the FMIS. The MOF
directs the CB to make
payments directly.
Transactions may be posted
ex post in the system.
−2
Transactions are routed
through FMIS and are
subject to budgetary control.
0
Geo
gra
ph
ical
cover
age
Q2.4. What is the geographical
coverage? It pertains to line ministries
and spending units at central
levels only.
−4
It pertains to the center and
provinces.
−2
It pertains to the whole
country (that is, center,
provinces, and districts).
0
Cover
ag
e o
f fi
na
nci
ng
so
urc
es
Q2.5. Is the recurrent budget
processed through the
FMIS?
No −4
Yes 0
Q2.6. Are the capital budget or
project advances to line
ministries processed
through the FMIS?
No −5
Yes 0
Q2.7. Are EBFs processed
through the FMIS?
No −2
Yes 0
Q2.8. Are IGFs processed
through the FMIS?
No −2
Yes 0
Q2.9. If amounts of locally
denominated donor funds
are significant, are they
No −4
Yes 0

processed through the
FMIS?
Max FMIS coverage score 25
Note: If an FMIS has been implemented, a basis score of 25 is given. Questions Q2.2–Q2.9 assess the coverage of the FMIS,
and points are deducted for financing streams made outside. If there is no FMIS, 0 points are given, and no responses for
Q2.2–Q2.9 are necessary. The maximum score possible is 25. EBF = extra-budgetary funds; FMIS = Financial Management
Information System; FMIS = Integrated Financial Management Information System; IGF = internally generated funds; MOF = Ministry of Finance.

34
Appendix C. Core Functionality Scoring Scheme
Category Evaluation questions Response Score Actual
Bu
dg
et c
lass
ific
ati
on
Q3.1. Is the
classification
GFS compliant?
The BCS is not GFS compliant. 0 A basic GFS-compliant BCS with
function, organization, and
economic classification segments
is used.
1
A comprehensive BCS with
capacity to also monitor
expenditures on projects and
programs is in use.
2
Q3.2. Are budget and
accounting data
integrated?
The economic classification
segment of the BCS is not a subset
of the COA.
0
The economic classification
segment of the BCS is a subset of
the COA.
3
Q3.3. Is there
uniformity of
budget
classification?
The BCS and the COA are not the
same for all levels of government.
0
The BCS and the COA are the
same for all levels of government.
2
Bu
dget
tra
nsa
ctio
ns7
Q3.4. Is the budget
load integrated?
The treasury or MOF loads the
initial approved budget in the
system.
1
A budget preparation or
compilation system is in place and
integrated with the treasury
system. After the budget is
finalized, it is available to the core
treasury system to post
transactions; no separate load is
required.
2
Q3.5. How are in-year
budget
transactions (for
example,
apportionments,
allotments,
virements, and
fund releases)
managed?
The treasury or MOF enters
transactions in the system.
1
Line ministry budget
administrators are directly
connected to the system and enter
transactions in the system.
3
7 The approved budget should be transported by some automated means from the budget preparation
system. This should be done without interventions for budget execution. In-year changes to the
approved budget should be properly authorized and tracked.
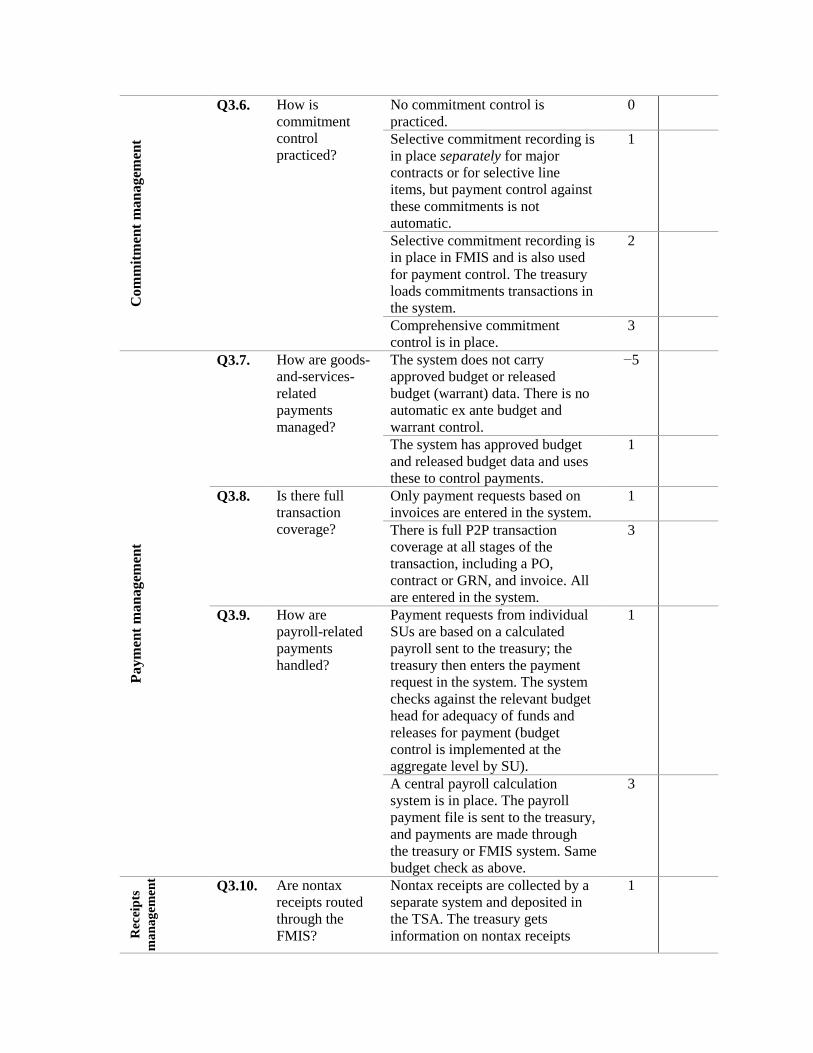
Co
mm
itm
ent
ma
na
gem
ent
Q3.6. How is
commitment
control
practiced?
No commitment control is
practiced.
0
Selective commitment recording is
in place separately for major
contracts or for selective line
items, but payment control against
these commitments is not
automatic.
1
Selective commitment recording is
in place in FMIS and is also used
for payment control. The treasury
loads commitments transactions in
the system.
2
Comprehensive commitment
control is in place.
3
Paym
ent
man
agem
ent
Q3.7. How are goods-
and-services-
related
payments
managed?
The system does not carry
approved budget or released
budget (warrant) data. There is no
automatic ex ante budget and
warrant control.
−5
The system has approved budget
and released budget data and uses
these to control payments.
1
Q3.8. Is there full
transaction
coverage?
Only payment requests based on
invoices are entered in the system.
1
There is full P2P transaction
coverage at all stages of the
transaction, including a PO,
contract or GRN, and invoice. All
are entered in the system.
3
Q3.9. How are
payroll-related
payments
handled?
Payment requests from individual
SUs are based on a calculated
payroll sent to the treasury; the
treasury then enters the payment
request in the system. The system
checks against the relevant budget
head for adequacy of funds and
releases for payment (budget
control is implemented at the
aggregate level by SU).
1
A central payroll calculation
system is in place. The payroll
payment file is sent to the treasury,
and payments are made through
the treasury or FMIS system. Same
budget check as above.
3
Rec
eip
ts
ma
na
gem
ent
Q3.10. Are nontax
receipts routed
through the
FMIS?
Nontax receipts are collected by a
separate system and deposited in
the TSA. The treasury gets
information on nontax receipts
1

36
through the banking interface-
reconciliation system.
Most nontax receipts are routed
through the FMIS.
2
Q3.11. How are taxes
and duties
managed?
Tax and customs receipts are
deposited in bank accounts
controlled by the customs and tax
department and are periodically
deposited in the TSA. The treasury
gets information via the banking
interface-reconciliation system.
1
Tax and customs receipts are
deposited in bank accounts
controlled by the treasury. The
treasury or TSA bank informs the
tax and customs departments of
details of receipts.
2
Inte
rface
wit
h b
an
kin
g s
yst
em
Q3.12. How are
payment
transactions
routed to the
TSA?
Payment transactions from FMIS
are sent to the TSA bank manually
or via a file-based interface.
0
Payment transactions from FMIS
are routed to the TSA bank via an
automated system (for example,
Swift).
2
Q3.13. How are receipts
sent to the
FMIS?
Receipt transactions from the TSA
bank or fiscal agent are sent to the
FMIS via a separate file or in the
form of paper-based statements.
0
Receipt transactions from the TSA
bank or fiscal agent are sent to the
FMIS via an automated banking
interface.
2
Fis
cal
rep
ort
ing
Q3.14. What is the
adequacy of
fiscal reporting?
The MOF relies on reports from
line agencies, which are submitted
late and cannot be checked for
accuracy.
0
The MOF gets some information
from the treasury or FMIS on the
status of budget execution for
payments and receipts that are
routed through the treasury.
1
The MOF gets fairly
comprehensive information on the
status of budget execution, since
most central budget transactions
are routed through treasury.
2

The MOF or treasury has complete
and timely information on all
budget receipts and expenditures.
A comprehensive set of fiscal or
BER reports is produced by the
treasury for the MOF.
3
Ba
sis
of
acc
ou
nti
ng
Q3.15. What is the
basis of
accounting?
Cash 1
Modified cash 2
Accrual 3
Ad
va
nce
d
bu
dg
etin
g
fea
ture
s
Q3.16. What is the
budgeting
modality?
Line item 1 Program based 2
Performance criteria are
introduced and monitored along
with costs.
3
Max core functionality score 40
Note: Scores of individual questions are simply added up. The maximum score possible is 40. BCS = budget classification
system; BER = budget execution reports; COA = chart of accounts EBF = extra-budgetary funds; FMIS = Financial
Management Information System; GFS = government financial statistics; GRN = goods received note; IGF = internally
generated funds; MOF = Ministry of Finance; P2P = procure to purchase; PO = purchase order; SU = spending unit; TSA = treasury single account.

38
Appendix D. Ancillary Features Scoring Scheme
Evaluation questions Response Score Actual
Bu
dg
et p
rep
ara
tio
n
Q4.1. How is the budget compiled
and prepared?
Manually 0
Partly or fully automated but
not integrated with the treasury
system
1
Automated and integrated with
the treasury system
2
Full budget preparation,
including calculation of the
costs of programs and projects
3
Q4.2. What is the MTEF capability? Operated separately from the
budget preparation system
1
Included in the budget
preparation system
3
Paym
ent
con
trol
Q4.3. How is establishment control
integrated with payment
control?
No establishment control 0
Ministry of Public Service or
the treasury checks availability
of establishment (posts) off-
line before running payroll
2
Integrated with the treasury
payments system; prior to the
payroll run, the Ministry of
Public Service or the treasury
checks for availability of
approved posts from the
approved establishment list
online. In this case the budget
check is both the aggregate
budget of the SU and the
establishment register to see
whether the person being paid
is occupying an approved slot.
This reduces the risk of
payment to ghost workers.
4
Deb
t
ma
na
gem
ent Q4.4. How is debt management
handled?
Manually 0
Automated but not interfaced
with the treasury system.
1
Automated and integrated with
the treasury system.
2
Fix
ed
ass
ets Q4.5. How are fixed assets managed? Manually 0
Automated and integrated with
the treasury system
1

Au
dit
ing
Q4.6. How is the auditing function
accommodated?
Not interfaced. 0
Audit department has access to
treasury databases
3
Max score ancillary features 15
Note: MTEF = Medium-Term Expenditure Framework.

40
Appendix E. Technical Aspects Scoring Scheme
Evaluation Questions Response Score Actual
Q5.1. What is the
information systems
support?
No information systems support 0
Rudimentary and partially manual information
systems assist the treasury in distributing limits
and warrants and controlling payments, and a
patchwork of systems that are not connected to
each other is in use.
1
A countrywide, online, custom-developed basic
treasury system is in use, which enables budget
availability checks and warrant control and allows
the MOF or treasury to practice fiscal control.
2
A fully functioning treasury system with capacity
for budget management, commitment
management, accounts payable, accounts
receivable, general ledger, purchasing, fixed
assets, and fiscal reporting is in place, and the
system has the capacity to use accrual accounting.
3
Q5.2. What is the systems
architecture?
None 0
Distributed architecture 1
Partially distributed architecture 2
Centralized architecture 3
Q5.3. What is the systems
deployment
modality?
Treasury centered 1
Treasury and line ministries and budget
administrators are directly connected to the
system.
2
Budget administrators, line ministries, spending
units, and treasury offices are connected, or line
ministries and SUs have access via a web portal.
3
Q5.4. What is the use of
data warehouse and
analytical tools?
None 0
A data warehouse has been implemented and
gives users the ability to formulate queries against
the system databases and produce a variety of
fiscal and budget execution and other analytical
reports.
1
Max technical aspects score 10
Note: MOF = Ministry of Finance; SU = spending unit.

Appendix F. Total Score Assessment
Dimension Max score Actual Actual / Max
TSA 10
FMIS coverage 25
Core functionality 40
Ancillary features 15
Technical aspects 10
Total 100
Note: TSA = treasury single account; FMIS = Financial Management Information System.

42
Appendix G. Additional Informational Items
This appendix contains questions regarding some informational items which describe the
technical platform used, the numbers of users that are connected to the system, and the costs
that have been incurred for setting it up and are required for its ongoing maintenance. No
scores are assigned for these items but information regarding them is important to assess
costs incurred for setting up the system, its ongoing maintenance, and its sustainability.
The Appendix also requests information on the numbers of staff and budgetary resources that
are available for ongoing maintenance and the quality of the telecommunications network
that is used to connect the various system nodes in the country. These aspects have been
found to be important on the ongoing operations and maintenance and for the sustainability
of the FMIS.
Nature of Technical Platform Used and Associated Costs
Evaluation Question Response
Nat
ure
of
soft
war
e
Custom Developed/COTS
Name of the software package used in case of COTS with
software version.
Number of end-users connected to the system (average,
maximum)
Co
st it
em
s (i
n U
S$)
Total capital cost to date
Application software licenses
Implementation services
Hardware systems software etc.
Telecommunications network costs
Other ( Design and supervision consultancies)
Total annual recurrent / operating costs
License fees (Application Software, middleware)
Ongoing telecommunications usage costs
Costs for Technical staff for systems operation and
maintenance
Arrangements for Operational Sustainability
Evaluation Questions Response Actual
Is there an adequate number of technical staff available
within the MOF/Government to provide ongoing
maintenance and support for the system?
Yes
No
Are there adequate budgetary resources allocated on a
yearly basis for ongoing systems maintenance and
support and for operational costs?
Yes
No

What is the quality of the telecommunications network
that connects remote end-users to the system in terms of
the bandwidth available, robustness, and medium of
connection (e.g., fiber)?
Very good
Good
Fair