a diagnostic tree for improving production line performancewebuser.bus.umich.edu/whopp/reprints/a...
TRANSCRIPT
A Diagnostic Tree for Improving ProductionLine Performance
Wallace J. Hopp • Seyed M. R. Iravani • Biying ShouDepartment of Industrial Engineering and Management Sciences, Northwestern University,
Evanston, Illinois 60208, USADepartment of Industrial Engineering and Management Sciences, Northwestern University,
Evanston, Illinois 60208, USA4R Systems, 1400 Liberty Ridge Drive, Suite 102, Wayne, Pennsylvania 19087, [email protected] • [email protected] • [email protected]
Improving performance of production systems is a critical but often unstructured activity. To helpmanagers convert ad hoc or trial & error improvement efforts into efficient and systematic reviews, we
develop a diagnostic tree which decomposes a performance improvement objective into successivelymore concrete sub-objectives and finally into potential improvement strategies. Based on principles fromthe Operations Management literature, this tree is structured to enable a non-specialist to betterunderstand the links between corrective actions and performance. It also provides an importantfoundation for a principles-based knowledge management system that couples the decision tree with asearch engine for locating relevant documents within an intranet.
Key words: knowledge management; factory physics; diagnostic treeSubmissions and Acceptance: Received May 2005; revision received February 2006; accepted April 2006.
1. IntroductionFrom the advent of the factory system during theindustrial revolution, manufacturing firms have beenstriving to improve critical business processes. Toachieve distinction in the marketplace, manufacturershave sought new ways to reduce cost, improve qual-ity, speed response time, and enhance flexibility. Inrecent years, as product life cycles have becomeshorter and global competition has intensified, theimportance of continual improvement has becomemore critical than ever.
There exists a vast operations management (OM)literature that provides many insights into manufac-turing system behavior as well as methods for improv-ing system performance. Unfortunately, evidence sug-gests that the industry practitioners have madelimited use of these results. For example, in a reviewof the history of the Institute for Operations Researchand the Management Sciences (INFORMS), Horner(2002) commented:
“It didn’t help that traditional management science coursesstarted losing ground in business schools. It turns out thatMBAs are more interested in making money than making
mathematical models. Go figure. The net result: many busi-ness schools responded to their customers’ (i.e., students)demands by reducing or eliminating the once-required man-agement science component of their curriculums. That, inturn, further dampened the profile of OR/MS in the corpo-rate world and no doubt led some analysts to reconsider theirprofessional affiliation.”
In a similar vein, in a discussion of where OperationsResearch should go, Dunnigan (2004) said:
“Because OR requires you to think clearly and methodically,there aren’t many practitioners. Despite strenuous efforts,only about five percent of US army officers are familiar withOR techniques (based on an estimate I did with Army ORinstructors at Ft. Lee.) And the army has cut back on thetraining of officers in operations research techniques.”
We believe there are two major reasons for this gapbetween theory and practice. First, the OM field coversa wide range of topics, so practitioners may easily getlost when seeking relevant results for their specificsystem in the vast literature. This is becoming evenmore challenging as the OM literature continues togrow. Second, much of the research literature involves
POMSPRODUCTION AND OPERATIONS MANAGEMENTVol. 16, No. 1, January-February 2007, pp. 77–92issn 1059-1478 � 07 � 1601 � 077$1.25 © 2007 Production and Operations Management Society
77
considerable mathematical complexity, which makesit difficult for practitioners to implement ideas di-rectly. Buzacott and Shanthikumar (1993) noted:
“(To have managers believe in models) often requires that themanagers have detailed understanding of the techniques ofmodel formulation and solution. This is still rare in manu-facturing.”
In order to make the work of the academic OM fieldmore available to practitioners, we must find a way tosummarize a broad cross-section of principles andinsights from the literature and display them in anintuitive and easy-to-use framework. In this paper, wetake a first step toward developing such a frameworkby creating a diagnostic tree for evaluating and im-proving production lines. The origin (root node) ofthis tree corresponds to the objective to improve per-formance. The tree decomposes this objective into sub-ordinate objectives (nodes) which contribute to theparent objective. Some of these subordinate objectivesare then decomposed further. As the decompositiongoes on and the sub-objectives become more concrete,potential improvement strategies (remedies) emergenaturally. To enable the user to navigate through thetree, we provide background information on how eachsub-objective contributes to the parent-objective andhow to determine which sub-objective is relevant tothe current situation.
The decomposition of objectives at the top levels ofthe tree is based on generic concepts from the OMliterature. As such, we expect them to be relativelyfixed. However, at the lower levels of the tree, whereobjectives become more specific to the environment,the tree needs to be more adaptable. For this, we haveconstructed a tree-building tool that makes it easy forexperts to improve and update the tree over time (seeBirnbaum et al. 2005 for an overview). This enablesorganizations to start out with a basic science-driventree and evolve a larger practice-oriented tree. Thisprocess makes the knowledge of the OM literatureand the organization’s internal experts available toproblem solvers with less experience.
Appropriately used, our diagnostic tree can assistmanufacturing managers in finding effective improve-ment strategies, as well as developing a broader anddeeper understanding of the underlying behavior oftheir systems. From the perspective of knowledgemanagement, our approach provides a mechanism forcodifying tacit knowledge in terms of basic principles(Ferdows 2006).
2. Literature ReviewThe process of diagnosing problems and searching forimprovement opportunities can be considered as achain of decision-making processes. Simon (1977) de-
scribed such a decision making process as a three-phase process consisting of:
• Intelligence: searching for conditions that call fordecisions,
• Design: inventing, developing, and analyzing pos-sible courses of action,
• Choice: selecting a course of action from thoseavailable.
Decision-making processes fall along a continuumthat ranges from highly structured to highly unstruc-tured (Turban and Aronson 1998). Structured processesinvolve problems for which standard solutions exist.Unstructured processes are those for which none of thethree phases is structured. They are fuzzy, complexproblems for which there are no cut-and-dried solu-tions. Decisions where some but not all of the phasesare structured are called semi-structured.
In structured problems, procedures for obtainingthe best solution or a satisfying solution are well es-tablished. Often, a prescribed solution can be devel-oped through the use of quantitative formulas or mod-els. Modeling involves the transformation of the real-world problem into an appropriate prototype (usuallymathematical) structure. Because of the tractability ofmathematical models, most models in the OM litera-ture are focused on a small part of the real system andomit much detail to allow them to be formulatedprecisely (Buzacott and Shanthikumar 1993). Since di-agnosing production performance issues and search-ing for improvement opportunities involves wideranges of factors, it is difficult for practitioners toapply results generated from simplified OM modelsdirectly. As a result, practitioner improvement effortshave mostly been unstructured and have relied onhuman intuition as the basis for decision-making.
There are two main categories of information tech-nologies that can help decision making in unstruc-tured problem contexts: expert systems and learningmechanisms. Expert systems acquire knowledge fromhuman experts and code it into computer programs toaid those with less expertise in solving similar prob-lems. Examples of expert systems include knowledge-based systems and fuzzy logic. Learning mechanismdevelop rules and/or relationships between data viaextensive data training. Examples include neural net-works, decision tree learning, and data mining.
An expert system is a computer program that rep-resents and reasons with knowledge of a human spe-cialist with an objective to solving problems or givingadvice (Jackson 1990). The expert knowledge may con-sist of a combination of a theoretical understanding ofthe problem and a collection of heuristic problem-solving rules that shown by experience to be effectivein the domain. An expert system contains three basicelements: a knowledge base, an inference engine, anda controller. The expert’s knowledge is contained in
Hopp, Iravani, and Shou: A Diagnostic Tree for Improving Production Line Performance78 Production and Operations Management 16(1), pp. 77–92, © 2007 Production and Operations Management Society

the knowledge base. The inference engine contains therules of logic and analysis that are applied to informa-tion in the knowledge base, and the controller man-ages the system by applying the inference engine func-tionality to the appropriate knowledge.
Expert systems have been successfully applied to adiverse range of domains, such as organic chemistry,mineral exploration, and internal medicine. Typicaltasks for expert systems involve the interpretation ofdata (such as sonar signals), diagnosis of faults ordiseases, structural analysis of complex objects (suchas chemical compounds), and planning of sequencesof actions (Jackson 1990). Expert systems have alsoseen a number of applications in manufacturing andservice management. For example, Perez and Koh(1993) describe the design and implementation of ex-pert systems for parametric test analysis for semicon-ductor manufacturing; Yi et al. (1998) and Qiu et al.(2001) present applications for engine diagnosis; Mausand Keyes (1991) review applications of expert systemin manufacturing ranging from scheduling and fore-casting, resource allocation, diagnostics, process con-trol and planning, to design, quality and safety, andpricing.
Knowledge acquisition, which is defined as “thetransfer and transformation of potential problem-solv-ing expertise from some knowledge source to a pro-gram” (Buchanan and Shortliffe 1984), is often consid-ered “the bottleneck” of expert system application.Knowledge acquisition is usually accomplished by aseries of lengthy and intensive interviews between aknowledge engineer, who is normally a computer spe-cialist, and a domain expert. The productivity of thisprocess is typically low. There are several possiblereasons for this: (i) In order to efficiently communicatewith the domain expert, the knowledge expert needsto learn the specific domain at some level of technicaldetail. (ii) The facts and principles underlying manydomains of interest cannot be clearly articulated in aformat that is easily coded into a program. (iii) Expertsare usually in demand, and hence, may be too busy totake part in the knowledge engineering process. (iv)Experts may fear that the system will threaten theirjobs. In fact, considerable literature has been devotedto discussing incentives for encouraging people toshare their knowledge (e.g., Drucker et al. 1998; VonKrogh et al. 2000). However, there is not yet a gener-ally accepted incentive system for promoting expertparticipation.
Another key environmental requirement for makingeffective use of an expert system is the ability to applya relatively constant set of rules over time. For exam-ple, in medical applications, rules based on humanphysiology apply to many patients and do not changerapidly; hence, an expert system can be highly useful.In manufacturing, applications like engine diagnostics
are similar to medical settings. Other applications,such as scheduling and quality control, can also besubjected to rule-based control, but the effectivenessdepends on the range of decisions to which these rulescan be applied. Thousands of rules are needed toprovide specific solutions to the problems, but it doesnot make sense to expend the effort needed to compilesuch a big set of rules if they will become obsolete afteronly a few decisions.
In contrast to the expert system approach, learningmechanisms discover rules and/or relationships be-tween data via extensive data training. For example,artificial neural networks mimic the processes foundin biological neurons to predict and learn from a givendata set. Today, neural networks are used in applica-tions such as pattern recognition, optical characterrecognition, outcome prediction, and problem classi-fication (Anderson 1995). Examples of other applica-tions can be found in Khoshnevis et al. (1999) and Linet al. (1996).
Compared with the expert system methodology,learning mechanisms have the advantage of beingcapable of learning, adapting, and discovering hiddenrelationships in data. However, their development of-ten requires substantial amount of training data, usu-ally hundreds or even thousands of cases. Moreover,the categories or attributes to which these examplecases are assigned must be established beforehand. Inorder to diagnose problems in manufacturing processand find potential improvement strategies, this re-quires a thorough understanding about the relation-ships between a wide range of factors. For example, ifthe system designer is not aware of the potential im-pact of buffer size and hence does not provide infor-mation in the training cases to examine it, there is nochance that the trained system will suggest checkingbuffer size as a possible reason for poor throughput.Beyond the difficulty of collecting large sets of trainingexamples that contain complete descriptions of vari-ables that could contribute to a poor performance,data validation, and error recovery pose further chal-lenges during the development and evolution of alearning mechanism. Finally, since training data arecollected from a specific environment, the applicabil-ity of the generated results are heavily dependent onthe specific domain/context, and are therefore usuallyhard to apply to other environments.
The premise of our research is that there exists abody of science that describes the underlying princi-ples governing the behavior of a broad range of man-ufacturing systems. By appealing to this manufactur-ing science, we can save a great deal of time andexpenditure by reducing the tedious interviewing pro-cess (in the expert system approach) or the long train-ing procedure (in the learning mechanism approach).To do this, we extract principles and insights from the
Hopp, Iravani, and Shou: A Diagnostic Tree for Improving Production Line PerformanceProduction and Operations Management 16(1), pp. 77–92, © 2007 Production and Operations Management Society 79

existing literature (see e.g., Buzacott and Shanthiku-mar 1993; Askin and Standridge 1993; Suri 1998;Anupindi et al. 1999; Hopp and Spearman 2000), sum-marize a wide range of basic relationships, and distillthese into a hierarchical tree that links performancemetrics to improvement policies. This science-basedapproach enables our diagnostic tree to provide com-prehensive coverage of major alternatives relevant to agiven setting.
We give a high level schematic of the resultingdiagnostic tree in Figure 1. We appeal to the basicprinciples to generate the generic-rules portion of thetree. Because the above literature focuses on produc-tion lines where parts flow between operations sepa-rated by intermediate inventory buffers, this tree isappropriate for manufacturing systems organized intolines. For other environments (e.g., project-oriented“bay build” systems and service systems involvingcollaborative work), a modified tree is needed.
While a theory based tree can provide reasonablycomprehensive guidance at a generic level, it cannotenumerate environmentally specific suggestions. Atthe point where objectives decompose into domainspecific rules (such as adjusting the specific gravity ofthe copper plating solution to reduce incidence of“dish down” defects), we leave the problem solving toa search engine that can identify relevant documents(see e.g., Birnbaum et al. 2005) or focused communi-cation with a human expert. By avoiding codificationof overly detailed domain specific rules, the diagnostictree will remain relatively robust over time and envi-ronment setting. Moreover, by decomposing higher-level performance metrics into generic classes of im-provement objectives (i.e., those in the dotted box inFigure 1), managers can substantially narrow downtheir search and structure their thinking about a solu-tion to their particular problem.
There are two related approaches for reporting andanalyzing decision problems that also make use of an
iterative decomposition process to generate alterna-tives:
• Influence diagrams: were introduced in the late1970’s by Ronald Howard and James Mathesonand have since become widely used in decisionanalysis (see e.g., Keeney 1992; Horvitz 2005). Aninfluence diagram begins with an objective nodeand then expresses achievement of that objectiveas a function of the achievement of several lower-level objectives. The process continues iterativelyuntil one identifies actionable drivers of the over-all objective.
• Fishbone diagrams: are also known as “Cause andEffect diagrams” or “Ishikawa” diagrams aftertheir creator Kaoru Ishikawa (Isikawa 1985). Theyare widely used in Total Quality Management(TQM) to systematically enumerate the variouscauses of a specific problem or effect.
Our approach shares the general objective of influ-ence and fishbone diagrams to provide clear, intuitiveinformation, while remaining rigorous methodologi-cally. We also share the graphical approach of thesemethods, which has been shown to be effective ineliciting influences, beliefs and preferences in a natu-ral and comfortable manner, and in providing a com-putational substrate for efficient inference (Horvitz2005). Ultimately, the effectiveness of our approach,like that of influence and fishbone diagrams, is pre-mised on the belief that scientific decomposition of aproblem (objective) and thorough investigation of al-ternatives outperforms ad-hoc solutions aimed atsymptoms rather than underlying causes.
The primary difference of our approach from theseprevious methods is that it has been designed explic-itly to address Operations Management issues. Whilea generic influence or fishbone diagram could be ap-plied to the class of problems we consider, they wouldleave to the user to identify the cause-and-effect rela-tionships. By using the principles of factory physics,
Figure 1 Generic Rules vs. Domain Specific Rules
Hopp, Iravani, and Shou: A Diagnostic Tree for Improving Production Line Performance80 Production and Operations Management 16(1), pp. 77–92, © 2007 Production and Operations Management Society

we are able to provide a substantial amount of struc-ture to the diagnostic tree. This simplifies the userstask by encoding the established body of knowledgeinto the generic rules in the high level portions of thetree. When the decision process reaches the more de-tailed levels of the lower portions of the tree, the usermust make use of local environmental knowledge toidentify relationships. So our method devolves to aversion of a influence/fishbone diagram at those lev-els. However, the ability to incorporate a body ofknowledge at the generic level, and to incorporateartificial intelligence guided searches of the Internetand/or an Intranet to provide the user with additionalguidance (see Birnbaum et al. [2005] for a descriptionof this hybrid decision tree/search engine approach)makes our approach particularly well-suited to diag-nosing and improving production systems.
To our knowledge, the diagnostic tree we proposein this paper is the first attempt to aggregate thescience of production lines into such a concise andapplication-oriented framework. On its own, this toolcan provide guidelines for managers; combined withmore detailed knowledge of a domain expert, it canhelp propose effective solutions; armed with learningmechanism, it can serve as the foundation of a systemthat evolves over time, adapts to a specific domain,and evaluates the effectiveness of specific solutions.
The remainder of the paper is organized as follows.Section 3 describes the elements of the diagnostic tree.Section 4 illustrates the value of the tree by applying itto a real-world case study. Finally, conclusions anddiscussions are presented in Section 5.
3. Diagnostic TreeThe primary elements of our Diagnostic Tree (D-Tree)are objective nodes and diagnosis nodes:
• Objective nodes represent the performance objec-tives of concern to managers, such as “reducecycle time” or “improve throughput”.
• Diagnosis nodes explain the related science, such aswhich important concepts and mathematical for-mulas are relevant to the current context, whatdata analysis should be performed, and what sub-ordinate improvement strategies may contributeto the current objective. The diagnosis nodes alsoprovide a list of factors stating when each subor-dinate improvement strategy may be attractive.For example, factors that may make “Increasingbottleneck capacity” attractive include “high bot-tleneck station utilization” and “additional capac-ity is easy and cheap to obtain”.
At any objective node in the tree, the user considersthe situation of the manufacturing line as well as theinformation provided by the tree to decide whichsubordinate node(s) may be relevant. New rounds of
diagnosis and decomposition are then performedupon these nodes. The process continues until itreaches a node(s) that is concrete enough to serve as aguideline for practice.
Due to space constraints, we present only a smallportion of our D-Tree in Figure 2. We refer thereader to http://km.mccormick.northwestern.edu/tree/viewnode.php for a complete web-based representationof the tree. The first level of the tree consists of theprimary performance objectives of a production sys-tem: improving throughput, reducing cycle time, im-proving quality, improving customer service, and re-ducing cost. The user selects the objective of interestand then, with the aid of the D-Tree, decomposes thisobjective into successively more concrete subordinateobjectives.
3.1. Exploring the Diagnostic TreeTo illustrate how this D-Tree translates OM principlesinto simple decision rules, let us consider an example.Suppose the user has decided that reducing cycle timeis crucial to remain competitive, and clicks “Reducecycle time”. This leads to the web page shown inFigure 3.
The page in Figure 3, as is typical of the pages formost nodes, contains four major components:
(I) The name of the current node, as well as thediagnosis path leading to the current node. In thisexample, it shows that the current node is “reducecycle time” and it was reached directly from the rootnode “Production system performance improve-ment”. This information helps users keep track of thediagnosis process and also easily return to previousnodes and continue exploring the tree from them.
(II) The content of the diagnosis node associatedwith the current node, which shows how the currentnode/objective may be decomposed further into moreconcrete sub-objectives. In this case, the diagnosisnode explains how “reduce cycle time” may beachieved via two avenues: (1) “Reduce excessive sta-tion cycle time”, and (2) “Enhance parallel tasking”. Itfurther suggests that when large delays are commonthe former is likely to be an attractive strategy, butwhen jobs are processed in large batches or there isopportunity to divide work so that it can be processedsimultaneously at different stations the latter is likelyto be attractive. The text following “A note on paralleltasking” further clarifies why “parallel tasking” isbeneficial by providing an example.
(III) The navigation section, which provides thelinks to the immediate subordinate nodes of the cur-rent node. In this case, links to “Reduce station cycletime” and “Enhance parallel tasking” are listed.
(IV) Comments box, where users may input theircomments (such as thoughts on why they think certainsubordinate objective may be effective for their pro-
Hopp, Iravani, and Shou: A Diagnostic Tree for Improving Production Line PerformanceProduction and Operations Management 16(1), pp. 77–92, © 2007 Production and Operations Management Society 81

duction system) and save them. In this case, the userobserves that large delays on stations are frequentlyobserved in her production line, so reducing stationcycle time seems like a promising direction for linecycle time reduction; at the same time, jobs are cur-rently processed in small batches, so enhancing paral-lel tasking is not likely to be helpful.
After considering this information, the user clicksthe link “Reduce station cycle time” in the navigationsection, which leads to the web page as shown inFigure 4. Note that now component I shows the diag-nosis path to the current “Reduce station cycle time”node, component II shows how reducing station cycletime may be further decomposed into subordinateobjectives, and component III provides the links tothem. Again, component IV provides space for usercomments. Note that there is a link on the top right ofthe window, “Comment Summary”, that provideseasy access to all previously saved comments. If weclick it now, we will be led to the web page shown inFigure 5, which lists the comments the user savedwhile examining the previous node “Reduce cycletime”.
There are two major advantages of having a diag-nostic tree to represent and organize knowledge:
1. Like a fishbone diagram, the diagnostic tree high-lights the chain of causes. It starts with the effect andthe major groups of causes and then asks, “Why is thishappening? What is causing this?” This helps opera-tions managers structure their reasonings to find themost effective improvement strategies.
2. A tree structure nicely reflects the decomposablenature of the underlying factory physics knowledgebase. For instance, the formula for throughput calcu-lation indicates that one may increase throughput viaimproving three factors: utilization, capacity, andyield. Compared to mathematical equations, the tree ismuch more accessible to practitioners.
3.2. BenchmarksSome diagnosis nodes may include benchmarks fromindustry standards, but diagnosis nodes can also makeuse of internal benchmarks derived from mathemati-cal models. Below we provide two examples of suchbenchmarks that are part of our diagnostic tree.
Example I: A Variability Benchmark. Suppose auser has decided that improving bottleneck utilizationis attractive. (We will demonstrate how this decisionmight be reached in a case study in the next section.)Suppose also that she observed excessive blocking at
Figure 2 Excerpt of Diagnostic Tree
Hopp, Iravani, and Shou: A Diagnostic Tree for Improving Production Line Performance82 Production and Operations Management 16(1), pp. 77–92, © 2007 Production and Operations Management Society

the bottleneck station. The diagnosis node “Reducebottleneck blocking” (Figure 6) articulates the optionsthat may contribute to the objective of reducing bot-tleneck blocking, including “Reduce queueing ef-fects”, “Increase downstream capacity”. The diagnosisnodes provides information useful for determiningwhen each of these options are likely to be attractive.For example, the diagnosis node provides the fol-lowing benchmark for variability derived from theM/M/1/b queueing model:
Example II: A Repair Time Benchmark. Note thatin the previous example, there is an implicit assump-tion that variability in process times such that thestandard deviation exceeds the mean (i.e., the coeffi-cient of variability exceeds one) indicates a problem.Hence, the diagnosis process actually involves a com-bination of an external benchmark with an internal(model based) one. To further illustrate how modelscan be combined with external benchmarks to provideuseful diagnostic tests, we consider the next level be-low the objective node of “Reduce process variability”as shown in Figure 7.
Finally, note that we have framed the process as asearch for improvement options instead of a search for“the” problem. We do this because poor performancemay not be the result of a single problem. Hence,
several improvement alternatives may be appropriate,possibly in combination. Our solution-oriented treeencourages the user to think in terms of generating alist of alternatives. In contrast, a problem-oriented treecould induce a user to stop with the first cause iden-tified and thereby miss productive options. Further-more, because the objective is to generate attractivealternatives, rather than to identify a single problem,our approach will be useful even if the diagnostic treeis not exhaustively comprehensive.
4. HAL, Inc. Case StudyWe now illustrate the application of our diagnostictree to a real-life case study. The analysis of this casewas carried out prior to the development of the tree.However, as we show, the tree encapsulates the majorinsights used to solve the case. As such, it provides thecore body of knowledge needed to systematically ad-dress a complex improvement problem like that de-scribed here.
HAL, Inc. is a major manufacturer of computers andcomputer components. In one of their plants theymade printed circuit boards (PCB’s), which were usedby other plants in the company in a variety of com-puter products. The plant under consideration repre-sented an $80 million investment and had approxi-mately 450,000 square feet of manufacturing space.
The basic process ran three shifts per day (19.5
Figure 3 Sample Web Page I: Reduce Cycle Time
Figure 4 Sample Web Page II: Reduce Station Cycle Time
Hopp, Iravani, and Shou: A Diagnostic Tree for Improving Production Line PerformanceProduction and Operations Management 16(1), pp. 77–92, © 2007 Production and Operations Management Society 83

hours/day taking into account breaks, lunches, andshift changes) and involved the following major steps:
1. Treater Process: woven fiberglass cloth is impreg-nated with epoxy to make “prepreg,” the insulatorused in multi-layer printed circuit boards.
2. Lamination-Core: layers of copper and prepregare pressed together to form cores (blank panels fromwhich boards are cut). There are 8 different coreblanks, from which all of the finished boards aremade.
3. Machining: the cores are trimmed to size.4. Internal Circuitize: through a photographic ex-
posing and subsequent etching process, circuitry isproduced in the copper layers of the blanks, givingthe cores “personality” (i.e., a unique product char-acter).
5. Optical Test and Repair-Internal: the circuitry ofthe cores is scanned optically for defects, which arerepaired if not too severe.
6. Lamination-Composites: circuitized panels arepressed together into multi-layer panels.
7. External Circuitize: using the same photographic
Figure 5 Sample Web Page III: Comment Summary
Figure 6 Diagnosis Node—Reduce Bottleneck Blocking
Figure 7 Diagnosis Node—Reduce Process Variability
Hopp, Iravani, and Shou: A Diagnostic Tree for Improving Production Line Performance84 Production and Operations Management 16(1), pp. 77–92, © 2007 Production and Operations Management Society
exposing and etching process used to expose cores,circuitry is produced in the copper layers on the out-side of the laminated panels to provide additionallayers of circuitry.
8. Optical Test and Repair-External: the circuitry ofthe external layers is scanned optically for defects,which are repaired if not too severe.
9. Drilling: holes are drilled in the panels to con-nect circuitry on different planes.
10. Copper Plate: the panels are run through a cop-per plating bath, which deposits copper inside theholes, thereby connecting the circuits on differentplanes.
11. Procoat: a protective plastic coating is applied tothe panels.
12. Sizing: boards are cut from the panels to theirfinal size. In most cases, multiple boards are manufac-tured on the same panel and are cut into individualboards at the sizing step. Depending on the size of theboard, there could be as few as two boards on a panel,or as many as twenty.
13. End-of-Line-Test: an electrical test of each board’sfunctionality is performed.
4.1. Problem StatementThe stated goal of the plant was to run 3000 panels perday, five days a week, with the plant running threeshifts per day. However, this goal could only be arough one, since the different products had differentmanufacturing complexities. For instance, some prod-ucts had many holes, causing them to move throughDrilling very slowly, while others had fewer holes andthus required less time at Drilling. Therefore, the ca-pacity of the plant and possibly even the identity ofthe “bottleneck” (i.e., the process that limits produc-tion) depended on the product mix being run.
Despite these complexities, the plant manager feltthat an average throughput of 3000 panels per daywas a reasonable goal. Because actual throughput wasconsistently falling short of this level, he began callinga daily meeting of his line managers to discuss thedetails of why the target for that day was or was notmet.
One of the processes that was identified duringthese meetings as a particular problem spot was Pro-coat, which had been averaging only around 1200panels per day for the past several months. As a result,HAL had engaged a vendor to perform the coatingoperation for the panels that they were not able to coatin-house. The cost of vendoring plus shipping wasaround $15 per board, a significant cost. Moreover,because the vendor was remotely located, this vendor-ing introduced an additional two-day delay because ofshipping (up and back). Consequently, the plant man-ager was very anxious to find ways to increase thethroughput of the Procoat process.
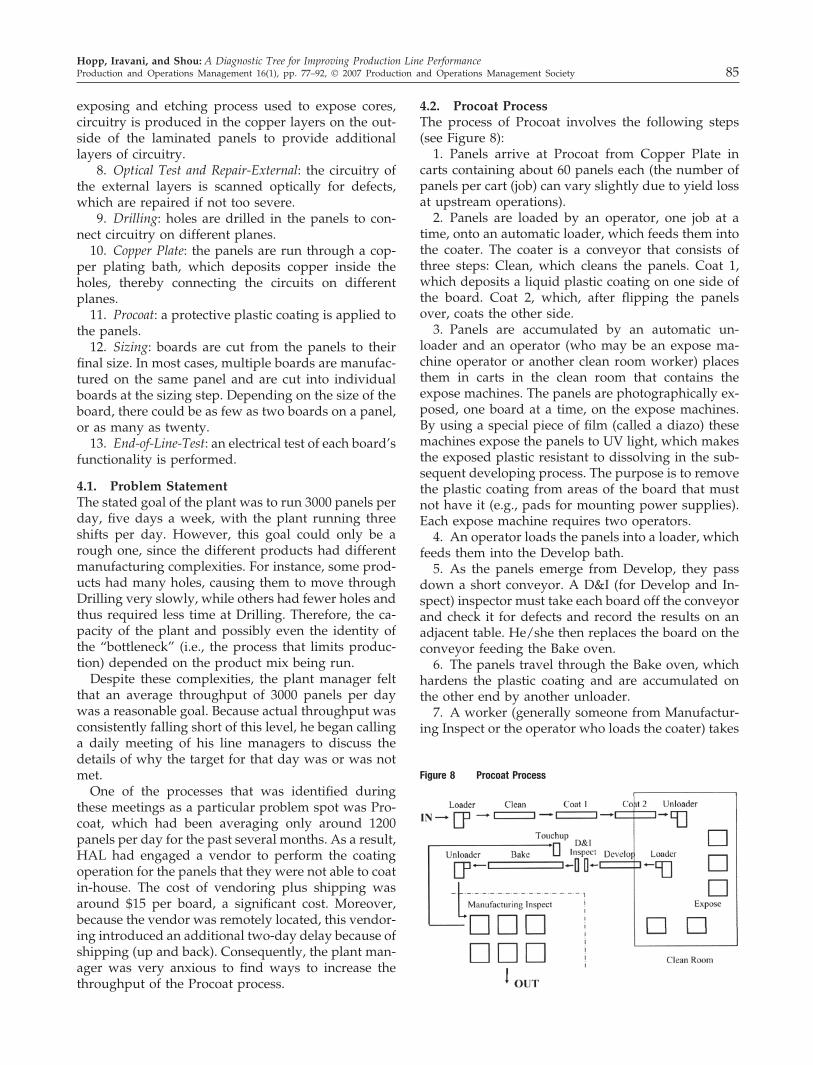
4.2. Procoat ProcessThe process of Procoat involves the following steps(see Figure 8):
1. Panels arrive at Procoat from Copper Plate incarts containing about 60 panels each (the number ofpanels per cart (job) can vary slightly due to yield lossat upstream operations).
2. Panels are loaded by an operator, one job at atime, onto an automatic loader, which feeds them intothe coater. The coater is a conveyor that consists ofthree steps: Clean, which cleans the panels. Coat 1,which deposits a liquid plastic coating on one side ofthe board. Coat 2, which, after flipping the panelsover, coats the other side.
3. Panels are accumulated by an automatic un-loader and an operator (who may be an expose ma-chine operator or another clean room worker) placesthem in carts in the clean room that contains theexpose machines. The panels are photographically ex-posed, one board at a time, on the expose machines.By using a special piece of film (called a diazo) thesemachines expose the panels to UV light, which makesthe exposed plastic resistant to dissolving in the sub-sequent developing process. The purpose is to removethe plastic coating from areas of the board that mustnot have it (e.g., pads for mounting power supplies).Each expose machine requires two operators.
4. An operator loads the panels into a loader, whichfeeds them into the Develop bath.
5. As the panels emerge from Develop, they passdown a short conveyor. A D&I (for Develop and In-spect) inspector must take each board off the conveyorand check it for defects and record the results on anadjacent table. He/she then replaces the board on theconveyor feeding the Bake oven.
6. The panels travel through the Bake oven, whichhardens the plastic coating and are accumulated onthe other end by another unloader.
7. A worker (generally someone from Manufactur-ing Inspect or the operator who loads the coater) takes
Figure 8 Procoat Process
Hopp, Iravani, and Shou: A Diagnostic Tree for Improving Production Line PerformanceProduction and Operations Management 16(1), pp. 77–92, © 2007 Production and Operations Management Society 85

the carts of panels unloaded from Bake oven andmoves them to another room containing Manufactur-ing Inspect (MI). There, inspectors check each boardwith a magnifying glass for defects in the coating.Defective panels are marked and jobs containing de-fective panels are sent to the Touchup table. Jobs withno defects are sent out of Procoat to Sizing.
8. A worker (currently the inspector between De-velop and Bake) applies additional liquid coating tothe defective panels and feeds them into the Bake ovenfor re-baking. At the end of Bake, these panels arerejoined with the others in their job and are sent out ofProcoat to Sizing.
Capacity and other data for the Procoat line aregiven in Table 1. The following parameters are basicinputs for each stage of the process: “Process or loadtime” is the average process time of a one-at-a-timeoperation and the time required to load a job on aconveyor-type operation, “Std Dev Process Time” isthe standard deviation of the process or load time,“Conveyor Trip Time” is the average time a jobspends in a conveyor-type operation, “Number of Ma-chines” is the number of (identical) machines in thestation, “MTTF” is the Mean Time to Failure, “MTTR”is the Mean Time to Repair, “Avail” is the availabilitywhich equals MTTF/(MTTF�MTTR), “Setup Time” isthe average setup time. With these, we adjust thestated rate (i.e., the inverse of the process or load time)by availability and setups to compute the “Rate”,which is the capacity of the station, and “Time”, whichis the average time spent in the station.
4.3. DiagnosisThe diagnosis node of “Improve throughput” isshown in Figure 9.
A simple capacity analysis showed that Expose wasthe bottleneck (see Table 1). Given this, the responsibleengineers were in favor of installing more Exposemachines. Unfortunately, in addition to being veryexpensive, installing more machines would requireexpanding the clean room in which the Expose pro-
cess was performed. This would add significantly tothe cost and would result in substantial productionloss during construction.
In hopes of finding an alternate (and cheaper) wayto improve Procoat throughput, management wentthrough (with a little help from two consultants) theanalysis outlined below. Although the actual processwas not quite as smooth as traversing the tree inFigure 1, we will present the actual conclusions usingthe tree as an organizing framework. Had this tree
Table 1 Procoat Data
Machinename
Process ofload time
(min)
Std devprocess
time(min)
Conveyortrip time
(min)
Numberof
machines MTTF MTTR AvailSetuptime
Rate(p/day)
Time(min)
Clean 1 0.33 0 15 1 80 4 0.95 0 3377 36.5Coat 1 0.33 0 15 1 80 4 0.95 0 3377 36.5Coat 2 0.33 0 15 1 80 4 0.95 0 3377 36.5Expose 103 67 — 5 300 10 0.97 15 2879 121.9Develop 0.33 0 2.67 1 300 3 0.99 0 3510 22.7Inspect 0.5 0.5 — 2 — — 1.00 0 4680 0.5Bake 0.33 0 100 1 300 3 0.99 0 3510 121.0MI 161 64 — 8 — — 1.00 0 3488 161.0Touchup 9 0 — 1 — — 1.00 0 7800 9.0
Figure 9 Diagnosis Node—Improve Throughput
Hopp, Iravani, and Shou: A Diagnostic Tree for Improving Production Line Performance86 Production and Operations Management 16(1), pp. 77–92, © 2007 Production and Operations Management Society

been available when the analysis was done, it wouldalmost certainly have sped things along.
Because Expose is the bottleneck, this is the firstplace to examine. The next step, as the diagnosis node“Improve throughput” suggests, is to consider thethree subordinate objectives:
• Increase bottleneck capacity• Increase bottleneck utilization• Increase post-bottleneck yield
After collecting and analyzing yield data for the Pro-coat line, it became clear that yield loss was not aproblem at Expose or the operations downstreamfrom it. Hence, the option “Increase post-bottleneckyield” can be eliminated. However, since the capacityof the Expose process is smaller than the targetthroughput of 3000 panels per day, “increasing bottle-neck capacity” is clearly an important option to con-sider. Likewise, since utilization of Expose is onlyabout 66%, “improving bottleneck utilization” mayalso offer opportunities.
By logically enumerating the mechanisms by whichbottleneck capacity can be increased, the tree offersseveral generic options as shown in Figure 10.
By considering each of the above, management wasable to systematically identify potential attractive op-portunities (as illustrated in Figure 11):
• Increase shift time: Because break plus lunch timeaccounted for about 20% of shift time (see Table2), there was some opportunity for increasingshift time by moving workers from one operationto cover the bottleneck during breaks.
• Reduce rework: The amount of rework at Exposewas very small, so there was not much room forimprovement via reducing rework.
• Install more machines: As we noted above, install-ing more machines was unattractive because: (1)the current Expose machines were not fully uti-lized (utilization of Expose process � 66%); (2)purchasing new machines or upgrading to fastermodels would be very expensive. In addition,installing another Expose machine would requireexpanding the clean room, which would add sig-nificantly to the cost and would result in substan-tial lost production during construction.
• Upgrade equipment: The only known option forimproving Expose machines was to increase thedurability of the negatives used in the exposeprocess so that the number of setups can be re-duced. We discuss this option in more detail later.
• Add operators: At the time of this analysis, therewere five Expose machines, each of which re-quired two operators to run. However, there wereonly six operators (four on third shift) on staff. Soan obvious step for increasing throughput wouldbe to fully staff the Expose machines. (Of course,management knew this; the staffing shortages
were the result of some exogenous events thathad occurred over the two months prior to theanalysis.)
• Train operators: Because the fastest Expose opera-tors achieved significantly higher output ratesthan the slowest operators, it appeared that iden-tifying and disseminating best practices throughtraining could be an attractive avenue.
• Transferring capacity: Operators at some other sta-tions (e.g., Manufacturing Inspect) were nothighly utilized. This suggested that some kind ofwork sharing could be used to shift capacity fromthese lowly utilized stations to the bottleneck.
Having examined options for increasing bottleneckcapacity, we now explore how to “increase bottleneckutilization”. The tree enumerates the factors that re-duce bottleneck utilization and offers the generic op-tions shown in Figure 12.
Considering each of these in order led to the follow-ing conclusions:
• Reduce bottleneck blocking: Expose was occasionallyblocked by downstream processes. However, the
Figure 10 Diagnosis Node—Increase Bottleneck Capacity
Hopp, Iravani, and Shou: A Diagnostic Tree for Improving Production Line PerformanceProduction and Operations Management 16(1), pp. 77–92, © 2007 Production and Operations Management Society 87

capacity analysis in Table 1 reveals that this is notdue to the capacities of the downstream processesthemselves, as the downstream capacities aregreater than the targeted throughput. Rather, it isa consequence of inadequate staffing at the D&IInspect station. Because a single operator cannotkeep up with the inspection and paperwork du-ties when Expose is running at full capacity, he/she must periodically request a halt in the loadingof the Develop process in order to catch up. Mak-ing a second D&I operator available would easilyresolve this problem.
• Reduce bottleneck starving: Expose was frequentlystarved by the Coater process. Because there isonly space for five carts of WIP in the Exposeclean room (as shown in Table 3), it is not possibleto build up a large inventory buffer with which toprotect Expose from upstream disruptions. There-fore, identifying the causes of these disruptions isimportant to reducing the frequency of starving.
• Implement pull: Because of the finite buffers in theline, the system already had one key feature of apull system, namely that it implements a WIP capthat prevents WIP from growing without bound.However, it lacked the other key feature ofpull—a mechanism for efficiently communicatingWIP voids upstream. The existing policy was to
shut down the Coater line for three hours when-ever the buffer in front of Expose became full. Butthis would allow the buffer to become nearlyempty, which meant that Expose was particularlyvulnerable to any disruption in flow. Therefore, toenable the line to achieve the efficiency of pull(i.e., the ability to produce greater throughput fora given WIP level), a tighter connection is neededbetween the front of the line and the buffer infront of Expose.
• Eliminate unnecessary stoppages during shifts: Thetwo main reasons Expose would stop producingduring a shift, other than blocking and starving,were lunches/breaks. Of course, these were con-tractually required, but how lunches/breaks were
Table 2 Expose Work Stoppages
Work stoppage Duration (min) Quantity
Break 20 2/shiftLunch 40 1/shiftShift change 10 1/shiftMeeting 90 1/week
Figure 12 Diagnosis Node—Increase Bottleneck Utilization
Figure 11 Diagnosis Process—First Steps
Hopp, Iravani, and Shou: A Diagnostic Tree for Improving Production Line Performance88 Production and Operations Management 16(1), pp. 77–92, © 2007 Production and Operations Management Society

synchronized among the various operators wasopen to discussion.
• Reduce equipment downtime: According to Table 1,the availability of Expose machines was 97%,downtime was not a significant loss of productiontime at the bottleneck, so there was little oppor-tunity for improvements in this dimension.
• Reduce setup time loss: According to Table 1, setupsaccounted for 14.6% of Expose process times. Thesesetups were technically necessary because the neg-atives used to expose the appropriate patterns onthe panels wore out after two jobs, but the time theytook was subject to the efficiency of the operatorsdoing the setup. So improvements might be possi-ble by identifying and adopting best practices.
To follow up on the options suggested by the above,we move to the next level of the tree. To keep ourpresentation concise, we will probe the options to“Reduce bottleneck starving” and “Reduce setup timeloss” in detail and will only give overviews of theoutcomes for the other options. Following the tree, thediagnosis node “Reduce bottleneck starving” is shownin Figure 13.
Considering each of these in order yields:• Reduce upstream yield loss: Data showed that there
is no significant yield loss upstream from Expose,so this is not a source of opportunity.
• Increase upstream process capacity: Since the capac-ity of the Coater process is already larger than thetarget throughput and the utilization of theCoater machines is quite low (about 34%), accord-ing to Table 1, “improve upstream process capac-ity” is not a promising option.
• Reduce queueing effects: Given that the above twoare not attractive, this is the alternative that needsexploration.
The tree expands the node for “Reduce queueingeffects” and articulates the avenues for achieving thisobjective as shown in Figure 14.
After gathering additional data it was found that theprocess variability was high at both the Expose andCoater processes. So the tree must be pursued furtherto find out why. The diagnosis node, “reduce processvariability” reads as shown in Figure 15.
Reducing setup time loss has already been determinedto be attractive, while rework has been discarded as a
Table 3 Inventory Buffers
Buffer location Capacity Jobs or panels
Before Expose 5 JobsAfter Expose 4 JobsAt D & I 40 panelsBefore MI 15 JobsBefore touchup 10 Jobs
Figure 13 Diagnosis Node—Reduce Bottleneck Starving
Figure 14 Diagnosis Node—Reduce Queueing Effects
Figure 15 Diagnosis Node—Reduce Process Variability
Hopp, Iravani, and Shou: A Diagnostic Tree for Improving Production Line PerformanceProduction and Operations Management 16(1), pp. 77–92, © 2007 Production and Operations Management Society 89

non-problem. Automation was also dismissed as overlyexpensive. Moreover, as we discussed previously, someExpose operators achieve significantly better outputthan others, so the “Standardize procedures” and “Trainoperators” options are likely to be attractive. Finally, weconsider the options of “Reduce equipment downtime”and “Improve coordination”:
• Reduce equipment downtime: Note that with Coaterprocessing time t0 � 0.33 hours and the availabil-ity A � 0.97 (see Table 1), the internal benchmark-ing 0.75t0/(1 � A)A gives 0.15 hours, which ismuch smaller than the average repair time of 4hours for the Coater machine. Hence, reducingrepair times for the Coater machine appears to bean attractive avenue to pursue.
• Improve coordination: As we noted earlier, currentpractice was to shut down the Coater line forthree hours whenever the clean room buffer be-came full. But, because this risks starvation atExpose, it is not a good policy. A much betterpolicy is to launch a new job into the Coater linewhenever space becomes available in the cleanroom buffer. This could be implemented by set-ting up a light visible by the operator in charge ofloading the Coater, which signaled availablebuffer space in the clean room.
We continue to pursue the tree to the next level toidentify options to “Reduce equipment downtime” asshown in Figure 16.
While the option to “Decrease equipment failures”would certainly help reduce the frequency of Exposestarvation, the failure frequency of the Coater line wasnot excessive compared to other equipment of compara-ble complexity. Similarly, average repair times of fourhours for the machines on the Coater line were notexcessively long given their complexity and cleaningrequirements. Data also showed that waiting time forrepair is not an issue since the machines usually receive
repair attendance immediately. Hence, managementturned to the remaining option to “Externalize repairs.”
The basic idea of externalization of repair times is todo as much of the repair while the line is up andrunning. In this case, the maintenance technicians con-firmed that a substantial part of the four hour repairtime consisted of cleaning and repairing the spraymodules once they were removed from the machines.They suggested purchasing duplicates of these mod-ules so that they could be quickly swapped out, allow-ing the failed modules to be repaired after the Coaterline had been restarted.
Now that we have examined the option of “Reduceequipment downtime” in depth, let us explore the otheroption “Reduce setup time loss” as shown in Figure 17.
Of these alternatives, the manager decided that theattractive strategies included “Improve equipment”,by developing long life negatives that would reducethe number of setups required, and “Standardizesetup procedures”, by having the most effective oper-ators train the rest in best practices.
4.4. OutcomeThe overall result of the analysis using the logic of thediagnostic tree was the following list of proposedimprovement actions, as shown in Figure 18.
1. Hire more operators to fully staff Expose ma-chines.
2. Have operators from Manufacturing Inspectcover Expose during lunch breaks for all three shifts.
3. Improve coordination between the Coater andExpose by setting up lights to signal that a job should
Figure 16 Diagnosis Node—Reduce Equipment Downtime
Figure 17 Diagnosis Node—Reduce Setup Time Loss
Hopp, Iravani, and Shou: A Diagnostic Tree for Improving Production Line Performance90 Production and Operations Management 16(1), pp. 77–92, © 2007 Production and Operations Management Society

be started on the Coater whenever there is bufferspace available in the clean room.
4. Train Expose operators in best practices (identi-fied from those of the most productive operators) inboth setups and processing steps.
5. Stock replacement modules for the Coater ma-chines to facilitate rapid repairs.
6. Develop long-lasting negatives for the Exposeprocess.
These action plans were adopted and implemented inthe plant. The outcome was extremely positive. Withinthree months, throughput of the Procoat line had in-creased by 116.7%, from an average of 1200 per day to anaverage of 2600 per day. This change, combined withsimilar steps at other key processes in the overall linetransformed the panel plant from a struggling problemspot to a showcase of efficient manufacturing practices.
5. Conclusions and Future WorkThe central thesis of this paper is that a diagnostic treeis an effective way to make the principles of opera-tions management research accessible to practitioners.As such, it has the potential to promote usage of theseprinciples more effectively than the more conven-
tional form of problem-specific mathematical models.A tree decomposes the problem of improving perfor-mance in a manufacturing line into logical steps,which both ensures comprehensive consideration ofmajor alternatives and greatly reduces the need forcomplex mathematics. Finally, by bringing togetherresults from a broad cross section of the operationsmanagement literature, a tree eliminates the poten-tially confusing problem of choosing the right modelor right result from the literature.
By applying our diagnostic tree to a real-world casestudy, we have illustrated that it is a practical andeffective tool for evaluating and improving produc-tion line performance. Of course, as this example il-lustrated, a tree does not automate the entire improve-ment process. For instance, the tree can suggestexternalizing equipment repairs as a possible optionfor certain situations, but it cannot tell the decisionmaker how to accomplish it. In order to be broadlyapplicable, a diagnostic tree must stop short of do-main-specific options. So, while a tree can help struc-ture a manager or an analyst’s thinking, the analysis isstill a very necessary part of the process.
The development of our diagnostic tree is one of the
Figure 18 Summary of the Diagnosis Process
Hopp, Iravani, and Shou: A Diagnostic Tree for Improving Production Line PerformanceProduction and Operations Management 16(1), pp. 77–92, © 2007 Production and Operations Management Society 91

first attempts to summarize scientific results for perfor-mance improvement of production lines. More workneeds to be done in order for the tree to be more com-prehensive. New results can be easily added to the tree,and as a result, the tree will grow as it is utilized.
Beyond growing this tree and developing trees forother production environments, an interesting future re-search area is the interface between a diagnostic tree anda human decision maker. Transforming the tree intro-duced in this paper into a full-featured expert system forspecific industries would require adding a mechanismwith which to compile domain-specific information andconvert it into additional decision rules for the lowerlevels of the tree. Furthermore, in order to give decisionmakers access to white papers and other data in a firm’sintranet that are relevant to the situation described bythe path through the tree, it makes sense to combine thediagnostic tree approach with search capability. We havedeveloped a prototype system that does this (see Birn-baum et al. 2005), but there remains a great deal to bedone in order to realize the full potential of a hybridtree/search expert system.
AcknowledgmentsThe authors would like to thank Thomas Tirpak of Motorolafor his guidance of this research, Kalyan Singhal, the Editor-in-Chief, for his help and encouragement, and NationalScience Foundation for support under Grant DMI-00114598.
ReferencesAnderson, J. 1995. An introduction to neural networks. MIT Press,
Cambridge, Massachusetts.Anupindi, R., S. Chopra, S. D. Deshmukh, J. A. Van Mieghem, E.
Zemel. 1999. Managing business process flows. Prentice Hall,Englewood Cliffs, New Jersey.
Askin, R. G., C. R. Standridge. January 4, 1993. Modeling and analysisof manufacturing systems, 1st ed. Wiley Text Books, New York,New York.
Badiru, A. B., A. Arif. 1996. FLEXPERT: Facility layout expert sys-tem using fuzzy linguistic relationship codes. IIE Transations 28295–308.
Birnbaum, L., W. J. Hopp, S. M. R. Iravani, K. Livingston, B. Shou,T. Tirpak. 2005. Task aware information access for diagnosis ofmanufacturing problems. Proceedings of International Conferenceon Intelligent User Interfaces.
Buchanan B.G. and E.H. Shortliffe, 1984. “Rule-Based Expert Sys-tems: The MYCIN Experiments of the Stanford Heuristic Pro-gramming Project”, Addison-Wesley, Boston, MA.
Buzacott, J. A., J. G. Shanthikumar. 1993. Stochastic models of manu-facturing systems. Prentice Hall, Englewood Cliffs, New Jersey.
Davidson, B., U. Roy, C. Ludden. 1993. An expert system for thedesign and analysis of composite structures. IIE Transactions 31303–312.
Drucker, P. F., D. Garvin, L. Dorothy, S. Susan, J. S. Brown. 1998.Harvard business review on knowledge management. Harvard Busi-ness School Press, Cambridge, Massachusetts.
Dunnigan, J. F. 2004. The operations research revolution rolls on, towhere? emphDSSResources.COM.
Ferdows, K. 2006. Transfer of changing production know-how. Pro-duction and Operations Management 15(1) 1–9.
Heizer, J., B. Render. 2003. Principles of operations management, 5th ed.Prentice Hall, Englewood Cliffs, New Jersey.
Hopp, W. J., M. Spearman. April 4, 2000. Factory physics, 2nd ed.McGraw-Hill/Irwin, Boston, Massachusetts.
Horner, P. October 2002. History in the making; INFORMS cele-brates 50 years of problems, solutions, anecdotes and achieve-ment. OR/MS Today.
Horvitz, E. 2005. Editorial: Graph-based representations for decisionanalysis. Decision Analysis 2.
Howard, R. A., J. E. Matheson. 2005. Influence diagrams. DecisionAnalysis 2 127–143.
Ishikawa, K. (Lu, D. J. trans.). 1985. What is total quality control?: TheJapanese way. Prentice-Hall Inc., Englewood Cliffs, New Jersey.
Jackson, P. 1990. Introduction to expert systems. Addison WesleyLongman, Harlow, England.
Jungthirapanich, C., C. O. Benjamin. 1995. A knowledge-based de-cision support system for locating a manufacturing facility. IIETransactions 27 789–799.
Keeney, R. L. 1992. Value-focused thinking: A path to creative decision-making. Harvard University Press, Boston, Massachusetts.
Khoshnevis, B., D. N. Sormaz, J. Y. Park. July 1999. An integratedprocess planning system using feature reasoning and spacesearch. IIE Transactions 31(7) 597–616.
Lin, C. M., T. K. Chu, T. P. Chang. 1996. Cement roller mill controlby fuzzy logic controller. Journal of Control Systems and Technol-ogy 4 133–138.
Lin, Z.-C., Q. Y. Liu. 2000. A knowledge acquisition model forselecting coordinate measuring machines using inductive lear-ing. IIE Transactions 32 573–583.
Maus, R., J. Keyes. 1991. Handbook of expert systems in manufacturing.McGraw-Hill/Irwin, Boston, Massachusetts.
Olmstadt, W. 2000. Cataloging expert systems: Optimism and frus-trated reality. Journal of Southern Academic and Special Librarian-ship 01.
Ozbayrak, M., R. Bell. 2003. A knowledge-based decision supportsystem for the management of parts and tools in FMS. DecisionSupport Systems 35 487C–515.
Pande, P. S., R. P. Neuman, R. R. Cavanagh. December 14, 2001. Thesix sigma way team fieldbook: An implementation guide for processimprovement teams, 1st ed. McGraw-Hill, New York, New York.
Patterson, D. W. 1990. Introduction to artificial intelligence & expertsystems. Prentice Hall, Englewood Cliffs, New Jersey.
Perez, R. A., S. W. Koh. 1993. Integrating expert systems with arelational database in semiconductor manufacturing. IEEETransactions on Semiconductor Manufacturing 6 199–206.
Qiu, S., A. M. Agogino, S. Song, J. Wu, S. Sitarama. 2001. A fusionof bayesian and fuzzy analysis for print faults diagnosis. Work-ing paper, Department of Mechanical Engineering, Universityof California, Berkeley, California.
Russell, S., P. Norvig. 2003. Artificial intelligence: a modern approach.Prentice Hall, Englewood Cliffs, New Jersey.
Simon, H. 1977. The new science of management decision. Prentice Hall,Englewood Cliffs, New Jersey.
Suri, R. 1998. Quick response manufacturing: A companywide approachto reducing lead times. Productivity Press, Portland, Oregon.
Turban, E., J. Aronson. 1998. Decision support systems and intelligentsystems. Prentice Hall, Englewood Cliffs, New Jersey.
VerDuin, W. February 1995. Knowledge-based systems for manu-facturing. Intelligent Manufacturing 1(2).
Von Krogh, G., K. Ichijo, I. Nonaka. 2000. Enabling knowledge cre-ation: How to unlock the mystery of tacit knowledge and release thepower of innovation. Oxford University Press, New York, NewYork.
Yi, L., Q. C. Tie. 1998. A fuzzy diagnostic model and its application inautomotive engineering diagnosis. Applied Intelligence 9 231–243.
Hopp, Iravani, and Shou: A Diagnostic Tree for Improving Production Line Performance92 Production and Operations Management 16(1), pp. 77–92, © 2007 Production and Operations Management Society