a dissertation presented in partial fulfillment liberty
TRANSCRIPT
PREDICTING DISSERTATION METHODOLOGY CHOICE AMONG DOCTORAL
CANDIDATES AT A FAITH-BASED UNIVERSITY
by
Rebecca Lunde
Liberty University
A Dissertation Presented in Partial Fulfillment
Of the Requirements for the Degree
Doctor of Education
Liberty University
2017

2
PREDICTING DISSERTATION METHODOLOGY CHOICE AMONG DOCTORAL
CANDIDATES AT A FAITH-BASED UNIVERSITY
by Rebecca Lunde
A Dissertation Presented in Partial Fulfillment
Of the Requirements for the degree
Doctor of Education
Liberty University, Lynchburg, VA
2017
APPROVED BY:
Kurt Y. Michael, Ph.D., Committee Chair
Scott B. Watson, Ph.D., Committee Member
Kelly Paynter, Ed.D., Committee Member
3
ABSTRACT
Limited research has investigated dissertation methodology choice and the factors that contribute
to this choice. Quantitative research is based in mathematics and scientific positivism, and
qualitative research is based in constructivism. These underlying philosophical differences posit
the question if certain factors predict dissertation methodology choice. Using the theoretical
framework of intersectionality and the multi-dimensional identity development model, this
predictive, correlational study used archival data to determine if biological sex, ethnicity, age, or
religious affiliation predicts dissertation methodology choice. A logistics regression analysis
was used to review 398 doctoral dissertations and determine if any of the criterion variables
predicted dissertation methodology choice. After analysis, it was determined that none of the
criterion variables of biological sex, ethnicity, age, and religious affiliation was statistically
significant in predicting dissertation methodology choice.
Keywords: doctoral dissertation, research methodology, quantitative research, qualitative
research

4
Dedication
This dissertation is dedicated to my children, Levi, Ezra, and Selah. You three are the
greatest joys in my life, and I want you to know that you can do anything and be anything with
God by your side. “The Lord is my light and my salvation – whom shall I fear?” Psalm 27:1

5
Acknowledgements
I first want to thank my Lord and Savior, Jesus Christ. Thank you, Jesus, for giving me
the strength to keep going when there was really no strength left in me, and thank you for giving
me the opportunity to be able to complete this degree.
Thank you to my husband, Dan, for supporting me in all of my degrees and encouraging
me not to stop. Thank you to my three babies. Levi, I started this degree when you were three
weeks old, and thank you for putting up with my divided attention between you and all my
studying and writing. Ezra, thank you for being so sweet and always being by my side watching
me work. Selah, thank you for being such a sweet girl and allowing me to start this dissertation
the month after you came home from China. Your strength has always encouraged me.
Thank you to my parents and my grandma who always have believed in me, and thank
you for all of the babysitting when I needed time to write. Growing up watching how hard you
all work has made me into the person I am today. Thank you to my grandfather, even though you
aren’t with us anymore; the things you did with your life even with the tough hand you were
dealt has always been my inspiration.
Thank you to Grandpop; even though you’re my grandpop by marriage, you’ve always
been a grandfather to me. You’ve always been one of my biggest cheerleaders in this
dissertation, and I am so thankful for you.
Thank you to my chair, Dr. Michael; without you I wouldn’t have finished this. You have
been my biggest supporter, and I will always be thankful for the mentorship, the encouragement,
and all of the help you have given me.
Thank you to Dr. Watson; you have been an amazing support for so many years. I am so
thankful for everything that you have done for me. You have taught me so much, and it has been

6
a joy working with you and learning from you. Thank you for taking a chance on me eight years
ago; it has changed my life.
Finally, thank you to Dr. Paynter for jumping in as a committee member to a very fast
dissertation study. You have given me great feedback and have been so helpful.
7
Table of Contents
ABSTRACT .................................................................................................................................... 3
Dedication ....................................................................................................................................... 4
Acknowledgements ......................................................................................................................... 5
List of Tables ................................................................................................................................ 10
List of Abbreviations .................................................................................................................... 11
CHAPTER ONE: INTRODUCTION ........................................................................................... 12
Overview ................................................................................................................................... 12
Background ............................................................................................................................... 12
Problem Statement .................................................................................................................... 16
Purpose Statement ..................................................................................................................... 17
Significance of the Study .......................................................................................................... 18
Research Question .................................................................................................................... 19
Definitions................................................................................................................................. 19
CHAPTER TWO: LITERATURE REVIEW ............................................................................... 22
Overview ................................................................................................................................... 22
Theoretical Framework ............................................................................................................. 22
Intersectionality..................................................................................................................... 22
Multidimensional Identity Model ......................................................................................... 24
Related Research ....................................................................................................................... 27
Dissertation Methodologies .................................................................................................. 27
Sex and Methodologies ......................................................................................................... 30
Ethnicity and Methodologies ................................................................................................ 43
8
Age and Methodologies ........................................................................................................ 47
Religion and Methodologies ................................................................................................. 49
Summary ................................................................................................................................... 51
CHAPTER THREE: METHODS ................................................................................................. 53
Overview ................................................................................................................................... 53
Design ....................................................................................................................................... 53
Research Question .................................................................................................................... 54
Null Hypothesis ........................................................................................................................ 54
Participants and Setting............................................................................................................. 54
Quantitative Sample .............................................................................................................. 57
Qualitative Sample ................................................................................................................ 57
Instrumentation ......................................................................................................................... 58
Banner INB ........................................................................................................................... 58
Digital Commons .................................................................................................................. 59
Procedures ................................................................................................................................. 59
Data Analysis ............................................................................................................................ 62
Predictor Variables................................................................................................................ 62
Criterion Variable ................................................................................................................. 63
Summary ................................................................................................................................... 64
CHAPTER FOUR: FINDINGS .................................................................................................... 66
Overview ................................................................................................................................... 66
Research Question .................................................................................................................... 66
Null Hypothesis ........................................................................................................................ 66
9
Descriptive Statistics ................................................................................................................. 66
Results ....................................................................................................................................... 68
Data Screening ...................................................................................................................... 68
Assumptions .......................................................................................................................... 69
Results for Null Hypothesis .................................................................................................. 70
Summary ................................................................................................................................... 73
CHAPTER FIVE: CONCLUSIONS ............................................................................................ 75
Overview ................................................................................................................................... 75
Discussion ................................................................................................................................. 75
Biological Sex and Methodology Choice ............................................................................. 76
Ethnicity and Methodology Choice ...................................................................................... 77
Age and Methodology Choice .............................................................................................. 78
Religion and Methodology Choice ....................................................................................... 78
Overrepresentation of Females ............................................................................................. 79
Rise of Qualitative Research ................................................................................................. 81
Implications............................................................................................................................... 81
Limitations ................................................................................................................................ 83
Recommendations for Future Research .................................................................................... 83
Summary ................................................................................................................................... 84
REFERENCES ............................................................................................................................. 86
Appendix A: IRB Approval ........................................................................................................ 104
Appendix B: Variable Codes ...................................................................................................... 105

10
List of Tables
Table 1: Frequencies for Predictor Variables for Dissertation Methodology………………...….68
Table 2: Logistic Regression Model Analysis…………………………………………………...71
Table 3: Summary of Logistic Regression Analysis Predicting Dissertation Methodology…….73
Table 4: SPSS Variable Codes…………………………………………………………..…..….105

11
List of Abbreviations
Banner INB (Internet Native Banner)
Doctor of Education (EdD)
Institutional Review Board (IRB)
National Postsecondary Student Aid Study (NPSAS)
12
CHAPTER ONE: INTRODUCTION
Overview
There are only a few studies that examine dissertation methodology choice, and the ones
that do indicate that various factors influence the choice of methodology (Buchanan & Bryman,
2007; Plowman & Smith, 2011). The purpose of this study was to examine some of these factors
and determine which ones could influence dissertation methodology choice. Chapter One will
discuss the background related to dissertation methodology choice of doctoral candidates based
on their biological sex, ethnicity, age, and religious affiliation. The problem statement will be
discussed, including recommended research from previous studies. The purpose of this study
will be discussed, as well as the significance of the current study. Finally, the research questions
will be introduced, and definitions pertinent to this study will be given.
Background
The dissertation is a consistent capstone product among doctoral programs in many
disciplines (Boote & Beile, 2005), with two main methodological choices: quantitative and
qualitative. These two methodologies are fundamentally different, and there is little research that
discusses the differences between the two and the variables that affect the choice between them.
The fundamental differences between these two methodologies stem from the core of their
philosophical assumptions (Guba, 1990). Quantitative research is based in positivism and
focuses on empirical observation and scientific study (Sale, Lohfeld, & Brazil, 2002). In
quantitative research, the researcher studies a phenomenon objectively, sample sizes are larger
than in qualitative studies, and structured protocols and randomization are emphasized (Sale et
al., 2002). In contrast, qualitative research is structured differently both in methodology and in
philosophical assumptions. Qualitative research is based in interpretivism and constructivism,

13
which is much different than positivism. Qualitative researchers have a goal of relying on
participants’ views, meanings, and experiences (Creswell, 2013). In a constructivist paradigm, it
is believed that “multiple realities are constructed through our lived experiences and interactions
with others” (Creswell, 2013, p. 36). Qualitative research methods involve in-depth interviews,
focus groups, observations, and document reviews with a much smaller sample size than that of
quantitative research. Quantitative research, based in the positivist paradigm, is based on
empirical studies and is common in hard science fields while qualitative research, centered in the
constructivism paradigm, is more commonly used in the social sciences (Sale et al., 2002).
Though quantitative research has been a more traditionally used methodology, qualitative
research has risen in popularity.
The number of qualitative studies has risen dramatically in the past 30 years (Rone,
1998). In addition, more females are graduating with doctoral degrees than ever (U.S.
Department of Education, National Center for Education Statistics, 2015; Nelson & Coorough,
1994). Qualitative research embodies more traditionally feminine characteristics in its research
and analysis methods, such as interpersonal relationships (Creswell, 2013; Lincoln & Guba,
1985). Thus, one could surmise that qualitative research has increased in part because of the
higher percentages of women completing doctoral degrees. Quantitative research, in contrast,
embodies more mathematical and traditional, scientific experimental research (Sale et al., 2002).
Research has indicated that women have higher levels of mathematics anxiety and pursue
advanced degrees in mathematical fields at a much lower percentage than men (Cheryan, 2012;
Nelson & Brammer, 2008).
Research has also indicated that both ethnicity and age has an impact on math anxiety,
science and math attitudes, and math performance (Bell, 2003; Bui & Alfaro, 2011; Lockhead,
14
Thorpe, Brooks-Gunn, Casserly, & McAloon 1985; Onwuegbuzie & Wilson, 2003; Upadyaya &
Eccles, 2014; Wilson & Milson, 1993). Students of ethnic minority groups experience
stereotype threat in regards to mathematics and science, and studies have shown that individuals
in these groups are hesitant to go into mathematics and science areas of study for fear of
reinforcing these stereotypes (Aronson, Friend, & Good, 2002; Shelton & Richeson, 2005).
Research has indicated that mathematics anxiety increases with age, attitudes toward
mathematics and science decrease with age, and age is the most significant predictor of attrition
in undergraduate and graduate programs (Bean & Metzner, 1985; Bell, 2003; Bui & Alfaro,
2011; Jones & Watson, 1990; Lockhead et al., 1985; Onwuegbuzie & Wilson, 2003; Upadyaya
& Eccles, 2014; Wilson & Milson, 1993). Age is also a defining factor in the determination of a
student as traditional or non-traditional (U.S. Department of Education, National Center for
Education Statistics, 2016a). Because research indicates that older, non-traditional students may
face higher mathematics anxiety and lower performance in mathematics and science, it is
important to understand their dissertation methodology choice.
To complicate the issue of methodology choice, the salience of religious affiliation may
also influence the choice of dissertation methodology. For people of religious faith, embracing
modern science in its entirety can be difficult. Cho (2012) described the difficulties of clashing
worldviews. Scientific inquiry is based in positivism, which is the claim that empirical
observations are considered true, which is in contrast to the theistic metaphysical beliefs of those
of religious faith. Science, and more specifically, positivism, rejects any metaphysical
conclusions that anything other than what can be seen exists. This rejects the existence of a
superior being and directly contradicts the worldview of those with religious faith. Researchers
have found that there is a negative correlation between attitudes toward science and attitudes

15
toward religion (Astley & Francis, 2010), and in a study conducted by Francis and Greer (1999),
it was found that 62% of students agreed that there is a fundamental conflict between scientific
and religious claims. As discussed previously, quantitative methodologies are based in
positivism and scientific study (Creswell, 2013; Sale et al., 2002). Keele (2012) described
quantitative research as based in “hard science.” These philosophical differences between
science, and thus, quantitative research methods and religious faith, could cause people of
religious affiliation to reject quantitative research methods in favor of qualitative methods that
encompass a more subjective analysis to embrace their differences in perspective and
philosophy. These philosophical differences may influence an individual’s choice in
methodology, and the theory of intersectionality supports this because of the variety of factors
that influence and interact together to form one’s identity (Davis, 2008). The concept of
intersectionality, which is drawn from critical theory, specifically considers the interactions of
categories of differences in individual lives. This can include sex, ethnicity, and other categories
of difference, which, for the purpose of this study, also includes religion and age (Davis, 2008).
In summary, there are fundamental differences in qualitative and quantitative research
methodologies. Because of the positivist worldview foundation and the mathematical and
scientific approach of quantitative research and the relational, constructivist approach of
qualitative research, researchers that choose one methodology over another could have
similarities. Research has indicated that women are more relational, have higher mathematics
anxiety, and pursue scientific and mathematical careers less than their male counterparts
(Cheryan, 2012; Nelson & Brammer, 2008). Research has also shown that there are differences
between ethnic groups in mathematics performance and attitudes and that statistics anxiety is
higher in non-traditional, older students (Bean & Metzner, 1985; Bell, 2003; Bui & Alfaro, 2011;

16
Jones & Watson, 1990; Lockhead et al., 1985; Onwuegbuzie & Wilson, 2003; Upadyaya and
Eccles, 2014; Wilson & Milson, 1993). Finally, individuals who have a religious affiliation have
a fundamental difference in worldview from the positivist worldview held by most of the
scientific community (Astley & Francis, 2010; Sale et al., 2010). These variables, biological sex,
ethnicity, age, and religious affiliation, should be examined for how they correlate with
dissertation methodology type.
Problem Statement
There is very little research regarding the choice between a quantitative or qualitative
research methodology. In each methodology, which is rooted in differing philosophical
assumptions and involves very different data collection methods and analysis procedures, it is
unknown through current research if there are predictors for those who choose to pursue each
methodology (Creswell, 2013; Sale et al., 2002). Feminist research has indicated that the
positivist assumptions in quantitative research do not align with the female identity (Stanley &
Wise, 1983), and other research has indicated that women have higher levels of mathematics
anxiety, which could indicate that women are more likely to choose qualitative research
(Cheryan, 2012; Nelson & Brammer, 2008). Individuals of African American or Hispanic
ethnicities may also be more likely to choose qualitative research, because various studies have
shown a higher level of mathematics anxiety and lower levels of mathematics performance (Bell,
2003; Bui & Alfaro, 2011; Lockhead et al., 1985; Onwuegbuzie & Wilson, 2003; Upadyaya and
Eccles, 2014; Wilson & Milson, 1993). Non-traditional students, or students older than the
average graduate student, also may chose the qualitative methodology more often based on their
statistics anxiety and attitudes towards mathematics and science (Bean & Metzner, 1985; Bell,
2003; Bui & Alfaro, 2011; Jones & Watson, 1990; Lockhead et al., 1985; Onwuegbuzie &
17
Wilson, 2003; Upadyaya and Eccles, 2014; Wilson & Milson, 1993), and there are worldview
conflicts between research based in positivism and a religious affiliation (Astley & Francis,
2010; Greer, 1990; Sale et al., 2002). According to Plowman and Smith (2011), there is not
enough literature regarding dissertation methodology choice between men and women and other
groups and why individuals pursue one type of research over the other. The current research
sought to add to the body of research and determined if there were differences between the
choice of dissertation methodology among men and women as well as the role that ethnicity, age,
and religious affiliation played on a doctoral candidate’s methodology choice (Borders, Wester,
Fickling, & Adamson, 2015; Goodrich, Shin, & Smith, 2011; Plowman & Smith, 2011). The
problem is that there are few or no studies that examine the relationship between dissertation
methodology choice within the context of biological sex, ethnicity, age, and religious affiliation.
Purpose Statement
The purpose of this archival, predictive correlational study is to examine the effect of
biological sex, ethnicity, age, and religious affiliation on dissertation methodology choice among
doctoral candidates in the School of Education at a faith-based university. The criterion variable
is dissertation methodology (quantitative or qualitative). Dissertation methodology is defined as
the philosophical underpinnings of a chosen research method, referred to as qualitative or
quantitative (Creswell, 2013). Quantitative research is defined as a systematic and objective
method of research that utilizes numerical data to describe variables, observe relationships
among variables, or determine cause and effect relationships between variables (Burns & Grove,
2005), and qualitative research is defined as using an interpretive approach to study phenomena
in their natural settings and “attempting to make sense of, or interpret phenomena in terms of the
meanings people bring to them” (Denzin & Lincoln, 1994, p. 2).
18
The predictor variables are the candidate’s biological sex (male or female), ethnicity, age,
and religious affiliation. Biological sex is defined as male or female (American Psychological
Association, 2011) as self-reported on each candidate’s university records. Ethnicity is defined
as “the social group a person belongs to, and either identifies with or is identified with by others,
as a result of a mix of cultural and other factors including language, diet, religion, ancestry, and
physical features traditionally associated with race” (Bhopal, 2004, p. 443). Age is defined as the
age of the candidate in years old at the time of the dissertation defense. Religious affiliation is
defined as “an organized system of practices and beliefs in which people engage” (Mohr, 2006,
p. 174). A candidate’s religious affiliation will be measured through their self-reported religious
affiliation in their application to the university.
Significance of the Study
This study is significant to the topic of dissertation methodology choice in relation to sex,
ethnicity, age, and religious affiliation. There are few, if any, studies that focus on dissertation
methodology choice in the context of gender and religious affiliation, and there is a need for
research that focuses on the intersecting nature of identity and the effect on the identity of
women (Jones, 1997). Not only will this study provide insight into dissertation methodology
choice for both men and women, but it can also deepen the understanding of ethnicity, age, and
religious affiliation in the math and science fields.
This study is significant to the population of doctoral candidates and specifically, Doctor
of Education (EdD) candidates in faith-based universities. As the number of qualitative
dissertation methodologies have continued to increase since 1980 (Randolph et al., 2010), the
understanding of student methodology choice is more relevant to universities. This study will
provide insight into biological sex differences among dissertation methodology choice as well as
19
any differences in dissertation methodology choice among those of various ethnicities, traditional
and non-traditional-aged students, and students of religious affiliation. Furthermore, because this
study will be conducted at a religious institution, this study may also add to the body of
knowledge regarding individuals of religious affiliation who may be hesitant to participate in
science (Cho, 2012; Michael, 2015). Flynn, Chasek, Harper, Murphy, and Jorgensen (2012)
described the importance of the dissertation process in doctoral programs, noting that it is “an
invaluable evaluative tool that encourages students to become active and self-directed in their
learning, allowing for new insights into a field” (p. 242), but they also noted the high attrition
rates and difficulties students have completing this hurdle. Given the importance of the
dissertation in most doctoral programs, the relatively few studies about the dissertation is
problematic. This study will add to the body of research regarding dissertation methodologies,
and it will provide universities with better understanding of how to support students, especially
females, those in an ethnic minority group, non-traditional aged students, and students of
religious affiliation to choose a methodology best suited for the nature of their research problem
and their goals rather than stereotypes and perception of research design masculinity or
femininity (Plowman & Smith, 2011).
Research Question
RQ1: To what extent can the biological sex, ethnicity, age, and religious affiliation of a
doctoral candidate attending a faith-based university predict the choice of dissertation method
(quantitative or qualitative)?
Definitions
1. Candidate – A doctoral candidate is a student in a doctoral program who has completed
all of the requirements for the doctoral degree except the dissertation. Usually, the
20
student becomes a doctoral candidate after he or she has completed all of the coursework
required for the program and has passed the comprehensive exam (Kuther, n.d.).
2. Dissertation methodology – Dissertation methodology is defined as the philosophical
underpinnings of a chosen research method, referred to as qualitative, quantitative, or
mixed methods research (Creswell, 2013).
3. Ethnicity - Ethnicity is defined as “the social group a person belongs to, and either
identifies with or is identified with by others, as a result of a mix of cultural and other
factors including language, diet, religion, ancestry, and physical features traditionally
associated with race” (Bhopal, 2004, p. 443).
4. Ethnic minority group – Ethnic minority group refers to the non-white population
(Bhopal, 2004).
5. Non-traditional student – A non-traditional student is characterized by various factors,
but most often age is the defining characteristic for this population of students; a student
who is above the average age for the degree program (U.S. Department of Education,
National Center for Education Statistics, 2016a).
6. Quantitative research – Quantitative research is a systematic and objective method of
research that utilizes numerical data to describe variables, observe relationships among
variables, or determine cause and effect relationships between variables (Burns & Grove,
2005).
7. Qualitative research – Qualitative research is “multimethod in its focus, involving an
interpretive, naturalistic approach to its subject matter…qualitative researchers study
things in their natural settings, attempting to make sense of, or interpret phenomena in
terms of the meanings people bring to them” (Denzin & Lincoln, 1994, p. 2).
21
8. Religious affiliation – Religious affiliation is “an organized system of practices and
beliefs in which people engage … a platform for the expression of spirituality” (Mohr
2006, p. 174).
9. Sex – Sex refers to “a person’s biological status and is typically categorized as male,
female, or intersex” (American Psychological Association, 2011, para 1).
10. Stereotype – A stereotype is defined as "beliefs about the characteristics, attributes, and
behaviors of members of certain groups" (Hilton & Von Hippel, 1996, p. 240)
22
CHAPTER TWO: LITERATURE REVIEW
Overview
Chapter Two will discuss the theoretical framework for this study and the related
research. Quantitative and qualitative methodologies will be overviewed, including the data
collection and analysis methods and the philosophical underpinnings of each. Research related
to biological sex, ethnicity, age, and religious affiliation will be discussed in the context of
mathematics anxiety, attitudes, and performance. Stereotypes that inhibit the pursuance of
mathematics and scientific careers and college majors will also be examined.
Theoretical Framework
The theoretical framework guiding this study comes from two different theories:
Crenshaw’s (1989) intersectionality theory and Jones and McEwen’s (2000) multidimensional
identity model.
Intersectionality
The concept of intersectionality, which is drawn from critical theory, specifically
considers the interactions of categories of differences in individual lives. This can include,
gender, race, and other categories of difference, which, for the purpose of this study, includes
religion (Davis, 2008). Crenshaw (1989) was the first to define intersectionality and apply it to
dimensions of identity that are more than the sum of each part. Crenshaw (1989) specifically
studied African American women and stated, “because the intersectional experience is greater
than the sum of racism and sexism, any analysis that does not take intersectionality into account
cannot sufficiently address the particular manner in which Black women are subordinated” (p.
140). Identities are formed in relation to one another, and the process of merging various
identities is transformative. This merge produces an entirely new sense of self; it is not just an
23
intersection of identities. Shields (2008) defined intersectionality as “social identities which
serve as organizing features of social relations, mutually constitute, reinforce, and naturalize one
another” (p. 302). Similarly, Collins (1998) defined intersectionality as “rather than examining
gender, race, class, and nation as distinctive social hierarchies, intersectionality examines how
they mutually construct one another” (p. 62). Dimensions of identity, such as gender, religion,
and race are not independent additions that add up to an identity, but they are interdependent on
each other (Bowleg, 2008; Warner, 2008).
The concept of intersectionality is the framework for identity studies that focus on
multiple dimensions of identity. This framework differs from the traditional view of identity,
such as Erikson’s original identity theory (Erikson, 1968), in that aspects of identities are
experienced simultaneously rather than hierarchically (McCann & Kim, 2002). The focus of
these aspects of identity is how they interconnect rather than just their similarities and
differences (McCann & Kim, 2002). The framework of intersectionality is based in social
constructivism, which maintains that aspects of identity are constructed from aspects of social,
historical, political, and cultural factors (Omi & Winant, 1994). Intersectionality supports a
social identity, or an identity that is formed through social interactions and cultural factors
(Shields, 2008). Multiple dimensions of identity, such as gender, race, religion, socioeconomic
status, and nationality are complex social processes that intersect with each other rather than
exist independently (Bowleg, 2008). Ken (2008) described intersectionality using a metaphor of
baking. Dimensions of identity, such as race, religion, and gender, are like ingredients to make
cookies, like sugar, flour, butter, and eggs. First, one must mix them together to make dough and
then cook them. In the final product, the cookie, one cannot tell each ingredient apart in the
cookie. Similarly, each dimension of identity is dynamic and has an interdependence on each
24
other. Bowleg (2008) emphasized that Identity ABC ≠ Identity A + Identity B + Identity C.
Rather, these dimensions are interactive and could produce many combinations (Arifeen &
Gatrell, 2013). Intersectionality is a framework often used in research when analyzing identity
and differences, especially regarding race, class, and gender (Wadsworth, 2011). This
intersectionality approach, in the context of this study, will provide the framework for examining
the predictor variables of sex, ethnicity, age, and religious affiliation. As Cole (2009) discussed,
each of these dimensions of identity (such as sex, ethnicity, age, and religious affiliation) are not
separate and independent, but yet each is contingent on the experience and meaning of each of
the others. Because this study involves the examining of ethnicity and gender, along with age
and religion, intersectionality is an appropriate framework (Cole, 2009, Else-Quest, Mineo, &
Higgins, 2013).
Within the intersectionality framework, Acker (1990) developed the theory of gendered
organizations. Ackers defined a gendered organization or analytic unit as one that “advantage
and disadvantage, exploitation and control, action and emotion, meaning and identity, are
patterned through and in terms of a distinction between male and female, masculine and
feminine” (p. 146). Basically, Acker (1990) postulated that organizations are built upon
assumptions about gender, and thus, they produce gender inequalities. In the theory of gendered
organizations, Acker (2006) determined that the most prominent dimensions of identity along
with gender are race and class. In relation to this study, research has indicated that religious
organizations are largely gendered as masculine (Adams, 2007; Manville, 1997).
Multidimensional Identity Model
According to feminist theory, gender shapes the human consciousness (Creswell, 2013).
Jones and McEwen (2000) posited that most developmental models and research of identity only
25
addressed single dimensions of identity. The concept of intersectionality specifically considers
the interactions of categories of differences in individual lives. This can include gender, race,
and other categories of difference, which, for the purpose of this study, also includes age and
religious affiliation of doctoral students (Davis, 2008). According to feminist theory, gender
shapes the human consciousness (Creswell, 2013). Reynolds and Pope (1991) related gender in
terms of identity in their multidimensional identity model. Identities are formed in relation to
one another, and the process of merging various identities is transformative. This merge
produces an entirely new sense of self; it is not just an intersection of identities.
Jones and McEwen (2000) proposed a model of multiple identities through a grounded
theory study examining the complexity of identity and the identity development of multiple
dimensions of identity. Through this research, they developed a conceptual model of multiple
dimensions of identity. The basis for their research is in the theoretical discussions of Deaux
(1976), who conceptually determined that identity is both defined internally by self and
externally by others at the same time. The model that Jones and McEwen (2000) developed was
the first model to suggest a process in which multiple identities are “developed and negotiated”
(p. 406). In their research, Jones and McEwen (2000) found that there is one core category in the
center of one’s identity that is considered the core sense of self, or the inner identity, that also has
multiple intersecting dimensions. The core sense of self is an “inside identity” (Jones &
McEwen, 2000, p. 408) that is not as susceptible to outside influences as other aspects of
identity, and it is difficult to label for each individual. Labels lack complexity and personal
relevancy and cannot fully describe one’s inner sense of self. The multiple dimensions that
surround the inner core are externally defined dimensions, such as gender, race, culture, age, and
religion. These dimensions have varying degrees of salience between individuals. For example,
26
Jones and McEwen (2000) found that race is not very salient for white women, but it is very
salient for black women. All of these dimensions of identity intersect with the core and other
dimensions in one’s identity, thus illustrating the concept of intersectionality. It is important to
note the influences of “sociocultural conditions, family background, and current experiences”
(Jones & McEwen, 2000, p. 410) in determining the salience of individual dimensions of
identity. Additionally, Jones and McEwen (2000) found that for many dimensions of identity,
such as gender, “the description of what being female meant to them was quickly connected with
other dimensions (e.g., Jewish woman, black woman, lesbian, Indian woman)” (p. 410). This
further demonstrates the intersectionality of multiple dimensions of identity and the
establishment of identity as a fluid, complex process.
Jones and McEwen (2000) developed the model of multiple dimensions of identity to
conceptualize the intersecting circles of identity that surround the core sense of self. This model
demonstrates that “no one dimension may be understood singularly; it can be understood only in
relation to other dimensions” (p. 410), thus providing a framework for the concept of multiple
dimensions of identity. It is important to note that Jones and McEwen (2000) also provided the
first model to include the importance of various degrees of salience in an individual’s dimensions
of identity. The salience is indicated by the relation of the dots in each circle (representing each
dimension of identity) to the core sense of self. The closer the dot to the core, the more salient
that dimension is to the individual. For example, if religion is particularly important to an
individual’s identity, the salience dot would be located close to the core. This illustrates that
“various identity dimensions are present in each individual, yet experienced in different ways as
more or less salient” (p. 410). As previously mentioned, degree of salience is influenced by
sociocultural conditions, family background, and personal experiences (Jones & McEwen, 2000).
27
In relation to this research, salience of identity traits, specifically in regards to gender, ethnicity,
age, and religious affiliation, are necessary to determine what aspects of identity influences
decision making. For example, when ethnicity or religious affiliation is a more salient identity
dimension, according to Jones and McEwen (2000), it would be located closer to the core of
one’s identity, and thus, would have an impact on the decision making of the individual, such as
dissertation methodology choice.
Related Research
Dissertation Methodologies
The dissertation is a fairly consistent product among doctoral programs both in the US
and internationally (Boote & Belie, 2005; Tronsgard, 1963); however, there is very little research
regarding the dissertation products in doctoral programs, especially in the field of education
(Boote & Belie, 2005). There are two main methodological choices in research: quantitative or
qualitative. These two methodologies are fundamentally different in their philosophical
paradigms, language, and data collection methods. Both quantitative and qualitative research are
based on a different paradigm. A paradigm is a set of assumptions. These assumptions are
related to reality (ontology), knowledge of reality (epistemology), and how to know that reality
(methodology) (Guba, 1990). Quantitative research is based on positivism (Sale et al., 2002).
Positivism emphasizes empirical observation and scientific study (Creswell, 2013), and Sale et
al. (2002) described it as “all phenomena can be reduced to empirical indicators which represent
truth” (p. 44). Ontologically in quantitative research, there is only one truth: the objective
reality. In quantitative research, it is the researcher’s job to study a phenomenon objectively and
without influencing it or being influenced by it (Sale et al., 2002). Research techniques for
quantitative research are much different than in qualitative research, as methods are used to
28
ensure that the researcher’s bias is not a factor in the analyzation of data. Structured protocols,
blinding, randomization, and questionnaires with limited response choices are used in
quantitative research, and sample sizes are much larger than in qualitative studies to ensure that
samples are representative of target populations (Sale et al., 2002).
Qualitative research, in contrast, is structured much differently both methodologically
and philosophically. The qualitative paradigm is based in interpretivism and constructivism
(Creswell, 2013; Lincoln & Guba, 1985). In a constructivist paradigm, “individuals seek
understanding of the world in which they live and work” (Creswell, 2013, p. 24). The goal of the
research in this paradigm is to “rely as much as possible on the participants’ views of the
situation” (Creswell, 2013, p. 25). These experiences generally are formed through participants’
interactions with others. The view of reality in constructivism, or the ontological assumption, is
that “multiple realities are constructed through our lived experiences and interactions with
others” (Creswell, 2013, p. 36). Epistemologically, qualitative researchers generally assume that
“reality is co-constructed between the researcher and the researched and shaped by individual
experiences” (Creswell, 2013, p. 36). The paradigm of interpretivism largely opposes the
positivism of quantitative research; its basis is that reality is socially constructed and only found
through shared meanings, experiences, and language. In the interpretivist framework, the goal of
research is understanding, which is in contrast to the goal of research in positivism, which is
generally an objective explanation or prediction (Creswell, 2013; Lincoln & Guba, 1985).
Borders et al. (2015) studied qualitative and quantitative dissertation methodologies in
counseling programs. They found that the majority of qualitative dissertations included
grounded theory, phenomenology, and case study methods and the majority of quantitative
dissertations included experimental, quasi-experimental, survey, correlational, descriptive, and
29
instrument development methods. As described by Hoepfl (1997), quantitative researchers aim to
find causal determination, prediction, and generalization of findings. In contrast, qualitative
researchers aim to find illumination, understanding, and extrapolation. These aims are very
different and result in vastly different knowledge gained from their respective research.
The fundamental differences in the assumptions between qualitative and quantitative
research led to the development of different journals, methods, expertise, and language.
Quantitative and qualitative researchers see reality in different ways. In short, quantitative
researchers believe that there is an objective reality, separate from the researcher that is to be
discovered. In contrast, qualitative researchers believe that reality is constantly changing and is
created through individuals’ experiences. This reality is subjective and exists through both the
researcher and participants (Sale et al., 2002). The positivism paradigm in which quantitative
research lends itself to empirical study, which is common in hard science fields, and the
constructivist paradigm in qualitative research is more common in social sciences. The choice
between each of these methodologies is a complex one with little research examining it.
Buchanan and Bryman (2007) discussed how the choice between research methods is “shaped by
aims, epistemological concerns, norms of practice…as well as historical, political, ethical,
evidential, and personal factors” (p. 483).
In 1973, Wick and Dirkes studied a random sample of dissertations and found that only
7% of dissertations used qualitative or non-numerical data gathering methods. In 1998, Rone
determined in his study that qualitative designs were steadily increasing. Nelson and Coorough
(1994) analyzed over 10,000 PhD and EdD dissertations and found that although survey research
was the most used data-gathering method in EdD dissertations, multivariate statistics was more
used in PhD dissertations. The researchers discovered that qualitative research only comprised

30
3% of the dissertations from 1980 to 1993, but they determined that there was a substantial
increase in qualitative methodologies since 1980, and they postulated that it would continue to
rise in popularity. Nelson and Coorough did not discuss why they expected the continual rise in
popularity of qualitative research, but Alasuutari (2010) suggested that a shift of cultural and
political worldviews has caused more interest in subjective human views rather than just
empirical, positivist studies. There is little recent research regarding the current proportions of
qualitative and quantitative dissertation methodologies or the act of a researcher’s choice of
research methodology. Strauss and Corbin (1990) suggested to researchers that qualitative
research is to be used to better understand a phenomenon where little is known or where there
are open-ended research questions. Patton (1990) discussed how the choice of methodology
should be situational based on the research question and that both quantitative and qualitative
research methods on a topic provide insight that neither could provide alone. There is also little
research regarding differences in male and female choice of dissertation methodology.
Sex and Methodologies
Quantitative research is based in mathematics, which is evidenced in the statistical
analysis that is used to analyze data in this methodology (Sale et al., 2002). There is an
abundance of research that has indicated that women have higher mathematics anxiety, lower
mathematics attitudes, and are underrepresented in STEM careers and majors (Bell, 2003; Bui &
Alfaro, 2011; Lockhead et al., 1985; Nelson & Brammer, 2008; Onwuegbuzie & Wilson, 2003;
Upadyaya and Eccles, 2014; Wilson & Milson, 1993). This research regarding women and their
disproportionate attitudes and anxieties of mathematics compared to men could indicate that they
are less likely to pursue a quantitative methodology for their dissertation.
Underrepresentation of women in STEM fields. According to Nelson and Brammer
31
(2008), women are underrepresented in a variety of STEM careers and college majors. There
has been progress in the past 30 years, but the underrepresentation in STEM careers and majors
remains. For example, women earned 31% of chemistry PhD degrees between 1993 and 2003,
but only 21.5% of women were hired for chemistry professor positions. There are similar
disproportions in areas of physics, engineering, and mathematics. Ceci, Williams, and Barnett
(2009) examined women’s underrepresentation in math-intensive fields using meta-analysis.
They found that women were more likely than men to prefer careers in fields that are not math-
intensive, and they were also more likely to leave math-intensive careers than men. In addition,
women who have high math aptitude are more likely to also have a high verbal aptitude, giving
them a larger variety of career choices. They also found that women in math-intensive careers
with children were penalized in regards to promotion rates. Bridgeman and Lewis (1996) found
that men and women earn equal grades in college mathematics classes and that women receive
almost half of bachelor’s degrees in mathematics, which has doubled since the 1960s. There
have also been gains in women earning doctoral degrees in STEM fields. Women earn 24% of
PhD degrees in mathematics and computer science, 22.3% of the PhD degrees in engineering,
29.5% of the PhD degrees in physical science, and 50% of the MD degrees in medical science.
Overall, women earn 40.6% of PhD degrees in STEM areas, while in 1966, women only
obtained 8% of these doctoral degrees (National Science Foundation, 2015a). These numbers
indicate that sociocultural factors have an influence in the differences in the generations of
doctoral degree-earning women since biology does not change.
Mathematics attitudes. Research has also found that attitudes of math and science are
more positive for men than women. Desy, Peterson, and Brockman (2009) discovered that men
are more positive about science and mathematics, and the men with positive attitudes received

32
higher grades in math and science courses. The women in the study indicated that science and
mathematics were not very relevant to their academic success and had less positive attitudes and
grades toward these courses. Women also are less confident in their abilities in mathematics and
science than men are (Eccles & Wigfield, 2002). Fleming and Malone (1983) found that males
had higher science and math attitudes compared to females in kindergarten through 12th grade.
Cvencek, Meltzoff, and Greenwald (2011) discovered that girls start developing negative
mathematics attitudes as early as second grade. Many girls, as reported by Beilock, Gunderson,
Ramierz, and Levine (2010), think that girls are not good at mathematics and continually doubt
their own abilities in mathematics. In addition, many girls are afraid to embarrass themselves in
math classes, so they try to avoid participants in class as much as possible (Beilock et al., 2010).
Other studies have also indicated that this low self-concept and attitudes in regards to
mathematics and science starts when girls are young and is even more evidenced as they reach
adolescence, where gender identity starts to become more important to identity (Eccles &
Wigfield, 2002). A meta-analysis conducted by Weinburgh (1995) also found males to have
more positive attitudes toward math and science than females. Catasmbis (1995) found that
although achievement between males and females in math and science was not significantly
different, males still had higher attitudes toward both subjects. These low attitudes could be
based in gender stereotypes; as teachers and parents have low expectations for females in
mathematics, their attitudes may be lower. Else-Quest et al. (2013) found a strong link between
mathematics and science attitudes and achievement; the lower the attitudes about mathematics
and science, the lower the achievement, and vice versa. Else-Quest et al. (2013) also found that
boys overestimated their mathematics ability while girls underestimated their mathematics
ability.
33
Mathematics anxiety. Math anxiety is defined as “feelings of tension and anxiety that
interfere with the manipulation of mathematical problems in a wide variety of ordinary life and
academic situations” (Richardson & Suinn, 1972, p. 551). This debilitating condition can cause
feelings of anxiety, panic, fear, distress, difficulty breathing, and the loss of concentration
(Cemen, 1987). Mathematics anxiety can lead to a limitation of college majors and even career
choices (Trujillo & Hadfield, 1999). Trujillo and Hadfield (1999) interviewed individuals with
severe mathematics anxiety to determine the roots of their distress with mathematics and found
that negative experiences in math classrooms and with math teachers, a lack of support at home
in mathematics, and difficulties in test taking all contribute to mathematics anxiety. This
supports other research which indicates that women who have negative experiences with teacher
and parental attribution of mathematics ability can contribute to mathematics anxiety and
achievement (Cheryan, 2012; Gunderson, Ramirez, Levine, & Beilock, 2012). Studies have
indicated that females exhibit more math anxiety in secondary and post-secondary settings,
although not in elementary settings (Campbell & Evans, 1997; Malinsky, Ross, Pannells, &
McJunkin, 2006). Malinsky et al. (2006) found that females exhibit more math anxiety in
secondary and post-secondary settings, although they did not find a difference in elementary
settings.
In addition to mathematics anxiety, studies have also indicated that women have higher
statistics anxiety than men. Statistics anxiety is directly related to quantitative methodologies,
because a quantitative methodology requires statistical analysis. Cruise, Cash, and Bolton
(1985) defined statistics anxiety as “the feelings of anxiety encountered when taking a statistics
course or doing statistical analyses” (p. 92). Onwuegbuzie (1995) and Zeidner (1991)
determined that women experience more statistics anxiety than men. Royce and Rompf (1992)
34
also found that women have more difficulties in statistics and in quantitative methodologies in
general. Zeidner postulated that the reason that women have more statistics anxiety and
difficulties is because of their prior experiences in math, including low mathematics self-
efficacy, which has been theorized to be a product of gender stereotyping and low mathematics
performance.
Mathematics achievement. The differences in mathematics achievement are not easily
explained. McGraw, Lubienski, and Strutchens (2006) determined that the mathematics
achievement gap between males and females has not diminished in the past 30 years despite the
plethora of research and educational initiatives designed to bring gender equality to mathematics.
There are studies that differ in regards to sociocultural and biological differences between males
and females. Hyde (2005) conducted a meta-analysis using 47 studies and found that males and
females are much more alike than unalike, although males had higher mental rotation and
mechanical reasoning than females. Entwisle, Alexander, and Olson (1994) found that
differences between male and female mathematics test scores increased with age. Sanders and
Nelson (2004) discovered similar results; in their study, there were no gender differences in math
performance for students at the age of nine, a small difference for students at the age of 13, and a
large difference for students at the age of 17. This would support Ceci et al.’s (2009) framework
that indicated that contextual influences structure an individual’s self, which then influences the
individual’s motivation, beliefs, and activities. Contextual influences, such as cultural
stereotypes, and parental and teacher attributions can lead to a drop of confidence, and thus, a
decline in achievement as girls take fewer advanced math and science courses and start to fall
behind their male counterparts (Sanders & Nelson, 2004). Grabner, Stern, and Neubauer (2006),
in the biological context, found that high intellectual performance and the primary cortical
35
activation are a result of both previous neural efficiency and experience. This indicates that
cultural beliefs and environments will influence motivation and activity for certain things, which
then, biologically, provides more intellectual practice and thus, higher abilities. For example, if
a male’s cultural influences indicate that he should be good at mathematics, he may have a
higher motivation to work harder at mathematics. His brain will then become more efficient and
experienced at mathematics, which will in turn, allow him a higher intellectual performance in
mathematics. Ceci et al.’s (2009) circular framework brings together sociocultural context,
motivation, and biology to offer an explanation of the proportional differences in males and
females in STEM careers and majors. This may be due to stereotype threat.
Gender stereotyping. Research has indicated that gender stereotypes play a role in the
division of labor between males and females. Many occupations are associated with masculine
attributes and dominated by males, such as carpentry, and many others are associated with
feminine attributes and dominated by females, such as secretarial work. Cejka and Eagly (1999)
studied 80 different occupations and the gender-stereotypic attributes of each and found that in
professions that were female-dominated, feminine traits were perceived most crucial for success,
and in the male-dominated professions, masculine attributes were perceived most crucial for
success. In addition, participants indicated that the occupations that required masculine traits for
success were perceived as more prestigious. Cejka and Eagly (1999) concluded that “women
thus face the daunting reality of a social structure in which high wages and prestige are
associated with occupations that are thought to require masculine personal characteristics” (p.
422).
Stout, Dasgupta, Hunsinger, and McManus (2011) empirically tested the effect of gender
stereotyping on women’s choice of a STEM career. According to the National Science

36
Foundation (2015b), only 34% of professors in STEM departments at four-year universities are
female, which does not provide female STEM students with enough positive, same-sex role
models. Stout et al. postulated that this could be a reason that so many women switch from a
STEM major in college; the “skewed gender ratio of STEM experts in academic environments
undermines female students’ identification with, positive attitudes about, and self-efficacy in
STEM and saps their motivation to pursue careers in science, engineering, or technology” (p.
256). As Cheryan (2012) discussed, when STEM environments are stereotyped as masculine,
females are less interested. Stout et al. (2011) found that contact with successful females in the
field could “inoculate women from applying STEM stereotypes to their own self-concept” (p.
256), providing positive role models that break the gender stereotypes. In the study conducted
by Stout et al. (2011), it was found that when women interacted with a female with expertise in
math, “they expressed more positive implicit attitudes toward math, showed more implicit
identification with math, and increased their effort on a very difficult math test compared with
others who interacted with an advanced male peer” (p. 260). However, they also found that
women’s implicit stereotypes about math did not change even after their interaction with a same-
sex role model; even though their self-concept was shielded, the women were still aware of the
negative stereotypes relating to math. Stout et al. (2011) also found that female students were
less confident about their math performance in advanced mathematics courses when the
professor was male compared to if the professor was female.
Cheryan (2012) examined the role of gender stereotyping in the mathematics gender gap.
Cheryan found “while doing well in math classes may now be stereotyped as feminine, seeking
out math-related careers is still a gender role violation for women” (p. 184). Researchers have
determined that there is not a difference in mathematics achievement between male and female
37
students based on standardized test scores (Hyde, Fennema, & Lamon, 1990), but there are
significantly less females who choose to pursue STEM-related majors and careers (National
Science Foundation, 2015). In the workforce, women only make up of 25% of the total
computer and mathematical sciences profession and 13% of the engineering field (U.S.
Department of Labor, 2015). Cheryan (2012) postulated that “math anxiety, math-gender
stereotypes, attributions for success and failure in math, and beliefs about math intelligence” (p.
185) is passed from parents and teachers to children from a young age. Barry, Bacon, and Child
(1957) also discussed the role that culture plays in defining sex-specific self-concepts and
personality attributes. This, according to Cheryan, can contribute to the disproportions in math-
related majors and career fields between women and men.
As Cheryan (2012) postulated, math anxiety and self-concept can be passed from parents
and teachers at a young age. The gender gap in mathematics achievement between boys and
girls has closed according to recent research (Hyde, 2005), but there are still significantly more
males than females who take advanced math courses and pursue mathematics-related careers.
Gunderson et al. (2012) sought to determine a reason for this disconnect, and they found that
girls have more negative math attitudes, higher levels of mathematics anxiety, and a lower self-
concept in mathematics. Many studies have investigated the impact of parents’ and teachers’
math attitudes and gender stereotypes on children’s math anxiety and self-concept. It has been
found that adults’ gender stereotypes regarding math does influence their expectations and
attributions for children’s math achievement. These expectations then affect children’s attitudes,
self-concept, and anxieties (Eccles & Jacobs, 1986; Eccles, Jacobs, & Harold, 1990; Jacobs &
Eccles, 1992; Gunderson et al., 2012; Midgley, Feldlaufer, & Eccles, 1989). Gunderson et al.
(2012) found that these negative math attitudes formed at an early age from parental and teacher
38
expectations, attitudes, and stereotypes “sets the stage for lifelong behavioral and attitudinal
patterns, such as math anxiety and math avoidance, which can eventually lead to lower levels of
STEM course-taking and career choices among women versus men” (p. 154). Jacobs (1991)
even found that parents’ beliefs about their child’s math ability is a stronger predictor of the
child’s self-perception of ability in mathematics than even the child’s own past mathematics
achievement. Jacobs (1991) also found that parents who hold strong gender stereotypes apply
these gender stereotypes to their own children, including stereotyping their mathematics ability
according to gender despite the child’s achievement in mathematics. Fennema, Peterson,
Carpenter, and Lubinski (1990) found that teachers attribute boys’ mathematics achievement to
ability, while they attribute girls’ mathematics achievement to effort. Dweck (2006) concurred
with this finding, and labeled these two different mindsets as a “growth mindset” and a “fixed
mindset.” Dweck also found that not only do teachers attribute boys’ mathematics achievement
to ability and girls’ mathematics achievement to hard work, but also girls now have this mindset
as well. Girls are more likely to give up when challenged in math because they do not believe
they are good at math. Dweck considers this a fixed mindset in that they cannot get better or
ever be good at math. A growth mindset, in contrast, is a mindset that hard work can build
confidence and mathematics ability. Attribution of academic achievement, especially in
mathematics, seems to follow the pattern that parents rate mathematical ability higher for boys
even when no differences in performance exist between girls and boys (Hess et al., 1986;
Parsons, Adler, Kaczala, & Meece, 1982). Lummis and Stevenson (1990) also studied parental
attribution, and they found that mothers rated girls higher in reading and boys higher in
mathematics, regardless of performance. These parental and teacher gender attitudes towards
mathematics achievement and ability can provide a gender-stereotyped foundation for children
39
that follows them into adulthood and affects their self-concept, attitudes, and choices related to
mathematics courses and careers.
Steele, James, and Barnett (2002) studied undergraduate women in math, science, and
engineering majors. They postulated that women in these majors, which are male-dominated,
may switch into female-dominated majors in order to avoid the threat of negative gender
stereotypes. Steele et al. found that women perceived higher levels of sex discrimination than
men in science, math, and engineering majors. Women also reported that they were threatened
by negative gender stereotypes, specifically that they were not as capable in math, science, and
engineering. Surprisingly, Steele et al. found that this was not the case with men in female-
dominated majors; they did not feel any negative gender stereotypes or discrimination.
Kawakami, Young, and Dovidio (2002) found that individuals’ schemas include not just
traits and stereotypes, but also behavioral representations of social categories. These behavioral
representations can appear automatically and without conscious awareness. This is considered
the ideomotor perspective, which also explains the human tendency to imitate others
(Dijksterhuis & Bargh, 2001). Steele and Ambady (2006) took this perspective and studied how
when women were reminded of a stereotyped identity, the reminder of their “gender identity
would lead to the expression of more stereotype-consistent attitudes towards math (negatively
stereotyped) and arts (positively stereotyped)” (p. 429). The results indicated that the personal
attitudes of women are influenced by a reminder of their gender identity; women who were
reminded of their gender identity had a greater preference for art than mathematics (Steele &
Ambady, 2006).
Clance and Imes (1978) discovered the imposter phenomenon, which is “an internal
experience of intellectual phoniness which appears to be particularly prevalent and intense
40
among a select sample of high achieving women” (p. 241) where women who experience the
phenomenon “persist in believing that they are really not bright and have fooled anyone who
thinks otherwise” (p. 241). Women who experience the imposter phenomenon insist that they
are not intelligent and believe that they have fooled anyone who believes that they are. They
insist that their good grades, high test scores, or acceptance into elite programs are due to luck,
bad judgment of admissions personnel or professors, or misgrading. They are constantly afraid
that they will fail or that their “secret” will be discovered, so they are extremely diligent and
hardworking in their schoolwork or use charm and flattery to win approval of professors. In
relation to STEM, Stout et al. (2011) discussed how this phenomenon can be exacerbated in
women in STEM majors and careers due to the gender stereotypes in these fields. As previously
mentioned, there are no significant differences in standardized test scores in STEM subjects
between genders (Hyde et al., 1990), but the disparity of females that enter into STEM majors or
careers may be related to the gender differences in expected performance outcomes in these areas
related to the imposter phenomenon. Deaux (1977) determined that in women, there is a much
lower expectancy of their ability than in men. When women score high on a test or do well in a
task, they are more likely to attribute this to a temporary cause (e.g. luck or effort), while men
are more likely to attribute the success to their own ability. In addition, women attribute failure
to their own lack of ability, while men attribute failure to a temporary cause such as luck.
Broverman, Vogel, Broverman, Clarkson, and Rosenkrantz (1972) claimed that these lower
expectancies for women was due to a self-stereotype derived from societal gender stereotypes
that women are less competent than men. Clance and Imes (1978) found even repeated
successes were not enough to break the cycle of persistent fears of failure and the discounting of
women’s doubt of their own abilities. In regards to this topic of choosing quantitative or
41
qualitative research methodologies, it could be determined that women may be hesitant to choose
a math-related methodology due to doubt of their abilities in this area despite their repeated
successes in a doctoral program.
Women may be hesitant to choose a quantitative research methodology, a scientific,
mathematical approach, because of negative gender stereotypes. As Eccles (1987) stated,
individuals value tasks that are harmonious with their gender roles. Qualitative research has
been called more compatible to the female experience and gender roles, which may indicate that
women are more likely to choose this methodology. Because quantitative research is more
mathematical and scientific, women may choose a qualitative dissertation methodology in order
to avoid the threat of negative gender stereotypes because qualitative research is based in
psychology, a field with less gender stereotypes (Cheryan, 2012).
Feminist perspectives of methodology. The differences in assumptions between
quantitative and qualitative methodologies has been discussed in context of gender. Some
feminist researchers have criticized and even rejected quantitative methodology, claiming that its
objectivity and positivist assumptions ignores women’s voices and is an inaccurate measure of
social knowledge (Stanley & Wise, 1993; Wilson, 2011). Certain feminist researchers have
criticized various quantitative methods of data collection, such as Graham’s (1983) argument
that survey research treats all individuals as equals and thus, does not accurately reflect society.
Roberts (1981) claimed that women prefer not to use quantitative research methods because
these methods do not reveal the intricacy of women’s experiences. In contrast, qualitative data
collection techniques, such as the semi-structured interview, gives participants a voice and
involves them in the research. In qualitative research, the researchers are more concerned with
validity than objectivity (Westmarland, 2001). Westmarland (2001) even stated that quantitative
42
research is associated with words such as positivism, scientific, objectivity, statistics, and
masculinity. Qualitative research, however, according to Westmarland, is associated with words
such as interpretivism, non-scientific, subjectivity, and femininity. In published journal studies,
Plowman and Smith (2011) found that women were overrepresented as authors of qualitative
studies.
As discussed, feminist researchers criticize and reject some quantitative methodologies
due to the lack of voice and female perspectives (Graham, 1983; Roberts, 1981). Qualitative
research, in contrast, focuses on individuals’ lived experiences and perspectives (Creswell,
2013). Gilligan (1982), one of the first theorists to focus on specifically women’s identities,
focused on how women define themselves in terms of relationships and connections in contrast
to men, who, according to Gilligan, define themselves in terms of separation and achievement.
Gilligan’s (1982) description of the differences in how men and women define themselves could
translate into the differences between methodologies; qualitative studies focus on connections,
perspectives, and personal relationships (Creswell, 2013) while quantitative studies focus more
on objectivity (Stanley & Wise, 1993).
Sex and methodology choice. There is very little research regarding dissertation
methodology choice. One study by Randolph et al. (2010) used content analysis to analyze the
dissertations and theses completed at Mercer University’s School of Education from the years
1985-2010. They found that the number of male authors increased over time and that the
number of dissertations and theses utilizing qualitative methodologies increased. However, this
study did not look at gender differences between methodologies. Nelson and Coorough (1994)
found that the number of women publishing dissertations has increased significantly. Women
published less than 1% of dissertations in 1950, but by 1990, women published 49% of all

43
dissertations. Although Nelson and Coorough did study research methods, they did not
differentiate methodology choice based on gender. In their longitudinal study, they found that
qualitative research did not comprise a high percentage of all dissertations, but they noted that
since 1980, there has been a substantial increase in qualitative research. They postulated in 1994
that qualitative research would continue to increase dramatically. Plowman and Smith (2011)
found that in four different scholarly journals, women publish more qualitative studies than men
and men publish more quantitative studies than women. This phenomenon could be due to
women and their attitudes toward science and math.
Ethnicity and Methodologies
Just like women, ethnic minorities may also avoid quantitative dissertations. Research
has indicated that individuals of several ethnic minorities experience stereotype threat in regards
to mathematics, similar to that of women (Hughes, Gleason, & Zhang, 2005). In addition,
African American and Hispanic individuals have higher mathematics anxiety, lower mathematics
performance, and lower science and mathematics attitudes than Caucasians or Asians (Bell,
2003; Bui & Alfaro, 2011; Lockhead et al., 1985; Onwuegbuzie & Wilson, 2003; Upadyaya and
Eccles, 2014; Wilson & Milson, 1993). Because quantitative research is based in mathematics
and positivism (Sale et al., 2002), this may indicate that those in ethnic minorities may be more
likely to choose qualitative methodologies rather than quantitative.
Wolniak (2016) found that Caucasian and Asian students are overrepresented in STEM
majors while individuals of other ethnicities are underrepresented. Tobias (1976) discussed how
both women and African American males tend to avoid math and science majors and fields due
to the perception that they are more suited for white men. Stereotypes regarding mathematics
and science and ethnicities tend to be that Caucasians and Asians have high abilities in
44
mathematics and science and that African Americans and Latinos have a lower intelligence and
motivation in these areas (Hudley & Graham, 2002). Cvencek et al. (2011) and Pinel (1999) also
found that gender and ethnic stereotypes is directly related to mathematics and science self-
concept and attitudes, which would indicate that both Latinos and African Americans are at risk
due to their ethnic stereotypes of low ability in mathematics and science. Wenner (2003)
discovered that children perceive scientists as white men, which is further evidence toward both
an ethnic and gender stereotype.
Research has also indicated that mathematics performance is different among ethnic
groups. Lockhead et al. (1985) conducted a meta-analysis of multiple studies and found that
Asian American students had higher mathematics performance than Caucasian students, both
Asian American and Caucasian students had higher mathematics performance than Hispanic
students, and all three of the groups had higher mathematics performances than African
American students. Grigg, Donahue, and Dion (2007) examined mathematics assessments and
found that Asian Americans scored highest, followed by Caucasian students. African American
students and Latino students scored the lowest on these mathematics exams. Gross (1988) found
that as students got older, African American and Hispanic students found science and
mathematics less enjoyable than their Caucasian and Asian American counterparts. As parental
support and perceptions of science and mathematics were found to be a significant factor in
female math attitudes (Fennema et al., 1990), they have also found to be significant for those in
minority ethnic groups. Eccles (1993) discussed how parents’ own biases form impressions of
their child’s ability. Entwisle and Alexander (1988) discovered parental support is the most
influential variable in regards to academic self-concept. The parental expectations for
mathematics performance in minority ethnicities is a significant factor that can inhibit attitudes
45
and self-concept and increase anxiety in both mathematics and science. Hall, Davis, Bolen, and
Chia (1999) found a negative correlation between parental levels of mathematics anxiety and
their child’s math performance. They also discovered a positive correlation between a child’s
mathematics scores and the most advanced mathematics courses completed by the parents. They
determined that parental attitudes toward mathematics is a significant factor for mathematics
performance. McGraw et al. (2006) confirmed that there is an achievement gap between
Caucasian students and students in ethnic minority groups, but also found that a gender gap in
mathematics achievement, which is evident in all other ethnic groups, does not exist among
African Americans. In other words, the mathematics achievement between African American
males and females is not significantly different, although both male and female African
Americans have lower mathematics achievement than Caucasian students.
Hughes et al. (2005) found that teachers have an intrinsic bias in regards to academic
achievement in different ethnic groups. They discovered that teachers were more likely to
attribute problem behavior to situational factors in Caucasian students but attributed problem
behavior in African American and Hispanic students to factors such as personality and
motivation, which are child-related factors. Other studies have also found that teachers do not
accurately rate academic ability in students of minority ethnicities, and students of minority
ethnicities are underrepresented in gifted education identification and programs (Murray, 1996).
In Upadyaya and Eccles (2014)’s study that tested the predictor variables of gender, age, teacher
expectations, and ethnicity in mathematics interest, they found that each of the variables was
significant in predicting mathematics interest in students. Caucasian students had a significantly
higher interest in mathematics than students in minority ethnicities. In addition, teacher
expectations “positively predicted teachers’ beliefs regarding children’s effort, abilities, and
46
performance in math, and math importance to children” (Upadyaya & Eccles, 2014, p. 412).
These results indicate not only that students of minority ethnicities have a lower interest in
mathematics, but also that the biases in teacher expectations and attitudes in students of minority
ethnicities does affect their mathematics attitudes and development of interest in mathematics
fields. Conversely, Riegle-Crubm, Moore, and Ramos-Wada (2010) found that the intrinsic
aspiration of careers in mathematics and science between Caucasian, African American, and
Hispanic adolescents was not significantly different, although the achievement gap in these
subject areas was very large between Caucasian students and those of ethnic minorities.
It is important to note that there is the possibility that in conjunction with ethnicity, socio-
economic status may also factor into the differences between mathematics and science
achievement, attitudes, and anxiety. Some scholars have noted that these two dimensions
directly affect each other, considering many of those students in ethnic minorities are also of a
lower socioeconomic status per capita than their Cacausian and Asian-American counterparts.
Thus, many researchers have encouraged individuals to keep in mind the socio-economic
differences between ethnic groups (Campbell, 1991; Leder, 1992).
As discussed earlier in the context of gender, stereotype threat also affects individuals of
underrepresented ethnicities in the STEM field. The individuals experiencing stereotype threat
may have a fear that they will confirm a negative stereotype regarding the intelligence of those of
their ethnicity (Aronson et al., 2002). Individuals of minority ethnicities also can be afraid of
being socially rejected in academic areas where they are underrepresented, such as STEM majors
and careers (Shelton & Richeson, 2005). To further complicate the issue, age may also play a
role in mathematics anxiety and attitudes.
47
Age and Methodologies
Older students tend to have higher mathematics anxiety and lower attitudes towards
mathematics and science compared to their younger, traditional-student counterparts (Bean &
Metzner, 1985; Bell, 2003; Bui & Alfaro, 2011; Jones & Watson, 1990; Lockhead et al., 1985;
Onwuegbuzie & Wilson, 2003; Upadyaya and Eccles, 2014; Wilson & Milson, 1993). Because
the essence of quantitative research is mathematics and scientific positivism, this may indicate
that older, non-traditional students may tend to choose qualitative researcher over quantitative
research.
The average age of a traditional graduate student is 33 years old. However, the National
Postsecondary Student Aid Study (NPSAS) found that the EdD degree had the highest average
age (42.3 years old) of any graduate program (U.S. Department of Education, 2010). Many
factors contribute to this higher average age of EdD students, such as the number of online
programs or blended programs that allow students to have the flexibility to complete a degree
program along with continuing their career and caring for their family. Non-traditional students
are characterized by various factors, but most often age is the defining characteristic for this
population of students. The National Center for Education Statistics (2016a) described a non-
traditional student as a student who is above the average age for the degree program.
Bui and Alfaro (2011) discovered that both statistics anxiety and attitudes toward science
differed by age. Bell (2003) also found that older, non-traditional students had higher statistics
anxiety than traditional students, although they did find that younger, traditional students had
more negative attitudes toward science. Baloglu (2003) had similar results in a study regarding
statistics anxiety. Baloglu found that older students had significantly higher statistics anxiety
than younger students, but that older students had more positive attitudes toward statistics than
48
younger students. Baloglu explained this by suggesting that older students have more anxiety
surrounding statistics, but they recognize the value and usefulness of statistics. In contrast,
younger students do not experience anxiety when taking statistics courses, but they do not see the
value in understanding statistics. However, other studies have indicated that older, non-
traditional students have more negative attitudes toward science, especially non-traditional
female students (Bell, 2003; Onwuegbuzie & Wilson, 2003; Wilson & Milson, 1993), so the
relationship between age of student and attitudes toward science is unclear and contradictory in
the literature. Both Sorge (2007) and Fleming and Malone (1983) found that science attitudes
drop significantly with age, and although their study examined younger students in grades
kindergarten through 12th, this has implications for collegiate programs, as well. In regards to
mathematics, studies have indicated that older, non-traditional students exhibit more math
anxiety than traditional students (Malinsky et al., 2006; Royce & Rompf, 1992; Woodard, 2004).
Elliott (1990) found in a study of traditional and non-traditional undergraduate students that for
female non-traditional students, attribution was the most significant predictor of mathematics
achievement. Simply stated, if these older, female students attributed mathematics success to
luck, they did not achieve as well in mathematics courses. However, if these students attributed
mathematics success to hard work and intelligence, they were more likely to have a higher
mathematics achievement score.
Much research has determined that age is a significant factor in attrition in graduate and
post-graduate programs (Bean & Metzner, 1985; Jones & Watson, 1990). Bean and Metzner
(1985), in fact, identified age as the most significant predictor of attrition. Because of the risk
factors of these non-traditional students in conjunction with higher math anxiety and science and
math attitudes, it is important to understand the choices that they make in regards to dissertation
49
methodology. Finally, just as sex, ethnicity, and age could influence dissertation methodology
choice because of attitudes toward math and science, religious affiliation may also play a part in
this choice due to similar tensions.
Religion and Methodologies
Quantitative research is based in positivism, which emphasizes empirical observation and
scientific study (Creswell, 2013). The positivist approach is grounded in objective reasoning and
empirical indicators to represent truth (Sale et al., 2002). This is in direct conflict to theistic
worldviews such as those held by individuals who are affiliated with a religion. The worldview
conflicts between positivism and a religious affiliation (Astley & Francis, 2010; Greer, 1990;
Sale et al., 2002) could indicate that individuals who are affiliated with a religion may be more
likely to reject the quantitative methodology, which is based in scientific positivism.
Cho (2012) described the difficulties of embracing modern science for people of faith.
As previously discussed, both quantitative research and scientific inquiry is based in positivism.
This can create a conflict of worldviews. Specifically, Cho discussed the difficulties of those in
the Buddhist faith embracing scientific positivism, but the same arguments could be used for
other faiths, as well. Religious individuals find truth in the writings and teachings of their
religion, such as the Bible for Christians, the Torah for Jews, and the Quran for Muslims.
Although the usefulness of science is accepted in most religions, “the metaphysical conclusions
many draw from it such as the assertion that only matter exists” (Cho, 2012, p. 541) are rejected.
In addition, cosmological views, or the beliefs about of the history of the universe, cause a
conflict between the scientific and religious communities (Hanley, 2008). Many scientists claim
that there are “no supernatural phenomena, such as the spiritual realm beyond the physical
world” (Taber, Billingsley, Riga, & Newdick, 2011, p. 1001), which provides a direct conflict
50
with the belief in God, the very foundation of religious faith. These philosophical differences
could cause tensions between scientific endeavors and the individual’s worldview.
The way that faith-based schools address culture can impact attitudes toward
mathematics and science. A study by Van Brummelen and Koole (2012) examined Christian
high schools and their curriculum in regards to cultural awareness and engagement. They found
that in most subjects, Christian schools integrated societal and ethical issues to encourage
students to shape their worldview and understanding of culture. The researchers even found that
80% of students in these Christian schools made career goals based on “vocations in which they
hope to make a difference for God and/or society around them” (p. 49). However, the
researchers discussed disappointment that culture was not discussed in the context of
mathematics courses. Van Brummelen and Koole (2012) stated, “we were disappointed that
mathematics...generally remained under the radar with respect to awareness of culture. For
instance, mathematics teachers did little with statistics, an area with many societal implications”
(p. 57). This could indicate to students that mathematics, and in particular statistics, is not as
important of an endeavor as other subject or career areas.
Although the purpose of this study is to examine mathematical aspects of the quantitative
dissertation methodology in the context of biological sex, ethnicity, age, and religion, because
the quantitative methodology is considered the more traditional, scientific methodology rooted in
positivism (Sale et al., 2002), examining the tension between science, sex, ethnicity, age, and
religion is necessary. There is much research about the tensions between religion and science.
Although there are certainly scientists that have a committed religious faith (Polkinghorne,
2008), the majority of scientists have the perspective that “science inherently excludes the
possibility of anything supernatural, such as God” (Taber et al., 2011, p. 1001). Dawkins, a
51
popular evolutionary biologist, is vocal about his negative views of religion and the disparity
between religion and science. He called the views of those who are religious “puny, pathetic,
and small-minded” (Dawkins, 1998, p. 312). Cray, Dawkins, and Collins (2006) called the
perceptions between science and religion as inherently in conflict. These attitudes toward those
of religious faith in science fields can impact people of faith to choose a career or major more
conducive to their beliefs. Francis and Greer (1999) found that 62% of students agreed that there
is a fundamental conflict between scientific and religious claims. Astley and Francis (2010)
found a negative correlation between attitudes towards science and attitudes towards religion.
Taber et al. (2011) found in a qualitative study that students believe that there are contradictions
between religion and science, and that at many times, one has to choose between religion and
science based on context. Although Taber et al. found that some students believed that science
supported their faith, many students either compartmentalized science and religion or choose
between the two, noting that either they should “stick to their religion” or that they decided to
choose science over their religion. Some participants even went as far as to say that they felt that
they had to “pick a side” between religion and science, indicating that even younger students as
examined in Taber et al.’s (2011) study recognize the conflicts and contradictions between
religion and science.
Summary
In summary, Chapter Two included a discussion of the theoretical underpinnings of this
study, intersectionality and the multi-dimensional identity development model. It was
determined that there are fundamental differences in qualitative and quantitative research
methodologies, both in the philosophical underpinnings and in the data collection methods and
analyses. Because of these fundamental differences, the relationships between the choice of

52
methodology and biological sex, ethnicity, age, and religious affiliation was examined based on
research regarding these groups and mathematics anxiety, mathematics performance, stereotypes,
and mathematics and science attitudes.
53
CHAPTER THREE: METHODS
Overview
The purpose of this predictive correlational study was to examine if the variables of
biological sex, ethnicity, age, and religious affiliation, predict the choice of a quantitative or
qualitative dissertation methodology. Logistic regression was used to examine the relationship
between the predictor variables (biological sex, ethnicity, age, and religious affiliation) and the
criterion variable, dissertation methodology choice (quantitative or qualitative). Chapter Three
will include a discussion of the study’s design, research questions and hypotheses, participants
and setting, procedures, and data analysis.
Design
The research design that was utilized in this study was a predictive correlational design.
Correlation studies are used for two purposes. They are used to “(1) explore causal relationships
between variables and (2) to predict scores on one variable from research participants’ scores on
other variables” (Gall, Gall, & Borg, 2007, p. 337). Correlational designs allow researchers to
analyze the relationships between multiple variables, including how these variables both
individually and in combination affect behavior (Gall et al., 2007). In this study, a predictive
correlation design was utilized to predict dissertation methodology choice based on biological
sex, ethnicity, age, and religious affiliation.
In this study, variables were not manipulated and are referred to as either predictor or
criterion variables. The predictor variables were biological sex, ethnicity, age, and religious
affiliation, and the criterion variable was dissertation methodology choice (quantitative or
qualitative). Because a predictive correlational design is a research technique that involves
determining “the extent to which a criterion behavior pattern can be predicted” (Gall et al., 2007,
54
p. 342), the design was appropriate for this study, which sought to determine to what extent
dissertation methodology choice can be predicted based on biological sex, ethnicity, age, and
religious affiliation. This design was appropriate because the predictor variables (biological sex,
ethnicity, age, and religious affiliation) were measured before the criterion variable (dissertation
methodology choice), which is necessary in predictive correlational designs (Gall et al., 2007).
Research Question
RQ1: To what extent can the biological sex, ethnicity, age, and religious affiliation of a
doctoral candidate attending a faith-based university predict the choice of dissertation method
(quantitative or qualitative)?
Null Hypothesis
H01: There is no statistically significant relationship between the criterion variable
(dissertation methodology) and the combination of predictor variables (biological sex, ethnicity,
age, and religious affiliation) for doctoral candidates attending a faith-based university.
Participants and Setting
The participants in this archival study were doctoral candidates who graduated from a
large, private faith-based university in the southeast with an EdD degree and produced a
dissertation from the School of Education. The EdD degree at this university is a blended
program, offering both online and residential doctoral courses. The setting for this study, a
private university in central Virginia, is a faith-based university that is accredited through the
Southern Association of Colleges and Schools for its doctoral degree.
Considering the university setting is a faith-based, faith-based institution, it could be
assumed that students at this university are affiliate with a religion. However, this cannot be
assumed. In Uecker’s (2008) study, it was found that students at faith-based schools are more
55
likely than students at secular schools to believe that religious faith is important in daily life, but
it determined that not all students at faith-based schools identify as affiliated with a religion.
Although religious schools do reinforce religious faith, religious schooling is not a definitive
predictor of religious faith or affiliation (Uecker, 2008). In this study, if the dissertation author
indicated his or her religious affiliation on the application to the university, this is an assumption
that religious faith is a salient identity role, which is supported by Jones and McEwen’s (2000)
multi-dimensional identity theory. Although doctoral candidates who did not indicate their
religion on their university application still may have a religious affiliation, if they did not
indicate their religion on their university application, it will not be considered a salient identity
trait for the purposes of this study (Jones & McEwen, 2000).
There were 590 dissertations that were written by EdD candidates at this university
between the years of 2012- 2016 as determined by the records of the School of Education. In
2011, a new system was implemented for dissertation candidates in which a research consultant
was assigned to each candidate to review his or her methodology and analysis to ensure he or she
met the university requirements. Each completed dissertation is uploaded in the university’s
student and faculty publication database, Digital Commons; however, there are a few candidates
who opt not to include their dissertation in the Digital commons database. Digital Commons
houses scholarly journals that faculty and students edit, works from the university faculty, and
student theses and dissertations. The dissertations accepted by the university’s School of
Education are traditional in nature and consist of five chapters, including Introduction, Literature
Review, Methods, Results, and Conclusion. Both qualitative and quantitative methods are
accepted for the dissertation requirement, and the School of Education’s Dissertation Handbook
states that for quantitative studies, a candidate can choose experimental, quasi-experimental,

56
causal-comparative, and correlational designs. For qualitative studies, a candidate can choose
phenomenological, grounded theory, case study, historical, and ethnographic designs. Any other
research designs require special permission from the administration of the program.
A sample of 388 dissertations were used in this study from the years 2012-2016 after two
cases were removed due to incomplete data. There were 199 quantitative dissertations and 189
qualitative dissertations included in the sample. According to Tabachnick and Fidell (2012),
testing multiple correlations requires a sample size of at least 50 + 8m where m is the number of
predictor variables. In this study, there were four predictor variables (biological sex, ethnicity,
age, and religious affiliation), so the minimum number of cases is 50 + 32, or 82. The sample
size of 388 exceeds this minimum sample size for multiple correlations. Systematic random
sample was used to select the dissertations. The researcher used the Microsoft Excel list of all
dissertation candidates who graduated each year obtained from the university’s School of
Education administration. Using this list, the researcher randomly selected 40 quantitative and
40 qualitative dissertations by assigning a coded number to each candidate that completed his or
her dissertation in 2012. The researcher used the random number function in Excel to place a
random number next to each name. The researcher then cut and pasted the random numbers into
a column and sorted the random number column in ascending order. The researcher looked up
each student’s dissertation from the university’s Digital Commons website, opened the
dissertation, and determined if the dissertation was quantitative or qualitative and recorded this
on the Excel spreadsheet. The researcher continued this process until 40 quantitative
dissertations and 40 qualitative dissertations were identified for the year. This process was used
to identify the sample for each year from 2012-2016. The researcher aimed for a total sample
size of 400, or 80 dissertations from each of the five years. However, in the year 2013, only 30
57
quantitative dissertations were written, and thus, the sample included 10 less qualitative
dissertations than expected.
Quantitative Sample
The quantitative dissertations (a total of 199) consisted of eight true experimental
designs, 38 quasi-experimental designs, 71 causal-comparative designs, 75 correlational designs
and three other designs. The average length of the quantitative dissertations used in this study
was 136 pages, from title page to the end of the appendices. There were 40 quantitative
dissertations included in the sample for the year 2012, 40 included in the year 2013, 39 included
in the year 2014, 40 included in the year 2015, and 40 included in the year 2016.
There were 67 quantitative dissertations written by male candidates and 132 quantitative
dissertations written by female candidates. There were 23 African American candidates, 143
Caucasian candidates, three Asian candidates, two Hispanic candidates, and three American
Indian candidates in regards to ethnicity that produced a dissertation with a quantitative
methodology. There were 104 traditional candidates (aged 42 or younger at the time of
dissertation defense) who produced a dissertation with a quantitative methodology and 95 non-
traditional candidates (over the age of 42 at the time of dissertation defense) who produced a
dissertation with a quantitative methodology. There were 98 candidates who indicated a
religious affiliation and 101 candidates who indicated they were not affiliated with a religion
(students who either indicated “None” as their religion or opted to not answer their religious
affiliation) who produced a dissertation with a quantitative methodology.
Qualitative Sample
The qualitative dissertations consisted of 117 phenomenology designs, 53 case study
designs, 11 grounded theory designs, two ethnography designs, and one other design. The
58
average length of the qualitative dissertations used in this study was 202 pages. There were 40
qualitative dissertations included in the sample for the year 2012, 30 included in the year 2013,
40 included in the year 2014, 40 included in the year 2015, and 40 included in the year 2016.
There were 64 qualitative dissertations written by male candidates and 125 qualitative
dissertations written by female candidates. There were 15 African American candidates, 143
Caucasian candidates, one Asian candidate, six Hispanic candidates, and three American Indian
candidates in regards to ethnicity that produced a dissertation with a qualitative methodology.
There were 86 traditional candidates (aged 42 or younger at the time of dissertation defense) who
produced a dissertation with a qualitative methodology and 103 non-traditional candidates (over
the age of 42 at the time of dissertation defense) who produced a dissertation with a qualitative
methodology. There were 89 candidates who indicated a religious affiliation and 100 candidates
who indicated they were not affiliated with a religion who produced a dissertation with a
qualitative methodology.
Instrumentation
Archival data was used for this study. Permission to use the data from the university’s
database for this research was requested from the Dean of the School of Education, and
permission was granted before the researcher collected the data. After approval from the Dean of
the School of Education, the researcher requested approval from the Institutional Review Board
(IRB), and the request was approved.
Banner INB
The university’s database is called Banner INB (Internet Native Banner). This database
is hosted on the university’s network and uses online forms to both enter and search information
in the database. Employees from various departments at the university enter student information.
59
First, admissions counselors enter demographic information about students as they apply for the
university. Throughout a student’s program, academic advisors, financial aid employees, and
employees of the registrar’s office enter information in a student’s profile. The student’s profile
includes his or her birthdate, ethnicity, religious affiliation, contact information, and grades from
courses they have taken. Any university employee has access to view a student’s information in
this database, although staff members are not permitted to access student information unless they
have a legitimate reason. In this study, archival data was obtained from two sources. Banner
INB was the first, and the second was the university library’s Digital Commons database.
Digital Commons
Digital Commons, a publication database, houses faculty- and student-edited scholarly
journals, works from university faculty, and student theses and dissertations. Digital Commons
is hosted on the university library’s website, and it is maintained by the library’s staff. Once a
candidate successfully defends his or her dissertation and the committee has approved the final
manuscript, the candidate is required to send the final dissertation to the library’s staff for
publication in Digital Commons. The library staff reviews the dissertation for copyright
purposes and uploads the dissertation as a .PDF into the Digital Commons database. Digital
Commons can be accessed on the university library’s webpage and can be searched by name,
keyword, or by discipline.
Procedures
Before data collection, the researcher requested and obtained Institutional Review Board
(IRB) approval. The researcher used the Microsoft Excel list of all dissertation candidates who
graduated each year obtained from the university’s School of Education. Using this list, the
researcher randomly selected 40 quantitative and 40 qualitative dissertations by assigning a
60
coded number to each candidate that completed his or her dissertation in 2012. The researcher
used the random number function in Excel to place a random number next to each name. The
researcher then cut and pasted the random numbers into a column and sort the random number
column in ascending order. The researcher looked up each student’s dissertation from the
university’s Digital Commons database, opened the dissertation, and determined if the
dissertation was quantitative or qualitative and recorded this in a Microsoft Excel document. In
order to determine the methodology of each dissertation, the researcher used Digital Commons.
First, the researcher typed the candidate’s name in the search bar. Then, the researcher opened
the dissertation, confirmed the name matched the correct candidate on the Excel sheet,
determined that the year of publication of the dissertation and the year of dissertation defense
matched, and viewed the abstract of the dissertation. The researcher first looked to see if the
words “quantitative” or “qualitative” appeared in the abstract. If either “quantitative” or
“qualitative” appeared in the abstract, the researcher categorized the dissertation in a column on
the excel sheet with a “0” for quantitative and a “1” for qualitative. If neither of the words
“quantitative” or “qualitative” appeared in the abstract of the dissertation, the researcher looked
for the terms “statistical method” or “non-statistical method.” If “statistical method” was used,
the researcher categorized the dissertation as quantitative. If “non-statistical method” was used,
the researcher categorized the dissertation as qualitative. If neither of the phrases “statistical
method” nor “non-statistical method” were used in the abstract, the researcher looked for the
words “experimental,” “quasi-experimental,” “causal-comparative,” or “correlational.” If any of
these words were used in the abstract, the researcher categorized the dissertation as quantitative.
If these words are not mentioned in the abstract, the researcher looked for the words
“phenomenology,” “grounded theory,” “case study,” “historical,” or “ethnographic.” If any of
61
these words were used in the abstract, the researcher categorized the dissertation as qualitative.
If none of these key words were found in the abstract of the dissertation, the researcher scrolled
to the methodology chapter, Chapter Three, to determine if statistical analysis was used as the
main form of data analysis. If statistical analysis was used as the main form of data analysis, the
dissertation was categorized as quantitative. If the main form of data collection and analysis was
interviews, observations, or focus groups, the dissertation was categorized as qualitative. While
viewing each dissertation, the researcher also noted the page length of the dissertation on a
column in Microsoft Excel as well as the specific methodology (experimental, quasi-
experimental, causal-comparative, correlational, phenomenology, grounded theory, case study,
historical, or ethnographic).
The researcher continued this process until 40 quantitative dissertations and 40
qualitative dissertations were identified for the year. Once all the data was collected for that year
(40 quantitative and 40 qualitative), the researcher then keyed in each candidate’s student
identification number, which was obtained from a list of all candidates who completed
dissertations from the School of Education, into Banner INB. The researcher then recorded the
candidate’s sex, ethnicity, age, and religious affiliation in an Excel sheet. Finally, this process
continued for each year beginning in 2012 to 2016.
Biological sex was determined based on the candidate’s self-reported sex, male or
female, listed on the candidate’s profile in the university’s administrative database. Ethnicity
was also determined based on the candidate’s self-reported ethnicity listed on the candidate’s
profile in the university’s administrative database. The candidate’s age was determined by the
birthdate listed on the university’s administrative database and subtracting it from the year the
candidate’s dissertation was defended. If a candidate was 42 years old or under, he or she was
62
categorized as a traditional student. If a candidate was 43 years old or over, he or she was
categorized as a non-traditional student.
Data Analysis
Descriptive statistics were calculated for each of the variables (biological sex, ethnicity
age, and religious affiliation) using SPSS 23.0. The descriptive statistics included the frequency
count for each category (biological sex, ethnicity age, and religious affiliation).
Predictor Variables
The first predictor variable was biological sex of the dissertation candidate. This variable
is dichotomous (male or female) and was determined based on the self-report of candidate when
applying to the university. This variable was coded as “0” and “1” for female and male,
respectively.
The second predictor variable was the age of the dissertation candidate in years old. This
variable is a categorical variable that indicates if a candidate was a traditional or non-traditional
student based on his or her age at the time of dissertation defense. This was determined by
subtracting the year of the candidate’s birth from the year of dissertation defense. The National
Center for Education Statistics (2015) defined a non-traditional student as a student above the
average age of the program. Thus, any student aged 43 and higher was categorized as a non-
traditional student, and any student with an age under 43 was categorized as a traditional student.
This variable was coded as “0” and “1” for non-traditional student and traditional student,
respectively.
The third predictor variable was the ethnicity of the dissertation candidate. This variable
is nominal and was determined based on the self-report of the candidate when applying to the
university. This variable was coded as “0,” “1,” “2,” “3”, “4,” and “5,”” for Caucasian, African-

63
American, Hispanic, Asian, American Indian, and Not specified, respectively.
The fourth predictor variable was the religious affiliation of the dissertation candidate.
This variable is nominal and was determined based on the self-report of the candidate when
applying to the university. This variable was coded as “0”, and “1” for none and identified with
a faith, respectively. Because there are such a large variety of religious denominations, the
researcher did not differentiate between the type of religious affiliation. The main preposition in
the difference between methodological choices is the worldview differences between individuals
who have a religious affiliation and the scientific community. The positivist worldview is in
direct conflict with the worldview of those of religious affiliation, and thus, for the purposes of
this study, all religious affiliations were included as one group.
Criterion Variable
The criterion variable was dissertation methodology choice. This was defined
dichotomously as either “quantitative” or “qualitative” and coded with “0” for a quantitative
dissertation and “1” for a qualitative dissertation. No candidates in the sample completed a
mixed methods dissertation. A quantitative method is defined as a systematic and objective
method of research that utilizes numerical data to describe variables, observe relationships
among variables, or determine cause and effect relationships between variables (Burns & Grove,
2005). A qualitative method is defined as a method that is “multimethod in its focus, involving
an interpretive, naturalistic approach to its subject matter…qualitative researchers study things in
their natural settings, attempting to make sense of, or interpret phenomena in terms of the
meanings people bring to them” (Denzin & Lincoln, 1994, p. 2).
A logistic regression analysis was used to test the null hypothesis. A Wald ratio was
reported for the logistic regression model. Cox and Snell’s and Nagelkerke’s statistics were used
64
to measure the strength of the model. Logistic regression was used because the criterion variable
is categorical and dichotomous (Gall et al., 2007). This analysis examined if the predictor
variables (biological sex, ethnicity, age, and religious affiliation) can demonstrate a propensity
toward dissertation methodology choice. A logistic regression analysis is a multivariate
correlational statistic that is used for “determining the correlation between a dichotomous
criterion variable and a set of predictor variables” (Gall et al., 2007, p. 354). Because the
criterion variable, dissertation methodology choice, was both categorical and dichotomous
(quantitative or qualitative), a logistic regression analysis was appropriate. Logistic regression
has a few assumptions. First, there should be an absence of multicollinearity between the
predictor variables. However, since the predictor variables were all categorical, this assumption
was not applicable for this study. In order for logistic regression to be robust, there must not be
less than five frequencies for any of the predictor variable categories. As Tabachnick and Fidell
(2012) suggested, the “Other” category was removed from the ethnicity variable, as there were
no individuals who indicated “Other” as their ethnicity.
In addition to the logistic regression analysis, which determined the correlation between
the criterion variable (dissertation methodology choice) and the predictor variables (biological
sex, ethnicity, age, and religious affiliation), odd ratios were also calculated to determine the
chance that each of the predictor variables had on predicting the methodology chosen.
Summary
In Chapter Three, the predictive correlational design was discussed. The research
question and null hypothesis were listed, and the participants and setting, 388 doctoral candidates
at a southeastern university, were described. The instrumentation, which included Banner INB
and the Digital Commons database, was explained. The procedures of the study was also

65
described, including how the sample was selected and how the information for each dissertation
was obtained. Finally, the data analysis was described, including the binary logistics regression
and the predictor and criterion variables.
66
CHAPTER FOUR: FINDINGS
Overview
In Chapter Four, the descriptive statistics will be discussed, as well as the data screening
procedures and the assumptions for logistics regression analysis. The results for the null
hypothesis will be presented, including the logistics regression results and the Chi square and
odds ratios for each predictor variable of biological sex, ethnicity, age, and religious affiliation.
Research Question
RQ1: To what extent can the biological sex, ethnicity, age, and religious affiliation of a
doctoral candidate attending a faith-based university predict the choice of dissertation
methodology (quantitative or qualitative)?
Null Hypothesis
H01: There is no statistically significant relationship between the criterion variable
(dissertation methodology) and the combination of predictor variables (biological sex, ethnicity,
age, and religious affiliation) for a doctoral candidate attending a faith-based university.
Descriptive Statistics
Data were analyzed for the criterion variable, dissertation methodology choice
(quantitative or qualitative), and the results can be viewed in Table 1. After two cases were
removed due to incomplete data, the sample included 388 dissertations. There were 199
quantitative dissertations and 189 qualitative dissertations included in the study. There were 257
female students in the sample and 131 male students. There were 286 Caucasian students, 38
African American students, eight Hispanic students, four Asian students, six American Indian
students, and 46 students with no ethnicity specified. There were 198 non-traditional aged
dissertation authors, which were students aged 43 or older at the time of dissertation defense.
67
There were 190 traditional-aged dissertation authors, which were students below the age of 43 at
the time of dissertation defense. There were 187 students who identified with a religion and 201
who did not identify with a faith. The average page length for a dissertation of either
methodology was 168 pages.
In the quantitative dissertation group, there were 199 quantitative dissertations included
in the sample. Within the quantitative dissertation authors, there were 132 female candidates and
67 male candidates. There were 143 Caucasian, 23 African American, two Hispanic, three
Asian, three American Indian, and 25 ethnicity not specified quantitation dissertation authors.
There were 95 non-traditional aged dissertation candidates and 104 traditional-aged quantitative
dissertation authors. There were 101 candidates who did not identify with a religion and 98 who
did identify with a religion. There were 71 students who used a causal comparative research
method, 75 who used a correlational research method, two who used a descriptive research
method, eight who used an experimental research method, two who used an instrument
development method, 38 who used a quasi-experimental research method, and three who used an
“other” research method. These three methods that were categorized as “other” included a
corpus analysis, a single subject study, and a survey research study.
In the qualitative dissertation group, there were 189 qualitative dissertations included in
the sample. Within the qualitative dissertation authors, there were 125 female candidates and 64
male candidates. There were 143 Caucasian, 15 African American, six Hispanic, one Asian,
three American Indian, and 21 ethnicity not specified qualitative dissertation authors. There
were 103 non-traditional aged dissertation students and 86 traditional-aged qualitative
dissertation authors. There were 100 students who did not identify with a religion and 89 who
did identify with a religion. Within the qualitative methodology, there were 53 students who
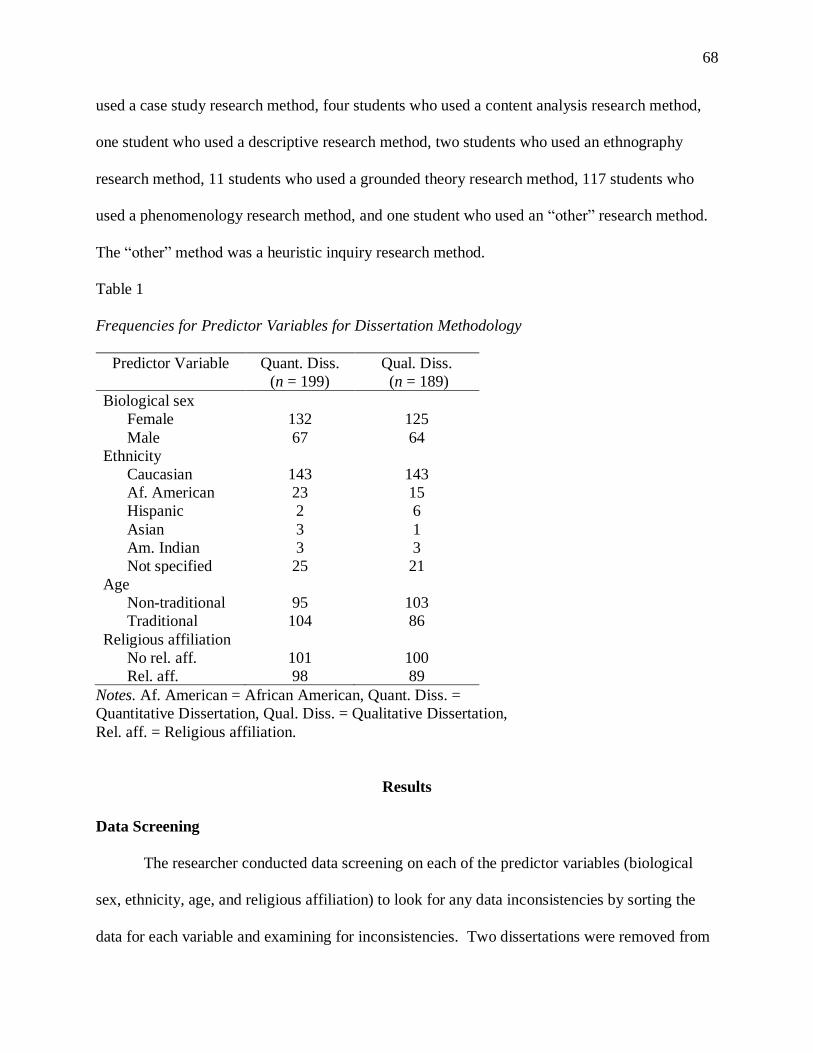
68
used a case study research method, four students who used a content analysis research method,
one student who used a descriptive research method, two students who used an ethnography
research method, 11 students who used a grounded theory research method, 117 students who
used a phenomenology research method, and one student who used an “other” research method.
The “other” method was a heuristic inquiry research method.
Table 1
Frequencies for Predictor Variables for Dissertation Methodology
Predictor Variable Quant. Diss.
(n = 199)
Qual. Diss.
(n = 189)
Biological sex
Female
Male
132
67
125
64
Ethnicity
Caucasian
Af. American
Hispanic
Asian
Am. Indian
Not specified
143
23
2
3
3
25
143
15
6
1
3
21
Age
Non-traditional
Traditional
95
104
103
86
Religious affiliation
No rel. aff.
Rel. aff.
101
98
100
89
Notes. Af. American = African American, Quant. Diss. =
Quantitative Dissertation, Qual. Diss. = Qualitative Dissertation,
Rel. aff. = Religious affiliation.
Results
Data Screening
The researcher conducted data screening on each of the predictor variables (biological
sex, ethnicity, age, and religious affiliation) to look for any data inconsistencies by sorting the
data for each variable and examining for inconsistencies. Two dissertations were removed from
69
the sample due to incomplete data: one qualitative dissertation and one quantitative dissertation.
After thorough data screening, the researcher identified a data error in coding one data point and
corrected the inconsistency. The researcher did not identify any other data errors or
inconsistencies. After the two cases were removed, the resulting sample size was 388.
Assumptions
According to Warner (2008), there are four assumptions required for logistics regression.
First, the criterion variable must be dichotomous; the criterion variable in this study is
dissertation methodology, which is dichotomous with the two options of quantitative or
qualitative. Second, there must be an absence of multicollinearity among the predictor variables.
However, since each of the predictor variables in this study was categorical, multicollinearity
could not be determined and thus, is not applicable to this study. Third, Warner (2008) stated
that the model must be specified and include all relevant variables and no irrelevant variables.
After an exhaustive literature review, the researcher chose the predictor variables of biological
sex, ethnicity, age, and religious affiliation. Based on the literature review, these variables are
relevant and no other relevant variables could be added to the model. Fourth, Warner (2008)
stated that the “categories on the outcome variable are assumed to be exhaustive and mutually
exclusive” (p. 932). Each dissertation was either quantitative or qualitative; no dissertations
were considered both quantitative and qualitative. When a dissertation was considered one
methodology, it was impossible to be considered the other methodology. In this study, all
assumptions required by Warner (2008) were met. Warner (2008) also noted that a binary
logistics regression does not perform well when many groups have frequencies less than five. In
this study, it should be noted that there were only four candidates with an Asian ethnicity, which
is less than the recommended five. However, this was the only group with a frequency less than
70
five; there were not many groups with a frequency less than five as cautioned by Warner (2008).
In addition, Vittinghoff and McCulloch (2006) found that groups with low frequencies are
acceptable provided that the model is stable. They recommended that the frequency count
assumption for predictor variables be relaxed in logistic regression analysis. In this study, the
model was stable, and thus, the group of candidates with an Asian ethnicity remained in the
model.
Results for Null Hypothesis
A binary logistic regression analysis was used to test the relationship between the
predictor variables (biological sex, ethnicity, age, and religious affiliation) and the criterion
variable (dissertation methodology) at a 95% confidence level. The categorical variables were
dummy-coded. Dissertation methodology was coded as “0” for quantitative and “1” for
qualitative. Biological sex was coded as “0” for female and “1” for male. Ethnicity was coded as
“0,” “1,” “2,” “3”, “4,” and “5,” for Caucasian, African-American, Hispanic, Asian, American
Indian, and Not specified, respectively. Age was coded as “0” for traditional students and “1”
for non-traditional students. According to the U.S. Department of Education (2008), the average
age of a student in an EdD program is 42.3 years old. The National Center for Education
Statistics (2015) defined a non-traditional student as a student above the average age of the
program. Thus, any student aged 43 and older and above was categorized as a non-traditional
student, and any student with an age under 42 and younger was categorized as a traditional
student. Religious affiliation was coded as “0” and “1” for none and identified with a faith,
respectively.
The results of the binary logistic regression were not statistically significant, 2(8) = 6.34,
p = .61. The model was extremely weak according to Cox and Snell’s (R2 = .016) and

71
Nagelkerke’s (R2 = .022) (see Table 2). The model did not hold, and there was no statistically
significant, predictive relationship between dissertation methodology choice (quantitative or
qualitative) and the predictor variables (biological sex, ethnicity, age, religious affiliation).
Thus, the researcher failed to reject the null hypothesis.
Table 2
Logistic Regression Model Analysis
2 p Cox & Snell R2 Nagelkerke’s R2
6.34 .61 .016 .022
The researcher further investigated each predictor variable. For the variable of biological
sex, the Wald ratio was not statistically significant, 2(1) = .01, p = .91. This result indicated
that dissertation methodology choice between males and females was not statistically significant.
The odds ratio for biological sex was 1.03 indicating that females were 1.03 times more likely to
choose a quantitative methodology than males. However, this relationship was too small to be
considered statistically significant, as indicated by the Wald statistic.
The researcher also investigated the predictor variable of ethnicity. Overall, the predictor
variable of ethnicity was not statistically significant, 2(5) = 3.97, p = .55. In addition, none of
the Wald ratios for any ethnic groups were statistically significant. For students with a
Caucasian ethnicity, the Wald ratio was not statistically significant, 2(1) = .96, p = .33. The
odds ratio for Caucasian students was .69, indicating that Caucasian students were .69 times
more likely to choose a quantitative methodology. For students with an African American
ethnicity, the Wald ratio was not statistically significant, 2(1) =.35, p = .56. The odds ratio for
African American students was 1.21, indicating that African American students were 1.21 times
72
more likely to choose a quantitative methodology. For students with a Hispanic ethnicity, the
Wald ratio was not significant, 2(1) = .188, p = .67. The odds ratio for Hispanic students was
.821, indicating that Hispanic students were .821 times more likely to choose a quantitative
methodology. For students with an Asian ethnicity, the Wald ratio was not significant, 2(1) =
2.16, p = .14. The odds ratio for Asian students was 3.59, indicating that Asian students were
3.59 times more likely to choose a quantitative methodology. For students with an American
Indian ethnicity, the Wald ratio was also not significant, 2(1) = .43, p = .51. The odds ratio for
American Indian students was .46, indicating that American Indian students were .46 times more
likely to choose a quantitative methodology. Finally, for students who did not specify their
ethnicity, the Wald ratio was also not significant, 2(1) = .03, p = .855. The odds ratio for
students who did not specify their ethnicity was 1.17, indicating that students that did not specify
their ethnicity were 1.17 times more likely to choose a quantitative methodology.
The researcher also examined age. For the variable of age, the Wald ratio was not
statistically significant, 2(1) = 1.24, p = .27. This result indicates that there was no significant
relationship in dissertation methodology choice between traditional students (42 and younger)
and non-traditional students (age 43 and older). The odds ratio for age was 1.26, indicating that
traditional students were 1.26 times more likely to choose a quantitative methodology than non-
traditional students. However, this relationship was too small to be considered statistically
significant, as indicated by the Wald statistic.
Finally, the researcher investigated religious affiliation. For the variable of religious
affiliation, the Wald ratio was not statistically significant, 2(1) = .17, p = .68. This result
indicates that there was no significant difference in dissertation methodology choice between
students who are affiliated with a religious and those who are not affiliated with a religion. The
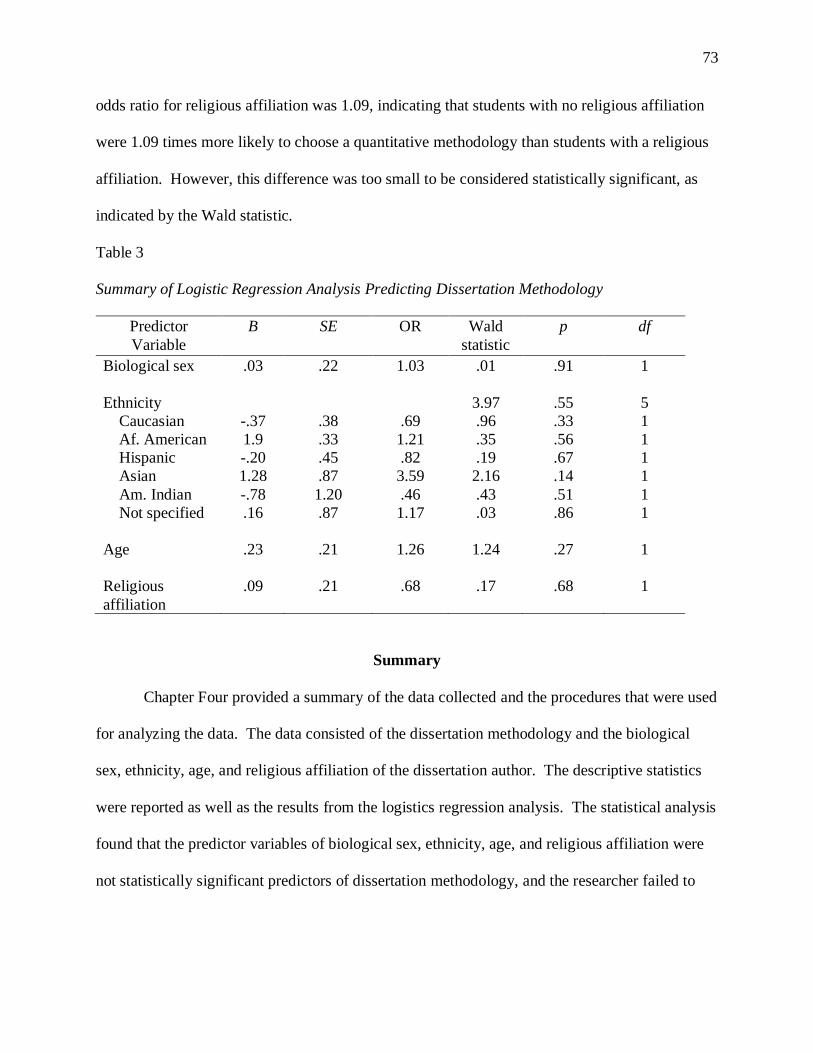
73
odds ratio for religious affiliation was 1.09, indicating that students with no religious affiliation
were 1.09 times more likely to choose a quantitative methodology than students with a religious
affiliation. However, this difference was too small to be considered statistically significant, as
indicated by the Wald statistic.
Table 3
Summary of Logistic Regression Analysis Predicting Dissertation Methodology
Predictor
Variable
B SE OR Wald
statistic
p df
Biological sex .03 .22 1.03 .01 .91
1
Ethnicity
Caucasian
Af. American
Hispanic
Asian
Am. Indian
Not specified
-.37
1.9
-.20
1.28
-.78
.16
.38
.33
.45
.87
1.20
.87
.69
1.21
.82
3.59
.46
1.17
3.97
.96
.35
.19
2.16
.43
.03
.55
.33
.56
.67
.14
.51
.86
5
1
1
1
1
1
1
Age .23 .21 1.26 1.24 .27
1
Religious
affiliation
.09 .21 .68 .17 .68 1
Summary
Chapter Four provided a summary of the data collected and the procedures that were used
for analyzing the data. The data consisted of the dissertation methodology and the biological
sex, ethnicity, age, and religious affiliation of the dissertation author. The descriptive statistics
were reported as well as the results from the logistics regression analysis. The statistical analysis
found that the predictor variables of biological sex, ethnicity, age, and religious affiliation were
not statistically significant predictors of dissertation methodology, and the researcher failed to

74
reject the null hypothesis. Chapter Five will discuss these statistical findings in relation to the
related research and the implications of these results.
75
CHAPTER FIVE: CONCLUSIONS
Overview
Chapter Five will discuss the results of the statistical analysis and the implications of
those results in light of related research. In addition, limitations of the study will be examined
and suggestions for future research will be recommended.
Discussion
The purpose of this archival, predictive correlational study was to examine the effect of
biological sex, ethnicity, age, and religious affiliation on dissertation methodology choice among
doctoral candidates in the School of Education at a faith-based university. The criterion variable
was dissertation methodology (quantitative or qualitative). Quantitative research is defined as a
systematic and objective method of research that utilizes numerical data to describe variables,
observe relationships among variables, or determine cause and effect relationships between
variables (Burns & Grove, 2005), and qualitative research is defined as using an interpretive
approach to study phenomena in their natural settings and “attempting to make sense of, or
interpret phenomena in terms of the meanings people bring to them” (Denzin & Lincoln, 1994, p.
2).
The predictor variables were the candidate’s biological sex (male or female), ethnicity,
age, and religious affiliation. Biological sex was defined as male or female (American
Psychological Association, 2011) as self-reported on each candidate’s university records.
Ethnicity was defined as “the social group a person belongs to, and either identifies with or is
identified with by others, as a result of a mix of cultural and other factors including language,
diet, religion, ancestry, and physical features traditionally associated with race” (Bhopal, 2004, p.
443). Age was defined as the age of the candidate in years old at the time of the dissertation
76
defense. Religious affiliation is defined as “an organized system of practices and beliefs in which
people engage” (Mohr, 2006, p. 174). A candidate’s religious affiliation was measured through
their self-reported religious affiliation in their application to the university.
Biological Sex and Methodology Choice
Research suggests that qualitative research embodies more feminine characteristics such
as a focus on interpersonal relationships and an underlying constructivist approach (Creswell,
2013; Lincoln & Guba, 1985), but research has also indicated that women are over-represented
as authors of qualitative studies (Plowman & Smith, 2011). Plowman and Smith (2011) studied
published research journal studies, not dissertations, and although their study was published in
2011, the data they collected was from a 22-year period from 1986-2008. In this study, when
looking at candidates’ dissertations, males and females were equally as likely to conduct a
quantitative or qualitative study. This was in contradiction to Plowman and Smith’s (2011)
findings. This may be explained due to an overall increase in qualitative research within recent
years and because women may be more willing to overcome any math anxiety.
As Rone (1998) indicated, qualitative research has been steadily increasing since 1980,
quickly becoming a research method used as much as the more traditional quantitative method,
especially in the social science and education fields. Because this study collected data from
2012-2016, it includes much more recent data. This research was also collected from only EdD
doctoral candidates, which is one of the fields where qualitative research is most popular (Rone,
1998). It is possible that qualitative research is continuing to rise in popularity and is becoming a
more often used methodology for males as well as females.
Regarding math anxiety and women, a dissertation is usually divided into five chapters:
introduction, literature review, methods, analysis, and discussion. Even though a quantitative
77
methodology is based in a positivist philosophical approach (Sale et al., 2002) which differs from
the qualitative constructivist approach (Creswell, 2013), three of the five chapters of the
dissertation are structured and written the same in both qualitative and qualitative studies
(Bloomberg & Volpe, 2015). Although research has shown that women have higher levels of
math anxiety than men and pursue degrees in mathematical fields at a much lower percentage
than men (Cheryan, 2012; Nelson & Brammer, 2008), because the quantitative dissertation only
includes math-related concepts in two of the five chapters, women may be more willing to
overcome any math anxiety for just two chapters of a dissertation than they would be for a career
or advanced degree in a math-related field.
Ethnicity and Methodology Choice
In this study, ethnicity was not found to be a statistically significant predictor of
dissertation methodology choice. Although previous research has found that several ethnic
minorities experience more stereotype threat, higher mathematics anxiety, and lower
mathematics attitudes than Caucasians or Asians (Bell, 2003; Bui & Alfaro, 2011; Lockhead et
al., 1985; Onwuegbuzie & Wilson, 2003; Upadyaya & Eccles, 2014; Wilson & Milson, 1993),
this study did not find that this translated into more qualitative dissertation methodologies for
candidates of any specific ethnic minority. Previous research has also indicated that individuals
of an ethnic minority tend to avoid math and science majors (Tobias, 1976). However, much of
the research in this area is outdated, and although avoidance of careers and major areas of study
in the mathematics field is documented in prior research, in this study, individuals of some ethnic
minorities were just as likely to complete quantitative dissertations as individuals of Caucasian
descent. This could be an indication of the mathematics anxiety, achievement, and attitudes gap
78
closing, or it could be indicative that these candidates were able to overcome their anxiety
regarding the two chapters of the dissertation related to mathematics.
Age and Methodology Choice
Although statistics anxiety is higher in older, non-traditional students compared to
traditional students (Baloglu, 2003), in this study non-traditional students were just as likely to
choose a quantitative dissertation methodology as traditional students. In Baloglu’s study, it was
found that older students had higher statistics anxiety than younger students, but older students
had more positive attitudes towards statistics than younger students. Baloglu noted that older
students recognized the value and usefulness of statistics. Even though the non-traditional
students’ statistics anxiety may have been higher based on previous research, there was not a
statistically significant relationship between their methodology choice and age. As previously
mentioned, two of the five dissertation chapters includes statistical analyses in a quantitative
dissertation. It could be that non-traditional students understand the value of statistics and the
quantitative methodology and persist through any statistics anxiety in the chapters in the
dissertation that require statistics.
Religion and Methodology Choice
In this study, religious affiliation was not found to be a statistically significant predictor
of dissertation methodology choice. Even though quantitative methodologies are based in
positivism, which conflicts with the worldview of most religions, candidates at this university
with a religious affiliation were not less likely to choose a quantitative dissertation methodology.
It could be that using a positivist approach in a dissertation could be separate from an
individual’s personal worldview. As Taber et al. (2011) found, some students believe that
science, which is both positivist and focused on empirical and quantitative studies, supports their
79
faith. Taber et al. (2011) also found that many students compartmentalize science and religion.
This could be the case for the candidates in this study; the choice of a quantitative methodology
that is based in positivism is compartmentalized from their religious affiliation. Thus, their
positivist, quantitative study is unrelated to and compartmentalized from their religion and
personal, theistic worldview. In this study candidates who identified with a religious affiliation
were just as likely to choose a quantitative dissertation methodology as those who did not.
Overrepresentation of Females
One finding in this study was the much higher number of females completing the EdD
program at this university compared to males. There were 257 females and 131 males in the
random sample, indicating that the number of females in the EdD completing a dissertation
almost doubled the number of males in the program in the years 2012-2016. Although this is a
particularly large gender gap, there is evidence in research that women now represent the
majority of college students. According to the National Center for Educational Statistics
(2016b), in 2016, there were 11.7 million females attending college and only 8.8 million males.
This is a gender-gap reversal from the 1970s, where approximately 58% of all college students
were male (Bae, Choy, Geddes, Sable, & Snyder, 2000). Human capital theory explains how
education is based on investment. Basically, individuals risk a short-term loss of resources,
which is indicative of the choice to complete a graduate degree, for a long-term gain (Russell,
2013). Although there are various gains in completing a doctoral degree, including intrinsic
gains, a prominent motivation to complete a post-graduate degree is the economic gain based on
a higher salary and more prominent occupational position. Despite the reverse gender gap in
higher education and that there are more women who persist in higher education degrees and
enroll in graduate school than men, there is still a significant pay gap between men in women in
80
the United States. In 2015, men were paid 20% more than women (American Association of
University Women [AAUW], 2016). Although this gap has narrowed, at the current rate, women
will not reach pay equity with men until 2059 (AAUW, 2016). Some scholars have suggested
that the overrepresentation of women in higher education is partially due to their need of higher
labor-market opportunities (DiPrete & Buchmann, 2006). Because men are already paid more in
the labor market, women find it necessary to invest in their education in order to obtain job
opportunities at a higher level.
Because this research only involved EdD candidates, women could also be
overrepresented in the EdD program because of the higher number of women in the education
field. Women make up 76% of teachers (U.S. Department of Education, National Center for
Education Statistics) and 65% of public, K-12 school principals (Bureau of Labor Statistics, U.S.
Department of Labor, 2016). According to Perry (2013), women completed 68% of education
doctoral degrees. Women also completed 52% of all doctoral degrees in 2012; thus, women are
completing more doctoral degrees then men both overall and in the education field (Perry, 2013).
The percentage of women completing education doctoral degrees compared to men (68%) is
higher than the percentage of women who are K-12 school administrators, but lower than the
percentage of women who are employed as K-12 teachers (76%). Although this study found a
higher number of women completing the EdD program, more research is needed to determine
why women have shifted to completing doctoral degrees at a higher rate than men; in the 1990s,
women completed approximately 49% of all education doctoral degrees (Nelson & Coorough,
1994), which is significantly less than the current 68% (Perry, 2013).
81
Rise of Qualitative Research
The results of this study indicated that the use of qualitative research may be on the rise,
just as previous studies have suggested (Nelson & Coorough, 1994). Except for the year 2013,
where there were only 30 qualitative studies completed compared to 40 quantitative studies, the
number of qualitative studies completed was approximately the same as the number of
quantitative studies in this sample. In 1973, only 7% of dissertations utilized a qualitative
methodology (Wick & Dirkes, 1973), and other researchers found in 1980-1993, as low as only
3% of dissertations used qualitative research (Nelson & Coorough, 1994). In a study conducted
by using a sample of EdD dissertations from 1998-2002, Kontorski and Stegman (2002) found
that 28.87% of the EdD dissertations were qualitative, and similarly, Benson, Chik, Gao, Huang,
and Wang (2009) found that 22% of articles published in education journals were qualitative in
design between the years 1997 and 2006. Rone (1998) found in 1998 that qualitative
methodologies were increasing and expected them to continue to increase in popularity. Flinders
and Richardson (2002) suggested that qualitative research grew so quickly in the 1990s and early
21st century that “it is difficult to find a more prominent trend in the field of education” (p.
1159). As Alasuutari (2010) suggested, a shift in cultural and political worldviews may be a
reason that qualitative research has risen in popularity; the postmodern culture shift has caused
more interest in subjective human views, or verbal data, as described by Flinders and Richardson
(2002), rather than just empirical, positivist studies using numerical data.
Implications
This research contributes to the knowledge base of methodology choice. Plowman and
Smith (2011) provided a study that looked in-depth at the methodology choices of males and
females in various professional journals. Although this study contradicts the results of that
82
study, it answers the call for additional research in this area. This study is also the first known
study that examines the combination of biological sex, ethnicity, age, and religious affiliation in
the context of methodology choice. Although much research has examined these variables in
regards to mathematics anxiety, attitudes, and achievement, this study is unique that it examines
the combination of these variables in the context of dissertation methodology choice. Using
intersectionality as a framework, this study considers the interactions of these dimensions of
identity and the relationship that they have on methodology choice. Research that studies
intersectionality in relationship to methodology choice is lacking, and this study adds to the
knowledge base of intersectionality and the dimensions of identity that affect choices of
individuals.
As Flynn et al. (2012) discussed, the dissertation process is extremely important in
doctoral programs. The dissertation allows candidates to become self-directed learners, develops
candidates into researchers, and allows for new developments in various fields of study. As
Flynn et al. (2012) also noted, the dissertation phase of a doctoral program is where candidates
are most at risk of dropping out of the program. The lack of research in the dissertation is
problematic, especially considering the importance of the dissertation in doctoral programs. This
study adds to the knowledge base of the dissertation process and provides a starting point for
other areas that need more research.
The finding of high number of females in EdD programs has implications for higher
education. This higher-education gender gap reversal has several implications for higher
education administration and researchers. The motivation of applicants to EdD programs should
be examined to determine how to recruit both males and females into EdD programs. As Bae et
al. (2000) discussed, the gains of women in education should be celebrated, including their
83
higher rates of persistence, application, and achievement in higher education, but higher
education administration should make it a priority for their programs to attract both men and
women and assist both men and women to succeed while completing these programs.
Limitations
All of the doctoral candidates in this study were from one university. As Kitch and
Fonow (2012) found in their study, some schools have a tendency to have a “signature”
methodology. In this particular university’s EdD program, the most popular methodology was a
qualitative phenomenology with 117 dissertations in this study’s sample produced utilizing this
methodology. Since this study only examined one university’s EdD program, it is possible that
in this particular university, one methodology may be more encouraged than the other, which
would skew the results of this study. Thus, the results of this study may not be generalizable to
all EdD programs.
Not all students in this study indicated a religious affiliation. Upon application to the
university, students filled out a survey indicating their religious affiliation, and included as
options were many different religions, denominations, an “Other” category, and a “None”
category. However, many students declined to answer this particular question. The lack of
answer of this question could have skewed the sample for religious affiliation in this study.
Some students may have felt uncomfortable sharing their affiliation and did not answer, even if
they were affiliated with a religion.
Recommendations for Future Research
There are several areas related to this study where future research is recommended.
Because this study only examined dissertations from one university, it would be beneficial for
similar studies to be conducted at other universities to see if the results are similar. As indicated
84
by Kitch and Fonow (2012), some universities have a tendency to have a “signature”
methodology, where more students gravitate towards a particular methodology based on
curriculum and peer support. This could have been a hindrance to this particular study’s
prediction model.
In addition, the high number of females in this EdD program and in higher education in
general is an area that calls for more research. Studies that focus on males in EdD programs
would be beneficial for university administration to understand their motivations for entering the
program. In addition, studies focusing on females and their motivation for completing an EdD
program in the context of human capital theory could investigate whether the underlying
economic reasons for the reverse-gender gap. Studies regarding the persistence of both men and
women in EdD programs would shed light on if more women than men are applying to EdD
programs or if more women than men are persisting through EdD programs. Finally, research
regarding the differences in females in males in PhD programs versus EdD programs should be
examined, especially in regards to persistence and career aspirations; with the overrepresentation
of women in the K-12 teaching field (U.S. Department of Education, National Center for
Education Statistics, 2014) but the overrepresentation of men in both K-12 and collegiate
administration (Glass, n.d.), research on both the PhD and EdD degrees is needed.
Summary
Chapter Five discussed the findings of the study in regards to the research question and
null hypothesis. The null hypothesis was not rejected, and there was no significant relationship
between dissertation methodology choice and biological sex, ethnicity, age, and religious
affiliation. The finding of more females in the EdD program was overviewed, and the
implications, both empirically and practically, was examined. Limitations of the study were

85
discussed, including that only one university was included in the study and that many students
did not indicate their religious affiliation. In addition, recommendations for future research in
areas related to this study were suggested.

86
REFERENCES
Acker, J. (1990). Hierarchies, jobs, bodies: A theory of gendered organization. Gender and
Society, 4(2), 139-158.
Acker, J. (2006). Inequality regimes: Gender, class, and race in organizations. Gender and
Society, 20(4), 441-464.
Adams, J. (2007). Stained glass makes the ceiling visible: Organizational opposition to women
in congregational leadership. Gender and Society, 21(1), 80-105.
Alasuutari, P. (2010). The rise and relevance of qualitative research. International Journal of
Social Research Methodology, 13(2), 139-155.
American Association of University Women [AAUW]. (2016). The truth about the gender pay
gap (Fall 2016). Retrieved from http://www.aauw.org/research/the-simple-truth-about-
the-gender-pay-gap/
American Psychological Association (2011). Definition of terms: Sex, gender identity, sex
orientation. Retrieved from https://www.apa.org/pi/lgbt/resources/sexuality-
definitions.pdf
Arifeen, S.R., & Gatrell, C. (2013). A blind spot in organization studies: Gender with ethnicity,
nationality and religion. Gender in Management: An International Journal, 28(3), 151-
170.
Aronson, J., Fried, C.B., & Good, C. (2002). Reducing the effect of stereotype threat on African
American college students by shaping theories of intelligence. Journal of Experimental
Social Psychology, 38(1), 113-125.
Astley, J., & Francis, L.J. (2010). Promoting positive attitudes towards science and religion
among sixth-form pupils: Dealing with scientism and creationism. British Journal of
87
Religious Education, 32(3), 189-200.
Bae, Y., Choy, S., Geddes, C., Sable, J., & Snyder, T. (2000). Trends in educational equity of
girls and women. Washington, DC: National Center for Education Statistics.
Baloglu, M. (2003). Individual differences in statistics anxiety among college students.
Personality and Individual Differences, 34(1), 855-865.
Barry, H., Bacon, M.K., & Child, I.L. (1957). A cross-cultural survey of some sex differences in
socialization. Journal of Abnormal and Social Psychology, 55(1), 327-332.
Beilock, S.L.,, Gunderson, E.A., Ramirez, G., & Levine, S.E. (2010). Female teachers’ math
anxiety affects girls’ math achievement. Proceedings of the National Academy of
Sciences, 107(5), 1860-1863.
Bell, J.A. (2003). International students have statistics anxiety too. Education, 118(4), 634-636.
Bean, J.P., & Metzner, B.S. (1985). A conceptual model of nontraditional undergraduate student
attrition. Review of Educational Research, 55(4), 484-540.
Bhopal, R. (2004). Glossary of terms relating to ethnicity and race: For reflection and debate.
Journal of Epidemiology & Community Health, 58, 441-445. Retrieved from
http://jech.bmj.com/content/58/6/441.full
Bloomberg, L.D., & Volpe, M. (2015). Completing your qualitative dissertation: A road map
from beginning to end. Thousand Oaks, CA: Sage Publications, Inc.
Boote, D.N., & Beile, P. (2005). Scholars before researchers: On the centrality of the dissertation
literature review in research preparation. Educational Researcher, 34(6), 3-15.
Borders, L.D., Wester, K.L., Fickling, M.J., & Adamson, N.A. (2015). Dissertations in
CACREP-accredited counseling doctoral programs: An initial investigation. The Journal
of Counselor Preparation and Supervision, 7(3). Retrieved from
88
http://repository.wcsu.edu/cgi/viewcontent.cgi?article=1102&context=jcps
Bowleg, L. (2008). When black+lesbian+woman ≠ black lesbian woman: The methodological
challenges of qualitative and quantitative intersectionality research. A Journal of
Research, 59(1), 312-325.
Bridgeman, B., & Lewis, C. (1996). Gender differences in college mathematics grades and SAT-
M scores: A reanalysis of Wainer and Steinberg. Journal of Educational Measurement,
33(3), 257-270.
Broverman, I.K., Vogel, S.R., Broverman, D.M., Clarkson, F.E., & Rosenkrantz, P.S. (1972).
Sex role stereotypes: A current appraisal. Journal of Social Issues, 28(1), 59-78.
Buchanan, D.A., & Bryman, A. (2007). Contextualizing methods choice in organizational
research. Organization Research Methods, 10(3), 483-501.
Bui, H.B., & Alfaro, M.A. (2011). Statistics anxiety and science attitudes: Age, gender, and
ethnicity factors. College Student Journal, 45(3), 573-585.
Burns, N., & Grove, S.K. (2005). The practice of nursing research: Conduct, critique, and
utilization. (5th ed.). St. Louis: Saunders.
Campbell, K., & Evans, C. (1997). Gender issues in the classroom: A comparison of
mathematics anxiety. Education, 117(3), 332-339.
Campbell, P.B. (1991). So what do we do with the poor, non-white female? Issues of gender,
race, and social class in mathematics and equity. Peabody Journal of Education, 66(2),
95-112.
Ceci, S.J., Williams, W.M., & Barnett, S.M. (2009). Women's underrepresentation in science:
Sociocultural and biological considerations. Psychological Bulletin, 135(2), 218-261.
Cejka, M.A., Eagly, A.H. (1999). Gender-stereotypic images of occupations correspond to the
89
sex segregation of employment. Personality and Social Psychology Bulletin, 25(4), 413-
423.
Cemen, P.B. (1987). The nature of mathematics anxiety. Stillwater, OK: Oklamhoma State
University (ERIC Document Reproduction Service No. ED 287 729).
Cheryan, S. (2012). Understanding the paradox in math-related fields: Why do some gender gaps
remain while others do not? Sex Roles, 66(1), 184-190.
Cho, F. (2012). The limits of the Buddhist embrace of science. Science and Engineering Ethics,
18(3), 539-542.
Clance, P.R., & Imes, S.A. (1978). The imposter phenomenon in high achieving women:
Dynamics and therapeutic intervention. Psychotherapy: Theory, research and practice,
15(3), 241-247.
Cole, E.R. (2009). Intersectionality and research in psychology. American Psychologist, 64, 459-
473.
Collins, P.H. (1998). It’s all in the family: Intersections of gender, race, and nation. Hypatia,
13(3), 62-82.
Cray, D., Dawkins, R., & Collins, F. (2006). God vs. science. Time. Retrieved from
http://www.time.com/time/printout/0,8816,1555132,00.html
Crenshaw, K. (1989). Demarginalizing the intersection of race and sex: A black feminist critique
of antidiscrimination doctrine, feminist theory, and antiracist politics. University of
Chicago Legal Forum, 1989, 139-167.
Creswell, J.W. (2013). Qualitative inquiry & research design: Choosing among five approaches.
(3rd ed.). Thousand Oaks, CA: Sage Publications, Inc.
Cruise, R.J., Cash, R.W., & Bolton, D.L. (1985). Development and validation of an instrument to
90
measure statistical anxiety. Paper presented at the annual meeting of the American
Statistical Association: Las Vegas, NV.
Cvencek, D., Meltzoff, A.N., & Greenwald, A.G. (2011). Math-gender stereotypes in elementary
school children. Child Development, 82(3), 766-779.
Davis, K. (2008). Intersectionality as buzzword: A sociology of science perspective on what
makes a feminist theory successful. Feminist Theory, 9(1), 67-85.
Dawkins, R. (1998). Unweaving the rainbow: Science, delusion, and the appetite for wonder.
London: Penguin.
Deaux, D. (1976). Sex and the attribution process. In J.H. Harvey, W.J. Ickes, & R.F. Kidd
(Eds.). New directions in attribution research. New York, Halsted Press Division.
Deaux, K., & Major, B. (1977). Sex-related patterns in the unit of perception. Personality and
Social Psychology Bulletin, 3(1), 297-300.
Denzin, N.K., & Lincoln, Y.S. (1994). Handbook of qualitative research. Thousand Oaks, CA:
Sage.
Desy, E., Peterson, S., & Brockman, V. (2009). Attitudes and interests among university students
in introductory nonmajor science courses: Does gender matter? Journal of College
Science Teaching, 29(2), 16-23.
Dijksterhuis, A., & Barg, J.A. (2001). The perception-behavior expressway: Automatic effects of
social perception on social behavior. In M.P. Zanna (Ed.), Advances in experimental
social psychology (pp. 1-40). San Diego, CA: Academic Press.
DiPrete, T.A., & Buchmann, C. (2006). Gender-specific trends in the value of education and the
emerging gender gap in college completion. Silver Spring, 43(1), 1-24.
Dweck, C.S. (2006). Is math a gift? Beliefs that put females at risk. In Ceci, S.J. & Williams,
91
W.M, Why aren’t more women in science: Top researchers debate the evidence (pp. 47-
55). Washington, DC: American Psychological Association.
Eccles, J.S. (1993). School and family effects on the ontogeny of children’s interests, self-
perceptions, and activity choices. In J.E. Jacobs (Ed.), Nebraska symposium on
motivation: Developmental perspectives on motivation (pp. 145-208). Lincoln: University
of Nebraska Press.
Eccles, J.S. (1987). Gender roles and women’s achievement-related decisions. Psychology of
Women Quarterly,11, 135-172.
Eccles, J.S., & Jacobs, J.E. (1986). Social forces shape math attitudes and performance. Signs,
11, 367-380.
Eccles, J.S., Jacobs, J.E., & Harold, R.D. (1990). Gender role stereotypes, expectancy effects,
and parents’ socialization of gender differences. Journal of Social Issues, 46, 183-201.
Eccles, J.S., & Wigfield, A. (2002). Motivational belief, values, and goals. Annual Review of
Psychology, 53, 109-132.
Elliott, J.C. (1990). Affect and mathematics achievement of nontraditional college students.
Journal for Research in Mathematics Education, 21(2), 160-165.
Else-Quest, N.M., Mineo, C.C., & Higgins, A. (2013). Math and science attitudes and
achievement at the intersection of gender and identity. Psychology of Women Quarterly,
37(3), 293-309.
Entwisle, D.R., & Alexander, K.L. (1988). Factors affecting achievement test scores and marks
received by black and white first graders. Elementary School Journal, 88, 449-471.
Entwisle, D., Alexander, K., & Olson, L.S. (1994). The gender gap in mathematics: Its possible
origins in neighborhood effects. American Sociological Review, 59, 822-838.
92
Erikson, E.H. (1968). Identity: Youth and crisis. New York: Norton.
Fennema, E., Peterson, P.L., Carpenter, T.P., & Lubinski, C.A. (1990). Teachers’ attributions
and beliefs about girls, boys, and mathematics. Educational Studies in Mathematics,
21(1), 55-69.
Fleming, M.L., & Malone, M.R. (1983). The relationship of student characteristics and student
performance in science as viewed by meta-analysis research. Journal of Research in
Science Teaching, 20(5), 481-495.
Flinders, D.J., & Richardson, C.P. (2002). Contemporary issues in qualitative research and music
education. In R. Colwell & C.P. Richardson (Eds.), The new handbook of research on
music teaching and learning (pp. 1159-1176). New York: Oxford University Press.
Flynn, S.V., Chasek, C.L., Harper, I.F., Murphy, K.M., & Jorgensen, M.F. (2012). A qualitative
inquiry of the counseling dissertation process. Counselor Preparation, 51, 242-255.
Francis, L.J., & Greer, J.E. (1999). Measuring attitude towards science among secondary school
students: The affective domain. Research in Science and Technological Education, 17(1),
219-226.
Gall, M.D., Gall, J.P., & Borg, W.R. (2007). Educational research: An introduction. (8th ed.).
Boston: Pearson.
Gilligan, C. (1982). In a different voice: Psychological theory and women’s development.
Cambridge, MA: Harvard University Press.
Glass, T.E. (n.d.). Where are all the women superintendents? The School Superintendents
Association. Retrieved from http://aasa.org/SchoolAdministratorArticle.aspx?id=14492
Goodrich, K.M., Shin, R.Q., & Smith, L.C. (2011). The doctorate in counselor education:
Peeling back the curtain. International Journal for the Advancement of Counseling, 33,
93
184-195.
Grabner, R.H., Stern, E., & Neubauer, A.C. (2003). When intelligence loses its impact: Neural
efficiency during reasoning in a familiar area. International Journal of Psychophysiology,
49, 89-98.
Graham, H. (1983). Do her answers fit his questions? Women and the survey method. In E.
Gramarnikow, D. Morgan, J. Purvis, & D. Taylorson (Eds.). The public and the private
(pp. 132-147). London: Heinemann.
Greer, J.E. (1990). The persistence of religion: A study of sixth-form pupils in Northern Ireland,
1968-1988. Journal of Social Psychology, 130(1), 573-581.
Grigg, W., Donahue, P.L., & Dion, G. (2007). The nation’s report card: 12th-grade reading and
mathematics, 2005 (National Center for Education Statistics). Retrieved from
http://nces.ed.gov/pubsearch/pubsinfo.asp?pubid=2007468
Gross, S. (1988). Participation and performance of women and minorities in mathematics: A
project supported by the National Science Foundation and Montgomery County Public
Schools. Rockville, MD: Montgomery County Public Schools.
Guba, E.G. (1990). The alternative paradigm dialog. In: E.G. Guba (Ed.). The paradigm dialog
(pp. 17-30). Newbury Park, CA: Sage.
Gunderson, E.A., Ramirez, G., Levine, S.C., & Beilock, S.L. (2012). The role of parents and
teachers in the development of gender-related math attitudes. Sex Roles, 66, 153-166.
Hall, C.W., Davis, N.B., Bolen, L.M., & Chia, R. (1999). Gender and racial differences in
mathematical performance. The Journal of Social Psychology, 139(6), 677-689.
Hanley, P. (2008). Controversy in school?: Origin of life and the science/religion overlap. Paper
presented at the British Educational Research Association Annual Conference, Heriot-

94
Watt University, Edinburgh, Scotland.
Hess, R.D., Azuma, H., Kashiwagi, K., Dickson, W.P., Nagano, S., Holloway, S., Miyake, K.,
Price, G., Hatano, G., & McDevitt, T. (1986). Family influences on school readiness and
achievement in Japan and in the United States: An overview of a longitudinal study. In
H.W. Stevens, H. Azuma, & K. Hakuta (Eds.), Child development and education in
Japan (pp. 147-166). New York: Freeman.
Hilton, J.L., & von Hippel, W. (1996). Stereotypes. Annual Review of Psychology, 47, 237-271.
Hoepfl, M.C. (1997). Choosing qualitative research: A primer for technology education
researchers. Journal of Technology Education, 9(1). doi: 10.21061/jte.v9il.a.4
Hudley, C., & Graham, S. (2002). Stereotypes of achievement striving among early adolescents.
Social Psychology of Education, 5, 201-224.
Hughes, J.N., Gleason, K.A., & Zhang, D. (2005). Relationship influences on teachers’
perceptions of academic competence in academically at-risk minority and majority first
grade students. Journal of School Psychology, 43, 303-320.
Hyde, J.S. (2005). The gender similarity hypothesis. American Psychologist, 60, 581-592.
Hyde, J.S., Fennema, E., & Lamn, S.J. (1990). Gender differences in mathematics performance:
A meta-analysis. Psychological Bulletin, 107, 139-155.
Jacobs, J.E. (1991). Influence of gender stereotypes on parent and child mathematics attitudes.
Journal of Educational Psychology, 83, 518-527.
Jacobs, J.E., & Eccles, J.S. (1992). The impact of mothers’ gender-role stereotypic beliefs on
mothers’ and children’s ability perceptions. Journal of Personality and Social
Psychology, 63, 173-177.
Jones, S.R. (1997). Voices of identity and difference: A qualitative exploration of the multiple
95
dimensions of identity development in women college studies. Journal of College Student
Development, 38(4), 376-386.
Jones, S.R., & McEwen, M.K. (2000). A conceptual model of multiple dimensions of identity.
Journal of College Student Development, 41(4), 405-414.
Jones, D.J., & Watson, B.C. (1990). “High risk” students in higher education: Future trends.
Association for the Study of Higher Education: Eric Clearinghouse on Higher Education:
Washington, DC.
Kawakami, K., Young, H., & Dovidio, J.F. (2002). Automatic stereotyping: Category, trait, and
behavioral activations. Personality and Social Psychology Bulletin, 28, 3-15.
Keele, R. (2012). Nursing research and evidence-based practice. Burlington, MA: Jones &
Bartlett.
Ken, I. (2008). Beyond the intersection: A new culinary metaphor for race-class-gender studies.
Sociological Theory, 26(1), 152-172.
Kitch, S.L., & Fonow, M.M. (2012). Analyzing women’s studies dissertations: Methodologies,
epistemologies, and field formation. Signs: Journal of Women in Culture & Society,
38(1), 99-126.
Kontorski, V.J., & Stegman, S.F. (2006). A content analysis of qualitative research dissertations
in music education, 1998-2002. Bulletin of the Council for Research in Music Education,
168, 63-73.
Kuther, T. (n.d.) What is a doctoral candidate? Retrieved from
http://gradschool.about.com/od/survivinggraduateschool/g/doctoralcand.htm
Leder, G.C. (1992). Mathematics and gender: Changing perspectives. In D.A. Grouws (Ed.),
Handbook of research on mathematics teaching and learning (pp. 597-622). New York:
96
Macmillan.
Lincoln, Y., & Guba, E. (1985). Naturalist inquiry. Newbury Park, CA: SAGE Publications.
Lockhead, M., Thorpe, M., Brooks-Gunn, J., Casserly, P., & McAloon, A. (1985). Sex and
ethnic differences in middle school mathematics, science, and computer science: What do
we know? Princeton, NJ: Educational Testing Service.
Lummis, M., & Stevenson, H.W. (1990). Gender differences in beliefs and achievement: A cross
cultural study. Developmental Psychology, 26(2), 254-263.
Malinsky, M., Ross, A., Pannells, T., McJunkin, M. (2006). Math anxiety in pre-service
elementary school teachers. Education, 127(2), 274-279.
Manville, J. (1997). The gendered organization of an Australian Anglican parish. Sociology of
Religion, 58(1), 25-38.
McCann, C.R., & Kim, S. (2002). Feminist theory reader: Local and global perspectives. New
York: Routledge.
McGraw, R., Luebienski, S.T., & Strutchens, M.E. (2006). A closer look at gender in NAEP
mathematics achievement and affect data: Intersections with achievement, race/ethnicity,
and socioeconomic status. Journal for Research in Mathematics Education, 37(2), 129-
150.
Michael, K.Y. (2015). Women of faith in science: The double glass ceiling. The Journal of
Mathematics and Science, 15(1), 95-100.
Midgley, C., Feldlaufer, H., & Eccles, J.S. (1989). Change in teacher efficacy and student self-
and task-related beliefs in mathematics during the transition to junior high school.
Journal of Educational Psychology, 81, 247-258.
Mohr, W. (2006). Spiritual issues in psychiatric care. Perspectives in Psychiatric Care, 42(3),

97
174-183.
Murray, C.B. (1996). Estimating achievement and performance: A confirmation bias. Journal of
Black Psychology, 22(1), 6-85.
National Science Foundation. (2015a). Science and engineering degrees: 166-2012. Detailed
Statistical Tables NSF 15-236. Arlington, VA. Retrieved from
http://www.nsf.gov/statistics/2015/nsf15326/#chp1&chp2&chp5
National Science Foundation. (2015b). Women, minorities, and persons with disabilities in
science and engineering. Washington, DC: The National Science Foundation. Retrieved
from http://www.nsf.gov/statistics/2015/nsf15311/
Nelson, D., & Brammer, C.N. (2008). Women in science: A top-down approach. Science, 320,
1159-1160.
Nelson, J.K., & Coorough, C. (1994). Content analysis of the PhD versus EdD dissertation. The
Journal of Experimental Education, 62(2), 158-168.
Omi, M., & Winant, H. (1994). Racial formation in the United States from the 1960s to the
1990s. New York: Routledge.
Onwuegbuzie, A.J. (1995). Statistics test anxiety and female students. Psychology of Women
Quarterly, 19(3), 413-418.
Onwuegbuzie, A.J., & Wilson, V.A. (2003). Statistics anxiety: Nature, etiology, antecedents,
effects, and treatments-a comprehensive review of the literature. Teaching in Higher
Education, 8(2), 195-209.
Parsons, J.E., Adler, T.F., Kaczala, C.M., & Meece, J.L. (1982). Socialization of achievement
attitudes and beliefs: Parental influence. Child Development, 53(1), 310-321.
Patton, M.Q. (1990). Qualitative evaluation and research methods (2nd ed.). Newbury Park, CA:
98
Sage Publications, Inc.
Perry, M.J. (2013). Women earned majority of doctoral degrees in 2012 for 4th straight year and
outnumbered men in grad school 141 to 100. Washington, DC: American Enterprise
Institute. Retrieved from http://www.aei.org/publication/women-earned-majority-of-
doctoral-degrees-in-2012-for-4th-straight-year-and-outnumber-men-in-grad-school-141-
to-100/
Pinel, E.C. (1999). Stigma consciousness: The psychological legacy of social stereotypes.
Journal of Personality and Social Psychology, 76, 114-128.
Plowman, D.A., & Smith, A.D. (2011). The gendering of organizational research methods:
Evidence of gender patterns in qualitative research. Management Department Faculty
Publications. Lincoln, NE: University of Nebraska.
Polkinghorne, J. (2008). Theology in the context of science. London: Society for Promoting
Christian Knowledge.
Randolph, J.J., Gaiek, L.S., White, T.A., Slappey, L.A., Chastain, A., & Harris, R.P. (2010). A
quantitative content analysis of Mercer University Med, EdS, and doctoral theses.
Retrieved from https://archive.org/details/ERIC_ED513737
Reynolds, A.L., & Pope, R.L. (1991). The complexities of diversity: Exploring multiple
oppressions. Journal of Counseling and Development, 70(1), 174-180.
Richardson, F., & Suinn, R. (1972). The mathematics anxiety rating scale; psychometric data.
Journal of Counseling Psychology, 19(6), 551-554.
Riegle-Crumb, C., Moore, C., & Ramos-Wada, A. (2010). Who wants to have a career in science
or math? Exploring adolescents’ future aspirations by gender and race/ethnicity. Science
Education, 95(3), 458-476.
99
Roberts, H. (1981). Doing feminist research. London: Routledge.
Rone, E.C. (1998). Characteristics of higher education doctoral theses: Defrosting frozen assets
(Unpublished dissertation). University of Toronto: Toronto, Canada.
Royce, D., & Rompf, E. (1992). Math anxiety: A comparison of social work and non-social work
students. Journal of Social Work Education, 28(3), 270-278.
Russell, C. (2013). Human capital theory. In J. Ainsworth’s (Ed.) Sociology of Education. p.
368-369. Thousand Oaks, CA: Sage.
Sale, J.E.M., Lohfeld, L.H., Brazil, K. (2002). Revisiting the quantitative- qualitative debate:
Implications for mixed-methods research. Quality & Quantity, 36(1), 43-53.
Sanders, J., & Nelson, S.C. (2004). Closing gender gaps in science. Educational Leadership,
62(3), 74-77.
Shelton, J.N., & Richeson, J.A. (2005). Intergroup contact and pluralistic ignorance. Journal of
Personality and Social Psychology, 88, 91-107.
Shields, S.A. (2008). Gender: An intersectionality perspective. Sex Roles, 59(5/6), 301-311.
Sorge, C. (2007). What happens? Relationship of age and gender with science attitudes from
elementary to middle school. Science Educator, 16(2), 33-37.
Stanley, L., & Wise, S. (1983). Back into the personal or: our attempt to construct feminist
research. In G. Bowles and R.D. Klein (Eds.). Theories of women’s studies (pp. 20-60).
London: Routledge.
Steele, J.R., & Ambady, N. (2006). "Math is hard!" The effect of gender priming on women's
attitudes. Journal of Experimental Social Psychology, 42, 428-436.
Steele, J., James, J.B., & Barnette, R.C. (2002). Learning in a man's world: examining the
perceptions of undergraduate women in male-dominated academic areas. Psychology of
100
Women Quarterly, 26(1), 46-50.
Stout, J.G., Dasgupta, N., Hunsinger, M., & McManus, M.A. (2011). STEMing the tide: Using
ingroup experts to inoculate women's self-concept in science, technology, engineering,
and mathematics (STEM). Journal of Personality and Social Psychology, 100(2), 255-
270.
Strauss, A., & Corbin, J. (1990). Basics of qualitative research: Grounded theory procedures
and techniques. Newbury Park, CA: Sage Publications, Inc.
Tabachnick, B.G., & Fidell, L.S. (2012). Using multivariate statistics (6th ed.). Boston: Pearson.
Taber, K.S., Billingsley, B., Riga, F., & Newdick, H. (2011). Secondary students’ responses to
perceptions of the relationship between science and religion: Stances identified from an
interview study. Science Education, 95(6), 1000-1025.
Tobias, S. (1976). Math anxiety: What is it and what can be done about it? Ms Magazine, 5(1),
56-59.
Tronsgard, D.T. (1963). A common-sense approach to the dissertation: Should the graduate
schools take a fresh look at this traditional requirement? The Journal of Higher
Education, 34(9), 491-495.
Trujillo, K.M., & Hadfield, O.D. (1999). Tracing the roots of mathematics anxiety through in-
depth interviews with preservice elementary teachers. College Student Journal, 33(2),
219-233.
U.S. Department of Education. (2010). Profile of graduate and first-professional students:
Trends from selected years, 1995-96 to 2007-08. Retrieved from
https://nces.ed.gov/pubs2011/2011219.pdf
U.S. Department of Education, National Center for Education Statistics. (2014). Teacher
101
attrition and mobility: Results from the 2012-2013 teacher follow-up survey (NCES
2014-077). Retrieved from https://nces.ed.gov/fastfacts/display.asp?id=28
U.S. Department of Education, National Center for Education Statistics. (2015). Back to school
statistics. Retrieved from http://nces.ed.gov/fastfacts/display.asp?id=372
U.S. Department of Education, National Center for Education Statistics. (2016a). Nontraditional
undergraduates: Definitions and data. Retrieved from
https://nces.ed.gov/pubs/web/97578e.asp
U.S. Department of Education, National Center for Education Statistics. (2016b). Fast facts:
Back to school statistics. Retrieved from https://nces.ed.gov/fastfacts/display.asp?id=372
U.S. Department of Labor, Bureau of Labor Statistics. (2015). Women in the labor force: A
datebook 2015. Washington, DC: The U.S. Department of Labor. Retrieved from
http://www.bls.gov/opub/reports/womens-databook/archive/women-in-the-labor-force-a-
databook-2015.pdf
Uecker, J.E. (2008). Alternative school strategies and the religious lives of American
adolescents. Journal for the Scientific Study of Religion, 47(4), 563-584.
Upadyaya, K., & Eccles, J.S. (2014). How do teachers’ beliefs predict children’s interest in math
from kindergarten to sixth grade? Merrill-Palmer Quarterly, 60(4), 403-430.
Van Brummelen, H.V., & Koole, R. (2012). "Have they learned to swim around in the big
puddle?": Cultural awareness and engagement of Christian high school students. Journal
of School Choice, 6(1), 40-61.
Vittinghoff, E., & McCulloch, C.E. (2006). Relaxing the rule of ten events per variable in
logistic and Cox regression. American Journal of Epidemiology, 165(6), 710-718.
Wadsworth, N.D. (2011). Intersectionality in California’s same-sex marriage battles: A complex
102
proposition. Political Research Quarterly, 64(1), 200-216.
Warner, L.R. (2008). A best practices guide to intersectional approaches in psychological
research. Sex Roles, 59(5/6), 454-463.
Weinburgh, M. (1995). Gender differences in student attitudes toward science: A meta-analysis
of the literature from 1970-1991. Journal of Research in Science Teaching, 32(4), 387-
398.
Wenner, G. (2003). Comparing poor, minority elementary students’ interest and background in
science with that of their affluent peers. Urban Education, 38, 153-172.
Westmarland, N. (2001). The quantitative/qualitative debate and feminist research: A subjective
view of objectivity. Forum: Qualitative Social Research, 2(1). Retrieved from
http://www.qualitative-research.net/index.php/fqs/article/view/974/2125
Wick, J.W., & Dirkes, C. (1973). Characteristics of current doctoral dissertations in education.
Educational Researcher, 2(7), 20-21.
Wilson, F. (2011). Why should gender influence research design? Qualitative Research in
Organizations and Management: An International Journal, 6(1), 64-82.
Wilson, J.S., & Milson, J.L. (1993). Factors which contribute to shaping females’ attitudes
toward the study of science and strategies which may attract females to the study of
science. Journal of Instructional Psychology, 20(1), 78-86.
Wolniak, G.C. (2016). Examining STEM bachelor’s degree completion for students with
differing propensities at college entry. Journal of College Student Retention: Research,
Theory & Practice, 18(3), 287-309.
Woodard, T. (2004). The effects of math anxiety on post-secondary development students as
related to achievement, gender, and age. Inquiry, 9(1), 15-22. Retrieved from

103
http://files.eric.ed.gov/fulltext/EJ876845.pdf
Zeidner, M. (1991). Statistics and mathematics anxiety in social students: Some interesting
parallels. British Journal of Educational Psychology, 61, 319-328.
104
Appendix A: IRB Approval

105
Appendix B: Variable Codes
Table 4
SPSS Variable Codes
Variable Code
Methodology
Quantitative
Qualitative
0
1
Biological Sex
Female
Male
0
1
Ethnicity
Caucasian
African-American
Hispanic
Asian
American Indian
Other
Not specified
0
1
2
3
4
5
6
Age
Non-traditional student
Traditional student
0
1
Religious Affiliation
Not specified
Identified with a faith
0
1
Research design
Case study
Causal comparative
Content analysis
Correlational
Descriptive
Ethnography
Experimental
Grounded Theory
Instrument Development
Phenomenology
Quasi-experimental
Other
0
1
2
3
4
5
6
7
8
9
10
11