a dynamic model of amniocentesis - duke economicsecon.duke.edu/~vjh3/working_papers/amnio.pdf · 1...
TRANSCRIPT

Forthcoming in Advances in Life Course Research
An Economic Model of Amniocentesis Choice*
by
Eduardo Fajnzylber Universidad Adolfo Ibáñez
V. Joseph Hotz
Duke University
and
Seth G. Sanders Duke University
August 2010 *This research was funded by a grant from the National Institute for Child Health and Human Development (R01HD34293). Obviously, only the authors are responsible for the content of this paper. We would like to thank Margo Prator for suggesting this topic.
Abstract Medical practitioners typically utilize the following protocol when advising pregnant women about testing for the possibility of genetic disorders: Pregnant women over the age of 35 should be tested for Down syndrome and other genetic disorders; for younger women, such tests are discouraged since they can cause a miscarriage. The logic appears compelling. The rate at which amniocentesis causes a miscarriage is constant while genetic disorders rise over a woman’s reproductive years. Hence the potential benefit from testing – being able to terminate a fetus with a genetic disorder – rises with maternal age. We argue that this logic is incomplete. While the benefits to testing rise with age, so do the costs. While undergoing an amniocentesis always entails the risk of miscarriage of a healthy fetus, these costs are lower at early ages, because there is a higher probability of being able to replace a miscarried fetus with a healthy birth at a later age. We develop and calibrate a dynamic model of amniocentesis choice to explore this tradeoff. For parameters that characterize realistic age patterns of chromosomal abnormalities, fertility rates and miscarriages following amniocentesis, our model implies a falling, rather than rising, rate of amniocentesis as women approach menopause.
Key Words: Amniocentesis, Pregnancy, Miscarriage, Family Planning, Life Cycle Categories: Fertility, Family Planning, Sexual Behavior and Reproductive Health

1
1. Introduction
Amniocentesis and chorionic villus sampling (CVS) are methods of diagnosing Downs
Syndrome and other genetic disorders. Amniocentesis and transabdominal CVS involve inserting
a thin hollow needle through a pregnant woman’s abdomen to remove fetal cells from the
amniotic sac (amniocentesis) or from around the chorionic villi (CVS).1 Microscopic
examination of the chromosome size and banding patterns of these fetal cells allows medical
laboratories to identify and arrange each of the 24 different chromosomes (22 pairs of autosomes
and one pair of sex chromosomes) (a karyotype), which then serves as a tool in the diagnosis of
genetic diseases. An extra copy of chromosome 21 in a karyotype identifies Down syndrome the
most common genetic disorder (National Center for Health Statistics, 1994).
Children with Down syndrome suffer from general hypotonia (poor muscle strength and
elasticity), mental retardation, growth retardation, and are at significant risk for congenital
malformations of which heart problems are the most common. While some therapies are
available for specific malformations there are no proven therapies available to treat the cognitive
problems associated with Down syndrome (Dick, et al., 1996). In developing countries, life
expectancy for children with Down syndrome is approximately 35 years (Brazil) but advances in
medical treatment for specific conditions has increased life-expectancy in the U.S. to
approximately 55 years.2 The lifetime economic cost of Down syndrome is estimated at
$410,000 per child based on U.S. cross-sectional data from 1988 (Waitzman, Romano &
Scheffler, 1994). This of course greatly underestimates the full cost to families which include 1 Transcervical CVS involves inserting a thin tube through a woman’s vagina and cervix to the villi, and using suction to remove a small sample of fetal cells. The risks involved in transcervical and transabdominal CVS are the same and equally prevalent. For a concise discussion of CVS methods and risks, see http://www.modimes.org/HealthLibrary2/factsheets/ChorionicVillusSampling.htm,. 2 For life expectancy for those born with Down syndrome in Brazil see http://www.epub.org.br/cm/n04/doenca/down/down_i.htm and for the U.S. see http://www.ndss.org/aboutds/aboutds.html.
2
maternal depression and difficulties with marital and sibling relationships (Dick, et al., 1996).
Down syndrome accounts for about half of chromosomal abnormalities detected by karyotyping.
Spina bifida (an incompletely enclosed spinal cord) and anencephaly (the absence of a large part
of the brain and skull) are two less common but more fatal genetic disorders detected by
amniocentesis and CVS.
Both CVS and amniocentesis provide very accurate diagnosis of Down syndrome in a
fetus, greater than 99%. However, both have important risks that a pregnant woman must
consider. The amniocentesis procedure results in a spontaneous miscarriage for 1 in 100 to 1 in
200 women and the CVS procedure carries an even greater risk of procedure-related fetal loss
(between 1% and 1.5%).3 And while the fraction of pregnancies afflicted with Down syndrome
and other genetic disorders rises with maternal age, even at age 49 the vast majority of
pregnancies will prove to be chromosomally normal. What this means is that when
amniocentesis induces the loss of a fetus, the mother almost always looses a fetus that would
have developed into a healthy child.
The current standard in obstetric practice is to recommend that women pregnant at age 35
or older have an amniocentesis or CVS but this is not recommended for pregnant women prior to
that age. The American College of Obstetricians and Gynecologists, the College of Medical
Genetics and the Canadian Task Force on Periodic Health Examination all agree that a woman
who is pregnant and is 35 years old or older should be tested using either amniocentesis or CVS.
The recommendations for women who are pregnant and younger than age 35 varies, but
generally either the “triple marker” test or no test at all is recommended.4 Using age 35 as an age
3 See U.S. Preventative Service Task Force. (1996). The CVS procedure is feasible to perform earlier in a pregnancy than is amniocentesis. 4 The “triple marker” test is a screen of a pregnant woman’s blood for particular proteins and is an alternative to amniocentesis and CVS. While this test carries lower medical risks, it is far less accurate and typically it detects only

3
to start testing is based on a compelling, but we argue, incomplete logic. Figure 1 graphs the
estimated number of fetuses afflicted with a chromosomal abnormality per 100,000 pregnancies
by maternal age. Figure 1 also displays an upper and lower bound estimate on the number of
fetuses lost for every 100,000 amniocenteses performed. It is clear that prior to ages 35-38 more
healthy fetuses would be lost from performing amniocentesis on all women than would be the
number of chromosomally abnormal fetuses detected. It is further argued that, after age 35-38,
when chromosomal abnormalities rise rapidly, the rate of successful detection of rate
chromosomal abnormal fetuses via amniocenteses exceeds the incidence of miscarriages
resulting from administering this procedure. It is the latter claim (and accompanying evidence)
that has led the medical profession to adopt age 35 as the threshold age for recommending
genetic testing to patients.
Figure 1 here
Economists have criticized this threshold-age approach. For example, Sicherman,
Bombard and Rappoport (1995) (SBR hereafter) point out that this approach makes sense from
an expected utility theory viewpoint only if the utility loss from a miscarriage due to having an
amniocentesis equals the utility gain from avoiding bearing and raising a Down syndrome child.
Clearly, women (parents) may differ with respect to how they value the “pain and loss”
associated with miscarrying a fetus, on terminating a pregnancy through abortion, and on how
they value having additional children, including the relative utility gained from a healthy child
versus one born with a chromosomal abnormality. SBR argue that a woman’s individual costs
and benefits of each outcome can be combined with the probabilities of those outcomes to better
aid women in their choice.
60% of Down syndrome fetuses. Some doctors will perform amniocentesis on women who test positive on the “triple marker” test. Because of the extremely high false positive rate others will not use the test at all.
4
Like SBR, this paper relies on an expected utility approach but differs from SBR in an
important way. While SBR set the expected utility model in a static context, our paper
concentrates on the dynamic decisions inherent in family planning. Specifically, we model a
woman’s choice about amniocentesis for a particular pregnancy within her lifetime choices over
the quantity and quality of children.
There is a long tradition in demography that recognizes the importance of the outcomes
for one child or one pregnancy on future choices about childbearing. For example, demographers
have extensively studied changes in fertility in response to infant mortality, especially in
developing countries (Shultz, 1969, 1976; Ben-Porath, 1976; Preston, 1978; Sah, 1991; Wolpin,
1997). In our model, a procedure-induced miscarriage is viewed as in utero “infant mortality”
but women can partially control this risk by their decisions of whether or not to have an
amniocentesis. In particular, by not undergoing an amniocentesis, a woman can limit the risk of
this form of infant mortality. At the same time, by not having an amniocentesis, she increases her
chances of bearing a child with Down syndrome or another genetic disorder. In making her
genetic-testing choice, a woman is always cognizant that she can replace a miscarried fetus, with
some probability, at later ages. However, this option decreases as a woman approaches
menopause. As a result, the “cost” of an amniocentesis rises with maternal age. This is the key
different between our model and static expected utility models. In particular, the static model of
SBR implies that women will always have a rising propensity to choose to undergo an
amniocentesis because of her desire to avoid having a child born with a genetic disorder. In our
dynamic model, this propensity may or may not rise with maternal age, precisely because women
must balance the benefits associated with having an amniocentesis (avoiding having a child with
a genetic disorder) with the costs of such procedures (running the risk of a procedure-induced
5
miscarriage of a healthy fetus).
The remainder of this article is organized as follows. Section 2 lays out a dynamic model
of amniocentesis. We show that if the rate of Down syndrome were constant over maternal age,
it would be optimal, in the sense of maximizing expected utility, for women to elect an
amniocentesis at younger ages rather than at older ages. Since genetic disorders do rise with
maternal age, this result makes clear that how the optimal choice changes with maternal age will
depend on the rate of increase in genetic disorders relative to the rate of decrease in the
probability of replacing a child lost by a procedure-induced amniocentesis. After laying out how
the rates of amniocentesis vary by age and birth parity in U.S. data in Section 3, we then solve
more realistic models, using numerical methods and plausible parameter values, to determine
what the age pattern of amniocentesis choice might look like under reasonable biological
parameters. The results of these simulations are presented in Section 4. Some implications of our
simple model are strongly rejected by the data. For example, the data shows a clear jump in
amniocentesis rates at age 35, the age threshold used by medical practitioners. However, other
implications of the model are consistent with the data in Section 3, including: (a) a decline in
amniocentesis rates as women approach the end of their reproductive years, (b) a higher rate of
amniocentesis for lower parity children at most maternal ages, and (c) a larger drop in
amniocentesis rates for lower parity children as a woman reaches menopause. Section 5 provides
concluding observations.
2. Modeling Amniocentesis Choice
2.1 The Elements of a Dynamic Model
Consider a model in which women, at each age t, t = 1,…,T, become pregnant. We treat
pregnancies as biologically (and exogenously) determined, occurring with probability pt, 0 < pt <
6
1. Age T+1 is the age of menopause, after which woman’s probability of conception is zero (i.e.,
pT+1 0). Pregnant women confront three sequential choices at each age at which they are
fecund. First, a pregnant woman may choose to abort the fetus, prior to any genetic testing. Let
this choice be denoted by AtC , where A
tC is either equal to Abort or ~Abort. Second, conditional
on not choosing to initially abort her pregnancy, a woman chooses whether or not to have a test,
, for a genetic disorder, i.e., an amniocentesis. Let this choice be denoted by ~ AtC , where ~ A
tC
is either equal to Amnio or ~Amnio. We assume that the outcome on an amniocentesis ( = + or -)
is always accurate. Third, conditional on not initially aborting and having a positive test, women
choose whether or not to abort the fetus. Let &~A A
tC denote this choice, where &~A A
tC is
either equal to Abort or ~Abort. Those women who do choose to have an amniocentesis, ~AtC =
Amnio, may experience a (spontaneous) miscarriage, with probability m, 0 < m < 1. If the mother
chooses not to undergo an amniocentesis, the pregnancy will end in a normal birth with
probability q and a birth with a genetic disorder with probability (1-q). If she undergoes the
procedure, the result of the test will be negative (no genetic abnormalities) or positive with the
same probabilities (q and 1-q). The probability of a genetic disorder, (1-q), varies with the
woman’s age.
The above set of actions and probabilistically-occurring events result in a set of potential
outcomes at each age. In particular, women may have: a normal birth at age t, denoted by nt = 1;
a birth with a genetic disorder (Down syndrome), denoted by dt = 1; a miscarriage, denoted by mt
= 1; an abortion, denoted by at = 1; or no pregnancy, which is (implicitly) recorded by nt = dt =
mt = at = 0. Let the cumulative values, or “stocks,” of these outcomes as of age t be denoted as Xt
= Xt-1 + xt, where X = N, D, M, and A correspond to the outcomes x = n, d, m, and a.
7
An essential feature of our model is that children, regardless of their type, are enduring
goods. Furthermore, a couple’s other choices may have long run consequences. As such, we
assume that parent’s instantaneous utility, ut, is a function of the accumulated choices and
outcomes. Furthermore, couples will differ on the utility value of each of these. For example,
some couples may get as much utility from a Down child as a healthy child, and other couples
(women) may face a large utility cost of abortion while other women face none. These
differences in tastes are known to a couple but are unknown to the econometrician. We model
the instantaneous utility function as the sum of the utilities derived over the accumulation of each
pregnancy event. That is,5
1 1 1 1
t t t tD N M AD N
t i i i ii i i i
u
, (1)
where i = Present Discounted Disutility of the ith abortion; Di = Present Discounted Utility of
the ith Down child; Ni = Present Discounted Utility of the ith healthy child; and i = Present
Discounted Disutility of the ith miscarriage. For example, the first healthy child will bring utility
1N for every age after conception. Even though a woman can only conceive between t=1 and
t=T, we assume that a woman will enjoy the utility from a child forever.6
We assume a couple (woman) will make their (her) decisions between t=1 and t=T,
looking to maximize their (her) expected lifetime utility function:
~ &~
1
1
( , , ) 1
maxT
A A AAs s s
s
Ts
s sC C C s
U E u
.
5 This specification of the utility function is quite general. We do not require that gains and losses have a symmetric effect on parents’ (mother’s) utility. In particular, our specification can allow for forms of loss aversion. 6 More generally, we only require that all fertility-related events of the same type (healthy, Down, abortion or miscarriage) generate a flow of utility for the same number of periods, regardless of the age at which they were experienced. For example, children can be enjoyed for many years, whereas the effect of abortions and miscarriages could last for only a few periods.

8
The additive separability of the utility function allows us to express the dynamic programming
problem in terms of the Present Discounted Utility (PDU) that will be enjoyed over the lifetime
from a particular event. That way, at each age, a woman’s contemporaneous utility is defined by
the decisions she takes (which affect the probabilities of the different outcomes) and the PDU
associated with each outcome (which depend on the state variables, Dt, Nt, Mt and At).
The dynamic programming problem can then be written as
~ &~
~ &~1 1
~ &~1 1
~1 1
( , , )
( , , , 1) Pr 1 , ,
( 1, , , ) Pr 1 , ,
, , , max ( , 1, , ) Pr 1 ,
t
t
tA A AAt t t
A A AAA t t t t t t t t t
A A AD AD t t t t t t t t t
AN At t t t t N t t t t t t t t
C C C
p V D N M A a C C C
p V D N M A d C C C
V D N M A p V D N M A n C C
&~
~ &~1 1
1
,
( , , 1, ) Pr 1 , ,
(1 ) ( , , , )
t
A At
A A AAM t t t t t t t t t
t t t t t
C
p V D N M A m C C C
p V D N M A
, (2)
and the choice and outcome probabilities are given by
~ &~
~ &~
Pr 1 , ,
1
1 ~ 1 (1 )(1 ) 1
A A AAt t t t
At
A A AAt t t t t
a C C C
C Abort
C Abort C Amnio m q C Abort
(3)
~ &~
~
~ &~
Pr 1 , ,
1 ~ 1 ~ (1 )
1 (1 )(1 ) 1 ~
A A AAt t t t
AAt t t
A A At t t t
d C C C
C Abort C Amnio q
C Amnio m q C Abort
(4)
~ &~
~ ~
Pr 1 , ,
1 ~ 1 ~ 1 (1 )
A A AAt t t t
A AAt t t t t t
n C C C
C Abort C Amnio q C Amnio m q
(5)
~ &~ ~Pr 1 , , 1 ~ 1A A A AA At t t t t t tm C C C C Abort C Amnio m , (6)
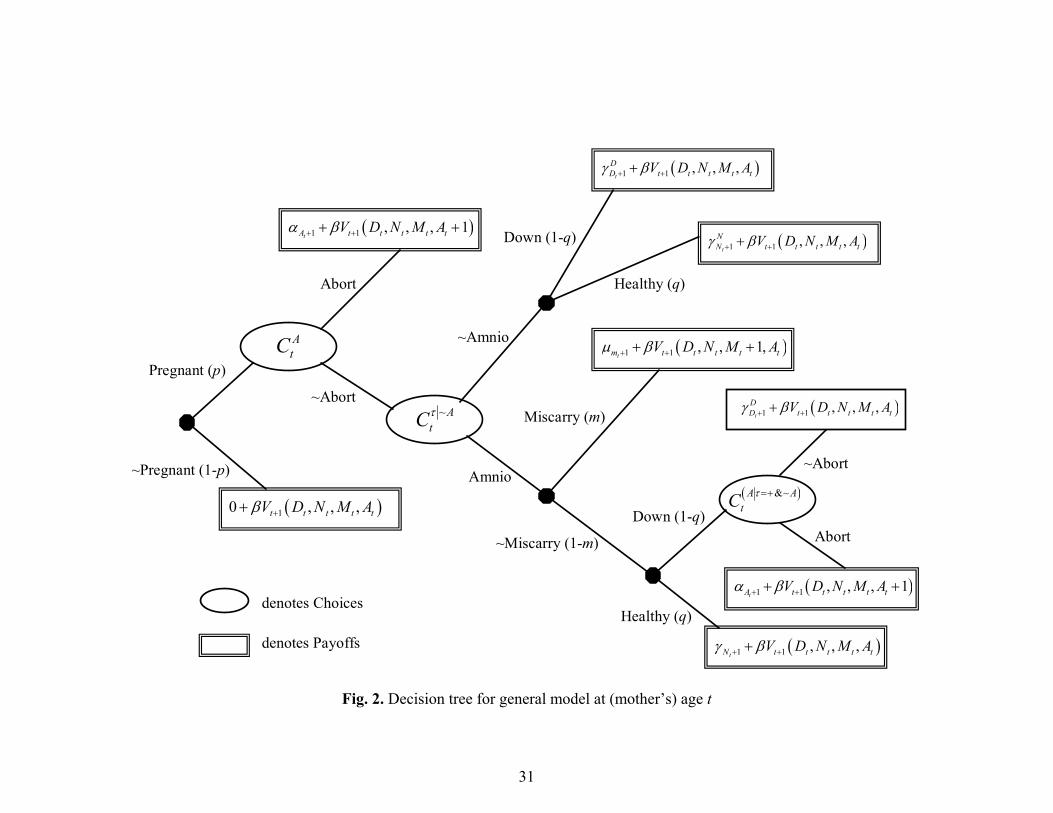
where the operator, 1{x}, is equal to one if decision x is taken and 0 otherwise. (The structure of
9
the woman’s decision problem at age t is illustrated as a decision tree in Figure 2.) Notice that
the probabilities are age dependent because some of the parameters, like the probability of
having a child with Down syndrome (qt), are age dependent. We assume that D Ni i , for all
births, i.e., having a healthy child is always preferred to having a child with Down syndrome,
and that 0i and 0i , for all births, i.e., abortions and miscarriages are never utility-
enhancing.
Figure 2 here
2.2 A Simplified Version of the Model
In this section, we consider a simplified version of this more general dynamic model to
illustrate the sorts of implications that it can generate. Assume, for now, that a woman desires
only one child. Assume that 1N = 1, 1
D 1, and 1 = 0, 1 = 0, i.e., an abortion or a miscarriage
have no utility loss, a normal birth is normalized to a utility value of 1 and less utility is derived
from Down syndrome child than a healthy child (but utility could be positive or negative). It
follows that ( 0, 0, , )t t t t tu D N M A = 0 prior to a woman’s first birth. At the time of a first
birth, a woman’s utility is either ( 0, 1, , )t t t t tu D N M A = 1, if the child is healthy, or
( 1, 0, , )t t t t tu D N M A = 1D 1, if the child is born with Down syndrome. As the woman
desires only one child, we can assume that after the birth of her child a woman receives her
discounted utility payoff and then dies. If she does not have a child by age T (the age of
menopause), her utility is zero. Finally, for now, we assume that m, q, and p do not vary with
maternal age. While many of these simplifying assumptions are either unrealistic or factually
inaccurate, they allow us to simplify a woman’s fertility decision-making problem. For example,
it follows immediately from the above assumptions that in our simplified model we can abstract

10
from the choice of whether to abort a pregnancy prior to genetic testing ( AtC = Abort).7 We
consider the two remaining choices and describe how this simplified model can be solved
recursively.
Last Stage, Age T
Consider the last stage of the woman’s decision problem, at age T, after which she can no
longer become pregnant. Figure 3 displays the decision tree for this age. We first consider the
abortion decision, given a positive outcome on an amniocentesis ( &~A AtC ) and then determine
her optimal amniocentesis decision rule.
Figure 3 here
If a woman has had an amniocentesis, avoided a procedure-induced miscarriage and then tested
positive for Down syndrome, the woman will abort the pregnancy if the value of a Down
syndrome child is negative, since the only issue is whether a child afflicted with Down syndrome
will produce positive utility to the woman. Thus, it follows that the optimal abortion choice at
age T is characterized by the following decision rule:
&~ 1
1
if 0
~ if 0
DA A
T D
AbortC
Abort
. (7)
Given a value of 1D , a woman will know whether she will abort should she be faced with
a fetus with a genetic disorder and can make a choice at age T on whether to undergo
amniocentesis. If 1D 0, we know that the woman will not abort. We also know she will not
undergo an amniocentesis; doing so generates no present benefits (she will not abort if she tests
positive) and entails the risk of miscarriage. In contrast, a woman with 1D < 0 would abort a
7 Since the choice to abort after genetic testing is available, and since abortion carries no disutility, a woman will never abort prior to genetic testing if N
i > 0.

11
fetus if it tested positive for Down syndrome. It follows that the woman’s her expected utility is
| &~, , (1 )A AT T TE u pregnant C Amnio C Abort m q (8)
if she undergoes an amniocentesis and
1, ~ (1 ) DT TE u pregnant C Amnio q q (9)
otherwise. Equating (8) and (9) and solving for yields
*
1T
qm
q
, (10)
which is that level of utility, as of age T, at which a woman is indifferent between having an
amniocentesis and aborting if it tests positive and not having an amniocentesis. Thus, *T is the
critical (utility) value that characterizes the optimal decision rule for a woman’s amniocentesis
choice at age T:
*~ 1 if ,
~ otherwise.
DA T
T
AmnioC
Amnio
. (11)
Note that it is possible that some women will decide to forgo an amniocentesis, even though
having a Down syndrome child would reduce their utility, i.e., 1D < 0. This could occur because
while having an amniocentesis allow a woman to avoid having a Down syndrome child with
certainty, having the test comes with the risk of losing a healthy child due to a miscarriage.
Before moving to age T-1, notice that the choice over amniocentesis only occurs among
women pregnant at T. Therefore, as of age T-1, the payoffs at age T are expected to be
*1 1( (1 ) )D D
T TE u p q q
and
*1 ( (1 ))D
T TE u p q m ,
12
depending on the relationship between a woman’s utility from having a Down syndrome child,
1D , and its critical value *
T as of age T.
Choices at Age T-1
Figure 4 displays the decision tree for a woman at her next-to-last fertile age, T-1. At this
age, women still have choices they can make when they reach age T and these potential actions
have option value as of age T-1. Recall that at age T any woman with *1D
T would have an
amniocentesis and, hence, would abort a pregnancy that tested positive for a chromosomal
abnormality. Because the costs of amniocentesis rise with age – while the benefits will not so
long as q is constant – and the utility associated with not undergoing an amniocentesis is constant
in this version of our model,8 it follows that ~1A
TC = Amnio and &~
1A A
TC = Abort when *
1D
T .
If *1D
T , the optimal abortion decision rule, at age T-1, for a woman who tests positive is
given by:
&~ 11
if 1 1
~ otherwise.
DA A
T
pqAbort
C p q
Abort
. (12)
Since a woman would undergo amniocentesis only if she would abort a fetus that tests positive
for a chromosomal abnormality, it follows immediately that ~1A
TC = ~Amnio if 1
D
1 1
pq
p q
and that *1T must lie in the interval
* ,
1 1T
pq
p q
. For all values of 1D in
this range, it follows from (11) that a woman would not have amniocentesis at age T should she
reach age T without a child and become pregnant at age T. Therefore,
8 Note that with more than one child, the (utility) costs of an amniocentesis will not be constant.
13
~1 1 1(1 ) (1 ) (1 ) (1 )A D D
T TE u C Amnio mp q q m q q p q q ,
while
~1 1~ (1 )A D
T TE u C Amnio q q ,
which implies that
*1
(1 )(1 )
1 1 (1 )(1 )T
q m mp m q p
q mp m q p
(13)
and the optimal amniocentesis decision-rule at age T-1 is:
*~ 1 11
if
~ otherwise.
DA T
T
AmnioC
Amnio
. (14)
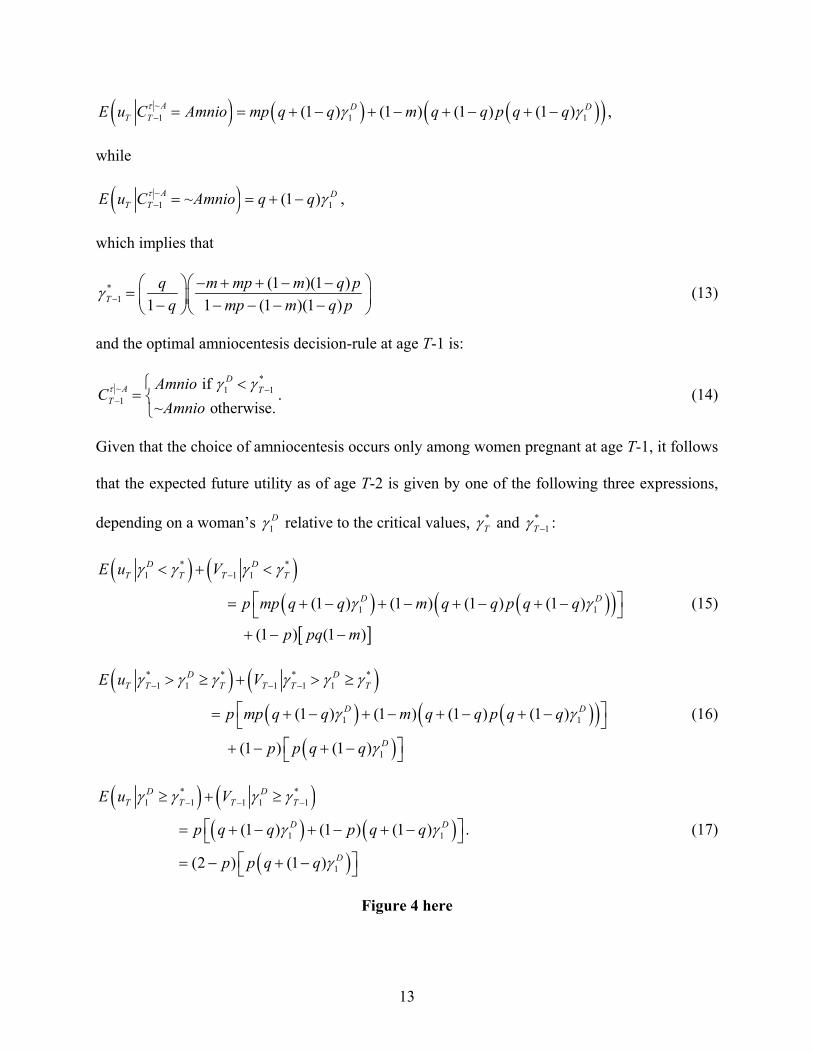
Given that the choice of amniocentesis occurs only among women pregnant at age T-1, it follows
that the expected future utility as of age T-2 is given by one of the following three expressions,
depending on a woman’s 1D relative to the critical values, *
T and *1T :
* *1 1 1
1 1(1 ) (1 ) (1 ) (1 )
(1 ) (1 )
D DT T T T
D D
E u V
p mp q q m q q p q q
p pq m
(15)
* * * *1 1 1 1 1
1 1
1
(1 ) (1 ) (1 ) (1 )
(1 ) (1 )
D DT T T T T T
D D
D
E u V
p mp q q m q q p q q
p p q q
(16)
* *1 1 1 1 1
1 1
1
(1 ) (1 ) (1 )
(2 ) (1 )
D DT T T T
D D
D
E u V
p q q p q q
p p q q
. (17)
Figure 4 here

14
Choices at Age T-2 and Arbitrary Ages T-s
Continuing with this recursive solution strategy at age T-2, recall that at age T-1 any
woman with *1 1D
T would have an amniocentesis and hence abort a pregnancy that tested
positive for a chromosomal abnormality. Again, because the costs of amniocentesis rise with age
while the benefits do not (when q is constant), this immediately implies that ~2A
TC = Amnio and
&~2
A ATC = Abort for *
1 1D
T or, for an arbitrary age, T-s, ~AT sC = Amnio and &~A A
T sC =
Abort for *1 1D
T s . At age T-2, for *1 2D
T , the abortion decision rule for women who test
positive is given by:
&~ 1
2
1 (1 ) if
1 1 (1 ) (1 )
~ otherwise.
DA A
T
p p qAbort
C p p q
Abort
(18)
or, at an arbitrary age, T-s, by:
1
0
&~ 1 1
0
(1 ) 1 (1 ), if
1 1 (1 ) (1 )1 (1 ) (1 )
~ , otherwise.
s j sjD
A A s sjT s
j
p p q p qAbort
C p qp p q
Abort
. (19)
Since a woman would undergo amniocentesis only when she would abort a fetus that tests
positive for a chromosomal abnormality, this immediately implies that
~1
1 (1 )~ if
1 1 (1 ) (1 )
sA D
T s s
p qC Amnio
p q
.
And, thus, *T s must lie in the interval,
*1
1 (1 ),
1 1 (1 ) (1 )
s
T s s
p q
p q
. For all 1
D in this
range, a woman would not have amniocentesis at any (fertile) age after T-s. Therefore,
15
~1
0
(1 ) (1 )(1 ) (1 ) (1 )s
A D jT s T s
j
E u C Amnio m q m m q p q q p
,
while
~1~ (1 )A D
T s T sE u C Amnio q q .
Thus, the critical value for 1D for an arbitrary age T-s is given by
*1 (1 )
1 1 1 (1 )
s
T s s
m pq
q p
, (20)
where (1 )(1 ) 0m m q , and optimal decision-rule for a woman’s amniocentesis
choice at that age is
*~ 1 if
~ otherwise.
DA T s
T s
AmnioC
Amnio
(21)
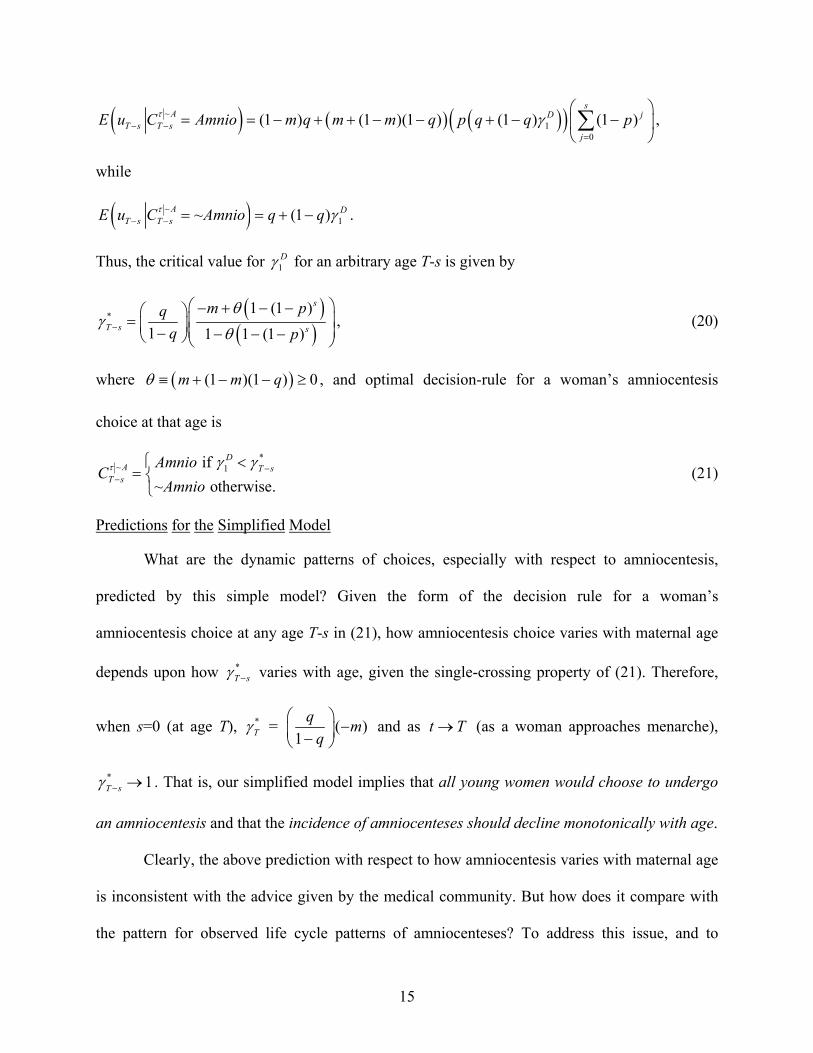
Predictions for the Simplified Model
What are the dynamic patterns of choices, especially with respect to amniocentesis,
predicted by this simple model? Given the form of the decision rule for a woman’s
amniocentesis choice at any age T-s in (21), how amniocentesis choice varies with maternal age
depends upon how *T s varies with age, given the single-crossing property of (21). Therefore,
when s=0 (at age T), *T = ( )
1
qm
q
and as t T (as a woman approaches menarche),
* 1T s . That is, our simplified model implies that all young women would choose to undergo
an amniocentesis and that the incidence of amniocenteses should decline monotonically with age.
Clearly, the above prediction with respect to how amniocentesis varies with maternal age
is inconsistent with the advice given by the medical community. But how does it compare with
the pattern for observed life cycle patterns of amniocenteses? To address this issue, and to

16
determine what features of our more general model of amniocentesis choice need to be modified
to “fit the data,” we present, in the following section, evidence on the empirical relationship
between amniocentesis and age.
3. Empirical Regularities on Amniocentesis and Maternal Age
To investigate the relationship between age and amniocentesis, we use data from the
Detailed Natality Files (DNF) from the National Center for Health Statistics. The DNF include
all births occurring within the United States. Beginning in 1988, for nearly every state, both
congenital anomalies and a woman’s use of amniocenteses during pregnancy are recorded.9
While some twenty-two congenital anomalies are recorded, many are not genetic in origin.10 In
what follows, we concentrate on the data for three anomalies that are routinely discovered by
amniocentesis: spina bifida, Down’s syndrome, and “other chromosomal anomalies.” These
anomalies comprise more than half of all genetic disorders associated with newborns.
The benefit of the DNF is that it is a census of births in the U.S. and provides sufficient
sample size to study choices of women pregnant at older ages. One potential issue is that this is a
sample of live births only and hence Down’s syndrome fetuses that are aborted do not appear in
the sample. However, it is possible to estimate the fraction of pregnancies for which
amniocentesis is performed from the sample of live births.
From the DNF, we can obtain the following statistics:
BirthrtN = Total number of births of parity r occurring to women of age t;
9 The following states did not record amniocentesis on a significant percentage of State Birth Certificates (between 1990 and 1994): Connecticut (16.6%), Maryland (20.4%) and Oklahoma (35.0%). The following states did not record at least one of the three abnormal conditions of the newborn on a significant percentage of State Birth Certificates: Rhode Island (20.08%), Connecticut (26.5%), Maryland (33.21%), Oklahoma (42.49%), New York (92.07%), and New Mexico (100%). 10 These include central nervous, cardiac, musculoskeletal, and gastrointestinal.

17
&Birth AmniortN = Total number of births of parity r preceded by an amniocentesis occurring
to women of age t; and
&~ &Birth Amnio Birth Birth Amniort rt rtN N N .
The rate of amniocenteses conditional on live births is defined to be:
&
Pr 1Birth Amniort
rt rt Birthrt
NAmnio b
N , (22)
where brt = 1 indicates a live birth of birth order r to a woman of age t.
For our purposes, we are interested in the rate of amniocentesis conditional on
pregnancies and only on “relevant” pregnancies. In particular, an amniocentesis is not a relevant
choice for a woman who would elect to abort a pregnancy, without regard to its genetic status, or
for a woman who has a naturally occurring miscarriage prior to the amniocentesis choice.11 We
term relevant pregnancies as those that are wanted and viable and define them to include: (a)
pregnancies ending in births that are not preceded by an amniocentesis ( &~Birth AmniortN ); (b)
pregnancies resulting in births that are preceded by an amniocentesis ( &Birth AmniortN ); (c)
pregnancies followed by an amniocentesis that was positive and was aborted ( &Amnio AbortrtN ); and
(d) pregnancies followed by an amniocentesis that was negative but which induced a miscarriage
( &Amnio MiscarryrtN ). It follows that the total number of wanted and viable pregnancies is equal to
&~ & & &
&~
&~
(1 ) (1 )
W Birth Amnio Birth Amnio Amnio Abort Amnio Miscarryrt rt rt rt rt
Birth Amnio Amnio Amnio Amniort rt t rt t rt t
Birth Amnio Amniort rt
N N N N N
N N q m N q N q m
N N
, (23)
11 There are a variety of estimates for the rate of fetal loss by gestational age. Taylor (1969) estimates the rate of loss (per 1000 pregnancies) by gestational age is approximately 28 (<7 weeks), 45 (8-11 weeks), 20 (12-15 weeks) and less than 10 after the 15th week. Taylor’s estimates imply that 72% of miscarriages occur prior to week 16 of pregnancy. Amniocentesis is not performed prior to week 16.
18
where (1-qt) is the rate of chromosomal abnormalities at age t, m is the rate of miscarriage
induced by the amniocentesis procedures, and AmniortN is the number of amniocentesis procedures
performed. The substitutions of (1 )Amniort tN q m for &Birth Amnio
rtN and (1 )Amniort tN q for
&Abort AmniortN in the second line of (23) follow from invoking the following rational choice
assumption: women who test positive for a chromosomal abnormality will always choose to
abort their fetuses, while women who test negative will always choose to bring their fetuses to
term. The DNF suggests that it is very rare that a woman give birth to a Down syndrome child
after receiving amniocentesis.12 Finally, we substitute Amniort tN q m for &Amnio Miscarry
rtN in (23) to
reflect the fact that technical problems can cause an amniocentesis to end in a miscarriage at the
rate m.
It follows that the rate of amniocenteses conditional on wanted and viable pregnancies is
given by
Pr 1Amnio
W rtrt rt W
rt
NAmnio p
N , (24)
where Amniort is the indicator on whether a woman had an amniocentesis at age t for parity r and
Wrtp is an indicator that a pregnancy was wanted and viable. Recall that &Birth Amnio
rtN =
(1 )Amniort tN q m , or that Amnio
rtN can be estimated as AmniortN =
&
(1 )
Birth Amniort
r
N
q m. Furthermore, recall
that WrtN = &~Birth Amnio
rtN + AmniortN . It follows that that equation (24) can be expressed as
12 Among the live births that were reported to have Down syndrome between 1990 and 1994, 9.5% were preceded by an amniocentesis, while 90.5% were not.

19
&
&&~
(1 )Pr 1
(1 )
Birth Amniort
W trt rt Birth Amnio
Birth Amnio rtrt
t
Nq m
Amnio pN
Nq m
, (25)
where &Birth AmniortN and &~Birth Amnio
rtN are obtained from the DNF and we derive values for qt and m
from medical studies.
Clearly, the rates in (25) may vary by more than just a woman’s parity (r) and age (t). For
example, these rates may vary by her education or race. For example, because Down’s syndrome
children are time intensive, one might expect that more educated women, who tend to have
higher market-based opportunity costs of time, have higher rates of amniocentesis than less
educated women. Further, more educated women may differ in the likelihood of becoming
pregnant by birth parity and age, i.e., women having a first birth late in life are likely to have
high levels of education. To deal such factors, one can calculate separate rates by these
demographic characteristics. Alternatively, one can “hold constant” other covariates when
calculating (25) by weighting one group to mimic the distribution of covariates of another. For
example, we might standardize all of our age-specific estimates to the educational distribution
for women who have a first birth at say age 21 in order to hold education constant across age.
Then our standardized (by education) age-specific estimate of the rate of amniocenteses would
be
&
18
&&~1
(1 )Pr 1
(1 )
Birth Amniorte
W trt rt rte Birth Amnio
Birth Amnioe rterte
t
Nq m
Amnio p wN
Nq m
, (26)
where 1,21,erte
rte
kw
k , rte
rtert
Nk
N , and e indexes education groups.
20
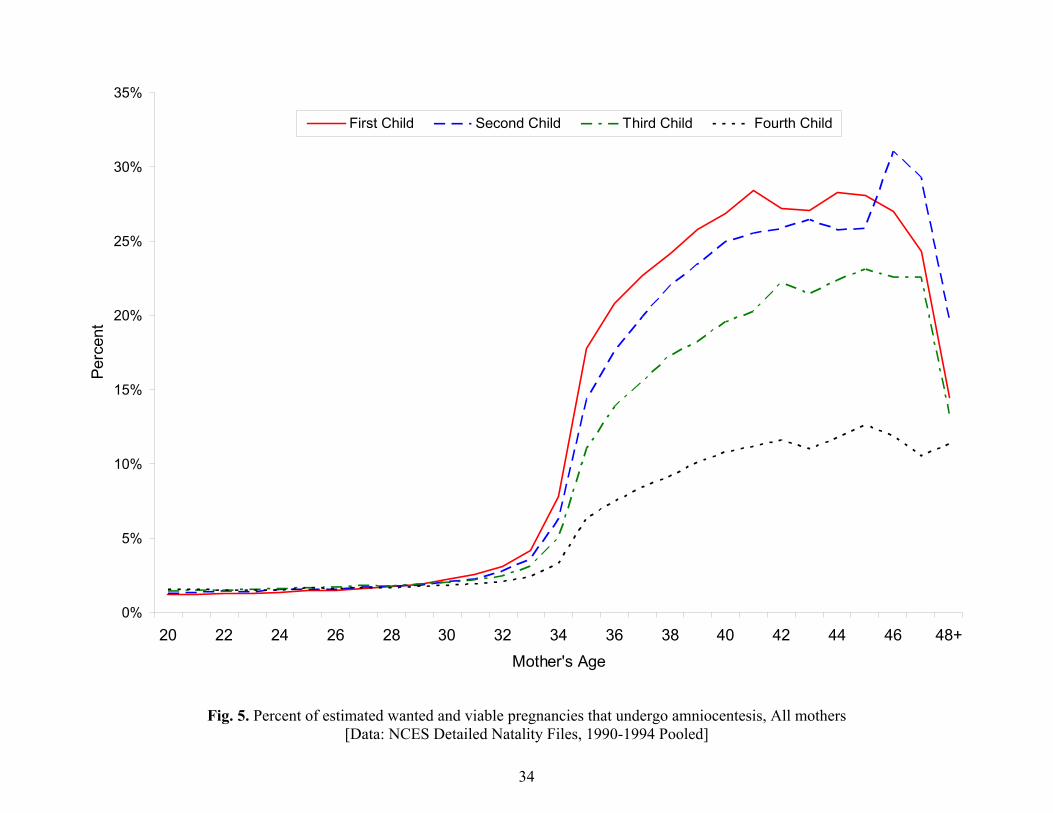
Figure 5 plots Pr 1Wrt rtAmnio p for maternal ages 20 to 48 and for first through fourth
parities. Several interesting patterns emerge from this Figure. First, regardless of parity, the rate
of amniocentesis is near zero for women under the age of 35, but there is a steep rise in the rate
of amniocentesis after that age for all parities. Second, the increase in rate of amniocentesis is
larger the lower the parity of the child. Finally, while amniocentesis rates rise until a woman
reach her mid-forties, they begin to decline after that age and they drop more precipitously for
lower parities (first through third) than higher (fourth) parities. In particular, between the ages of
46 to 48, the rate of amniocentesis drops from 31% to 20% for first births, from 28% to 14% for
second births, and from 45% to 23% for third births. In contrast, there is very little decline in the
corresponding rates for fourth births over this same age range.
Figure 5 here
These age and parity patterns in rates of amniocentesis may be the result of changes in
the composition of women across these groups. As noted above, women having a first birth at
age 20 are likely to be less educated than those having their first birth at age 40. One easy way to
account for this compositional effect on these rates is to condition, non-parametrically, on the
educational attainment of women. Figure 6 plots Pr 1Wrt rtAmnio p for maternal ages 20 to 48
and for first through fourth parities for women whose highest level of educational attainment was
a high school diploma. What is clear is that the patterns described for all women persist although
the differences in the rates at any age across parity are reduced. Figure 7 plots
Pr 1Wrt rtAmnio p when the distribution of race, marriage and education is held constant for
all parities and for all ages at the distribution found for women having a second birth at age 35.13
13 Blacks, Hispanic, Others and Whites make up 11.0%, 11.6%, 6.0% and 72.4% of this population respectively. High School dropouts, high school graduates, some college and college graduates make up 14.4%, 26.6%, 22.7%,
21
Again, for the first through third children, the patterns remain.
Figure 6 here
Figure 7 here
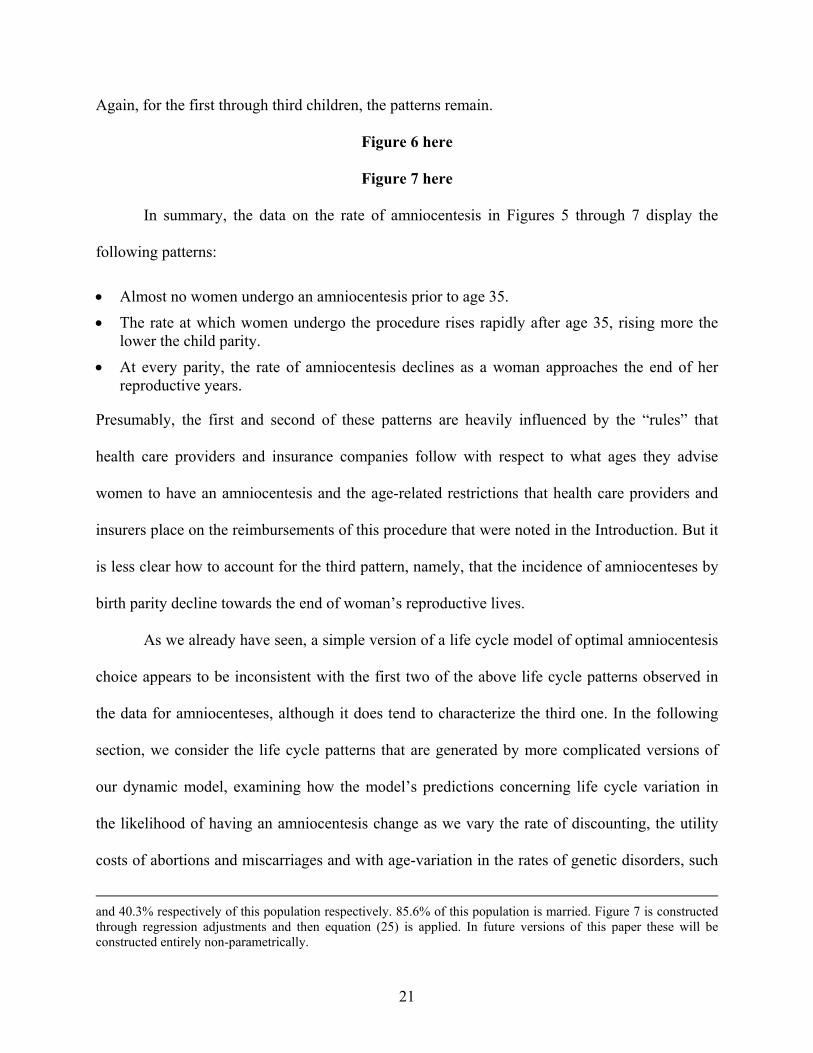
In summary, the data on the rate of amniocentesis in Figures 5 through 7 display the
following patterns:
Almost no women undergo an amniocentesis prior to age 35.
The rate at which women undergo the procedure rises rapidly after age 35, rising more the lower the child parity.
At every parity, the rate of amniocentesis declines as a woman approaches the end of her reproductive years.
Presumably, the first and second of these patterns are heavily influenced by the “rules” that
health care providers and insurance companies follow with respect to what ages they advise
women to have an amniocentesis and the age-related restrictions that health care providers and
insurers place on the reimbursements of this procedure that were noted in the Introduction. But it
is less clear how to account for the third pattern, namely, that the incidence of amniocenteses by
birth parity decline towards the end of woman’s reproductive lives.
As we already have seen, a simple version of a life cycle model of optimal amniocentesis
choice appears to be inconsistent with the first two of the above life cycle patterns observed in
the data for amniocenteses, although it does tend to characterize the third one. In the following
section, we consider the life cycle patterns that are generated by more complicated versions of
our dynamic model, examining how the model’s predictions concerning life cycle variation in
the likelihood of having an amniocentesis change as we vary the rate of discounting, the utility
costs of abortions and miscarriages and with age-variation in the rates of genetic disorders, such
and 40.3% respectively of this population respectively. 85.6% of this population is married. Figure 7 is constructed through regression adjustments and then equation (25) is applied. In future versions of this paper these will be constructed entirely non-parametrically.
22
as displayed in Figure 1. We contrast these predictions with those generated by a myopic model
of amniocentesis choice, exploiting the fact that such a model arises as a special case of our
dynamic model under the case where the future is completely discounted (i.e., = 0.0) when
women (couples) make their childbearing and amniocentesis decisions.
4. Varying Features of the Model and Tracking the Observed Dynamic Patterns of Amniocentesis Choice
In this section, we examine how changes in the various features of our dynamic model of
amniocentesis choice affect our ability to “replicate” the age patterns found in the data on the
incidence of amniocenteses described in the preceding section. We pay particular attention to
contrasting our dynamic model with the special case in which women are myopic with respect to
these choices, i.e., do not take full account of the future in making their choices. In this
exploration, our goal is not to fit our model to data in a statistical sense. Rather, our goal is to see
whether our model, and its underlying features, is rich enough to characterize the dynamic
patterns of amniocentesis choice outlined above. We proceed by plugging in values for the key
parameters (or rates) for the model in Section 2 in an attempt to “calibrate” the model, assessing
how well we mimic the dynamic patterns of amniocentesis choice at different ages by plotting
how the critical value, *t , for 1
D varies with age.14 To simplify our analysis, we normalize the
value of a (chromosomally) healthy child to one ( 1N = 1), and specify the following parameters
of the model to be age-invariant and equal to the following values: annual pregnancy rate (p) to
0.3 and the rate of procedure-induced miscarriage (m) to 0.0067 (1/150). We then explore how
varying the following parameters affects *t and thus the incidence of amniocenteses with age:
14 That is, the incidence of amniocenteses at a woman’s age, t, is given by *
1Pr( )Dt in decision-rule (21), where
1D is treated as a random variable with a known distribution.
23
(i) the discount rate (); (ii) the utility cost of an abortion (); (iii) the utility cost of a
miscarriage (); and (iv) the rate of genetic disorders (Down syndrome) (q), where for the latter
parameter we consider specifications in which q is assumed to be age-invariant and to vary with
age as in Figure 1.15
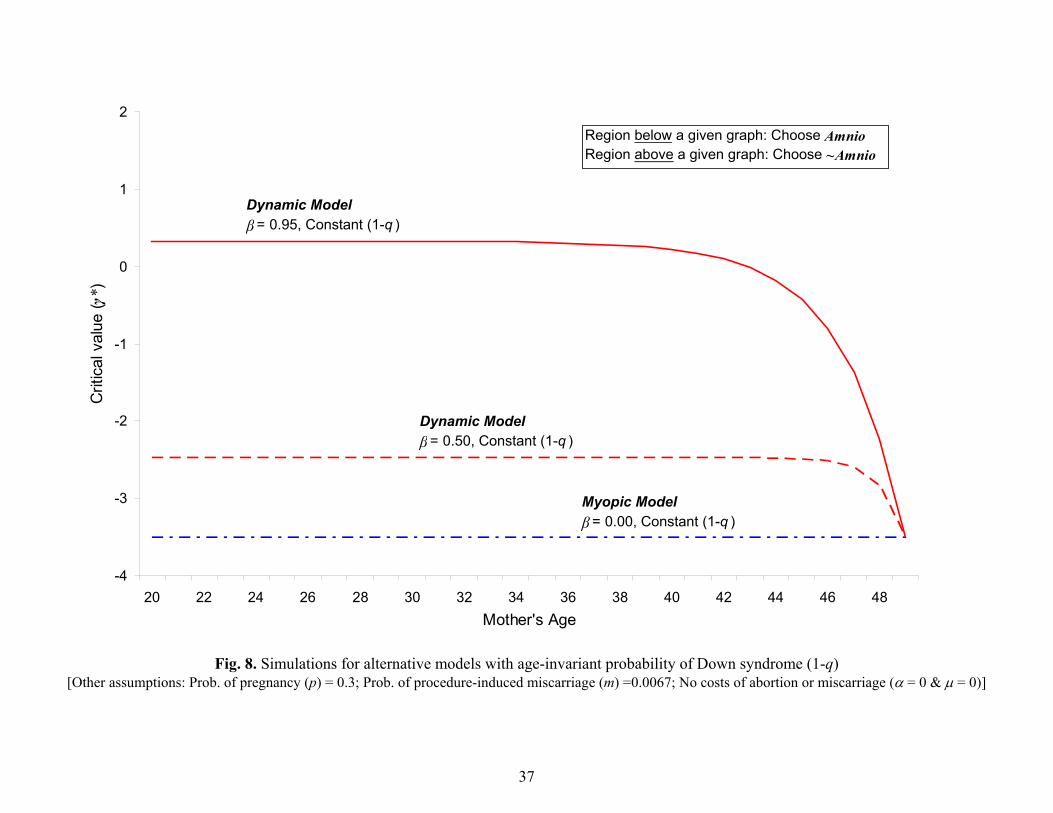
The results of this exploration of our model are displayed in Figures 8 through 12.
Consider first the role that discounting plays in affecting the dynamic pattern of * , and, thus,
the incidence of amniocenteses. Figure 8 displays how * varies with age assuming that the rate
of genetic disorders associated with births is age-invariant (i.e., qa = q for all a) and there are
zero (utility) costs of abortions and miscarriages (i.e., = = 0). Consider first the values for *
when = 0.0, i.e., the “myopic” model. In our characterization of the myopic model, a woman is
assumed to not take account of the possibility of “replacing” a current pregnancy with a future
pregnancy in her decision to get amniocentesis because she completely ignores the future.
However, we do assume that a woman takes account of the “durable” nature of children and of
abortion and miscarriage costs in making her childbearing, amniocentesis and abortion decisions,
via the “payoff values” D , and . That is, we assume that women still take account of the
PDU she receives from her child and the PDU associated with any abortion or miscarriage she
experiences.
Figure 8 here
As can be seen in Figure 8, the value for * at early ages increases—and thus the
15 An annual rate of pregnancy of 0.3 is consistent with data from the Hutterites. The average number of births to fecund women in this population is approximately 11. In our simulations, we use this age-invariant rate, despite clear evidence that pregnancy rates tend to fall over time (see, for example, Leridon, 2008). Allowing for a monotonically declining pregnancy rate with maternal age would tend to exacerbate the life-cycle effect, i.e. as women approach menopause without having reached the desired family size, the disutility from an amniocentesis-induced miscarriage would be greater as the probability of becoming pregnant again would be declining over time.

24
probability of having an amniocentesis increases, as we move from the myopic version of the
model to the two variants of the Dynamic Model ( = 0.50 and = 0.95). This increase reflects
the “option value” of knowing about the genetic status of a fetus at early ages. When, in the
Dynamic Model, the future is taken into account in decision-making, forward looking women
have an incentive to learn about the genetic status of a fetus precisely because they realize that
they have the option of aborting such a fetus if the amniocentesis is positive and replacing that
fetus in the future. Women under the Myopic Model do not consider this option and, thus, have
no greater incentive to have an amniocentesis at early ages than they do at older ages. Note, too,
that the less a woman discounts the future—i.e., comparing the results for = 0.95 with those for
= 0.50—the greater is this incentive to have an amniocentesis at early ages. Finally, as women
age, there is no change in the value of * under the Myopic model, but this critical value
declines with age under either specification of the Dynamic Model. Furthermore, * converges
to the same value under all three specifications at age T, the end of the woman’s reproductive
life. This convergence follows from the fact that the decision rule at age T is identical under both
the Dynamic and Myopic model, since there is no future at that age.
In addition, this decline in * with age under the Dynamic specification reflects another
force within our model. As noted above, the higher the 1D (and 1
N ), the greater the desire of
women to have a child, even if it is one that has Down syndrome. As women approach the end of
their reproductive careers, their incentive to have a child increases under the Dynamic
specification. As a result, childless women have an incentive to avoid actions that further
postpone births. This includes undergoing an amniocentesis, since the latter procedure is
assumed to increase the likelihood that a woman experiences a miscarriage. Thus, as one
approaches T, forward-looking women will have less incentive to undergo an amniocentesis in
25
order to reduce the risk of a miscarriage, which would further postpone their chances of having a
birth prior to menopause. Note, that this age-dependent incentive is not present in the Myopic
model, precisely because it does not have women (couples) be forward looking when making
their choices over the life cycle.
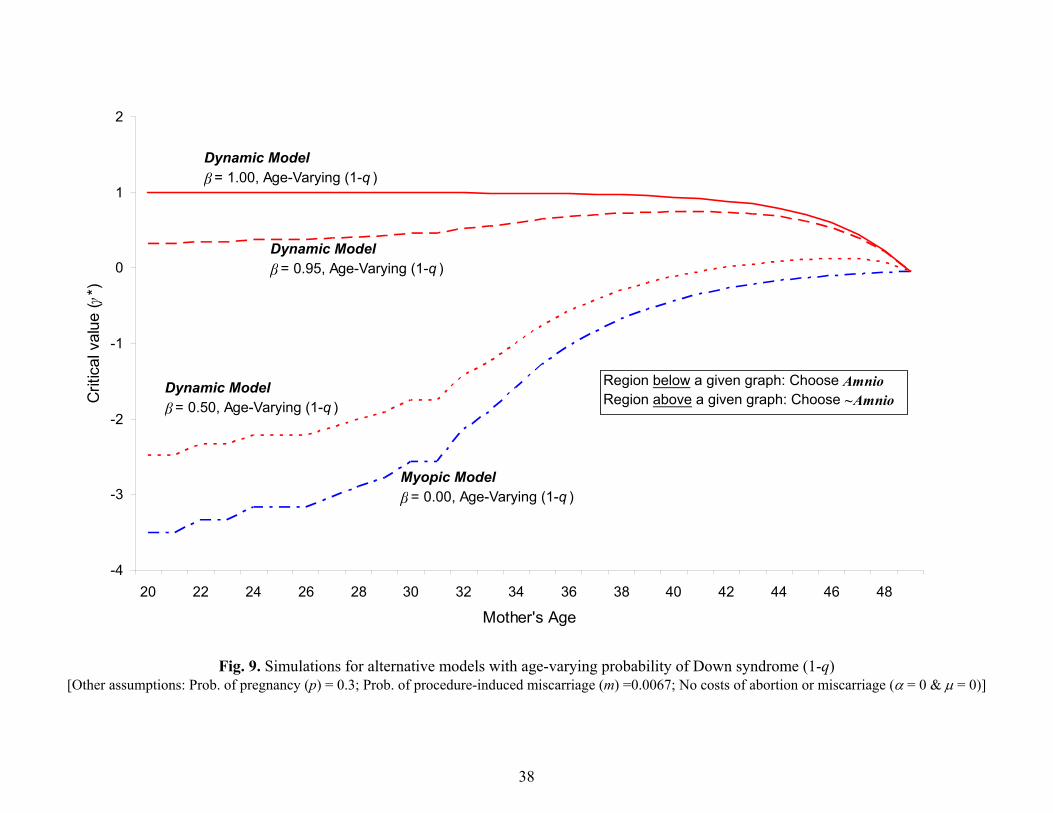
In Figure 9, the only change in the specifications of either the Dynamic or Myopic
models is to allow the probability of a genetic disorder to vary with age, following the pattern in
Figure 1. Several interesting implications emerge by comparing the age patterns for * displayed
in this Figure 8 and Figure 9. First, both figures make clear that forward-looking women have a
greater incentive to have an amniocentesis at early ages compared to optimal choices under the
Myopic Model. Second, when women face a rising (with age) risk of having a child having a
genetic disorder, under either the Dynamic or Myopic model, their incentive to have an
amniocentesis is lowered at early ages. In the Myopic model, the rising pattern to * simply
reflects a age-by-age response to the increasing risk of a birth defect with age; as the risk of a
birth defect goes up, the incentives to learn about the potential problems with a fetus rise. With
respect to the Dynamic models, the consequences of rising rates of birth defects for the age
pattern in * depend on the extent of discounting. At the extreme, if women do not discount the
future at all, i.e., = 1.00, the likelihood of an amniocentesis does not rise with age. Rather, the
option value effect noted above dominates her (their) amniocentesis decisions, giving rise to high
rates of amniocentesis at early ages, while the risks of miscarriage associated with an
amniocentesis, causes their utilization to decline as the woman (couple) reaches the end of the
childbearing period.
Figure 9 here
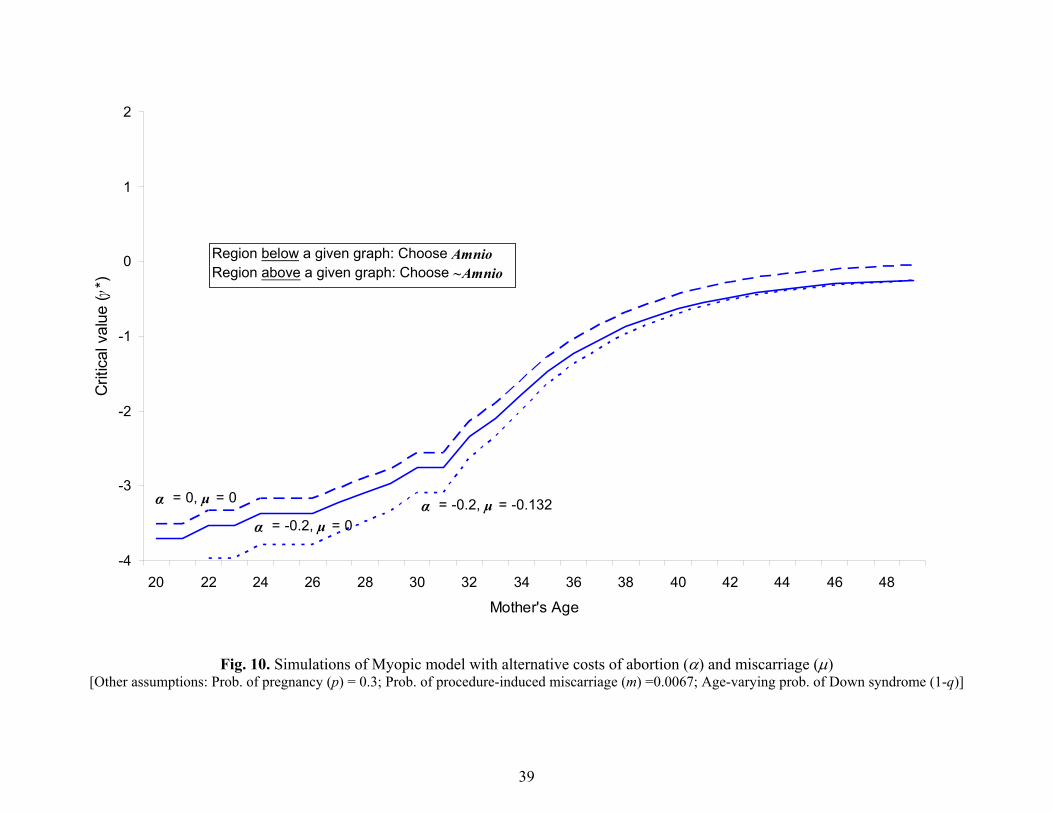
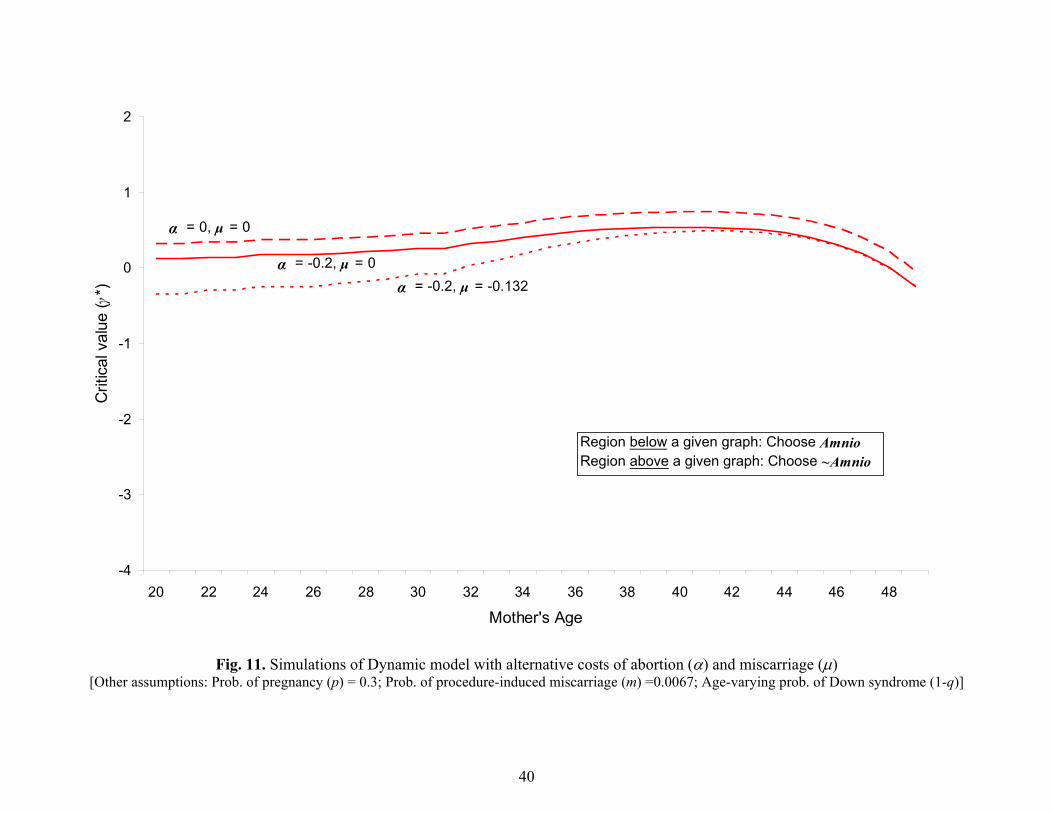
In Figures 10 and 11, we examine how the predictions of our Myopic and Dynamic

26
models, respectively, are affected by changes in the utility costs of abortions and costs. As can be
seen from these figures, higher costs to either abortion reduces the critical value for
amniocenteses equally at all ages while higher costs for miscarriages tend to reduce the incidence
of amniocenteses more at younger ages than at older ones.
Figure 10 here
Figure 11 here
Finally, in Figure 12, we summarize our findings by graphing the life cycle pattern of *
for both our Dynamic and Myopic models, for both age-invariant and age-varying rates of
genetic disorders (1-q). While more work needs to be done in “calibrating” the Dynamic
models,16 this figure suggests that a Dynamic model in which there is some, but not complete,
discounting of the future and which incorporates the age-varying rates of birth defects (1-q)
displayed in Figure 1 can generate the qualitative features of the observed age-patterns in the
incidence of amniocenteses. In particular, such a model is able to generate both the rise in the
incidence of amniocentesis with age and the decline in its utilization at older ages. In contrast,
the Myopic model we calibrate does not generate a decline in *T s – and, thus, in the incidence
of amniocenteses – as women approach menopause.
Figure 12 here
5. Concluding Observations
In this paper, we examine the appropriateness of the threshold-age approach in the
protocol for recommending amniocentesis testing to pregnant women, based on a dynamic model
of the decision making process. In particular, we consider the potentially welfare enhancing
16 In particular, it would appear that we can achieve age-patterns that more closely accord with those in the actual data for amniocenteses displayed in Figures 5 through 7 by increasing some combination of the disutility costs of miscarriages or abortions.

27
effect of fully informing women of the risks and benefits of such a procedure, irrespective of age.
Based on our calibration exercise, it does appear that the features of our model may be
important in accounting for the observed life cycle pattern of amniocenteses. In particular, the
dynamic model of optimal amniocentesis choice outlined above, when it includes some, but not
total, discounting of the future and conditions on increasing rates of genetic disorders with age,
does appear to generate age-patterns consistent with the data. Moreover, it appears that Myopic
models fail to predict the decline in the incidence of amniocentesis with age that are found in the
data. While further exploration of the calibration of the Dynamic model is needed (for instance,
to account for endogenous desired family size or an age-dependent pregnancy rate) these initial
findings suggest real merit to develop and estimate a dynamic structural model of amniocentesis
choice of the sort outlined in this paper.
These initial findings, if they hold up to further scrutiny, have potentially important
implications for medical practice and insurance company policies for the funding of this
procedure. In particular, our results suggest that the medical community and insurance
companies may be ignoring the option value of amniocenteses when women are young.
Currently, 80% of Down syndrome children are born to women under the age of 35. Our model
suggests that some of these young women, if informed of the full costs and benefits of the
procedure and given the option to have it, would undergo an amniocentesis and, upon learning of
the results of this test, would choose to abort a chromosomally abnormal fetus in favor of a
future pregnancy that could result in a healthy birth. As such, existing guidelines of health care
providers and insurance companies in setting policies for the ages at which amniocenteses will
be funded are potentially inconsistent with the choices some women would make for themselves
if free to acquire the information provided by this procedure. Further exploration and estimation
28
of this model may help to inform medical practice and policy by explicitly accounting for choice
behavior among women (couples) that take account of the future consequences of their actions.
References
Ben-Porath, Y. (1976). Fertility response to child mortality: Micro data from Israel. Journal of Political Economy, 84, S163-S178.
Dick P. T., with the Canadian Task Force on the Periodic Health Examination. (1996). Periodic health examination, 1996 update: 1. Prenatal screening and diagnosis of Down syndrome. Canadian Medical Association Journal, 154, 465-79.
Hook, E. B. (1991). Rates of chromosomal abnormalities at different maternal ages. Obstetrics and Gynecology, 58, 282-285.
Hook, E. B., P. K. Cross, & D. M. Schreinemachers. (1983). Chromosomal abnormality rates at amniocentesis and in live-born infants. Journal of the American Medical Association. 249, 2034-2038.
Leridon, H. (2008). A new estimate of permanent sterility by age: sterility defined as the inability to conceive. Population Studies, 62, 15-24.
National Center for Health Statistics (1994). Advance report of maternal and infant health from the birth certificate, 1991. Monthly Vital Statistics Report, 42(11), suppl., Hyattsville, MD: Public Health Service.
Preston, S. H. (1978). Introduction. In S.H. Preston (Ed.), The effects of infant and child mortality on fertility (pp. 1-18). New York: Academic Press.
Sah, R. K. (1991). The effects of child mortality and fertility choice and parental welfare. Journal of Political Economy, 99, 582-606.
Shultz, T. P. (1969). An economic model of family planning and fertility. Journal of Political Economy, 77, 153-180.
Shultz, T. P. (1976). Interrelationships between mortality and fertility. In R. G. Ridker (Ed.), Population and development: The search for Selective Interventions (pp. 239-289). Baltimore, MD: John Hopkins University Press.
Sicherman, N., A. T. Bombard, & P. Rappoport (1995). Current maternal age recommendations for prenatal diagnosis: Reappraisal using the expected utility theory. Fetal Diagnosis and Therapy, 10, 157-166.
Taylor, W. F. (1969). The probability of fetal death. In F.C. Fraser & V.A. McKusic (Eds.), Congenital Malformations (pp. 307-32), New York: Excerpta Medica.

29
U.S. Preventative Service Task Force. (1996). Screening for Down syndrome. Guide to Clinical Preventive Services, 2nd ed. Baltimore, MD: Williams & Wilkins.
Waitzman, N. J., P. S. Romano, & R. M. Scheffler (1994). Estimates of the economic costs of birth defects. Inquiry, 31, 188-205.
Wolpin, K. (1997). The determinants of infant and child mortality and their consequences for fertility. In M. Rosenzweig & O. Stark (Eds.), Handbook of Population and Family Economics (pp. 483-557). Amsterdam, Netherlands: North-Holland.

30
0
2,000
4,000
6,000
8,000
10,000
12,000
14,000
20 22 24 26 28 30 32 34 36 38 40 42 44 46 48Mother's Age
Num
ber
Abnormal Fetuses Fetal Loss (UB) Fetal Loss (LB)
Fig. 1. Number of Chromosomally Abnormal Fetuses per 100,000 Pregnancies [Sources: Hook (1981); and Hook, Cross & Schreinemachers (1983) and U.S. Preventative Service Task Force (1996)]
31
Pregnant (p)
~Pregnant (1-p)
~Amnio
Abort
~Abort
AtC
1 1 , , , 1tA t t t t tV D N M A
10 , , ,t t t t tV D N M A
~ AtC
Amnio
Miscarry (m)
Down (1-q)
1 1 , , ,t
DD t t t t tV D N M A
~Miscarry (1-m)
Healthy (q)
1 1 , , ,tN t t t t tV D N M A
Down (1-q)
&~A A
tC
Healthy (q)
1 1 , , ,t
NN t t t t tV D N M A
1 1 , , 1,tm t t t t tV D N M A
Abort
~Abort
1 1 , , ,t
DD t t t t tV D N M A
1 1 , , , 1tA t t t t tV D N M A
denotes Choices
denotes Payoffs
Fig. 2. Decision tree for general model at (mother’s) age t

32
Pregnant (p)
~Pregnant (1-p)
~Amnio
0
~ ATC
Amnio
Miscarry (m)
Down (1-q)
1D
~Miscarry (1-m)
Healthy (q)1
Down (1-q) &~A A
TC
Healthy (q)
1
0
Abort
~Abort
1D
0
denotes Choices
denotes Payoffs
Fig. 3. Decision tree for simplified model at age T

33
Pregnant (p)
~Pregnant (1-p)
~Amnio
0
~1A
TC
Amnio
Miscarry (m)
Down (1-q)
1D
~Miscarry (1-m)
Healthy (q)
1
Down (1-q)
&~
1
A A
TC
Healthy (q)
1
*1 1
*1 1 1
(1 ) if ,
( (1 ) ) if
D
D D
pq m
p q q
Abort
~Abort1D
*1 1
*1 1 1
(1 ) if ,
( (1 ) ) if
D
D D
pq m
p q q
denotes Payoffs
denotes Choices
Fig. 4. Decision tree for simplified model at age T-1
34
0%
5%
10%
15%
20%
25%
30%
35%
20 22 24 26 28 30 32 34 36 38 40 42 44 46 48+
Mother's Age
Per
cent
First Child Second Child Third Child Fourth Child
Fig. 5. Percent of estimated wanted and viable pregnancies that undergo amniocentesis, All mothers [Data: NCES Detailed Natality Files, 1990-1994 Pooled]

35
0%
5%
10%
15%
20%
25%
30%
35%
20 22 24 26 28 30 32 34 36 38 40 42 44 46+ 48
Mother's age
Pe
rce
nt
First Child Second Child Third Child Fourth Child
Fig. 6. Percent of wanted and viable pregnancies that undergo amniocentesis, Mothers with yrs. of school 12 [Data: NCES Detailed Natality Files, 1990-94 Pooled]

36
0%
5%
10%
15%
20%
25%
30%
35%
20 22 24 26 28 30 32 34 36 38 40 42 44 46 48+
Mother's Age
Per
cent
First Child Second Child Third Child Fourth Child
Fig. 7. Percent of wanted and viable pregnancies that undergo amniocentesis, Regression Adjusted [NCES Detailed Natality Files, 1990-94 Pooled]
37
-4
-3
-2
-1
0
1
2
20 22 24 26 28 30 32 34 36 38 40 42 44 46 48
Mother's Age
Crit
ical
val
ue (γ
* )
Dynamic Model
β= 0.95, Constant (1-q )
Region below a given graph: Choose AmnioRegion above a given graph: Choose ~Amnio
Dynamic Model
β= 0.50, Constant (1-q )
Myopic Model
β= 0.00, Constant (1-q )
Fig. 8. Simulations for alternative models with age-invariant probability of Down syndrome (1-q) [Other assumptions: Prob. of pregnancy (p) = 0.3; Prob. of procedure-induced miscarriage (m) =0.0067; No costs of abortion or miscarriage ( = 0 & = 0)]
38
-4
-3
-2
-1
0
1
2
20 22 24 26 28 30 32 34 36 38 40 42 44 46 48
Mother's Age
Crit
ical
val
ue (γ
*)
Region below a given graph: Choose AmnioRegion above a given graph: Choose ~Amnio
Dynamic Model
β= 1.00, Age-Varying (1-q )
Dynamic Model
β= 0.95, Age-Varying (1-q )
Dynamic Model
β= 0.50, Age-Varying (1-q )
Myopic Model
β= 0.00, Age-Varying (1-q )
Fig. 9. Simulations for alternative models with age-varying probability of Down syndrome (1-q) [Other assumptions: Prob. of pregnancy (p) = 0.3; Prob. of procedure-induced miscarriage (m) =0.0067; No costs of abortion or miscarriage ( = 0 & = 0)]
39
-4
-3
-2
-1
0
1
2
20 22 24 26 28 30 32 34 36 38 40 42 44 46 48
Mother's Age
Crit
ical
val
ue (γ
*)
Region below a given graph: Choose AmnioRegion above a given graph: Choose ~Amnio
α = -0.2, μ = 0α = -0.2, μ = -0.132α = 0, μ = 0
Fig. 10. Simulations of Myopic model with alternative costs of abortion () and miscarriage () [Other assumptions: Prob. of pregnancy (p) = 0.3; Prob. of procedure-induced miscarriage (m) =0.0067; Age-varying prob. of Down syndrome (1-q)]
40
-4
-3
-2
-1
0
1
2
20 22 24 26 28 30 32 34 36 38 40 42 44 46 48
Mother's Age
Crit
ical
val
ue (γ
*)
Region below a given graph: Choose AmnioRegion above a given graph: Choose ~Amnio
α = -0.2, μ = 0
α = -0.2, μ = -0.132
α = 0, μ = 0
Fig. 11. Simulations of Dynamic model with alternative costs of abortion () and miscarriage () [Other assumptions: Prob. of pregnancy (p) = 0.3; Prob. of procedure-induced miscarriage (m) =0.0067; Age-varying prob. of Down syndrome (1-q)]

41
-4
-3
-2
-1
0
1
2
20 22 24 26 28 30 32 34 36 38 40 42 44 46 48
Mother's Age
Crit
ical
val
ue (γ
*)
Region below a given graph: Choose AmnioRegion above a given graph: Choose ~Amnio
Myopic Model
β= 0.00, Constant (1-q )
Myopic Model
β= 0.00, Age-Varying (1-q )
Dynamic Model
β= 0.95, Age-Varying (1-q )
Dynamic Model
β= 0.95, Constant (1-q )
Fig. 12. Simulations of Dynamic and Myopic models for alternative discount rates () and probabilities of Down syndrome (1-q) [Other assumptions: Prob. of pregnancy (p) = 0.3; Prob. of procedure-induced miscarriage (m) =0.0067; No costs of abortion (=0) or miscarriage (=0)]