a fairer, healthier scotland: a way forward together #g2014
TRANSCRIPT

A fairer, healthier Scotland: a way forward together
#G2014
Health inequalities: what are they and what works to reduce them?
Gerry McCartneyConsultant in Public Health & Head of Public Health ObservatoryNHS Health Scotland
Of all inequalities, injustice in health is the most shocking and inhumane
Martin Luther King
Health inequalities can be defined as the:
“systematic differences in the health of people occupying unequal positions in society”1
1 Graham H. The challenge of health inequalities, In: Graham H. Understanding health inequalities. Maidenhead: Open University Press, 2009.
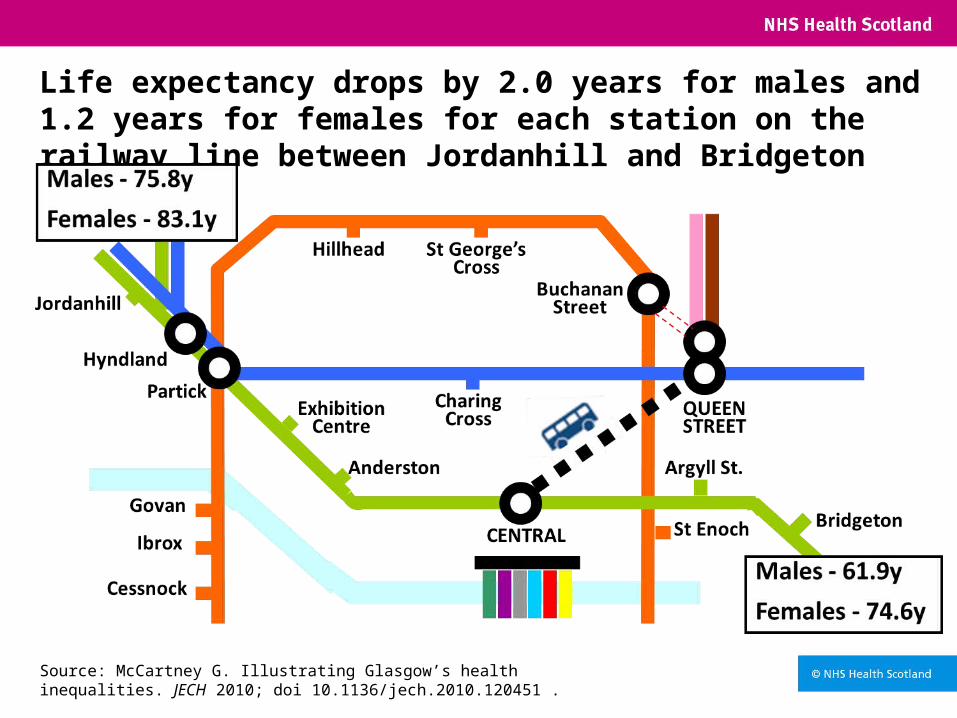
Life expectancy drops by 2.0 years for males and 1.2 years for females for each station on the railway line between Jordanhill and Bridgeton
Source: McCartney G. Illustrating Glasgow’s health inequalities. JECH 2010; doi 10.1136/jech.2010.120451 .
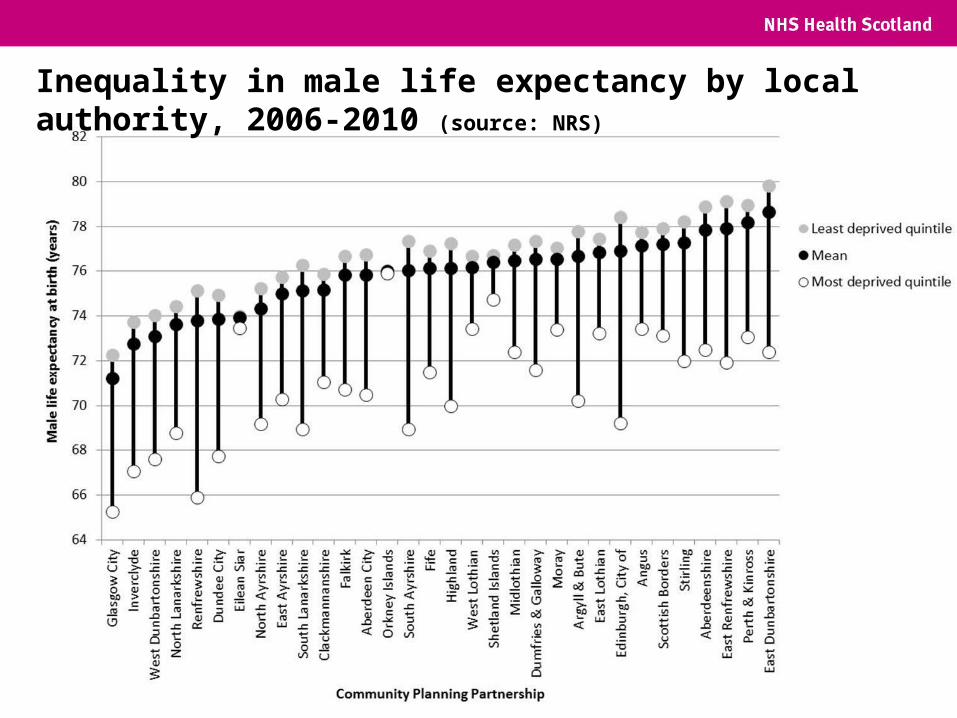
Inequality in male life expectancy by local authority, 2006-2010 (source: NRS)
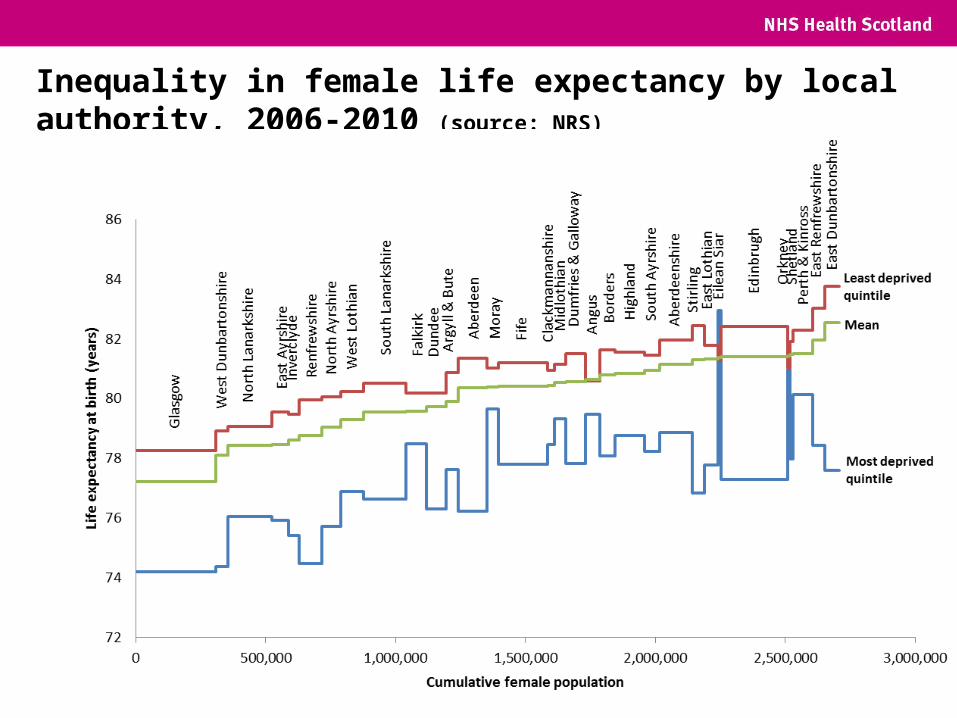
Inequality in female life expectancy by local authority, 2006-2010 (source: NRS)
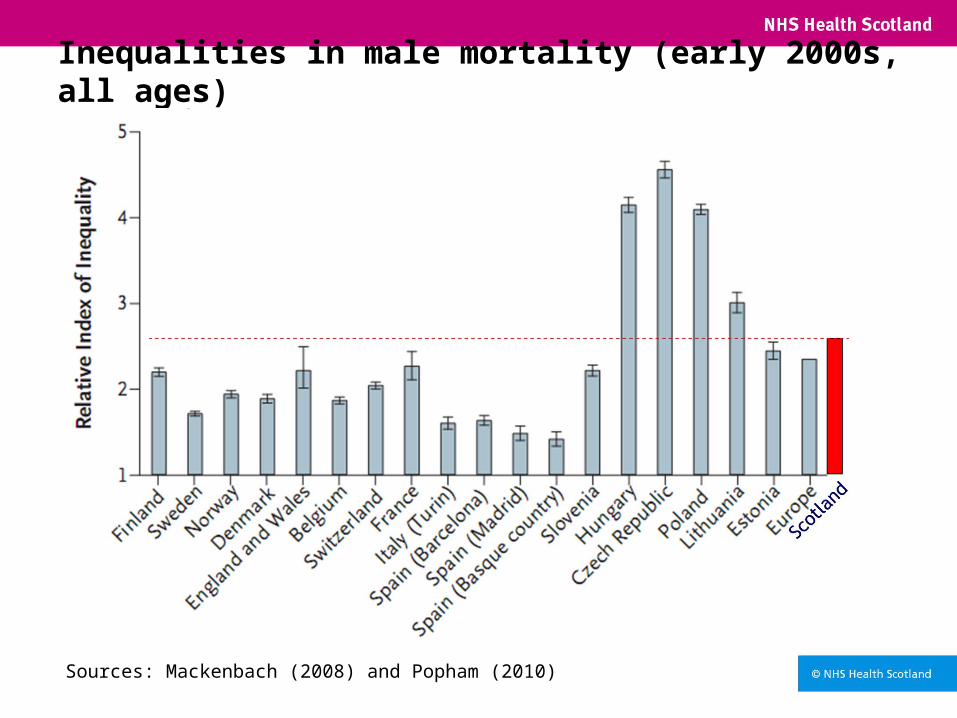
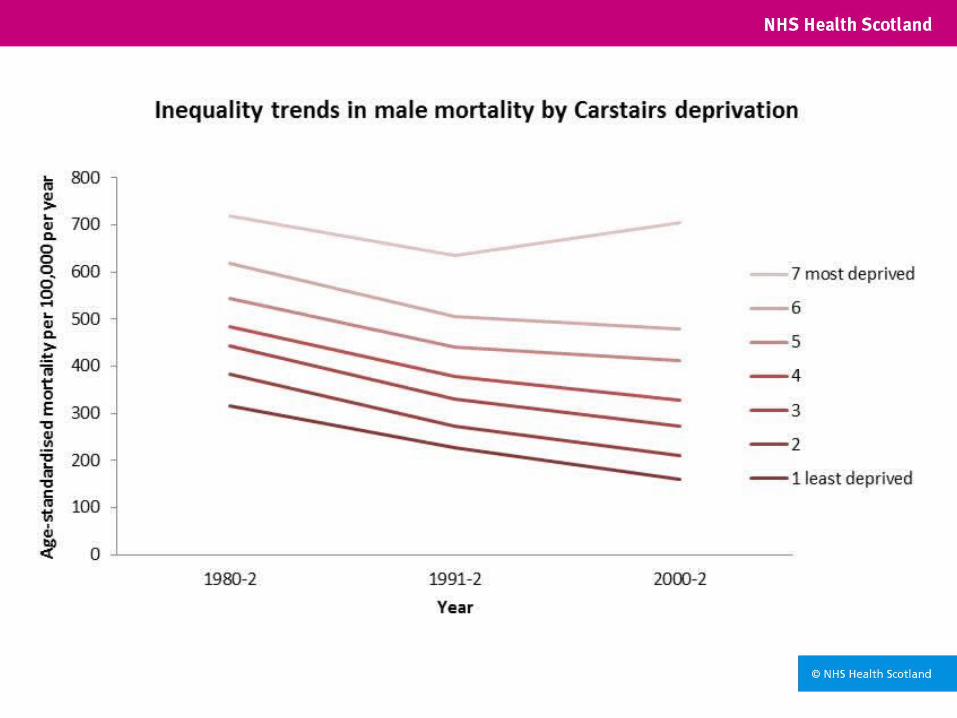
Inequalities in male mortality (early 2000s, all ages)
Sources: Mackenbach (2008) and Popham (2010)
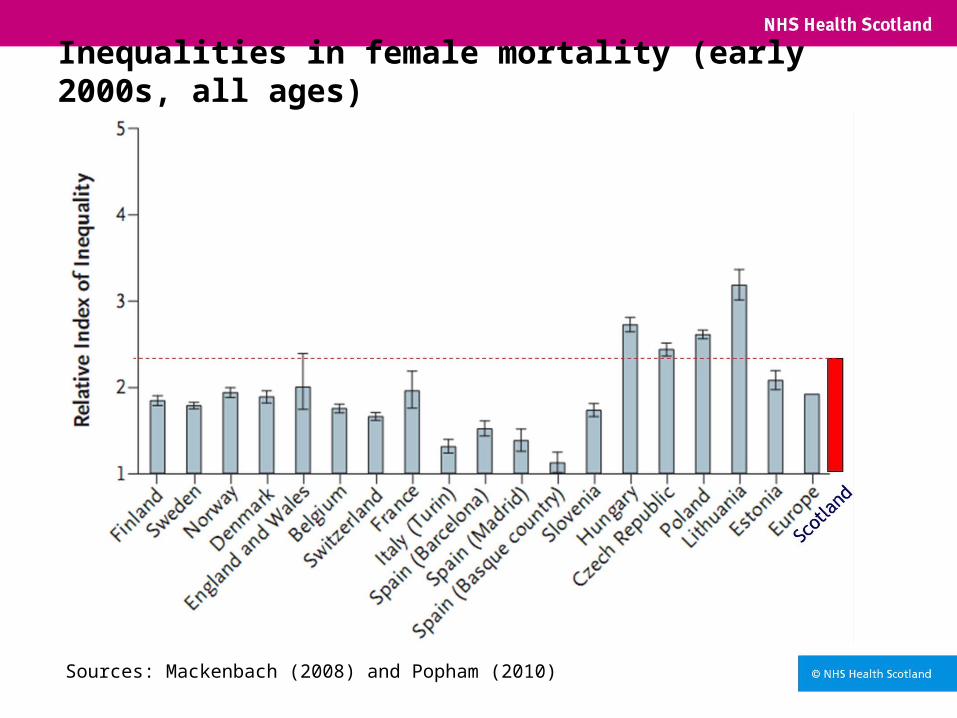
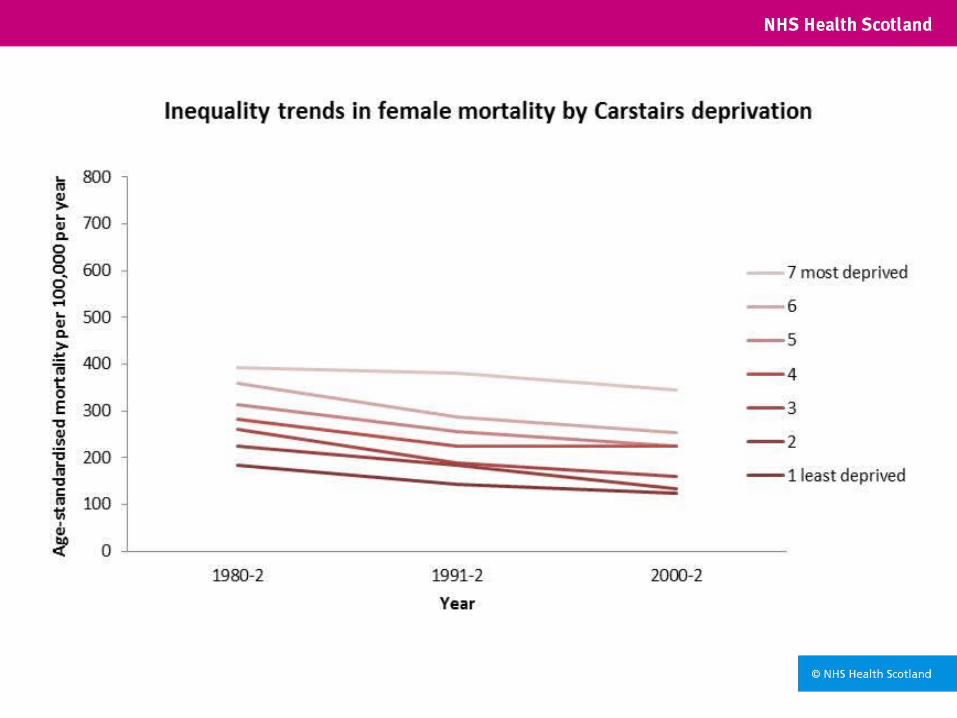
Inequalities in female mortality (early 2000s, all ages)
Sources: Mackenbach (2008) and Popham (2010)
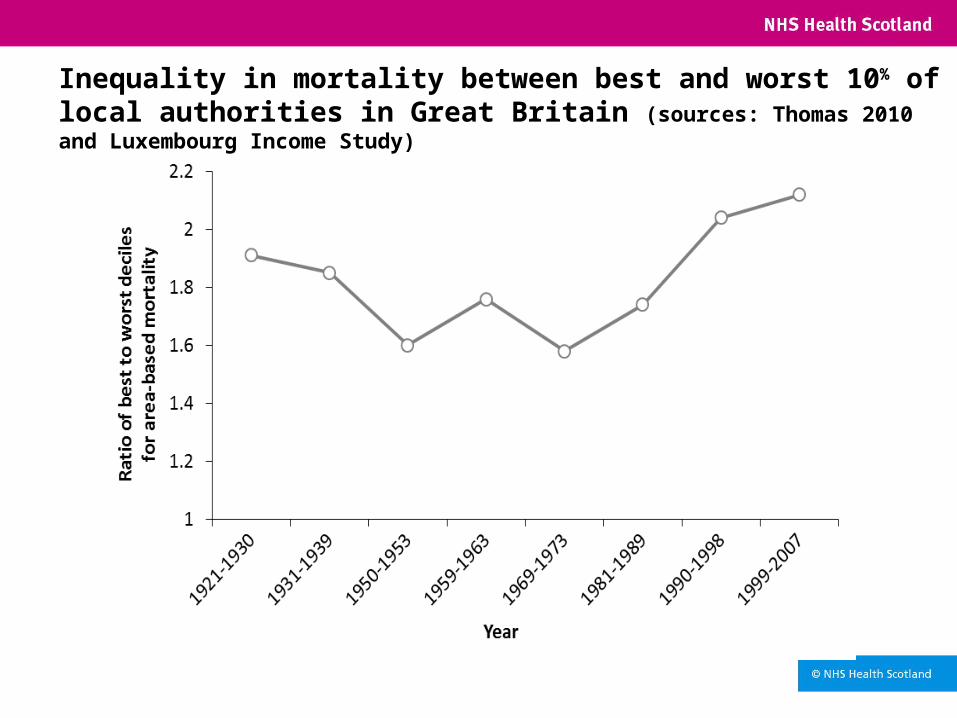
Inequality in mortality between best and worst 10% of local authorities in Great Britain (sources: Thomas 2010 and Luxembourg Income Study)
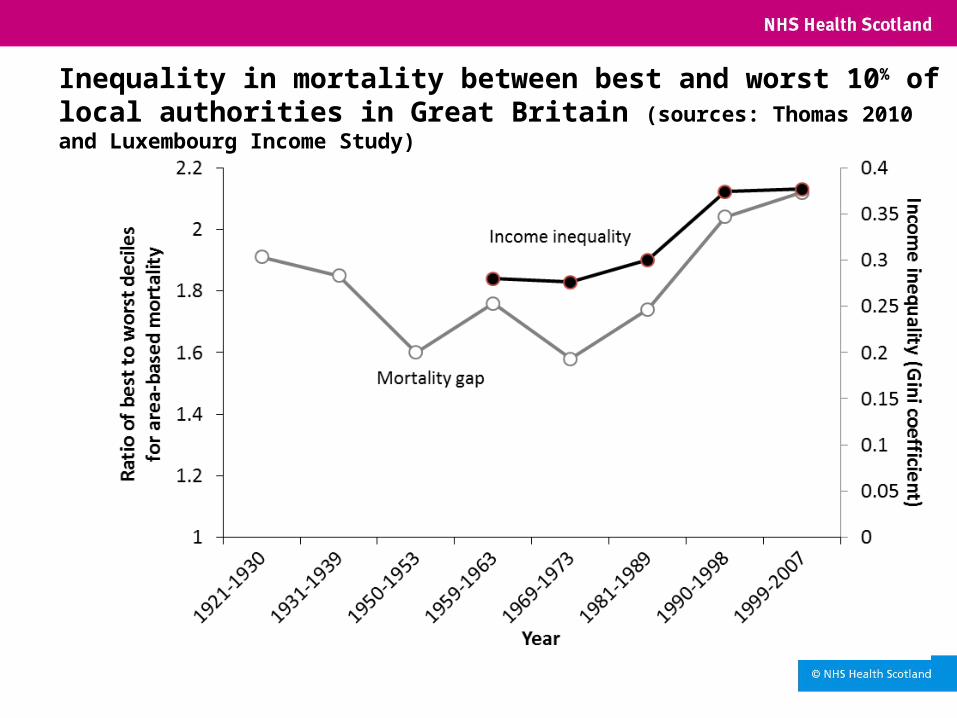
Inequality in mortality between best and worst 10% of local authorities in Great Britain (sources: Thomas 2010 and Luxembourg Income Study)
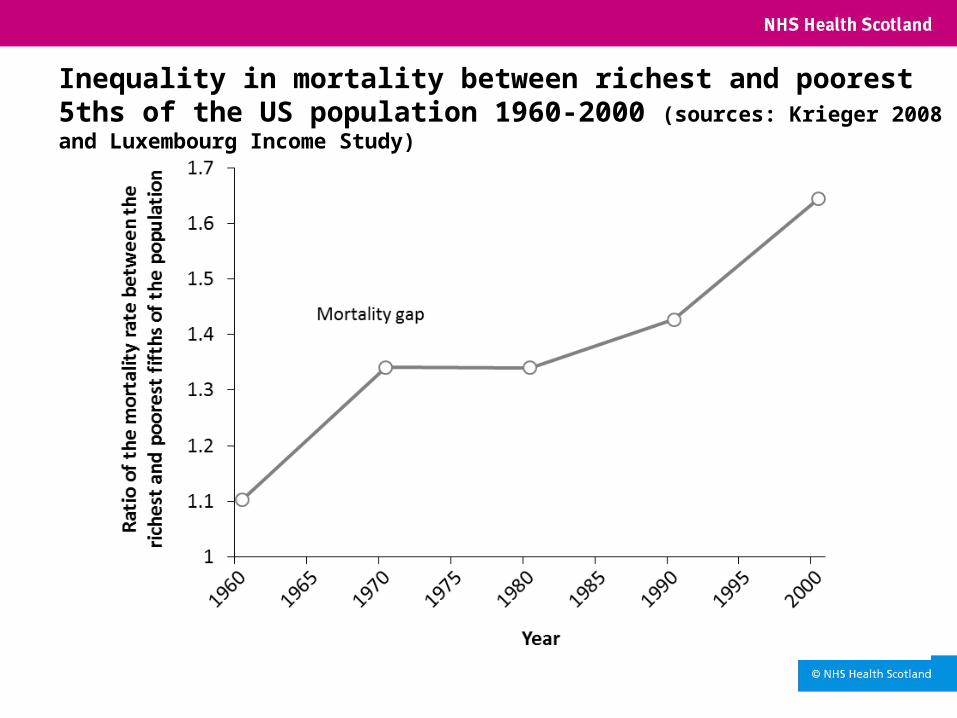
Inequality in mortality between richest and poorest 5ths of the US population 1960-2000 (sources: Krieger 2008 and Luxembourg Income Study)
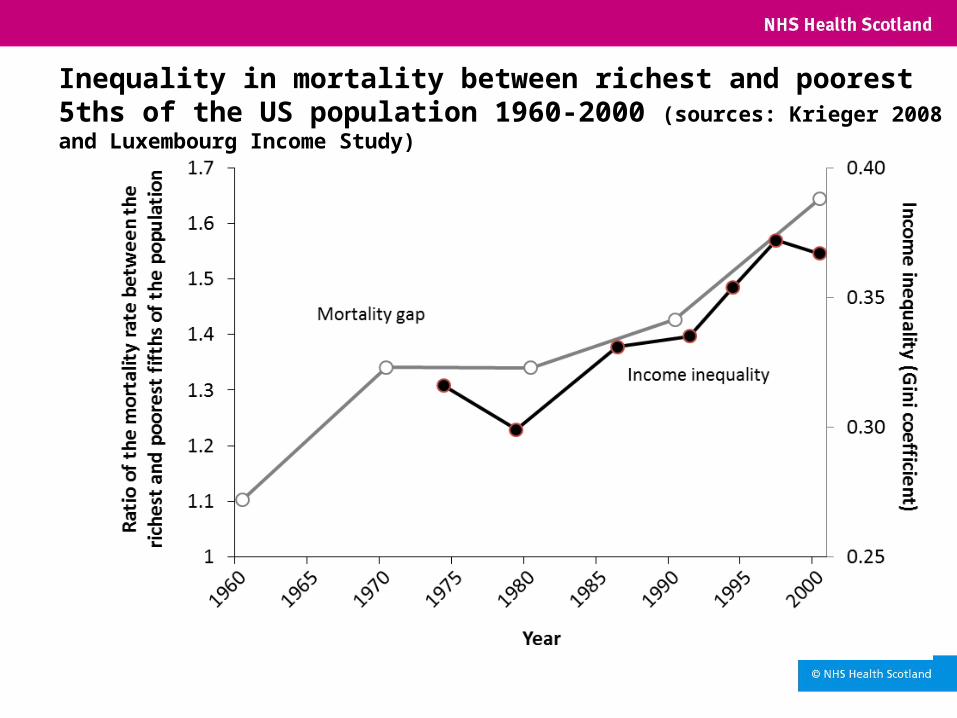
Inequality in mortality between richest and poorest 5ths of the US population 1960-2000 (sources: Krieger 2008 and Luxembourg Income Study)
• Health inequalities are wide and growing in Scotland• They account for about 5,000 additional deaths/year• They have grown quickly over the last 40 years • They are much narrower in other places and have been
narrower here in the past
Summary so far…
What causes health inequalities?
4 theories have been proposed: 1. Artefact (i.e. we aren’t measuring it well enough)2. Selection theories (i.e. poor health causes social slide)3. Behaviours and culture (i.e. poor people behave badly)4. Structural & political economy (i.e. politics and policy are
the cause)
Artefact• Undermined by inequalities demonstrated using different
statistical measures of social status• …and in different places and different times• Very difficult to sustain a theory that such outcomes are
unrelated to social status• However, improved measures of social status, or, perhaps
better, of the social realities of people’s ‘lived experience’, would still be helpful
Selection
• The zombie hypothesis• Selection – reverse causation argument (i.e. poor health
causes social slide)• Longitudinal studies which measure social status early in life
amongst healthy people and track people over time for health problems show little social slide1 2
1 Smith G. D., C. Hart, D. G. Watt, D. Hole, V. Hawthorne. 1998. Individual social class, area-based deprivation, cardiovascular disease risk factors, and mortality: the Renfrew and Paisley study. J Epidemiol Community Health 52: 399-402.2 Power C., S. Matthews. 1997. Origins of health inequalities in a national population sample. Lancet 350(9091): 1584-9.
Behavioural and cultural
• Important, but partial, theory• Advocates suggest that the prevalence of behaviours (e.g.
smoking, alcohol & diet) cultures or skills (e.g. parenting) are the root causes of health inequalities
•Unhealthy behaviours are more prevalent in lower socio-economic groups, however:•The same behaviours generate higher mortality amongst working class •It ignores why particular social groups adopt unhealthy behaviours1 2
•The patterning of health behaviours is explained by socio-economic circumstances•Where unhealthy behaviours have equalised, mortality inequalities have not3 •Changes over time in the causes of death responsible for inequalities suggest that removing one particular exposure (e.g. unclean drinking water) only changes one high cause-specific mortality rate for another4 5
1 Nettle D. Social class through the evolutionary lens. The Psychologist 2009; 22(11): 934-7. 2 Lynch JW, Kaplan GA, Salonen JT. Why do poor people behave poorly? Variation in adult health behaviours and psychosocial characteristics by stages of the socioeconomic lifecourse. Social Science and Medicine 1997; 44(6): 809-8193 Stringhini S, Dugravot A, Shipley M, Goldberg M, Zins M, Kivima M, Marmot M, Sabia S, Singh-Manoux A. Health Behaviours, Socioeconomic Status, and Mortality: Further Analyses of the British Whitehall II and the French GAZEL Prospective Cohorts. PLoS Med 2011; 8(2): e1000419. doi:10.1371/journal.pmed.1000419. 4 Link BG, Phelan J. McKeown and the idea that social conditions are fundamental causes of disease. American Journal of Public Health 2002; 92(5): 730-2. 5 Mackenbach JP. What would happen to health inequalities if smoking were eliminated? BMJ 2011; 342: d3460.
Structural and political economy • Differences in income, resources and power between groups
cause health inequalities: • Health inequalities rise and fall with income inequalities • The health of communities has improved when they have
been given more resources by chance1 • Those with most resources are always the healthiest,
regardless of their behaviours2
• Even when genetic factors are involved (such as cystic fibrosis) inequalities in mortality by social class are wide and vary depending on changing contextual factors3
1 Costello EJ, Compton SN, Keeler G, Angoid A. Relationships between poverty and psychopathology. JAMA 2003; 290: 2023-9. 2 Commission on Social Determinants of Health. 2008. Closing the gap in a generation: Health equity through action on the social determinants of health. Final Report of the Commission on Social Determinants of Health. Geneva, World Health Organization. 3 Barr HL, Britton J, Smyth AR, Fogarty AW. Association between socioeconomic status, sex, and age at death from cystic fibrosis in England and Wales (1959 to 2008): cross sectional study. BMJ 2011; 343: d4662.
• Structural explanations fit best• Behavioural and cultural theories are relevant, but
insufficient. Blaming poor people for their behaviours, skills and cultures is damaging
• Selection theory doesn’t explain much• Therefore health inequalities are determined by political
decisions and political priorities • Health inequalities are not inevitable and have been reduced
in the past and in other places
Summary so far…
Least likely actions to reduce health inequalities
• Information based campaigns (mass media information campaigns)
• Written materials (pamphlets, food labelling)• Campaigns reliant on people taking the initiative to opt in• Campaigns/messages designed for the whole population• Whole school health education approaches (e.g. school
based anti-smoking and alcohol programmes)• Approaches which involve significant price or other
barriers• Housing or regeneration programmes that raise housing
costs
Most likely actions to reduce health inequalities (1)
• Policies which make income, power and wealth more equitable (e.g. tax and benefit systems, democratisation)
• Structural changes in the environment: (e.g. area wide traffic calming schemes, separation of pedestrians and vehicles, child resistant containers, installation of smoke alarms, installing affordable heating in damp cold houses)
• Legislative and regulatory controls (e.g. drink driving legislation, lower speed limits, seat belt legislation, smoking bans in workplaces, child restraint loan schemes and legislation, house building standards, vitamin and folate supplementation of foods)
• Fiscal policies (e.g. increase price of tobacco and alcohol products)
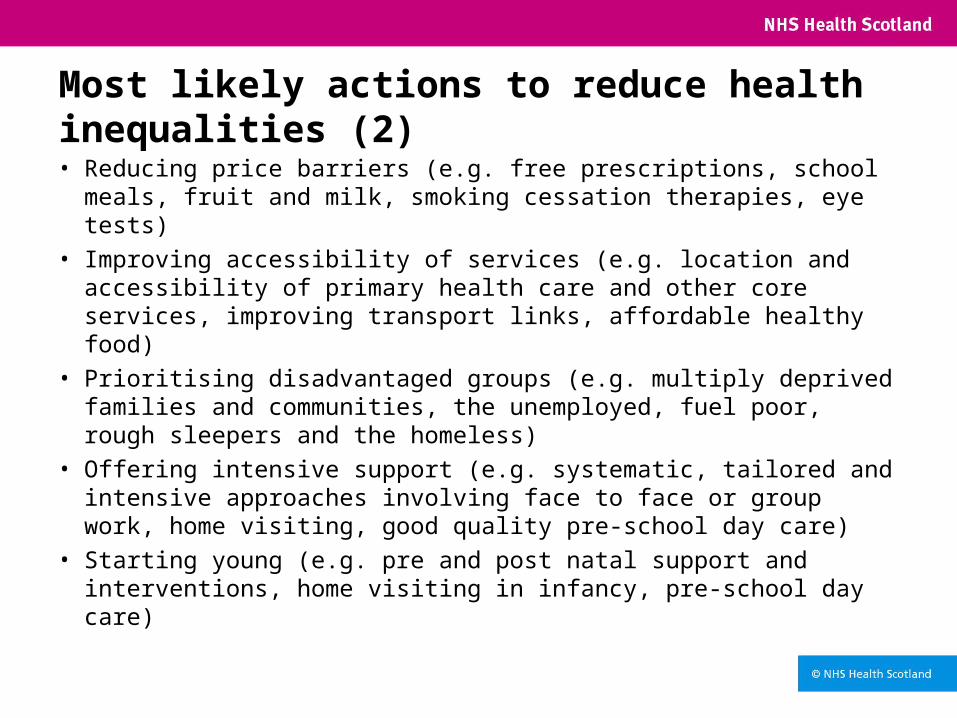
Most likely actions to reduce health inequalities (2)
• Reducing price barriers (e.g. free prescriptions, school meals, fruit and milk, smoking cessation therapies, eye tests)
• Improving accessibility of services (e.g. location and accessibility of primary health care and other core services, improving transport links, affordable healthy food)
• Prioritising disadvantaged groups (e.g. multiply deprived families and communities, the unemployed, fuel poor, rough sleepers and the homeless)
• Offering intensive support (e.g. systematic, tailored and intensive approaches involving face to face or group work, home visiting, good quality pre-school day care)
• Starting young (e.g. pre and post natal support and interventions, home visiting in infancy, pre-school day care)
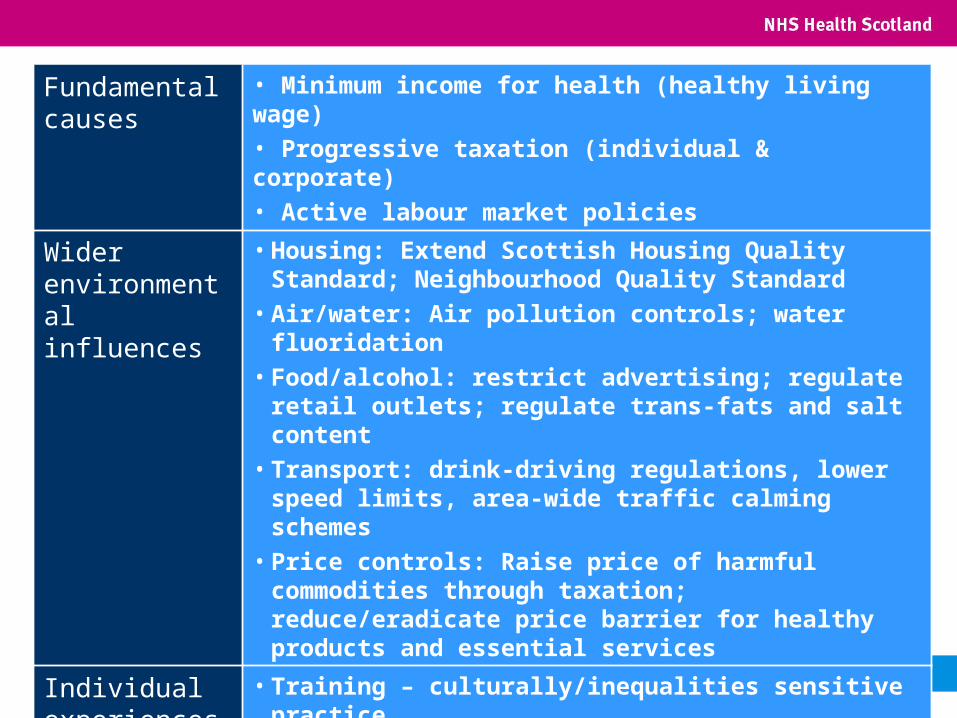
Fundamental causes
• Minimum income for health (healthy living wage)
• Progressive taxation (individual & corporate)
• Active labour market policies
Wider environmental influences
• Housing: Extend Scottish Housing Quality Standard; Neighbourhood Quality Standard
• Air/water: Air pollution controls; water fluoridation
• Food/alcohol: restrict advertising; regulate retail outlets; regulate trans-fats and salt content
• Transport: drink-driving regulations, lower speed limits, area-wide traffic calming schemes
• Price controls: Raise price of harmful commodities through taxation; reduce/eradicate price barrier for healthy products and essential services
Individual experiences
• Training – culturally/inequalities sensitive practice
• Linked public services for vulnerable/high risk individuals
• Specialist outreach and targeted services
My organisation does this already…
• If so – great!• But, are you sure? How do you know? • Support is available (e.g. Evaluation Support Scotland) • High quality evaluation is essential if good practice is to be
spread and if we are to improve what we all do
Conclusions
•Health is worse and improving more slowly in Scotland compared to the rest of Europe•Health inequalities are large and increasing•Policies and politics are the causes of health inequalities: behaviour and culture are only partial explanations•More equitable distribution of income, power and wealth is paramount•Regulation, taxation and structural changes to the socio-economic environment are also likely to help, as is intensive support for those most in need•Health inequalities are not inevitable and can be reduced
A fairer, healthier Scotland: a way forward together
#G2014
A Fairer, Healthier Scotland and World
Wednesday 19th February 2014
Overview of Presentation
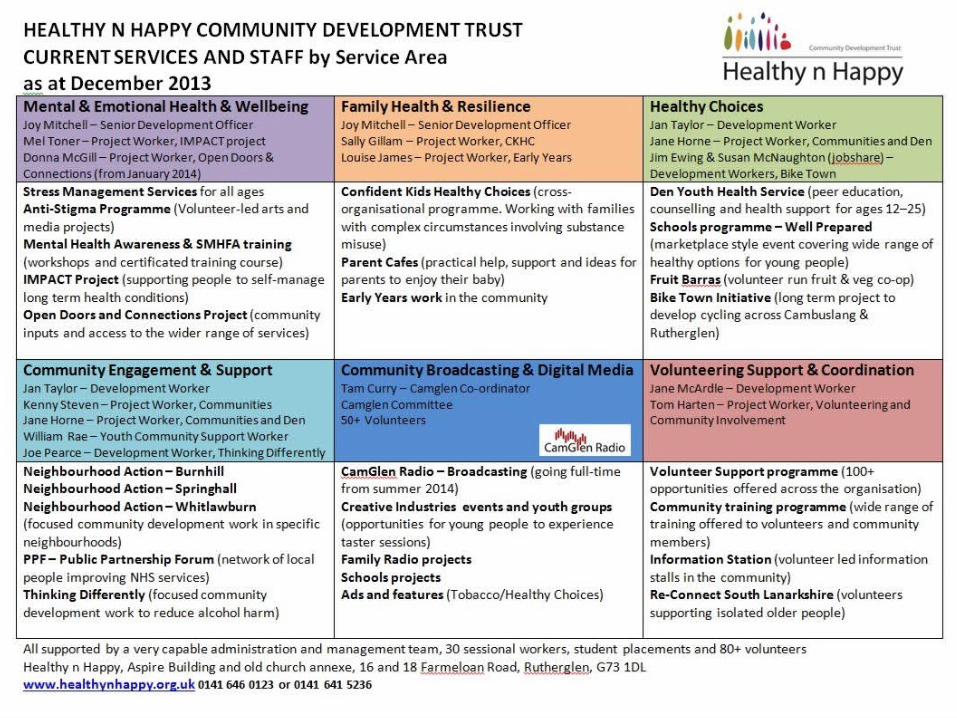
•Introduce Healthy n Happy•A brief musical interlude
•A PLEA•What we do and how we do it
•History and operating environment• Raison dêtre and Vision:Cambuslang and Rutherglen will be the healthiest and happiest places to live in ScotlandBest in our field in ScotlandAn excellent employerConnector/The Glue
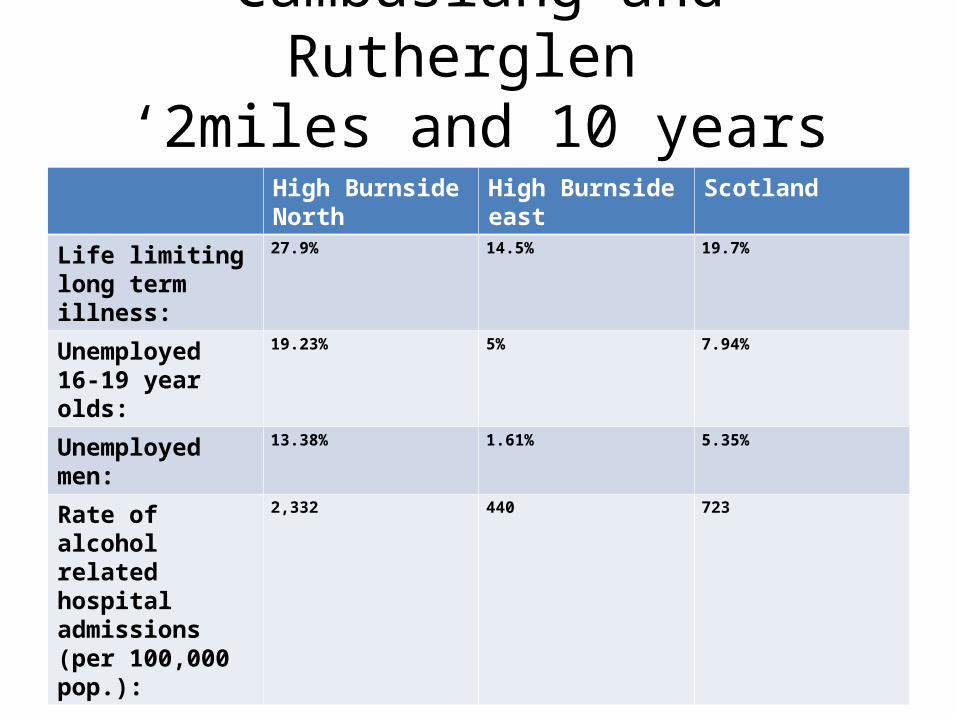
Cambuslang and Rutherglen ‘2miles and 10 years apart’
High Burnside North
High Burnside east Scotland
Life limiting long term illness:
27.9% 14.5% 19.7%
Unemployed 16-19 year olds:
19.23% 5% 7.94%
Unemployed men: 13.38% 1.61% 5.35%
Rate of alcohol related hospital admissions (per 100,000 pop.):
2,332 440 723
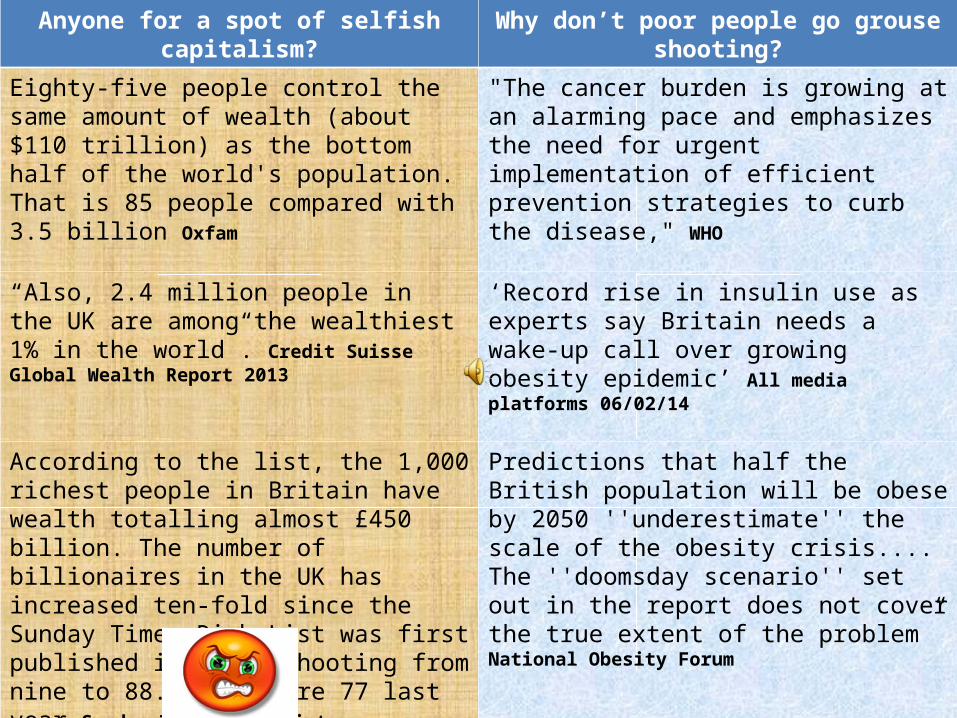
Anyone for a spot of selfish capitalism? Why don’t poor people go grouse shooting?
Eighty-five people control the same amount of wealth (about $110 trillion) as the bottom half of the world's population.That is 85 people compared with 3.5 billion Oxfam
"The cancer burden is growing at an alarming pace and emphasizes the need for urgent implementation of efficient prevention strategies to curb the disease," WHO
“Also, 2.4 million people in the UK are among the wealthiest 1% in the world”. Credit Suisse Global Wealth Report 2013
‘Record rise in insulin use as experts say Britain needs a wake-up call over growing obesity epidemic’ All media platforms 06/02/14
According to the list, the 1,000 richest people in Britain have wealth totalling almost £450 billion. The number of billionaires in the UK has increased ten-fold since the Sunday Times Rich List was first published in 1989, shooting from nine to 88. There were 77 last year Sunday Times Rich List.
Predictions that half the British population will be obese by 2050 ''underestimate'' the scale of the obesity crisis.... The ''doomsday scenario'' set out in the report does not cover the true extent of the problem” National Obesity Forum
MY BLOOD PRESSURE IS RISING ....WHAT ABOUT YOURS???
What we do and how we do it in 3 easy steps:
•Services and service design processes•The (boring?) but vital bit behind it all: Strategy, Culture, Values, Quality •The most important bit (that nobody really wants to pay for): Connecting and facilitating
Connecting and Facilitating
•Connecting people and communities to policy and planning •Scottish Communities for Health and Wellbeing •Some excellent examples: Bike Town and Burnhill
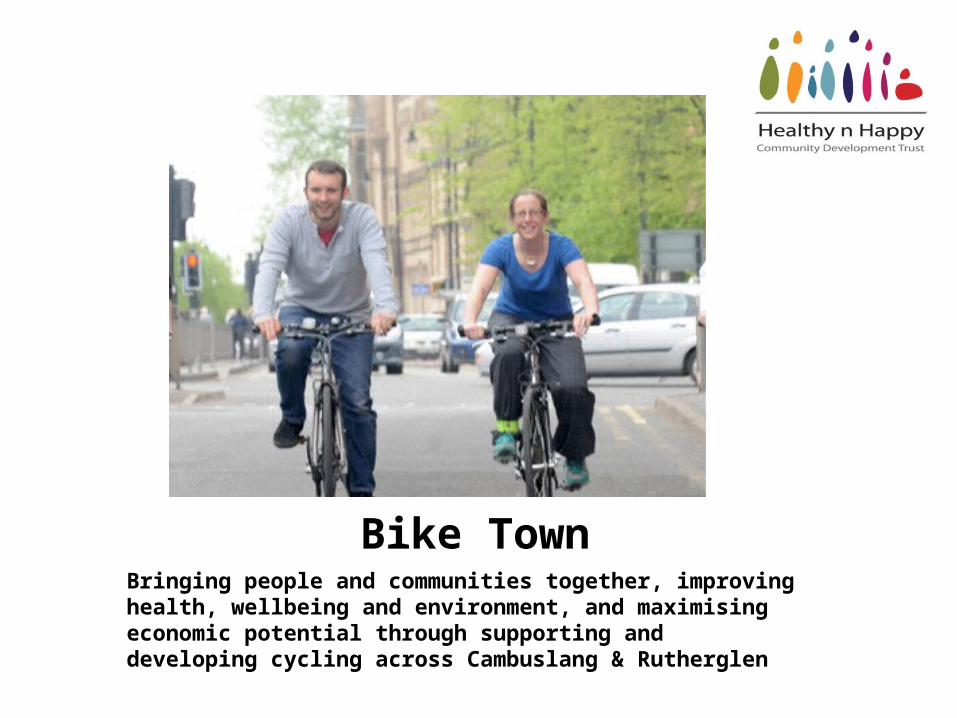
Bike TownBringing people and communities together, improving health, wellbeing and environment, and maximising economic potential through supporting and developing cycling across Cambuslang & Rutherglen
Community Action
• Whole neighbourhood consultation 55% response rate
• Community Spirit • Community and Agency action • Citizenship, Hope and reducing barriers• Communities planning
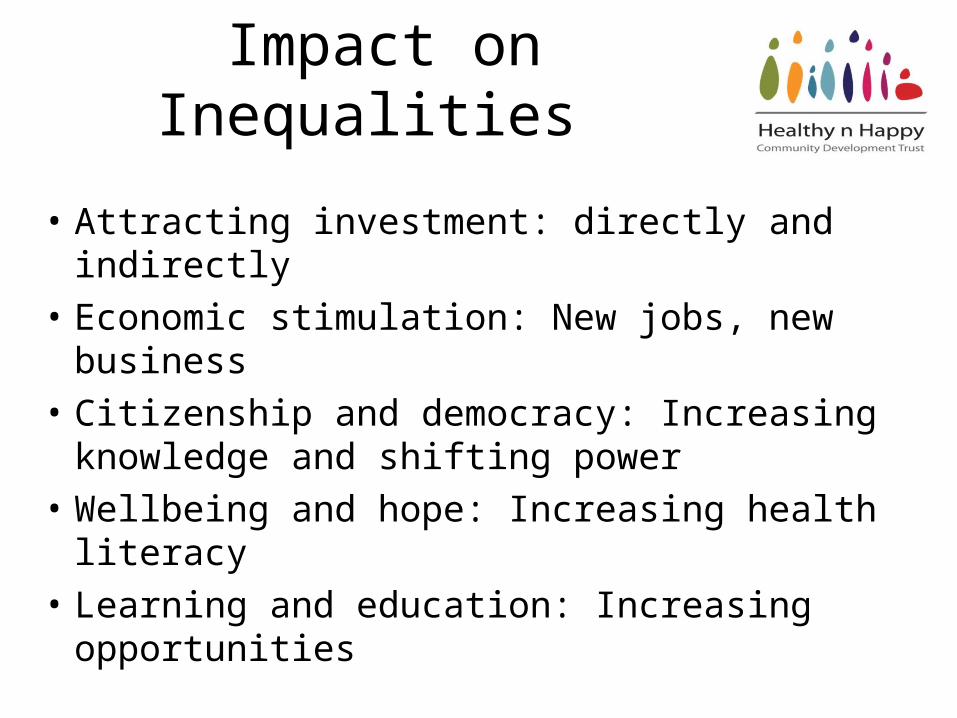
Impact on Inequalities
• Attracting investment: directly and indirectly • Economic stimulation: New jobs, new
business• Citizenship and democracy: Increasing
knowledge and shifting power• Wellbeing and hope: Increasing health literacy• Learning and education: Increasing
opportunities
Tackling health inequalities: a holistic approach or why prevention is better than cure
Maggie Kelly, Interim Policy Advisor, One Parent Families Scotland
#G2014
• What are the key characteristics that support good practice in collaborative practice on health inequalities?
• What have been the barriers to developing good practice and how have you addressed these?
• What key lessons would you ask Conference to share with others?
Facilitated table discussion

A fairer, healthier Scotland: a way forward together
#G2014