a field experiment in motivating employee ideasftp.iza.org/dp8096.pdfdiscussion paper series...
TRANSCRIPT

DI
SC
US
SI
ON
P
AP
ER
S
ER
IE
S
Forschungsinstitut zur Zukunft der ArbeitInstitute for the Study of Labor
A Field Experiment in Motivating Employee Ideas
IZA DP No. 8096
April 2014
Michael GibbsSusanne NeckermannChristoph Siemroth

A Field Experiment in
Motivating Employee Ideas
Michael Gibbs University of Chicago
and IZA
Susanne Neckermann Erasmus University Rotterdam, ZEW and Tinbergen Institute
Christoph Siemroth
University of Mannheim
Discussion Paper No. 8096 April 2014
IZA
P.O. Box 7240 53072 Bonn
Germany
Phone: +49-228-3894-0 Fax: +49-228-3894-180
E-mail: [email protected]
Any opinions expressed here are those of the author(s) and not those of IZA. Research published in this series may include views on policy, but the institute itself takes no institutional policy positions. The IZA research network is committed to the IZA Guiding Principles of Research Integrity. The Institute for the Study of Labor (IZA) in Bonn is a local and virtual international research center and a place of communication between science, politics and business. IZA is an independent nonprofit organization supported by Deutsche Post Foundation. The center is associated with the University of Bonn and offers a stimulating research environment through its international network, workshops and conferences, data service, project support, research visits and doctoral program. IZA engages in (i) original and internationally competitive research in all fields of labor economics, (ii) development of policy concepts, and (iii) dissemination of research results and concepts to the interested public. IZA Discussion Papers often represent preliminary work and are circulated to encourage discussion. Citation of such a paper should account for its provisional character. A revised version may be available directly from the author.

IZA Discussion Paper No. 8096 April 2014
ABSTRACT
A Field Experiment in Motivating Employee Ideas* We study the effects of a field experiment designed to motivate employee ideas, at a large technology company. Employees were encouraged to submit ideas on process and product improvements via an online system. In the experiment, the company randomized 19 account teams into treatment and control groups. Employees in treatment teams received rewards if their ideas were approved. Nothing changed for employees in control teams. Our main finding is that rewards substantially increased the quality of ideas submitted. Further, rewards increased participation in the suggestion system, but decreased the number of ideas per participating employee, with zero net effect on the total quantity of ideas. The broader participation base persisted even after the reward was discontinued, suggesting habituation. We find no evidence for motivational crowding out. Our findings suggest that rewards can improve innovation and creativity, and that there may be a tradeoff between the quantity and quality of ideas. JEL Classification: C93, J24, M52, O32 Keywords: innovation, creativity, intrinsic motivation, incentives Corresponding author: Michael Gibbs University of Chicago Booth School of Business 5807 S. Woodlawn Chicago, IL 60637 USA E-mail: [email protected]
* We are very grateful to the unnamed company’s executives and employees who provided us with access to their data, allowed us to interview them, and spent many hours answering questions about the data and company policies. We also thank participants at numerous seminars, as well as Kathryn Ierulli, Sacha Kapoor, Henry Sauermann, and Steve Levitt for their comments. Funding was provided by the University of Chicago Booth School of Business (Gibbs), the SEEK program of the state of Baden-Württemberg (Neckermann), and the DFG via SFB 884 (Siemroth).

1
1. INTRODUCTION
In today’s economy, innovation is an important determinant of competitiveness and economic
growth. “Ideation” – the generation and communication of novel and business-enhancing ideas – is there-
fore becoming increasingly important. One source of innovation that has traditionally received attention
from academics and practitioners is R&D labs and initiatives, where activities are explicitly directed to-
wards the generation of knowledge. A second source of ideas is the workforce more broadly. Employees
in all hierarchical levels and organizational units may have useful knowledge about customers, and may
have ideas about ways to improve processes, customer service, or product design. Outside R&D labs, job
definitions typically do not specifically include innovation. Firms may therefore fail to capture this poten-
tial source of valuable ideas, small and large. While this is well recognized, ways to elicit knowledge and
ideas from the workforce are not well understood.
One method to access employees’ ideas is a formal suggestion system. Such systems are increas-
ingly used across a wide set of industries. For example, Ohly, et al. (2013) find that approximately 1 in 3
workplaces in the US and United Kingdom uses a suggestion system. Suggestion systems encourage em-
ployees to submit ideas for process and product improvements. At the same time, they make ideas trans-
parent to management, who can then make decisions about implementation, and share the knowledge
within the company. To date, little is known about how such systems work, and whether rewards tied to
submitting ideas increase participation and ideation.
The aim of this paper is twofold. First, we provide a detailed picture of the ideation process in the
study company, complementing the existing literature on employee suggestion systems. Second, we ana-
lyze the outcomes of a randomized field experiment designed to test the effectiveness of rewards for idea-
tion, contributing to the debate among academics and practitioners about whether or not rewards improve
or undermine innovation and creativity. In doing so, we also provide evidence on the relationship between
employee characteristics and the quantity and quality of ideas suggested.

2
The setting of this study is a large, multi-national business process outsourcing company. It has a
formal process by which employees submit new ideas, which are tracked through review and implementa-
tion. Data from this process present a unique opportunity to empirically study ideation. In an attempt to
further improve the suggestion system, the company ran an experiment to test the effects of rewards for
the submission and acceptance of new ideas. The company chose 19 key accounts, which we refer to as
client teams, and randomly assigned the teams to treatment or control groups. Overall, more than 11,000
employees participated in the experiment. For 13 months, employees in treatment teams received points
for each idea submitted and approved. Additional points could be earned for favorable client feedback.
Employees accumulated these points for redemption at an online site offering consumer goods. Apart
from the reward program, conditions were identical between treatment and control groups. Our data in-
cludes the treatment period as well as the 13 months leading up to the experiment. This allows us to use a
difference-in-differences approach to estimate the effects of rewards on ideation, which accounts for pos-
sible pre-treatment differences between control and treatment group due to the relatively small number of
client teams.
The experimental reward scheme had mixed effects on ideation.1 Our main finding is that the
quality of ideas (measured as the percentage of ideas accepted for implementation, or the percentage of
ideas pitched to the client) was substantially increased by the reward. Thus, the treatment worked as in-
tended, as only authors of accepted ideas received rewards. Further, rewards increased the pool of em-
ployees who contribute in the suggestion system. Apparently, the rewards induced individuals to think
more about ideas and to familiarize themselves with the suggestion system. This is in contrast to the no-
tion that creativity is primarily a function of personality traits rather than effort-based (George & Zhou
2001). However, the number of ideas submitted per potential contributor fell, suggesting that individuals
put more work into the most promising ideas, which would explain the rise in idea quality. Combined,
1 Throughout this paper we treat an increase in employee suggestions as positive for the firm, rather than a shift away from per-formance on core duties. Unfortunately we do not have data on their other activities. In discussion with senior managers at the firm, we learned that they are not at all concerned about this potential multi-tasking problem. Rather, they hope that the reward program stimulates more employees to participate in innovation and continuous improvement, next to their daily duties.

3
there was no net effect on the total quantity of ideas submitted. We also find no evidence that the reward
scheme crowded out intrinsic motivation (Deci 1971; Frey & Oberholzer-Gee 1997; Frey & Jegen 2001).
Finally, we study ideas for a period after the experimental reward scheme ended, and find some evidence
of habituation effects.
There are large literatures in economics, psychology, social psychology, and management on in-
novation and creativity, too vast to survey here. Some research focuses on how personal characteristics or
motivations (Guilford 1950; Amabile 1983; Sauermann & Cohen 2010) affect creativity. Other research-
ers look at organizational variables such as perceived organizational support, organizational climate, or
leadership (Amabile 1996; Robinson & Stern 1997; Tierney, Farmer & Graen 1999). Many studies look at
the effect of rewards on creativity, though findings are mixed (Amabile 1982, 1996; Eisenberger & Ar-
meli 1997; Deci, et al. 1999; Joussemet & Koestner 1999; Eisenberger & Rhoades 2001; Eckartz, et al.
2012). Some studies analyze how the structure of rewards (magnitude; short or long term) affects creativi-
ty (Ariely, et al. 2009; Azoulay, et al. 2011; Ederer & Manso 2013) or how rewards interact with the type
of creativity: divergent or convergent (Charness & Grieco 2013). These studies provide valuable insights
into how the originality of ideas is affected by rewards. However, they typically do not consider the sub-
mission process. This is important, since ideas need to be formulated and communicated to be effective.
Furthermore, using a field setting is important for studying ideation as both the setting (experienced sub-
jects working on a familiar task, where payments may be expected) and the task (innovation at work in-
volves creativity, planning and execution) differ from tasks performed in a typical laboratory experiment.
This study therefore complements existing studies on creativity in these respects.
This study is closely related to a small number of papers that look at employee suggestion pro-
grams. For the most part this literature uses survey data to elicit employees’ motivations and organiza-
tional antecedents for submitting ideas. Leach, et al. (2006) use data from 182 organizations in the UK
and show that the number of ideas submitted correlates with scheme characteristics such as centralization,
publicity and use of rewards. Based on three case studies (KPN, Shell and Xerox), van Dijk and van den
Ende (2002) argue that reward criteria affect the number of submissions. Ohly, et al. (2013) provide a

4
conceptual discussion of suggestion schemes and an overview of the literature. Key indicators of the suc-
cess of such systems are the degree of participation (percentage of employees who participate in the sys-
tem), degree of adoption (the percentage of submitted ideas that are implemented), and savings realized –
indicators that we use in this study. Toubia (2006) models the effect of incentives on ideation, focusing on
free-riding within groups, and concludes that incentives may be used to improve idea generation. He also
provides evidence from a lab experiment consistent with that conclusion. Our paper builds on these prior
studies by focusing on similar questions, using data from an actual employee suggestion system.
Although the form of the reward scheme might be specific to this setting, the results are of gen-
eral interest. To our knowledge, this study is the first to offer causal evidence on the effect of rewards on
ideation in the field. Furthermore, we are among the first to describe and analyze a process for encourag-
ing employee innovation (the “Idea Portal”) that is becoming more common as firms attempt to formalize
innovation processes. In addition, we document a company’s attempt to learn and improve its organiza-
tional design via field experimentation.
2. INSTITUTIONAL SETTING
Company background
The experiment took place at a large Asian information technology services company.2 The com-
pany provides a variety of services, including outsourcing of business processes, R&D (including in some
cases product design), and development of software or hardware solutions needed by clients. Most of the
firm’s clients are large global companies, without focus in a specific sector. The company is expanding
and has well over 70,000 employees in many countries. In the last decade, the company decided to place
more emphasis on innovation. The business process outsourcing industry has become increasingly com-
petitive and commoditized. The company seeks to differentiate itself by offering greater innovation to
clients, in the hopes of increasing client retention, growth, and profit margins. For that reason, all em- 2 For confidentiality reasons, we cannot identify the company. Gibbs consulted with the company for 5 hours on an unrelated matter years ago. None of the authors received compensation for this project.

5
ployees are encouraged to – in addition to their daily project work – suggest ideas for process or product
improvements that are reviewed and, if approved, shared with the client. As another initiative designed to
foster creativity, the company ran a field experiment to test the impact of material rewards on idea genera-
tion. It is these two programs – the idea generation system, and the additional experimental rewards pro-
gram – that we study in this paper.
Because the firm provides business process outsourcing, most employees (and all on the teams
studied here) reside in, and are citizens of, the company’s native country. Employees are assigned to a
specific client team. They do all of their work for this client. An employee is usually assigned to the same
team for many years, so almost all workplace interactions take place only within client teams. Among
other things, this ensures confidentiality of sensitive client data. For our purposes this segmentation is
useful, because client teams work independently of each other.
The “Idea Portal”
In an attempt to encourage employees to suggest new ideas, and to create a culture of innovation
and collaboration, the firm set up an Idea Portal (our term). This is an intranet-based system designed to
collect, evaluate, implement, and track new ideas. All employees, regardless of position or level, are en-
couraged to come up with new ideas and submit them, even if the idea is of small value. The process by
which a new idea is handled is depicted in Figure 1:
[FIGURE 1 ABOUT HERE]
1. Ideation: one or more employees come up with a new idea that they deem worthy of suggest-ing. Employees may form ideation groups, and ideas can be submitted by 1 to 3 employees. An employee can be part of several ideation groups at the same time. Valid ideas might bene-fit a client directly or indirectly. Examples include new products or services, improvements to existing software systems, process improvements, or new software tools.
2. Submission: the employees submit the idea on the Idea Portal. Submission includes a brief
description of the idea as well as its implementation, and estimates of implementation costs and projected revenue.
3. Supervisor Input: the supervisor is notified by the Portal as soon as an idea is submitted. This
manager gives an initial review within 3 days. Often, the manager talks to the employee to re-fine or clarify the idea. This may be needed if the employee does not have the skills or expe-rience to place the idea in the broader context of the business, estimate costs and benefits, etc.

6
4. Senior Management Review: the idea is evaluated by a panel of senior managers within the team’s business unit, who meet regularly for this purpose. In some cases the idea is sent back for further refinement before the panel makes an accept / reject decision.
5. Client Review: if appropriate, approved ideas are brought to the client for final accept / reject
decision. Clients may reject ideas, even if they have been approved internally, if they do not believe that the idea adds enough value given the costs of implementation.
6. Implementation: accepted ideas are implemented, and the results are tracked and evaluated.
Where applicable, clients are asked to rate the quality of the idea on a scale of 1 to 4 stars af-ter implementation. Estimated costs and revenue may be updated based on client input about actual implementation.
All ideas input in the Portal are accessible by all employees, with the hope that this will spur idea-
tion and spread ideas across the organization. However, to ensure client confidentiality, detailed infor-
mation on posted ideas is visible only to employees within a client team, and to higher level managers
across the company. The Idea Portal was a mature, robust system prior to the running of the experimental
reward scheme. It had already processed several thousand ideas.
Experimental reward program
Incentives to suggest ideas were present in both the treatment and control groups prior to the ex-
periment, stemming from intrinsic motivation, public recognition from ideas being formalized and possi-
bly implemented, and career concerns. The formal procedure ensured recognition from clients, the team,
the supervisor and reviewing managers, and potentially the rest of the organization. Until the experiment,
however, there was no formal reward for contributing an idea.
Reflecting its culture of innovation, the company decided to run an experiment to see if rewards
could improve ideation via the Portal. First, the company wanted to encourage more ideas that directly
benefit the client, as compared to ideas that improve internal processes. This was intended to align em-
ployees with its strategy of developing closer working relationships with, and becoming an important
source of innovation for, clients. Second, the company hoped to encourage employees to submit ideas on
the Portal rather than implement them on their own. Doing so would increase transparency, allowing
management to observe improvements, and decide whether or not to communicate them to clients. More-

7
over, the company hoped that ideas entered into the Portal would foster knowledge sharing and
knowledge spillovers across divisions of the company.
The company has an employee bonus program that allows employees to earn points for good per-
formance and other behaviors that the firm wants to motivate, such as contributions to a specific initiative,
project completion, or job anniversaries. Employees accumulate points over time, similar to a frequent
flyer program, and exchange them for consumer goods (e.g., a new smartphone) or shopping vouchers at
an online store.3 Such reward programs are not unusual in Asian companies. The bonus program applies
to all employees and had been in place for several years prior to the experiment, just like the Idea Portal.
For the experiment, the company decided to make use of this bonus program by offering rewards in the
form of such bonus points.
The company selected all client teams that met certain criteria for size and innovation activity for
the experiment.4 The resulting 19 teams were randomly assigned to either the treatment or the control
group. Overall, roughly 11,400 employees were involved in the experiment (6,000 in control teams, 5,400
in treatment teams). Employees in treatment teams received additional reward points for accepted ideas,
while employees in control teams saw no change in their reward program.
The experimental reward was designed to motivate quality, and not just quantity. Submission of
an idea alone did not merit a reward. If the idea was accepted for implementation, each member of the
ideating team earned 2,000 points. After implementation, authors could earn additional points depending
on the client’s rating. Unlike points for acceptance of the idea, these were divided equally among the idea-
tors. To get a sense of the magnitude of the rewards: the 2,000 points that were awarded for idea ac-
ceptance were worth approximately 2.2% of monthly after-tax salary for lower level employees. If the
3 We were given an overview of how many points were redeemed, and for which goods, in July 2011. Gift vouchers were most frequently demanded, followed by goods from the category “Kids.” Evidently, the points are often used for gifts to others. 4 The exact criteria for teams were: more than $2 million annual revenue, at least 50 employees, regular idea contribution (at least 5 ideas generated per month, with at least 1 shared with the client), and average client satisfaction index of at least 25 on a scale of –100 to 100. These criteria ensured that only established and well-running client teams were part of the experiment.
8
idea received the highest client rating of 4, the employee earned an additional 40% of monthly net salary.5
Therefore, rewards for implemented ideas were significant (in many firms, average annual bonuses may
be not much more than 2.2%), and rewards for ideas rated highly by clients were very significant.
Apart from the change in the reward program, there were no policy differences between the
treatment and control groups: Review processes were not changed in treatment teams and were, hence,
identical to those in control teams. There were also no changes in supervisor or manager incentives in
either treatment or control teams during the period. Finally, communications about innovation and idea-
tion trainings were corporate-wide, and not affected by the experiment. While employees in treatment
teams were informed about the reward scheme, they were not told that they were part of an experiment.
Neither did employees in control teams, managers on review panels, and clients know about either the
experiment or the rewards. Only higher level management and the human resources employees responsi-
ble for handling the reward program were aware of the experiment.
A concern in such settings may be spillover effects between control and treatment teams, or from
HR to control teams. We believe that such concerns are limited in this case. Employees generally stay in
their client team for many years.6 Most or all of their workplace interactions are with team members and
the client. Further, many teams are physically segregated; i.e., work at different company locations. Our
discussions with HR managers indicated that the experimental program was not discussed outside of con-
trol teams, in part out of concerns that other teams would request the additional reward.
The company designed and conducted the experiment on its own. We visited the company’s
headquarters after the experiment had been completed, to interview executives about the company’s or-
ganization, strategy, culture, and innovation processes. We also interviewed employees in some of the
control and treatment teams about their work and innovation, without disclosing the experiment or that we
5 Company management is convinced that the rewards were substantial and that employees were motivated by them. One em-ployee told us that he took home an LCD TV because of the ideas he logged and implemented, and argued that this was a huge benefit given the price of the TV.
6 In our data, 0.9% of employees switch client teams, and 0.1% switch from a control to a treatment team or vice versa. Since we have employee background data at only two points in time (prior to and during the experiment), these numbers refer to changes in team composition between those two points. According to management, no employee switched between treatment and control teams during the treatment period, so the 0.1% of switchers must have changed team prior to the experiment.
9
would be studying data from the Portal or reward scheme. We followed up with numerous telephone dis-
cussions with company management to better understand their policies, the Portal, the organizational con-
text at the time of the experiment, etc.
3. PREDICTIONS
In this section we provide a brief discussion of the predictions that guide the empirical work. Em-
ployees enter ideas into the Idea Portal even without the experimental reward. This may be due to intrin-
sic motivation, a sense of duty, desire for status and recognition from ideation, or implicit incentives such
as merit raises or hope for promotion. This paper studies the incremental effect on employee innovation
from introducing explicit rewards. There are three relevant dimensions to ideation, given our data: em-
ployee participation (attempt to develop ideas, and enter them in the Portal); quantity of ideas suggested
conditional on participation; and quality of ideas suggested.
Consider first participation in the Portal. Throughout this paper, “participation” means that an
employee is both willing and able to submit ideas. It does not mean, however, that a participating em-
ployee always submits an idea. It is possible that the employee tries to come up with a suitable idea, but
does not succeed, or has insufficient time to enter the idea in the Portal. A formal definition of participa-
tion, and an explanation of how we empirically estimate it, is given in the methods section. Willingness to
engage in ideation likely depends on the rewards and costs from doing so. In this firm, employees are
encouraged to enter ideas (in both control and treatment groups), but many still do not participate in idea-
tion. Presumably this is because the cost of thinking about ideas or using the system, on top of normal
work, outweighs the perceived benefit. The experimental incentive plan provides a new benefit from sug-
gesting ideas that are accepted, all other factors held constant. This should increase the likelihood that an
employee participates in ideation; that is, is motivated to look for ideas, and to enter an idea into the por-
tal if she has one. Therefore our first hypothesis is:
H1: The experimental reward increases the likelihood that an employee participates in ideation.

10
The reward scheme might also affect the quantity and quality of ideas suggested by employees. It
is often assumed that there is a tradeoff between quality and quantity in ideation.7 Employees might, for
example, face a tradeoff between “exploration” – pursuing new directions – and “exploitation” – pursuing
familiar directions for incremental innovation (Robbins 1952; Gittins 1979). The former is less likely to
generate new ideas, but such ideas may have higher expected value or quality. The latter may generate
more ideas, but of lower quality. This trade-off is relevant in our setting. Furthermore, idea acceptance
depends on the time that an employee spends elaborating and describing the idea, as well as on how well
the idea corresponds to company goals. Since the company wants to add value for customers, it may also
depend on whether or not the idea is directed towards the customer. If the reward program is successful at
stimulating employees to become active in ideation, it should direct employees’ focus towards idea quali-
ty, as only accepted ideas are rewarded. This should increase idea quality:
H2: The experimental reward increases the quality of suggested ideas.
There are two countervailing effects on the quantity of ideas suggested by a given employee,
conditional on participation. The experimental reward should increase effort exerted towards generating
new ideas, but a potential quantity-quality tradeoff works in the opposite direction. We therefore do not
have a clear prediction about the net effect. Nevertheless, the question of a tradeoff between quantity and
quality is of interest, so we test the following hypothesis:
H3: The experimental reward decreases the quantity of ideas per participating employee.
It is often argued that intrinsic motivation is an important component of creativity, and that pay
for performance “crowds out” intrinsic motivation. In this view, rewards might reduce intrinsic motiva-
tion to ideate. There are several explanations for this phenomenon in the literature. One rationale is the
overjustification effect (Deci, et al. 1999). In this view, extrinsic rewards are more salient than intrinsic 7 The potential cognitive tradeoff between for quantity and quality of ideas suggests a multitask incentive problem (Holmstrom & Milgrom 1991). That is consistent with how the firm designed the experimental incentive plan, which rewarded high quality ideas (ideas that were accepted) rather than merely the number of ideas.

11
motivation, and motivation therefore shifts to the external source when extrinsic rewards are instituted.
An alternative interpretation is signaling (Benabou & Tirole 2006). The idea is that employees who ideate
in the absence of rewards do so because they like to engage in that activity. Doing so in the absence of
rewards serves as a signal to themselves and/or others that they are intrinsically motivated, dedicated em-
ployees. The theory assumes that individuals do not have perfect knowledge about their motivations and
use their actions to make inference about their own character type. When rewards are present, ideation
also becomes attractive to extrinsically motivated types, so that its value as a signal for intrinsic motiva-
tion decreases.
The crowding out view suggests that any incentive effect of rewards may be mitigated by a reduc-
tion in intrinsic motivation, with an unclear net effect. However, if there is motivational crowding out, the
net effect should vary with the extent to which employees are intrinsically motivated. The data allow us to
crudely group individuals by their degree of intrinsic motivation, and to test this. Consider employees in
the pre-treatment period, without rewards. On average, intrinsic motivation among employees who ideate
should be higher than among those who do not. Therefore, crowding out effects that reduce performance
should be more pronounced for the first group. Generally, crowding out theories do not clearly distinguish
between participation in ideation, and the quantity and quality of ideas. We therefore state the next hy-
pothesis in terms of participation, but also test for crowding out effects on quantity and quality in the
analysis.
H4: The experimental reward has a smaller (possibly negative) effect on the likelihood of partici-pation for employees who previously participated, compared to those that did not.
4. DATA & METHODS
Idea data were collected from the database behind the Idea Portal. Each idea record contains
unique employee IDs of idea authors, dates of submission and latest update, client team ID, and a verbal
description of the idea. The data also include estimates of the dollar cost of implementation and projected
contribution to revenue. These estimates are provided initially by employees in consultation with their

12
managers, but may be updated later upon completion of implementation, with input from the client. Thus,
we can construct estimated profit of the idea as revenue minus cost.
Idea review and management also takes place on the Portal, so the current status of each idea
(e.g., “under review,” “rejected,” “under implementation”) is recorded. Finally, the Portal records client
ratings on a four point scale. However, for most ideas this rating is missing because not all suggestions
were shared with clients, and only a few clients made use of this feedback option.
We have records for all ideas suggested during the 13 months prior to treatment (May 2009 to
May 2010), the 13 months of treatment (June 2010 to June 2011), and the 13 months after treatment (July
2011 to July 2012). Our data on whether the idea was accepted or rejected was updated in January 2013.
Since the ideation data only contain records of employees who submitted ideas, we obtained in-
formation about employees who did not submit ideas (“inactive” employees), via employment rosters.
These rosters were made available to us for two points in time, April 2010 and July 2011. We have no
record of exactly when employees left or entered the company, so we cannot reconstruct the exact team
roster at each point in time. However, the two data points provide a good approximation for the pre-
experimental and experimental periods.8 This allows us to add inactive employees to our ideation data set
and to look at the percentage of ideating employees.
Finally, we collected data on employee characteristics: gender, age, tenure at the company, client
team ID, and salary group. There are 9 salary ranges, which correspond to hierarchical levels. Level 0 is
entry level and Level 8 is the highest level in compensation and responsibility (executives). Table A in the
appendix contains descriptions of all variables used in the analyses and reported in the tables.
8 For the quantity regressions analyzing the number of ideas submitted per employee, we added all inactive employees from the April 2010 employment roster (end of pre-treatment period) to both periods, and employees from the July 2011 roster (end of treatment period) only to the treatment period. An allocation of the April 2010 employees only to the pre-treatment period result-ed in very similar estimates. This confirms that the difference-in-differences approach addresses the concern that we do not have the exact employee roster, because the incompleteness of information affects both groups in the same way.

13
Summary statistics
Table 1 presents descriptive statistics for our explanatory variables by treatment group. The two
groups are very similar in terms of age, tenure, and gender. The only statistically significant difference is
that employees in treatment teams were slightly younger in the pre-treatment period. We therefore control
for individual factors, including age, in all regressions below. The results are, however, not sensitive to
the inclusion of these variables. As is common in technology firms, employees are relatively young with a
mean age of about 30. Tenure is relatively short with a mean less than 3 years. Almost 80% of employees
are male. The number of employees increased substantially between the two periods. This reflects com-
pany growth as well as the fact that the employee data for period 1 is less complete than for period 2, as
we have only roster 1 (from the end of period 1) in the first period, whereas we can use both rosters to
approximate the number of employees in the second period.
[TABLE 1 ABOUT HERE]
Table 2 displays descriptive statistics on outcome variables by period and group. Despite random-
ization, employees in control teams were more likely to suggest at least one idea in both periods. Further,
the share of ideating employees dropped in both groups in the treatment period, with a stronger drop in
the control group. These differences highlight the need to control for pre-treatment differences and time
trends in our statistical analyses.9 Ideas are typically submitted by 1 employee, with an average varying
between 1 and 2 authors.
[TABLE 2 ABOUT HERE]
The last columns present descriptive statistics on three measures of idea quality. The first two in-
dicate decisions made about each idea: accepted for implementation (“Imp”), and shared with the client
(“Shared”) where applicable. Both measures are the result of a review process and are only reported for
ideas with finished review (“| Fin”). These measures reflect idea quality, since better ideas have a higher
9 Pre-treatment differences are not unexpected due to the relatively small number of client teams. As long as pre-treatment differ-ences are not correlated with response to the treatment, they will not affect treatment effect estimates because the difference-in-differences approach controls for initial differences. We conducted robustness checks by including the average period 1 perfor-mance of the team as additional explanatory variable for period 2 performance. Direction and magnitude of the estimated treat-ment effects are similar to the estimates presented below.

14
chance of acceptance and are more likely to be shared with clients. The percentage of ideas accepted for
implementation increased in both the treatment and control groups over time, with a stronger increase in
the treatment group. The probability of sharing an idea with the client increased in the treatment group,
but decreased in the control group.
A third quality measure is estimated profits (net value), the difference between the estimated rev-
enue and cost of an idea. This measure varied substantially between ideas. Some ideas had very small
projected financial impact, while one idea was estimated to improve revenue by $22 million.
Unfortunately, the last potential measure, the client idea rating on a 4-point scale, was given only
for 17% of the ideas. Moreover, there appear to be serious selection issues. 85% of the ratings are 3 or 4
points. Only 1 out of 306 ratings received the lowest score of 1. This suggests that clients only reported
ratings when they were happy with the idea, and used other channels to report dissatisfaction. We there-
fore do not use client ratings as another outcome measure in our analysis.
Methods
Measuring and explaining the quantity of ideas
One of our main dependent variables is the count variable Number of Ideas, the total number of
ideas submitted by an employee in either the pre-treatment or treatment period. The unit of observation
for this analysis therefore is an employee-period. A large fraction of employees (91.4%) does not submit
ideas, resulting in a large number of zeros for this variable. The prevalence of zeros disqualifies simple
count data models such as Poisson or negative binomial (NB).10
We therefore analyze the data using a zero inflated negative binomial model (ZINB), which is a
generalization of the NB, and used in particular for overdispersed data. ZINB is a mixture model, which
explains the dependent count data variable jointly with a negative binomial process and a logit process.
10 Poisson assumes equality of the conditional mean and conditional variance, which results in biased estimates for overdispersed data (conditional variance larger than mean). A negative binomial regression (type II) generalizes the Poisson model by assuming that the variance is equal to Var 1 ,where is an additional parameter to be estimated. The NB model reduces to the Poisson for 0. Estimating the NB model with our data, we find significant overdispersion, indicating that a Poisson regression is unsuitable.

15
The logit process accounts for those zeros that are not explained by the negative binomial distribution
(excess zeros). The intuition is that two processes are simultaneously at work in the data generating pro-
cess: (1) the logit process models participation; that is, the employee’s basic willingness or ability to sub-
mit an idea. If that condition is fulfilled, (2) the second process models the generation and submission of
ideas, where the number of ideas is drawn from the negative binomial distribution. This implies that a
zero observed in the data could be caused either by an employee not participating in ideation (condition
(1) not fulfilled), or an employee wanting to ideate but not having an idea in that period (condition (1)
fulfilled, but the draw in (2) is zero).
Formally, denote by f1 the density of the logit model and by f2 the density of the negative binomi-
al. Then the density of count y in the zero inflated negative binomial model is:11
0 1 0 0 , if 0,
1 0 , if 0.
The NB model is a special case where f1(0) = 0. The ZINB model is well suited for our data as the two
processes allow us to effectively address overdispersion and also have a meaningful interpretation in our
context.12 As mentioned above, the approach allows us to model the submission decision hierarchically.
The logit process provides information on whether or not an employee participated in ideation. If the an-
swer is “no,” the observed number of ideas is zero. Such “excess zeros” depict that an employee is not
participating: they might be unmotivated to look for ideas; might shy away from using the Portal; or
might work on a project with little or no room for ideation. If, on the other hand, the answer is “yes,” we
may still observe zero ideas from this employee, in case they had no idea to submit, even though they
11 The definition of the zero inflated model implies that a success (“1”) in the logit model denotes an excess zero. Accordingly, a negative coefficient in the logit process would be associated with a higher conditional mean. To avoid confusion when reading and interpreting the tables, we inverted the sign of the estimates of the logit process, so that a positive sign indicates a positive effect on the dependent variable. 12 Because we cluster standard errors, the objective functions of the models are pseudo-likelihoods, not true likelihoods of the data. Consequently, common tests to discriminate between models (likelihood ratio test for NB v. ZINB; Vuong test for ZINB v. zero inflated Poisson) are not applicable. Similar tests for clustered data are not yet common. However, taking the pseudo-likelihoods as true likelihoods, then Akaike’s information criterion, likelihood ratio tests, and Vuong tests all favor the ZINB significantly over Poisson, NB, and zero inflated Poisson.

16
were actively looking for ideas and willing to use the system. Positive counts are only observed when
both processes are positive; i.e., the employee was motivated to ideate and also had an idea.
The latent class character of the zero inflated model allows us to disentangle these two different
causes of non-ideation, whereas standard count data models or OLS do not. The logit and negative bino-
mial processes of the ZINB are specified as follows:
(1) Logit: Prob 1| exp / exp 1 .
(2) NB: Negative binomial model with conditional mean exp .
Estimating treatment effects
In all regressions, we use linear or nonlinear difference-in-differences estimations to infer the
causal effect of the treatment on ideation. Difference-in-differences addresses several potential problems,
for example, that we observe pre-treatment performance differences, that there are possible time trends (a
decrease in ideas over time, because low hanging fruit have already been picked), and that we can only
approximate the number of non-ideating employees per period. In order to estimate the treatment effect,
we specify that appears in both equations (1) and (2) as follows:
2 2 , , ,
where β1 is the difference-in-differences treatment effect estimate. Treatment is the treatment group dum-
my, Period 2 is the treatment period dummy, Xit is a vector of employee characteristics, and Ci is the cli-
ent team fixed effect that accounts for unobservable time-invariant heterogeneity between the teams. The
time invariant dummy Treatment is not estimated separately, because it is absorbed by the client team
fixed effects (every client team is either in the treatment group or not). Index i denotes the author and t
denotes the period (pre-treatment or treatment period). To control for time trends or time-specific shocks,
we use time fixed effects in the form of pre-treatment and treatment period dummies. Note that the coeffi-
cients of the logit (L) and NB process are not constrained to be equal, which allows us to determine
whether treatment affects the two processes differently.

17
Employees within a client team regularly interact, so the assumption of independence between
observations (employees) is likely violated. Standard errors in all of our regressions are therefore clus-
tered at the client team level to allow for arbitrary correlation in error terms within a team.13
5. RESULTS
Who ideates?
Before we evaluate the experiment, we provide a brief overview of the correlates of ideation with
respect to employee characteristics. Even though this is not a causal analysis, the question is of intrinsic
interest, as it provides insights into the ideation process and lays a foundation for understanding the re-
ward effects analyzed below. The results are displayed in Table 3. Our measures of ideation are the prob-
ability of submitting at least one idea within 13 months (one period), and the number of ideas submitted.
In all regressions involving nonlinear models, we report average marginal effects (AME).
[TABLE 3 ABOUT HERE]
We control separately for age and company tenure. Age is negatively related to both outcome
measures. On average, an additional year of age decreases the probability that an employee submits at
least one idea by about 0.3 percentage points, and decreases the number of ideas per employee by about
0.006. These estimates suggest that older employees are less likely to contribute to the Idea Portal, and
submit fewer ideas on average. An explanation may be that younger employees are more creative. Alter-
natively, the Portal might be more attractive to them, as they are more used to using new technology.
Finally, they may be more aware of recent technological developments, such as new software program-
ming techniques.
13 The low number (19) of clusters is a concern because the cluster and heteroskedasticity robust standard errors used here are only valid asymptotically. However, we have reason to expect that our standard errors are unbiased. Bertrand, et al. (2004, Table VIII) show (for OLS) that clustered standard errors exhibit only small bias for 20 clusters. If there is no effect in the artificially generated data, then the null hypothesis rejection rate based on these standard errors is 5.8%, when it should be 5%. Block boot-strap, the primary alternative, rejects the null in 13% of cases (their Table V). We also estimated several linear models with the wild bootstrap procedure proposed by Cameron, et al. (2008). They demonstrated in Monte Carlo simulations that their procedure does not over-reject. The t statistics from this procedure are virtually identical to those obtained with clustered standard errors in our linear models.

18
The effect of tenure is positive and statistically significant for both measures. One might have ex-
pected that employees with longer tenure have already suggested ideas that came to mind, and therefore
have fewer new ideas. Our findings suggest the opposite. This may be because employees who work for
the company longer have a deeper understanding of the business and client, which leads to more ideas.
Finally, we look at the effects of salary groups, which are proxies for hierarchical level. We use
senior management (salary groups 4 and above) as the reference category. We pool low-level groups 0
and 1, because group 0 is too small for meaningful analysis on its own. The only statistically significant
effect is that ideating low-level employees contributed about 0.18 fewer ideas within 13 months than ac-
tive high-level employees. The mechanism behind this finding might be similar to the one for tenure.
Both measures correlate with the employee’s firm-specific experience, skills, and job match. Employees
higher up in the hierarchy tend to have greater responsibility, control more resources, manage more sub-
ordinates, and have a higher-level understanding of the firm’s and client’s business and needs.
Treatment effects
Quantity of ideas
We now analyze the effects of the field experiment. As a first step, we examine whether the ex-
perimental reward affected the quantity of ideas suggested. As described above, the quantity of ideas
submitted is modeled hierarchically with a logit process that captures an individual’s participation, and a
negative binomial process that describes the number of ideas submitted, given willingness to ideate. Table
4 displays average marginal effects (AME) for both the logit and the negative binomial model in isolation
(columns 1 and 2). The overall AME effects of the mixture model are displayed in column 3.
[TABLE 4 ABOUT HERE]
The treatment effect is significantly positive in the logit process, suggesting that rewards in-
creased the share of employees motivated to participate – think about ideas for product or process im-
provements, and to submit them on the Portal. According to the average marginal effect, the rewards are
estimated to increase the share of potential contributors by almost 18 percentage points, which is also
economically significant. This is evidence in favor of hypothesis 1.

19
Interestingly, this positive effect is countered by a decrease in the number of ideas per author, as
indicated by the negative binomial process. The result suggests that potential contributors submit about
0.26 fewer ideas during the 13 month treatment as a result of the reward program. The overall effect of
rewards on the quantity of ideas is economically and statistically zero; the positive and negative effects
cancel out. Consequently, ideation is spread over more employees, who concentrate on fewer ideas.
This evidence is consistent with hypothesis 3, though it may also be explained by crowding out:
intrinsically motivated employees might have been negatively affected by the introduction of rewards,
inducing a decrease in the number of ideas they submit. Since we have no direct measure of employees’
intrinsic motivation and creativity, we use data from the pre-treatment period to categorize individuals as
intrinsically motivated. The idea is that intrinsic motivation should, on average, be stronger among those
that ideated in the pre-treatment period without awards than among those that did not. We proxy intrinsic
motivation with the dummy Prior Ideator, which captures whether or not an employee submitted at least
one idea in the pre-treatment period, and is still in our sample in the treatment period. The second condi-
tion ensures that these employees have the opportunity to contribute again. About 7% of employees fall
into this category in period 1. Columns (4) and (5) present the results of a model that allows the treatment
effect to vary by whether or not the employee is a prior ideator. The models we estimate are identical to
the main analyses presented above, except that:
2 2 2
2 ,
for both the logit and NB process.14 The treatment effect (β1 + β2) in the logit process, for example, is the
change in the fraction of potential contributors among prior ideators in the treatment group, relative to
that same change among prior ideators in the control group.
The results suggest that prior ideators in the treatment group are not more likely to participate
(logit process). This is not surprising, as the logit process can be interpreted as describing whether or not 14 The average treatment effect on prior ideators is ∑ , where is the nonlinear func-
tion of the model (e.g., logit), is the effect of the remaining covariates, and denotes the observation.

20
an individual is actively looking for ideas and able to use the Idea Portal. This is, by definition, true for
the subgroup of employees who submitted ideas in the past. However, rewards appear to have induced
employees who had not previously suggested ideas to enter the pool of potential contributors, increasing
the fraction of potential contributors by about 6.5 percentage points.15 In the negative binomial process,
treatment reduced the average number of suggested ideas by 0.76 for all other (potentially contributing)
employees, while the effect on prior ideators is not significantly different from zero. The overall effect on
the amount of ideas submitted (not displayed) is -.021 ideas for prior ideators, and -.052 for employees
who had not previously suggested ideas. We therefore find no evidence in support of the crowding out
hypothesis (H4) that rewards have detrimental effects for intrinsically motivated employees.
In summary, the evidence suggests that the experimental reward program increased the pool of
employees who participate in ideation. At the same time, however, the number of ideas per participating
employee decreased, with a zero net effect on the number of submitted ideas. The decrease in the number
of ideas per participating employee cannot be explained by motivational crowding out. A second explana-
tion for this drop in the number of ideas per participating employee might be that rewards stimulated em-
ployees focus on fewer but better ideas. To address this second explanation, we now investigate the effect
of the experimental reward program on idea quality.
Quality of ideas
For quality analyses we focus on individual ideas rather than individual authors. Idea j may have
several authors Nj, so we split each idea into Nj observations, each with the individual characteristics Xi of
author i, where i = 1, …, Nj. Hence, the unit of observation is the author-idea in all quality analyses. To
ensure that single and multi-author ideas get the same weight, we weight each idea j by 1/Nj. This proce-
dure allows us to explain idea outcomes with both author- and idea-specific variables. We use three quali-
ty measures: whether the idea was shared with the client, whether it was implemented, and its net value.
15 One might expect the treatment effect in column (1) to be between the treatment effects of the two subgroups reported in col-umn (4). However, since this is a nonlinear model, and we estimate separate time trends for each subgroup in (4), this need not be the case.

21
Consider first the dummy variable Shared, which equals 1 if an idea was shared with the client,
and zero otherwise. The review process is structured such that every idea is first reviewed internally. Dur-
ing internal review the panel decides whether or not to share the idea with the customer for feedback or
approval. Shared is a meaningful measure of quality for two reasons. First, it would be unwise of the
company to bother clients with bad or trivial ideas. Second, the aim of the company was to increase its
value-added as perceived by the customer. Value-added is more salient for ideas that are explicitly com-
municated to the client than for ideas that are implemented as by-products of ongoing business without
communication to clients. In Table 5 we report both OLS coefficients and logit marginal effects of the
following models:
OLS: if 1,
Logit: Prob 1 , , 1 ,
where Treatment Period2 . Treatment represents the treatment
group dummy, Xim is a vector of employee characteristics at the time of submission, Ij is a vector of idea-
specific variables including project type, Ci is the client team fixed effect of employee i, and Tm is the
monthly time fixed effect.16 Index i denotes the author, j the idea, and m the month of idea submission.
The results are robust to different ways of estimating the time trend (period or month fixed effects). The
analysis only includes ideas with finished review because information on our outcome variables Shared
and Implemented are only available after review.
[TABLE 5 ABOUT HERE]
Columns (1) and (2) of Table 5 report results for the probability that an idea is shared with the cli-
ent. In line with hypothesis 2, we find a substantial and statistically significant positive treatment effect.
Depending on the model, the treatment increased the probability of sharing the idea by 19 to 21 percent-
16 A priori, one might have thought that the treatment might affect the number of authors submitting an idea, which in turn might influence the probability that the idea is shared. The inclusion of the number of authors as a control variable would then bias treatment effect estimate. We looked into this and found no statistically or economically significant effect of the treatment on the number of authors (results available upon request). Therefore, we include number of authors as a covariate in all quality regres-sions to improve fit. The treatment effect estimates are even larger when number of authors is omitted as explanatory variable.

22
age points. This suggests that the treatment worked as intended, and employees in treatment teams fo-
cused on the quality rather than the quantity of ideas. This could be due to employees increasing the frac-
tion of customer-related ideas (a shift in focus of ideas), or to employees increasing the quality of the
submitted idea without such a re-shift in focus. Both should increase the likelihood that an idea is shared
with the customer.
A second measure of quality is Implemented, which equals 1 if the idea was accepted for imple-
mentation, and 0 if not. Implemented is a measure of idea quality because the company has economic
incentives to only approve worthwhile ideas. The difference from Shared is that an idea may be imple-
mented without being shared with the client. Alternatively, ideas may be approved internally, but then
rejected by the client (i.e., shared, but not implemented).
The models we estimate are the same as above for Shared, except that we now use Implemented
as the dependent variable. The results are displayed in columns (3) and (4) of Table 5. Once more we find
a large positive and statistically significant treatment effect. Rewards improve the likelihood of idea im-
plementation by 15 to 18 percentage points.
When entering ideas in the Portal, authors are required to estimate the costs and benefits (in US
dollars). Supervisors and clients may later refine those estimates based on their experience and
knowledge. As a final quality proxy, we look at the expected profit from an idea, measured as the log of
projected net value (benefit minus cost). One would think that the company only accepts ideas with posi-
tive net value. However, this is not the case. Strategic considerations, such as the development of new
competencies, effects on client relationships, or synergies with other ideas induce the company to accept
some ideas with a negative net value and reject some with a positive value. In our dataset about 25% of
ideas with negative net value were accepted. This share increases to about 40% when we only consider
ideas with finished review. Note that ideas with zero or negative net value drop out when taking the log-
transformation. We therefore also ran a linear model. It yielded the same qualitative results, but with infe-
rior fit.

23
Table 5 column (5) shows OLS results for projected profit. The point estimates of the treatment
effect are substantial and positive. A treatment effect estimate of 0.308 in the log-linear specification
translates into an effect of about +36%. One interpretation is that employees knew that more profitable
ideas are more likely to be accepted, so they shifted their focus to more profitable ideas when rewards
were introduced. However, despite the large point estimate, the effect is not significantly different from
zero, so we cannot reject the hypothesis that treatment had no effect on projected profit.
We also tested for motivational crowding out effects using all three quality measures, by compar-
ing treatment effects on prior ideators with those on all other employees (using the same methodology as
explained above in the quantity section). None of the regressions showed a significant difference in the
treatment effect (not shown in the table). Hence, there is also no evidence of crowding out with respect to
idea quality. This is further evidence against hypothesis 4.
To sum up, we find large positive and statistically significantly treatment effects on idea quality
as measured by the number of ideas that are implemented and that are shared with the client. We cannot
reject the null hypothesis that projected profits are not affected by the experiment. In line with our find-
ings on quantity, there is no evidence of crowding out on all measures of idea quality. The increase in idea
quality might explain the drop in the number of ideas per author that we detected above. This provides
support for the notion that ideation is subject to a quantity-quality tradeoff, with authors in treatment
teams focusing on fewer but better quality ideas.
The regressions in Table 5 also include author characteristics. There are two things worth men-
tioning. First, tenure is positively correlated with the probability that an idea is shared with the client, as
well as with net value. Given that these regressions control for salary group, this is in line with our find-
ing of a positive correlation between tenure and the number of ideas suggested. Both results suggest that
firm- and/or client-specific human capital may be valuable for ideation. Second, ideas with more authors
have higher average quality, for all quality measures. This is consistent with research that shows that col-
laboration, particularly between individuals with different perspectives and skills, improves the quality of
innovation (Ford & Sullivan 2004; Shin & Zhou 2007).

24
Post-treatment effects
The company discontinued the reward scheme after the 13 months of the field experiment. We
collected data from the Portal for the 13 months that followed. This allows us to examine whether the
positive treatment effects on participation and idea quality persisted, which would suggest habituation, or
disappeared. Alternatively, one might expect a reduction in idea quantity and quality – either because the
incentive is removed, or due to perceived unfairness associated with removing the reward. Table 6 dis-
plays results on quantity and quality, now including a post-treatment effect (DID Post-treatment) for the
13 months following the experiment.
[TABLE 6 ABOUT HERE]
The post-treatment effect on the share of potential contributors (logit process of the ZINB model)
remains positive and significant. Employees who became potential contributors due to rewards tend to
continue participation after the reward is discontinued. This might reflect habituation. Another potential
explanation is that rewards changed the working culture of treatment teams, with greater attention to, or
peer pressure for, ideation. Alternatively, the reward might have better communicated the importance to
the firm of employee ideas, thereby changing implicit incentives. Unfortunately, the data do not allow us
to disentangle these alternative interpretations. The effect on the number of ideas per potential contributor
(negative binomial process, column 2) is insignificant in the post-treatment period. The overall effect on
the quantity of ideas remains statistically and economically insignificant.
The table also reports the results for one of our quality measures, Shared (effects are similar when
using Implemented as the dependent variable). Interestingly, the treatment effect on quality vanished after
elimination of the reward scheme. Hence, while the treatment effect on participation remains, the effect
on quality disappears. Apparently, employees continue to think about and submit ideas, but they no longer
focus their effort on ideas with a high probability of acceptance. Instead they return to baseline with re-
spect to idea quality. This could also explain why the effect on the number of ideas per participating em-
ployee becomes insignificant (column 2). Taken together, these findings are consistent with changes in
multitask incentives during and after the treatment. In this view, the rewards induced employees to spend

25
additional effort fine-tuning and improving ideas to increase their odds of receiving a reward. Once, the
rewards were eliminated, relative incentives to emphasize quality returned to their original level. This is
interesting for both theory and application, as it suggests that the quality of ideas can be manipulated with
rewards.
Financial benefits of the experimental reward
We now provide back-of-the-envelope calculations of the profitability of the experimental reward
program. The regression estimates are that the treatment effect on the quantity of ideas submitted was
essentially zero. This implies that the program created little additional cost associated with evaluating and
reviewing submitted ideas (opportunity costs of manager time). Further, there were few costs associated
with instituting the reward system, as the system of collecting and redeeming points was already in place,
as was the Idea Portal.
Now consider the direct reward cost. 247 employees in the treatment group had an idea accepted
in the 13 months of the treatment, and each received 2000 points for it. These idea acceptance points cost
the company approximately $1,990. As mentioned before, the company also awarded substantial numbers
of points for favorable client ratings. These costs sum to about $14,250.
The benefits of the program, in comparison, can be estimated with less precision, as we have to
rely on point estimates of treatment effects on the likelihood of implementation, and on the net value of
ideas (revenue minus cost). Note that the treatment effect on the likelihood of implementation in Table 5
includes an indirect effect that runs via the effect of rewards on the net value of ideas. That might, in turn,
affect the likelihood of implementation. To separate out the direct effect, we re-ran the regressions in Ta-
ble 5 but controlling for net value. This results in a direct treatment effect on the likelihood of implemen-
tation of 15.2 percentage points. The point estimate of rewards on net value, as displayed in Table 5, is
36%. Taken together, these two effects imply a combined increase in net value of about $8.3 million. If
we use a linear instead of the semi-log specification in Table 5 to estimate the treatment effect on net val-
ue, the benefits amount to about $7 million.

26
One possible concern might be the large variance in projected net value of the projects. We there-
fore re-estimated the treatment effect removing outliers (net value above $100K or below -$100K). This
reduces the estimate of the treatment effect on net value from +36% to +26.7%. Excluding outliers from
this computation and using this more conservative estimate, the financial benefit of the experiment still
amounts to $1.5 or $1.4 million for semi-log or linear estimates respectively. Thus, for reward costs in the
ten-thousands, the company was able to stimulate new ideas that generated financial value in the millions.
This analysis excludes some relevant costs and benefits that we cannot estimate with the available
data. For example, more ideas were shared with clients under the reward scheme. This could imply bene-
fits to the company in terms of higher perceived value-added, customer satisfaction, and loyalty. Moreo-
ver, ideas may have other benefits and costs that are hard to quantify and are not captured in net value
estimates in the ideation database. Such benefits may include, for example, knowledge spillovers across
the organizations, investments in new technology or competencies, or follow-up innovations based on the
ideas.
6. CONCLUSIONS
This paper provides a unique statistical analysis of employee innovation. Data from a company’s
employee suggestion system allow us to analyze the effectiveness of rewards for fostering employee idea-
tion, which were implemented as a randomized field experiment. Our findings are of interest for the de-
bate on the causal effects of incentives on ideation, innovation, creativity, and intrinsic motivation. Most
of the previous literature uses survey data and case studies to analyze ideation, and laboratory experi-
ments to study creativity. This study complements the existing literature by studying experienced individ-
uals performing their regular work. Moreover, random assignment to control and treatment groups allows
us to make causal inferences.
Our findings suggest that rewards are a suitable tool to induce employees to think about process
and product improvements, and to induce them to use a formal ideation system. The reward scheme sub-
stantially increased the likelihood that employees participate in the Idea Portal. Broadening the participa-

27
tion base was, in fact, one of the company’s objectives. The data from the post-experimental period show
that once familiar with the system, employees continued using the ideation system even in the absence of
the reward scheme, suggesting habituation.
The firm’s experimental incentive plan emphasized quality, since points were awarded only for
ideas that were accepted for implementation. A main finding of this paper is that the treatment was suc-
cessful in increasing idea quality as measured by the percentage of ideas implemented. One interpretation
is that reward criteria signal employees about the types of ideas that the company values. Interestingly,
employees returned to baseline with respect to the number and quality of ideas they suggest when the
rewards were discontinued. Taken together, the treatment and post-treatment responses on quality suggest
that employees can fine-tune ideation and are responsive to incentives when doing so. The results are also
consistent with the notion of a quantity-quality tradeoff, which may be addressed with multitask incen-
tives. Proper choice of a performance measure is likely to be important. If the company had rewarded
each submission rather than idea acceptance, we would likely have observed an increase in the quantity of
ideas at the expense of quality.
Employees in this firm suggested ideas even without formal rewards, indicating intrinsic motiva-
tion or implicit incentives. However, the results do not provide support for the view that rewards crowd
out intrinsic motivation. Not only did the reward scheme appear to motivate more employees to become
active ideators, and to focus on idea quality, but employees ideating prior to the experiment did not reduce
performance when offered the rewards.
The findings also illustrate the utility to firms from experimentation in organizational policies.
The firm was able to test a new incentive before rolling it out to the entire organization. This allowed it to
test the efficacy of the general idea (“do incentives enhance employee innovation?”) by estimating its
effects on various dimensions of employee performance. In addition to providing useful information
about whether the idea was sound, the experiment provided insights into the specific design of the policy.
Conceivably the firm could have gone even further. For example, they might have tried different rewards,
perhaps awarding points merely for suggesting new ideas, or for suggesting ideas as a group of employ-

28
ees. There may be substantial costs to implementing organizational policies that are poorly designed, and
bureaucratic inertia might make it costly to change or eliminate a policy after it is implemented. Moreo-
ver, changes to an existing policy might reduce management’s credibility with employees. Experimenta-
tion can help firms reduce these downside risks from new or changed policies.
Our analysis has, of course, only scratched the surface on questions about employee innovation,
and interactions between intrinsic and extrinsic motivation. Our findings suggest a tradeoff between quan-
tity and quality in ideation. How strong is this tradeoff? What are the implications of this tradeoff for job
design, team structure, and incentive plan design? Data on employee tasks and time management might
allow deeper understanding of this issue. Nevertheless our findings are encouraging for the view that in-
centives do not undermine employee creativity if they are designed appropriately.
The company discontinued the experiment after 13 months of treatment. Its own analysis – a
rough comparison of averages between treatment and control groups – suggested that the incentive was
ineffective, and it decided not to implement the reward scheme company-wide. There are three main rea-
sons for why they reached a different conclusion. First, our difference-in-differences approach controls
for initial differences between the two groups, which were non-negligible. Second, we look at the subset
of ideas that finished the review process, while the company looked at all submitted ideas. This introduces
the additional confounding factor that review might be faster in one team, which would increase the share
of accepted ideas in that team, all else equal. Third, we control for team composition, such as age, hierar-
chical level and gender. Differences between groups in those characteristics may affect conversion rates,
but are not easily disentangled from the treatment effect using non-regression methods. After seeing our
analysis the company is now designing a similar reward scheme to roll out for the entire company.

29
REFERENCES
Amabile, T. M. (1982). Children's Artistic Creativity Detrimental Effects of Competition in a Field Set-ting. Personality and Social Psychology Bulletin, 8(3), 573-578.
Amabile, T. M. (1983). The Social Psychology of Creativity. New York: Springer-Verlag.
Amabile, T. M. (1996). Creativity in context: Update to " the social psychology of creativity". Westview Press, New York.
Ariely, D., Gneezy, U., Loewenstein, G., & Mazar, N. (2009). Large stakes and big mistakes. The Review of Economic Studies, 76(2), 451-469.
Azoulay, P., Graff Zivin, J. S., & Manso, G. (2011). Incentives and creativity: evidence from the academic life sciences. The RAND Journal of Economics, 42(3), 527-554.
Bénabou, R. & Tirole, J. 2006. “Incentives and Prosocial behavior”. American Economic Review. N. 96, pp. 1652-1678.
Bertrand, M., Duflo, E., & Mullainathan, S. (2004). How much should we trust differences-in-differences estimates? The Quarterly Journal of Economics, 119(1), 249-275.
Cameron, A. C., Gelbach, J., & Miller, D. (2008) "Bootstrap-Based Improvements for Inference with Clustered Errors", Review of Economics and Statistics, Vol. 90(3): 414-427.
Charness, G., & Grieco, D. (2013). Individual creativity, ex-ante goals and financial incentives. Working Paper.
Deci, E. L. (1971). Effects of externally mediated rewards on intrinsic motivation. Journal of personality and Social Psychology, 18(1), 105.
Deci, E. L., Koestner, R., & Ryan, R. M. (1999). A meta-analytic review of experiments examining the effects of extrinsic rewards on intrinsic motivation. Psychological Bulletin, 125(6), 627–668.
Eckartz, K., Kirchkamp, O., & Schunk, D. (2012). How do incentives affect creativity? Working Paper.
Ederer, F., & Manso, G. (2013). Is Pay for Performance Detrimental to Innovation?. Management Sci-ence, 59(7), 1496-1513.
Eisenberger, R., & Armeli, S. (1997). Can salient reward increase creative performance without reducing intrinsic creative interest? Journal of personality and social psychology, 72(3), 652.
Eisenberger, R., & Rhoades, L. (2001). Incremental effects of reward on creativity. Journal of personality and social psychology, 81(4), 728.
Frey, B. S., & Jegen, R. (2001). Motivation crowding theory. Journal of Economic Surveys, 15(5), 589–611.
Frey, B. S., & Oberholzer-Gee, F. (1997). The cost of price incentives: An empirical analysis of motiva-tion crowding-out. American Economic Review, 87 (4), 746–755.
Ford, C., & Sullivan, D. M. (2004). A time for everything: How the timing of novel contributions influ-ences project team outcomes. Journal of Organizational Behavior, 25(2), 279-292.
George, J. M., & Zhou, J. (2001). When openness to experience and conscientiousness are related to crea-tive behavior: an interactional approach. Journal of Applied Psychology, 86(3), 513-524.
Gittins, J. C. (1979). Bandit Processes and Dynamic Allocation Indices. Journal of the Royal Statistical Society, Series B (Methodological), 41(2): 148–177.
Guilford, J. P. (1950). Creativity. American Psychologist, 5, 444–454.
30
Holmstrom, B., & Milgrom, P. (1991). Multitask principal-agent analyses: Incentive contracts, asset own-ership, and job design. JL Econ. & Org., 7, 24.
Joussemet, M., & Koestner, R. (1999). Effect of expected rewards on children's creativity. Creativity Re-search Journal, 12(4), 231-239.
Leach, D. J., Stride, C. B., & Wood, S. J. (2006). The effectiveness of idea capture schemes. Interna-tional Journal of Innovation Management, 10, 1-26.
Ohly, S., Leach, D. & Zou, Q. (2013). Suggestion-Making in Organizations: A Review and Multilevel Model. Unpublished Manuscript.
Robinson, A. G., Stern, S., & Stern, S. (1997). Corporate creativity: How innovation and improvement actually happen. San Francisco: Berrett-Koehler Publishers.
Robbins, H. (1952), Some aspects of the sequential design of experiments. Bulletin of the American Mathematical Society, 58(5), 527–535.
Sauermann, H., & Cohen, W. M. (2010). What makes them tick? Employee motives and firm innovation. Management Science, 56(12), 2134-2153.
Shin, S. J., & Zhou, J. (2007). When is educational specialization heterogeneity related to creativity in research and development teams? Transformational leadership as a moderator. Journal of Applied Psychology, 92(6), 1709.
Tierney, P., Farmer, S. M., & Graen, G. B. (1999). An examination of leadership and employee creativity: The relevance of traits and relationships. Personnel Psychology, 52(3), 591-620.
Toubia, O. (2006). Idea generation, creativity, and incentives. Marketing Science, 25(5), 411-425.
van Dijk, C., & van den Ende, J. (2002). Suggestion systems: Transferring employee creativity into prac-ticable ideas. R&D Management, 32, 387-395.

31
Figure 1. Process for Evaluating New Ideas
Ideation 1‐3 employees in same client
team develop new idea.
Submission Idea is entered in Idea Portal.
Supervisor Input Supervisor reviews & helps refine idea within 3 days.
Senior Manager Review Panel of senior managers re‐views idea within 20 days.
Accepts, rejects or returns for clarification or refinement.
Client Review If appropriate, idea is shared with client. Client reviews &
accepts or rejects.
Implementation Idea implemented, results
tracked. In some cases, client rates on 1‐4 scale after
implementation.
Rejection Idea is no longer considered.

Table 1: Descriptive statistics
Treatment Group Control Group Combined
Number of Employees Period 1 3013 3181 6194
Number of Employees Period 2 5257 5879 11136
Mean Age Period 1 29.4** 29.9 29.7(4.70) (4.87) (4.80)
Mean Age Period 2 29.7 29.6 29.7(5.38) (5.41) (5.40)
Mean Tenure Period 1 2.99 2.90 2.94(2.32) (2.34) (2.33)
Mean Tenure Period 2 2.97 2.80 2.88(2.48) (2.37) (2.42)
Share of Men Period 1 0.78 0.80 0.79(0.42) (0.40) (0.41)
Share of Men Period 2 0.76 0.77 0.76(0.43) (0.42) (0.43)
Note: Standard deviations of the means are displayed in parentheses. In each line, the differenceof group means is tested with a t-test using standard errors that are clustered at client team level.Asterisks indicate significant differences at the 10%, 5%, or 1% level. Number of employees in period1 is based on employment roster 1; Number of employees in period 2 is based on rosters 1 and 2. Ageand tenure are measured at the end of the respective period.
32
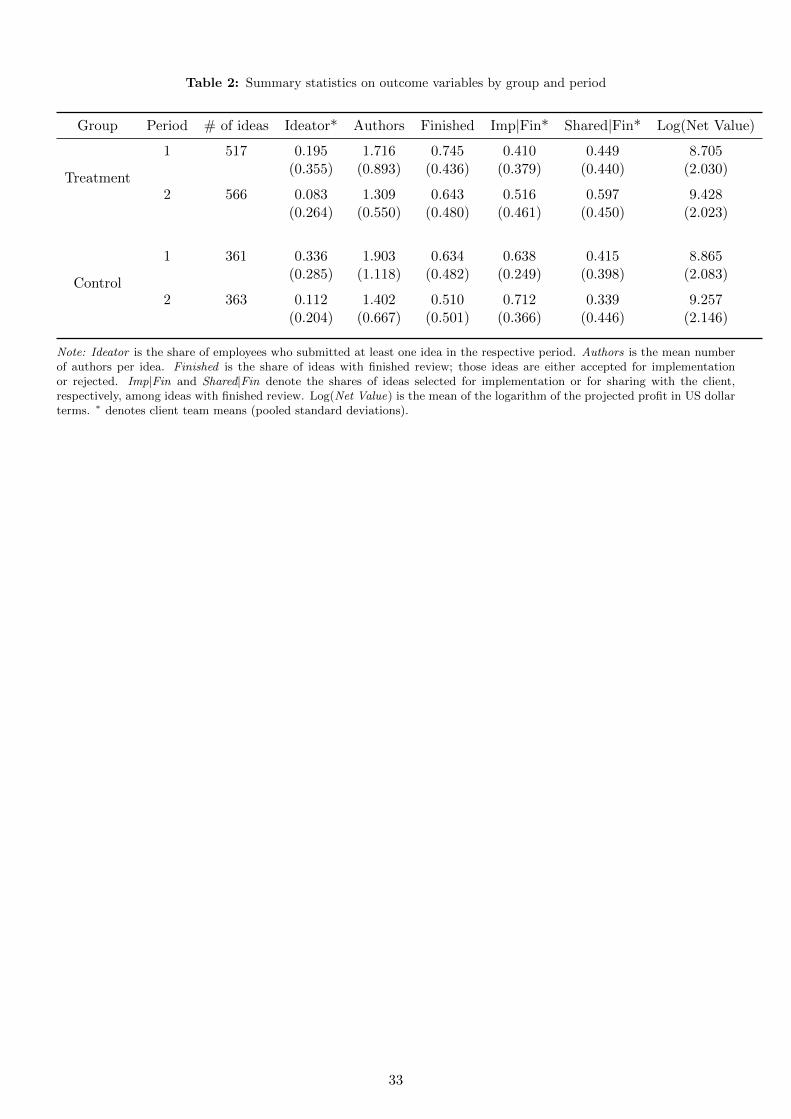
Table 2: Summary statistics on outcome variables by group and period
Group Period # of ideas Ideator* Authors Finished Imp|Fin* Shared|Fin* Log(Net Value)
Treatment
1 517 0.195 1.716 0.745 0.410 0.449 8.705(0.355) (0.893) (0.436) (0.379) (0.440) (2.030)
2 566 0.083 1.309 0.643 0.516 0.597 9.428(0.264) (0.550) (0.480) (0.461) (0.450) (2.023)
Control
1 361 0.336 1.903 0.634 0.638 0.415 8.865(0.285) (1.118) (0.482) (0.249) (0.398) (2.083)
2 363 0.112 1.402 0.510 0.712 0.339 9.257(0.204) (0.667) (0.501) (0.366) (0.446) (2.146)
Note: Ideator is the share of employees who submitted at least one idea in the respective period. Authors is the mean numberof authors per idea. Finished is the share of ideas with finished review; those ideas are either accepted for implementationor rejected. Imp|Fin and Shared|Fin denote the shares of ideas selected for implementation or for sharing with the client,respectively, among ideas with finished review. Log(Net Value) is the mean of the logarithm of the projected profit in US dollarterms. ∗ denotes client team means (pooled standard deviations).
33

Table 3: Who ideates? Influence of employee characteristics on ideation
(1) Logit AME (2) ZINB AME
Dependent variable Ideator Number of Ideas
Age -0.007*** -0.017***(0.001) (0.004)
Tenure 0.018*** 0.030***(0.003) (0.009)
Male 0.004 -0.056(0.009) (0.042)
Salary Groups 0 & 1 pooled -0.094** -0.516*(0.039) (0.291)
Salary Group 2 0.005 -0.119(0.034) (0.100)
Salary Group 3 0.075 0.022(0.048) (0.074)
Client FE yes yesLog Pseudo likelihood -1416.53 -2177.45Clusters 18 19Observations 5887 5916
Note: The regression uses data from the pre-treatment period only, whereboth groups have identical incentives. Ideator is a dummy indicating whetheran employee submitted at least one idea in the given period. Number of Ideasis the number of ideas submitted within the 13 pre-treatment months. Salarygroup is an indicator for an employee’s position in the company hierarchy.The reference category is (upper) management, that is, salary groups 4 andabove. The marginal effects of Age and Tenure are based on linear andquadratic terms. Standard errors are clustered at the client team level. As-terisks indicate significance at the 10%, 5%, or 1% level.
34
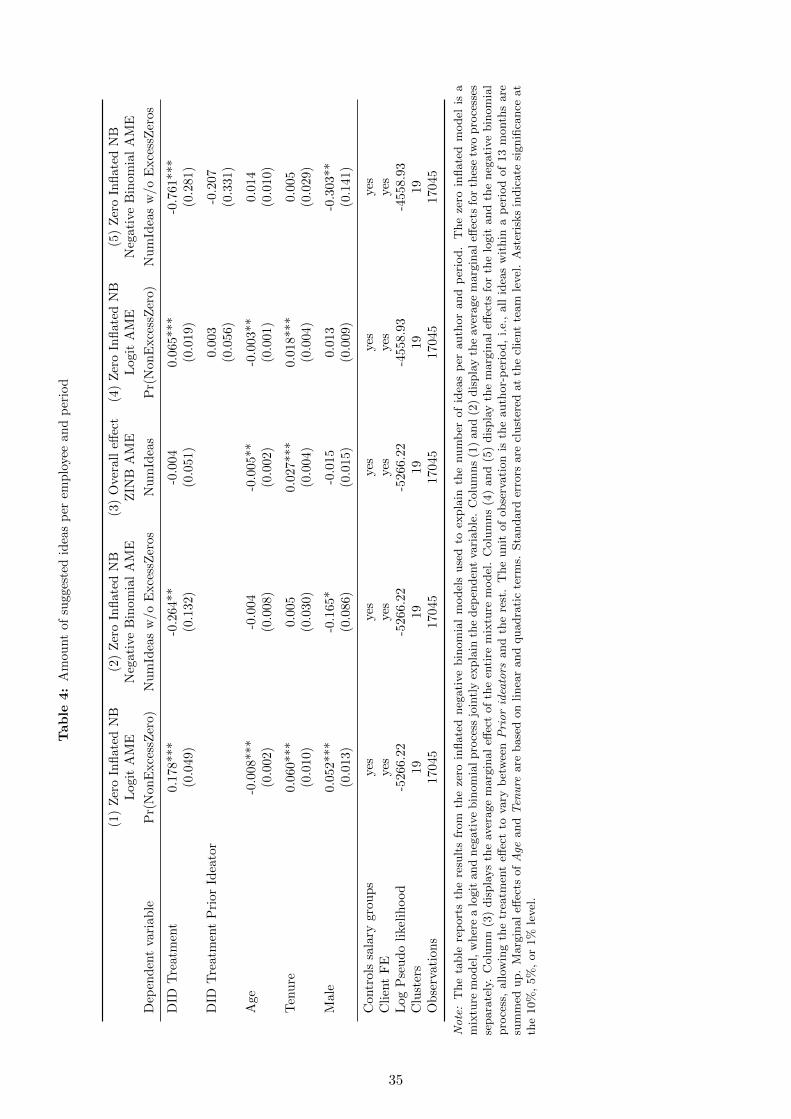
Table
4:
Am
ou
nt
of
sugges
ted
idea
sp
erem
plo
yee
an
dp
erio
d
(1)
Zer
oIn
flat
edN
BL
ogit
AM
E(2
)Z
ero
Infl
ate
dN
BN
egati
veB
inom
ial
AM
E(3
)O
ver
all
effec
tZ
INB
AM
E(4
)Z
ero
Infl
ate
dN
BL
ogit
AM
E(5
)Z
ero
Infl
ate
dN
BN
egati
veB
inom
ial
AM
E
Dep
end
ent
vari
able
Pr(
Non
Exce
ssZ
ero)
Nu
mId
eas
w/o
Exce
ssZ
eros
Nu
mId
eas
Pr(
Non
Exce
ssZ
ero)
Nu
mId
eas
w/o
Exce
ssZ
eros
DID
Tre
atm
ent
0.17
8***
-0.2
64**
-0.0
04
0.0
65***
-0.7
61***
(0.0
49)
(0.1
32)
(0.0
51)
(0.0
19)
(0.2
81)
DID
Tre
atm
ent
Pri
orId
eato
r0.0
03
-0.2
07
(0.0
56)
(0.3
31)
Age
-0.0
08**
*-0
.004
-0.0
05**
-0.0
03**
0.0
14
(0.0
02)
(0.0
08)
(0.0
02)
(0.0
01)
(0.0
10)
Ten
ure
0.06
0***
0.0
05
0.0
27***
0.0
18***
0.0
05
(0.0
10)
(0.0
30)
(0.0
04)
(0.0
04)
(0.0
29)
Mal
e0.
052*
**-0
.165*
-0.0
15
0.0
13
-0.3
03**
(0.0
13)
(0.0
86)
(0.0
15)
(0.0
09)
(0.1
41)
Con
trol
ssa
lary
grou
ps
yes
yes
yes
yes
yes
Cli
ent
FE
yes
yes
yes
yes
yes
Log
Pse
ud
oli
keli
hood
-526
6.22
-5266.2
2-5
266.2
2-4
558.9
3-4
558.9
3C
lust
ers
1919
19
19
19
Ob
serv
atio
ns
1704
517045
17045
17045
17045
Note:
The
table
rep
ort
sth
ere
sult
sfr
om
the
zero
inflate
dneg
ati
ve
bin
om
ial
model
suse
dto
expla
inth
enum
ber
of
idea
sp
erauth
or
and
per
iod.
The
zero
inflate
dm
odel
isa
mix
ture
model
,w
her
ea
logit
and
neg
ati
ve
bin
om
ialpro
cess
join
tly
expla
inth
edep
enden
tva
riable
.C
olu
mns
(1)
and
(2)
dis
pla
yth
eav
erage
marg
inaleff
ects
for
thes
etw
opro
cess
esse
para
tely
.C
olu
mn
(3)
dis
pla
ys
the
aver
age
marg
inal
effec
tof
the
enti
rem
ixtu
rem
odel
.C
olu
mns
(4)
and
(5)
dis
pla
yth
em
arg
inal
effec
tsfo
rth
elo
git
and
the
neg
ati
ve
bin
om
ial
pro
cess
,allow
ing
the
trea
tmen
teff
ect
tova
ryb
etw
eenPriorideators
and
the
rest
.T
he
unit
of
obse
rvati
on
isth
eauth
or-
per
iod,
i.e.
,all
idea
sw
ithin
ap
erio
dof
13
month
sare
sum
med
up.
Marg
inal
effec
tsofAge
andTen
ure
are
base
don
linea
rand
quadra
tic
term
s.Sta
ndard
erro
rsare
clust
ered
at
the
clie
nt
team
level
.A
ster
isks
indic
ate
signifi
cance
at
the
10%
,5%
,or
1%
level
.
35

Table 5: Treatment effect on different measures of idea quality
(1) OLS (2) Logit AME (3) OLS (4) Logit AME (5) OLS
Dependent variable Shared Shared Implemented Implemented Log(Net Value)
DID Treatment 0.209** 0.188** 0.153* 0.177** 0.308(0.087) (0.079) (0.084) (0.087) (0.390)
Number of Authors 0.082*** 0.092*** 0.060** 0.064*** 0.185**(0.020) (0.025) (0.023) (0.018) (0.069)
Age -0.036 -0.016*** -0.037 -0.012* 0.341*(0.025) (0.005) (0.025) (0.006) (0.182)
Age2 0.000 0.000 -0.005*(0.000) (0.000) (0.003)
Tenure 0.044** 0.032*** 0.014 0.008 0.129*(0.019) (0.012) (0.022) (0.011) (0.061)
Tenure2 -0.002 -0.001 -0.005(0.002) (0.002) (0.006)
Male 0.038 0.037 0.114*** 0.111*** -0.060(0.055) (0.053) (0.040) (0.034) (0.273)
Controls salary groups yes yes yes yes yesControls project type yes yes yes yes yesClient FE yes yes yes yes yesTime FE month month month month monthR2 0.687 0.753 0.962Log Pseudo likelihood -546.45 -457.07Clusters 19 15 19 17 19Observations 1779 1697 1779 1747 1912
Note: The table reports estimates of OLS and logistic regressions using as outcome variables the probability thatan idea is shared with the customer (columns 1 and 2), the probability that an idea is accepted for implementation(columns 3 and 4), and the logarithm of the projected net value (profit from the idea) (column 5). The treatment effectis the difference-in-differences estimator. The unit of observation is the author-idea. Each observation is weighted by1/(Number of Authors), where Number of Authors represents the number of employees who submit the idea together.Only ideas with finished review process (either accepted or rejected) are included the samples of columns (1) to (4).Marginal effects of Age and Tenure are based on linear and quadratic terms. Standard errors are clustered at the clientteam level. Asterisks indicate significance at the 10%, 5%, or 1% level.
36
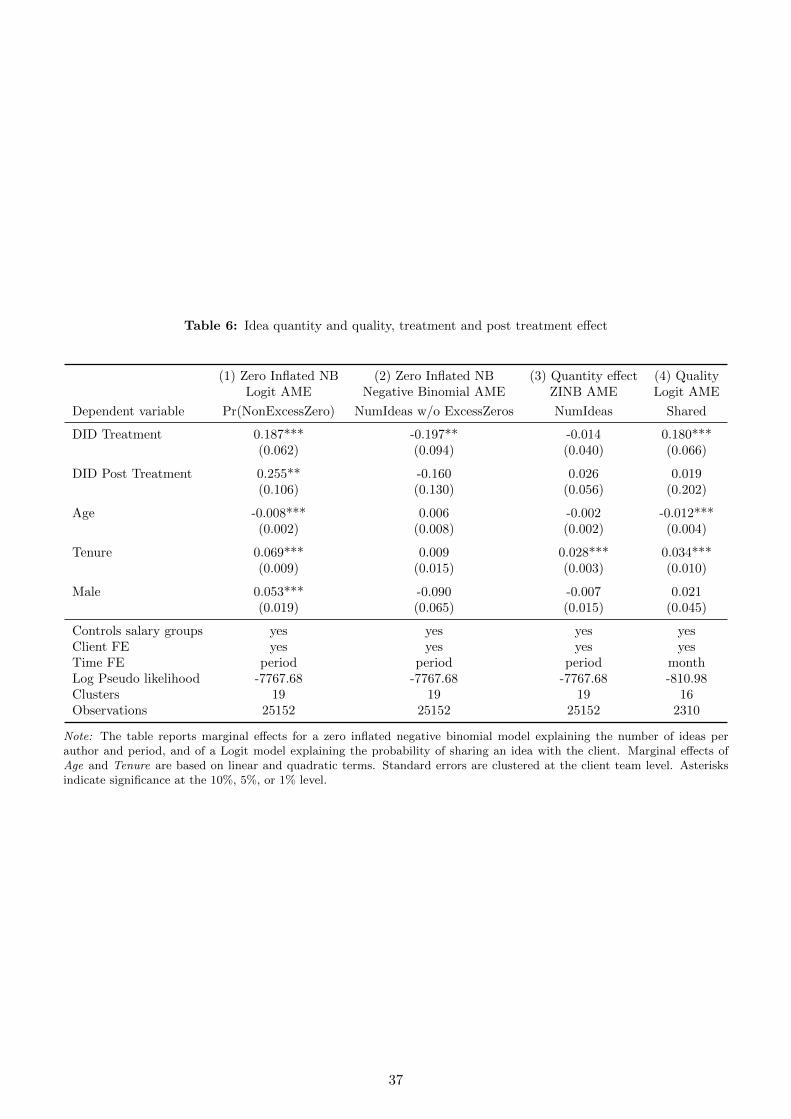
Table 6: Idea quantity and quality, treatment and post treatment effect
(1) Zero Inflated NBLogit AME
(2) Zero Inflated NBNegative Binomial AME
(3) Quantity effectZINB AME
(4) QualityLogit AME
Dependent variable Pr(NonExcessZero) NumIdeas w/o ExcessZeros NumIdeas Shared
DID Treatment 0.187*** -0.197** -0.014 0.180***(0.062) (0.094) (0.040) (0.066)
DID Post Treatment 0.255** -0.160 0.026 0.019(0.106) (0.130) (0.056) (0.202)
Age -0.008*** 0.006 -0.002 -0.012***(0.002) (0.008) (0.002) (0.004)
Tenure 0.069*** 0.009 0.028*** 0.034***(0.009) (0.015) (0.003) (0.010)
Male 0.053*** -0.090 -0.007 0.021(0.019) (0.065) (0.015) (0.045)
Controls salary groups yes yes yes yesClient FE yes yes yes yesTime FE period period period monthLog Pseudo likelihood -7767.68 -7767.68 -7767.68 -810.98Clusters 19 19 19 16Observations 25152 25152 25152 2310
Note: The table reports marginal effects for a zero inflated negative binomial model explaining the number of ideas perauthor and period, and of a Logit model explaining the probability of sharing an idea with the client. Marginal effects ofAge and Tenure are based on linear and quadratic terms. Standard errors are clustered at the client team level. Asterisksindicate significance at the 10%, 5%, or 1% level.
37

Table A: Description of variables
Variable Name Description
Ideator Dummy =1 if employee submitted at least one idea inrespective period
Age Employee age in years; measured at the end of theperiod (quantity regressions) or at time of submission(quality regressions)
Prior Ideator Dummy =1 if employee submitted at least one idea inperiod 1 and is still employed in period 2
DID Treatment Difference-in-differences treatment effect estimate
DID Post Treatment Difference-in-differences post-treatment effect estim-ate
Finished Dummy =1 if review is finished (idea either acceptedor rejected)
Implemented Dummy =1 if idea was accepted for implementation
Male Dummy =1 if employee is male
Net Value Profit in US dollar terms, projected value of idea mi-nus projected cost
Number of Authors Number of authors submitting the idea
Number of Ideas Number of ideas (per employee) submitted in the re-spective period
Salary Group Set of dummy variables indicating an employee’ssalary level 0-8 (corresponds to hierarchical positionin organization)
Shared Dummy =1 if idea was shared with and communicatedto client
Tenure Tenure at the company in years; measured at the endof the respective period or at time of idea submission
38