a field guide to epigenomics - research informatics in … field guide to epigenomics benjamin...
TRANSCRIPT

A Field Guide to Epigenomics
Benjamin Rodriguez, PhD Wei Li and Peggy Goodell Labs Baylor College of Medicine
Molecular Biology Refresher Course with Bioinforma�cs Sept 9th 2016

Course Materials: h�p://dldcc-‐web.brc.bcm.edu/lilab/benji/MBRB_2016/index.html Most up to date slides Supplementary materials
Browsers: h�p://genome.ucsc.edu/ h�p://epigenomegateway.wustl.edu/
Web-‐based analysis: h�p://bejerano.stanford.edu/great/public/html/ h�p://david.abcc.ncifcrf.gov
So�ware, Sites, Materials

Outline
DNA packaging and accessibility DNA methyla�on Histone modifica�ons Epigene�c inheritance in development and disease Aberrant epigene�c changes in cancer

DNA is Packaged in Chroma�n
nucleosome histone DNA
chromatin
Chroma�n consists of nucleosomes, DNA wrapped around histone proteins
• Chroma�n organizes genes to be accessible for transcrip�on, replica�on, and repair

Regula�on of genes involved in differen�a�on, cell cycle, and cell survival
EPIGENETICS
Normal epigene�c mechanisms
Roles in Normal Development and Cancer
Differen�ated cells
Progenitor cell

Regula�on of genes involved in differen�a�on, cell cycle, and cell survival
Through epigene�c silencing of certain genes, affected cells may acquire new phenotypes which promote tumorigenesis
EPIGENETICS
Malignant progenitor cell Tumor
Normal epigene�c mechanisms
Deregulated epigene�c mechanisms
Roles in Normal Development and Cancer
Differen�ated cells
Progenitor cell
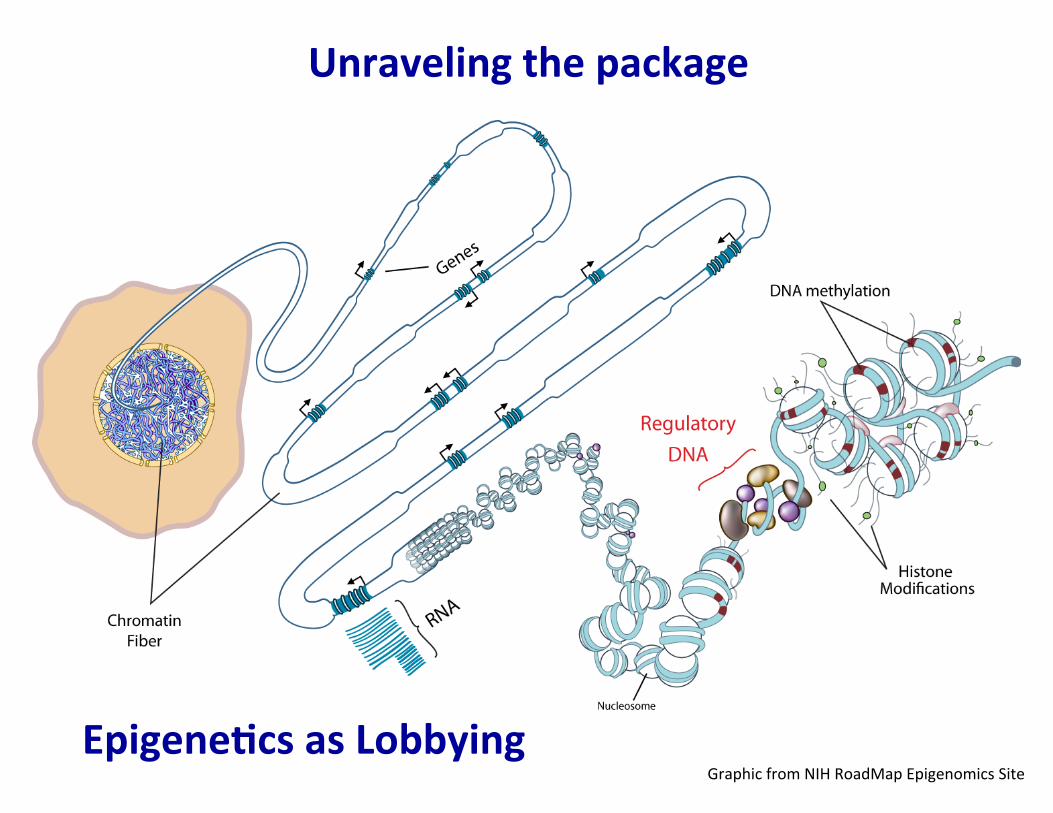
Unraveling the package
Graphic from NIH RoadMap Epigenomics Site Epigene�cs as Lobbying

-‐ promoters -‐ enhancers -‐ silencers -‐ insulators -‐ etc.
DNaseI
Genes, regulatory DNA, and epigenetic features
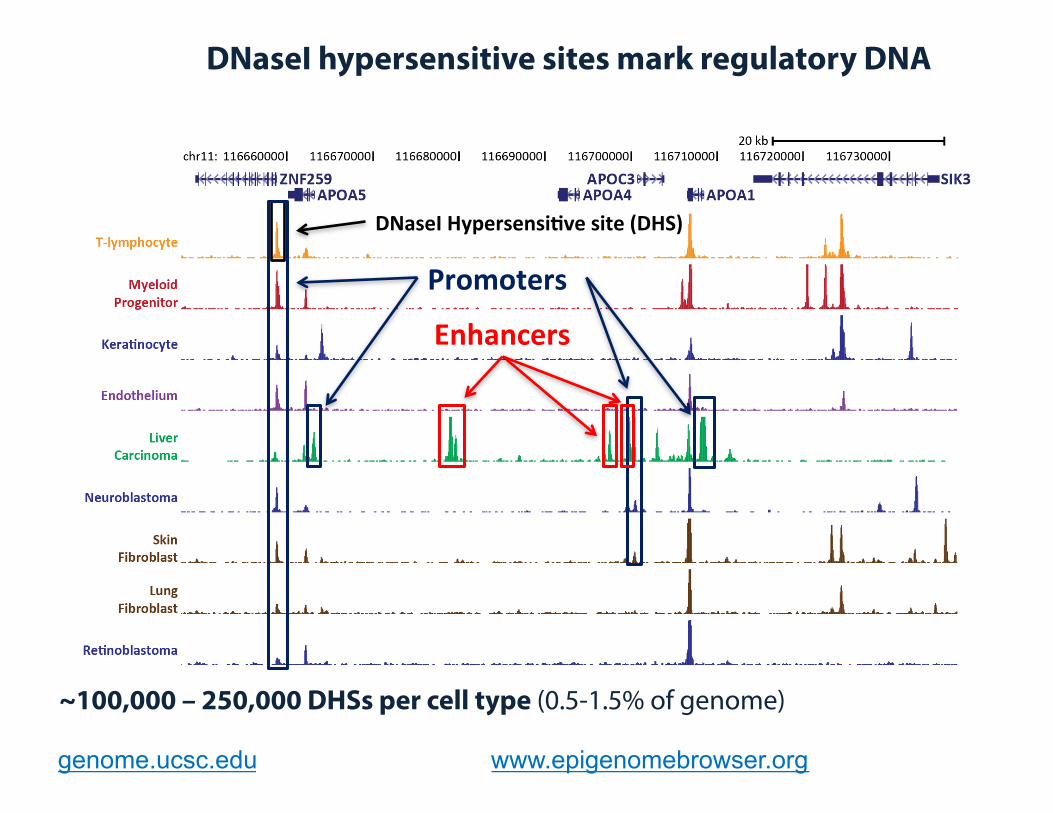
~100,000 – 250,000 DHSs per cell type (0.5-1.5% of genome)
genome.ucsc.edu www.epigenomebrowser.org
DNaseI Hypersensi�ve site (DHS)
Promoters
Enhancers
DNaseI hypersensitive sites mark regulatory DNA

Epigene�c Mechanisms: DNA Methyla�on
1 3 2 4
CG CG CG CG CG MCG MCG
Normal
C: cytosine mC: methylcytosine

Epigene�c Mechanisms: DNA Methyla�on
1 3 2 4
CG CG CG CG CG MCG MCG
Normal
C: cytosine mC: methylcytosine
CpG island

DNA Methyla�on and Gene Silencing
1 3 2 4
1 2 3 4
X
CG CG CG CG CG MCG MCG
Normal
Cancer
CG CG CG MCG MCG MCG MCG
C: cytosine mC: methylcytosine
CpG island

Con�nuum of Methyla�on and Gene Expression
R2 = 0.7817 P < 0.0005
Some genes (e.g. HOXB13 in breast cancer) show strong correla�on of promoter methyla�on with expression
Rodriguez et al. Carcinogenesis, 29(7), 1459-‐1465.

DNA Methyla�on and Regula�on
Cytosine methyla�on blocks DNA-‐binding proteins’ access to regulatory sites and creates binding sites for repressive proteins Methyla�on o�en follows decrease in site use
Thurman et tal. Nature, 489(7414), 75-‐82.

Methyla�on gets more complicated!
Many highly expressed genes have CpG methyla�on on their exons Genomic imprin�ng (parent of origin DNA methyla�on) Non-‐CpG cytosine bases are o�en methylated in embryonic stem cells Hydroxymethylcytosine (5hmC) and demethyla�on

Methyla�on, Retroviruses and Repeats
Bacteria use DNA methyla�on to limit invasive DNA from viruses A large frac�on of the human genome consists of carcasses of retro-‐viruses and transposons Almost all DNA repeats are heavily methylated If they lose methyla�on they are more likely to be expressed

DNA Methyla�on and Development
Two major waves of germline demethyla�on Increasing methyla�on at various �mes during fetal development restrict func�onality – This is why cloning is difficult Lee et al. Cell stem cell, 14(6), 710-‐719
(2014)

DNA Methyla�on at Single Base Resolu�on
Bisulfite conversion destroys ~ 98% of star�ng material Conversion efficiency, clonal fragment amplifica�on Unbalanced genome? Try BSMAP! Biological interpreta�on

HOXB13 hypermethyla�on in breast cancer cells
From Rodriguez et al Carcinogenesis 2008
Bisulfite sequencing
(Sanger, clone-‐based, very laborious)

Let us switch gears
DNA methyla�on sequencing methodologies

Enriched for hematopoietic TF binding sites and human leukemia gene expression signatures Canyon edges eroded in the absence of Dnmt3a
Jeong et al. Nature Gene�cs 46, 17–23 (2014)
Scale 10 kb
Gata2
WT
Methylation Ratio
100 _
0 _
KO3a
Methylation Ratio
100 _
0 _
Large conserved domains of low DNA methyla�on maintained by Dnmt3a
WT
3aKO

2"
4"
6"
8"
10"
12"
14"
AML AML B-ALL ch B-ALL CML Pro-B ALL T-ALL
- log
p-v
alue
Expressed Canyon
Simulated Canyon
Expressed Random
Unexpressed Canyon
Unmethylated Random
Top 10% of genes over-expressed in disease vs. normal bone marrow (Oncomine database)
Enrichment in expressed Canyon genes compared to four control gene sets
Canyon genes are enriched in human leukemia gene expression signatures
Jeong et al. Nature Gene�cs (2014)
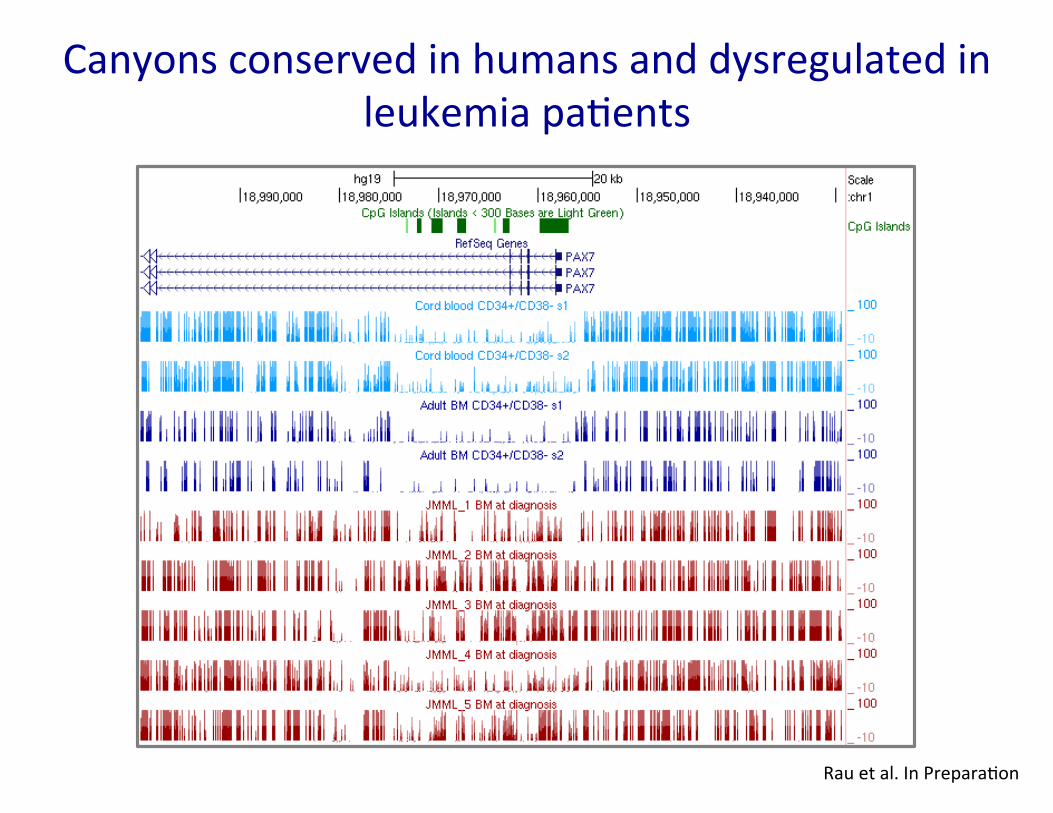
Canyons conserved in humans and dysregulated in leukemia pa�ents
Rau et al. In Prepara�on

DNA Methyla�on and Inheritance Humans and mice show epigene�c inheritance apparently mediated by DNA methyla�on Impact of nutri�onal and environmental influence on the fetal epigenome
Specific methyla�on changes o�en correlated with clinical features Poten�al for early detec�on, diagnosis, prognosis, therapeu�c stra�fica�on and post-‐therapeu�c monitoring
DNA methyla�on as biomarker of disease

HOXB13 hypermethyla�on associates with poor disease free survival in ERα-‐posi�ve pa�ents
Rodriguez et al. Carcinogenesis, 29(7), 1459-‐1465.

Epigene�c Mechanisms: Post-‐Transla�onal Modifica�on to Histones
Histone Acetylation
Histone Methylation
Ac Me
• Epigene�c modifica�ons of Histones include Histone Acetyla�on and Methyla�on

Histone Modifica�ons
Different modifica�ons at different loca�ons by different enzymes Poten�al temporal and spa�al specificity

Histone Modifica�ons
Gene body mark: H3K36me3, H3K79me2 Ac�ve promoter (TSS) mark: H3K4me3 Ac�ve enhancer (TF binding) mark: H3K4me1, H3K27ac Both enhancers and promoters: H3K4me2, H3/H4ac, H2AZ Repressive promoter mark: H3K27me3 Repressive mark for DNA methyla�on: H3K9me3

HMT
HMT
Coordinated ac�vi�es of chroma�n modifying enzymes lead to condensa�on of chroma�n and inhibi�on of gene expression
HDAC
HDAC
Ac
Ac
Ac
Me Me Me
Me
Me
Me
Me
Me
Me
Me
Gene expression
Gene expression
DNMT
Epigene�c Modifica�ons to Histones and DNA Can Cooperate to Silence Gene Expression

Broad peaks for trimethyla�on of histone H3 at lysine 4 (H3K4me3; wider than 4-‐kb)
first epigene�c signature for tumor suppressors in normal cell types widespread shortening of broad H3K4me3 in cancers is associated with repression of tumor suppressors
Scale
chr19:
_14563
10 kb mm9
32,825,000 32,830,000 32,835,000 32,840,000RefSeq Genes
User Supplied Track
m24_H3K4me3
m24_RatioDepth
Pten
100 _
0 _
100 _
-10 _
Chen, Kaifu, Zhong Chen, Dayong Wu, Lili Zhang, Xueqiu Lin, Jianzhong Su, Benjamin Rodriguez et al. Nature Gene�cs (24 Aug 2015)

Peak width (kb)
Peak
heig
ht
0 10 20
0200
400
Width
Heig
ht
Broad
Sharp
Excep�onally Broad H3K4me3 signature
Defini�on of H3K4me3 peak height and width
H3K4me3 peak height plo�ed against peak width
Chen, Kaifu, Zhong Chen, Dayong Wu, Lili Zhang, Xueqiu Lin, Jianzhong Su, Benjamin Rodriguez et al. Nature Gene�cs (24 Aug 2015)

2kb 3kb 4kbH3K4me3 width
4167 p
rom
ote
rs
A
B
C
D
E
F
G
H
I
105 samples
A B C D E F G H IGene groups
-log1
0 en
rich
P SuppressorsOncogenesHouse keeping
0
5
10
15
20
B D FA C E G IH
Broad H3K4me3
Peak widths for 4,167 promoters across ENCODE normal samples
Segmented into nine groups on basis of H3K4me3 peak width conserva�on level
Enrichment levels of promoter groups for housekeeping, oncogenes, and tumor suppressors
Tumor suppressors enriched only in top two groups with most conserved H3K4me3 peaks

Lung normal #1 Lung normal #2 Lung tumor #1 Lung tumor #2 Lung normal
H3K4me3 Expression (TCGA)
Expression
(RNA-Seq)
6 25 90
H3K4me3
1 4 30
Shortening
in tumor
209
Lengthening
in tumor
108
Stable
248
Random
200
Lung tumor
-5kb TSS 5kb
Distance to TSS
Shortening of broad H3K4me3 peaks in lung tumors
Chen, Kaifu, Zhong Chen, Dayong Wu, Lili Zhang, Xueqiu Lin, Jianzhong Su, Benjamin Rodriguez et al. Nature Gene�cs (24 Aug 2015)

Prominent example of cancer driven by muta�ons involving an epigene�c regulator MLL-‐AF9 promotes enhanced H3K79me2 at fusion target genes H3K79me2 specifically abnormal compared to other histone modifica�ons Loss of Dot1l selec�vely decreases leukemia-‐associated gene expression Dot1l required for MLL-‐rearranged leukemia cell growth in vitro and in vivo
H3K79 methyla�on and MLL rearranged leukemia
Bernt et al (2011) Cancer cell, 20(1), 66-‐78.

Abnormal H3K79me2 at MLL-‐AF9 targets
Bernt et al (2011) Cancer cell, 20(1), 66-‐78.
We will learn how to work with chroma�n signal data

Epigene�c inheritance in development and disease
Aberrant epigene�c changes in cancer DNA packaging and accessibility DNA methyla�on
– Nutri�on and environment -‐> fetal development – Disease biomarkers (Breast cancer prognosis)
Histone modifica�ons – Broad regions of H3K4me3 – Aberrant H3K79me2 in MLL
Lecture Summary

Any ques�ons?
On to the Laboratory!

Miscellaneous Details
ChIP Sequencing UCSC Genome Browser File formats
– BED – BEDGRAPH – bigWig
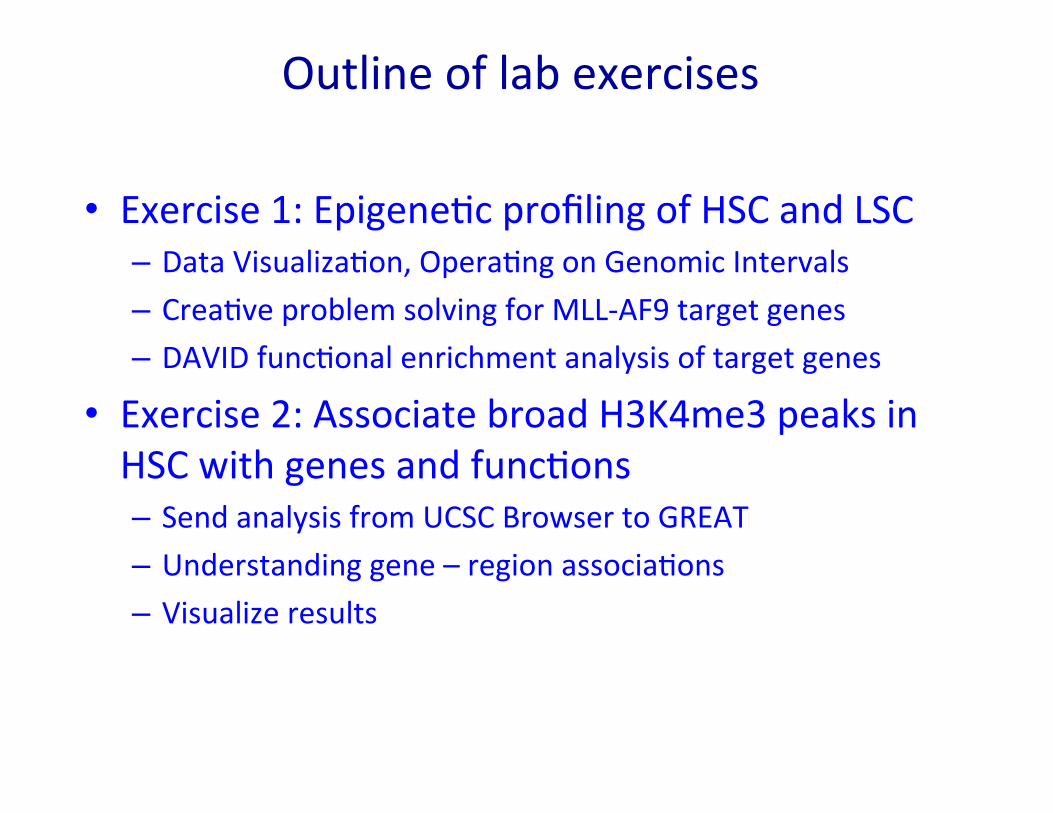
Exercise 1: Epigene�c profiling of HSC and LSC – Data Visualiza�on, Opera�ng on Genomic Intervals – Crea�ve problem solving for MLL-‐AF9 target genes – DAVID func�onal enrichment analysis of target genes
Exercise 2: Associate broad H3K4me3 peaks in HSC with genes and func�ons – Send analysis from UCSC Browser to GREAT – Understanding gene – region associa�ons – Visualize results
Outline of lab exercises

Chroma�n immunoprecipita�on followed by sequencing (ChIP-‐seq)
Procedure for genome-‐wide assays of protein-‐DNA interac�on Mapping histone modifica�ons seminal in epigene�cs research

ChIP Sequencing: Interroga�on of Histone Modifica�ons and Transcrip�on Factor Binding
Resolu�on needs to be consistent (Covaris Adap�ve Acouts�cs) An�body specificity, Chroma�n IP is a challenging technique

ChIP Sequencing: Computa�onal Analysis Workflow
Bailey et al. (2013). Prac�cal guidelines for the comprehensive analysis of ChIP-‐seq data. PLOS Computa�onal Biology. DOI: 10.1371/journal.pcbi.1003326

How can we visualize genomic data?
UCSC Genome Browser

Tools Covered: Genome Browser
and Table Browser

Genome Browser zooms and scrolls over chromosomes, showing the work of annotators worldwide
Table Browser provides convenient access to the underlying database
Bear with me I want to explain about the files we will use

BED format provides a flexible way to define the data lines that are displayed in an annota�on track
BED lines have up to 12 tab-‐delimited fields required fields: chrom, chromStart, chromEnd op�onal fields: name, score, strand, … and others. Important, lower-‐numbered fields must always be populated
if higher-‐numbered fields are used.
BED Format
First ten lines of our mouse promoter file. The header line iden�fies the track name. Why am I using the first three op�onal fields? If my promoters are all the same size, what do you suppose is the score field?

Allows display of con�nuous-‐valued data in track format Useful for probability scores and transcriptome data
BedGraph Format
BedGraph files are very easy to work with, in my opinion

bigWig Format
The processed data we will work with today are in bigWig format
For display of dense, con�nuous data Elements must be equally sized bigWig files are in an indexed binary format Only the por�ons of the files needed to display a par�cular region are transferred to UCSC
bigWig file remains on your web accessible server

Epigene�c profiling of HSC and LSC: Data Visualiza�on, Opera�ng on Genomic Intervals
Bernt et al . MLL-‐rearranged leukemia is dependent on aberrant H3K79 methyla�on by DOT1L. Cancer Cell. 2011 Jul 12;20(1):66-‐78.
(Mixed Lineage Leukemia) MLL-‐AF9 fusion gene Histone methyla�on pa�erns

Epigene�c profiling of HSC and LSC: Data Visualiza�on, Opera�ng on Genomic Intervals
GMP, granulocyte-‐macrophage progenitor, a myeloid precursor for monoblasts and myeloblasts
h�p://www.ncbi.nlm.nih.gov/geo/query/acc.cgi?acc=GSE29130

Epigene�c profiling of HSC and LSC: Data Visualiza�on, Opera�ng on Genomic Intervals
GMP, granulocyte-‐macrophage progenitor, a myeloid precursor for monoblasts and myeloblasts
h�p://www.ncbi.nlm.nih.gov/geo/query/acc.cgi?acc=GSE29130
In this exercise, our focus is MLL-‐AF9 fusion methyltransferase and HEK79me2 experiments. We will examine the chroma�n signals and interrogate enrichment at gene promoter regions.

Where did our bigWig files come from?
SRA -‐> fastq -‐> sam -‐> bam -‐> bed -‐> bedgraph -‐> bigWig
I created them from scratch, so to speak The nine job files, from top to bo�om, represent the different steps 9 Jobs x 4 Experiments: MLL-‐AF9 H3K79me2_mLSC H3K79me2_mGMP H3K79me2_mHSC
get.GSE29130.Chip-‐seq.job fastq-‐dump.job extrac�astq.job alignbow�e2.job samtools.sirdu.job btools.bamToBed.job btools.extendBed.job btools.sortBed.job btools.bambgbw.job
Epigene�c profiling of HSC and LSC: Data Visualiza�on, Opera�ng on Genomic Intervals

Adding Custom Tracks
From mm9 genome browser, choose Tools -‐> Table Browser Click on “add custom tracks”
The mouse gene promoter bed and ChIP-‐seq bigWig tracks should now appear on Manage Custom Tracks
Custom track files can also be uploaded via the “Choose File” op�on To upload many large files, you want to use a web server as we did above
From a separate browser window, copy the bigWig and bed file “UCSC Genome Browser Tracks” lines from h�p://dldcc-‐web.brc.bcm.edu/lilab/benji/MBRB_2015/GSE29130.track.list.txt
and paste them into “Paste URLs” box Click submit to load the tracks

Data Visualiza�on: Changing Track Display Se�ngs
The snapshot depicts the Tg�1 promoter region
Signal intensi�es appear comparable, but the axes have different display scales by default
We need a common scale for the H3K79me2 samples
There are several ways to access individual track se�ngs
0.2
1.7
3.0
2.0
MLL-‐AF9

Data Visualiza�on: Changing Track Display Se�ngs

Data Visualiza�on: Changing Track Display Se�ngs
Hint: use the tab key to
cycle through boxes quickly

(A�er) H3K79me2 experiments ver�cal axis set to V-‐max = 5 Now you can see H3K79me2 enrichment greater in GMP than LSC In contrast, MLL-‐AF9 binding appears minimal (set V-‐max = 1.5)
A�er Before
MLL-‐AF9 MLL-‐AF9

Meis1 is a MLL-‐fusion target iden�fied by Bernt et al as well as a previous study in Genes and Development Let’s use the Meis1 promoter to make a quick and dirty cut-‐off to separate MLL-‐AF9 signal from noise.
Posi�ve controls can show us the difference between signal and noise in ChIP-‐seq data
MLL-‐AF9
Meis1 gene
Summary of MLL-‐AF9 protein binding signal at Meis1 promoter
Meis1 promoter

From Table Browser, select “create filter” [ 1 ] to bring up “Filter on Fields” [ 2 ] Set dataValue > 0.318759 (mean of Meis1 promoter) Set data output 10E7 lines Press submit [ 3 ] Returning to Table Browser, set output format to “custom track”
Quick and Dirty MLL-‐AF9 Signal Filter
1 2
3
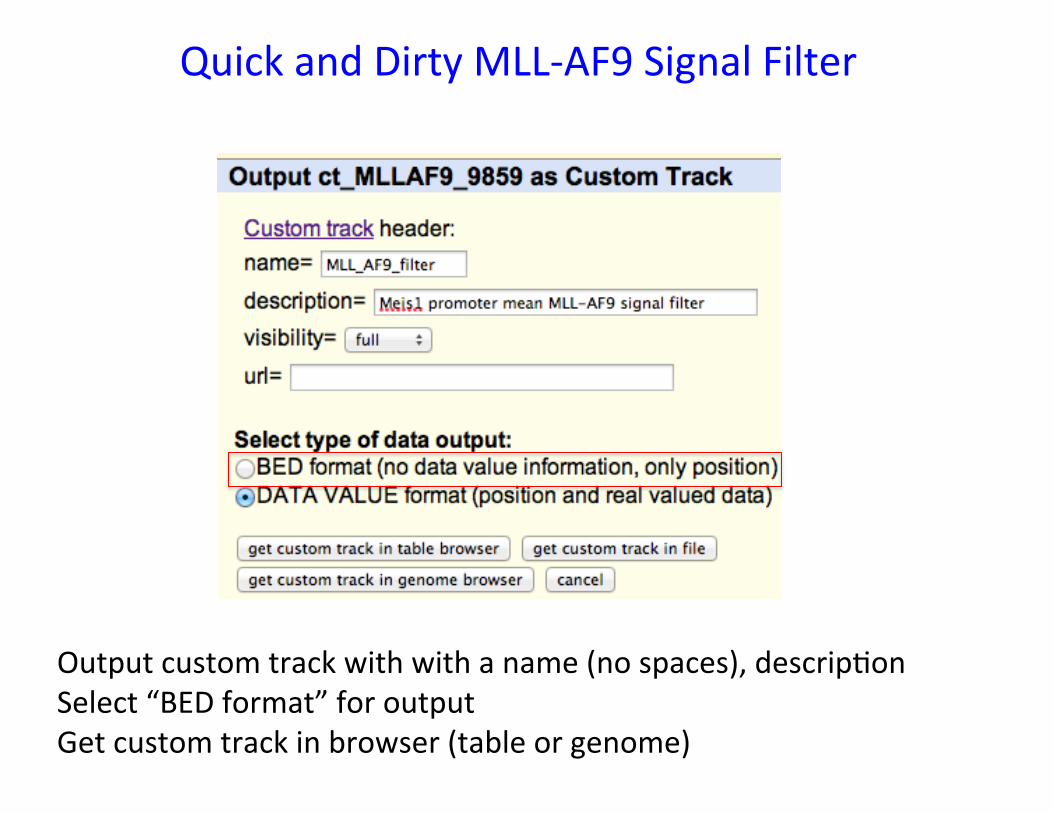
Output custom track with with a name (no spaces), descrip�on Select “BED format” for output Get custom track in browser (table or genome)
Quick and Dirty MLL-‐AF9 Signal Filter
3

Genome-‐wide summary sta�s�cs show 1.16 million of 2.62 billion bases have signal > mean of the Meis1 promoter
Quick and Dirty MLL-‐AF9 Signal Filter
1 2
3

Examining Our Custom MLL-‐AF9 Signal Track
3
chr6:52,155,000-‐52,187,500
The four Hoxa genes and Mir196b were predicted by the Bernt et al paper’s empirical null distribu�on model Pre�y cool for arbitrary, eh?
MLL-‐AF9 protein binding signal (Filtered)
Unfiltered MLL-‐AF9
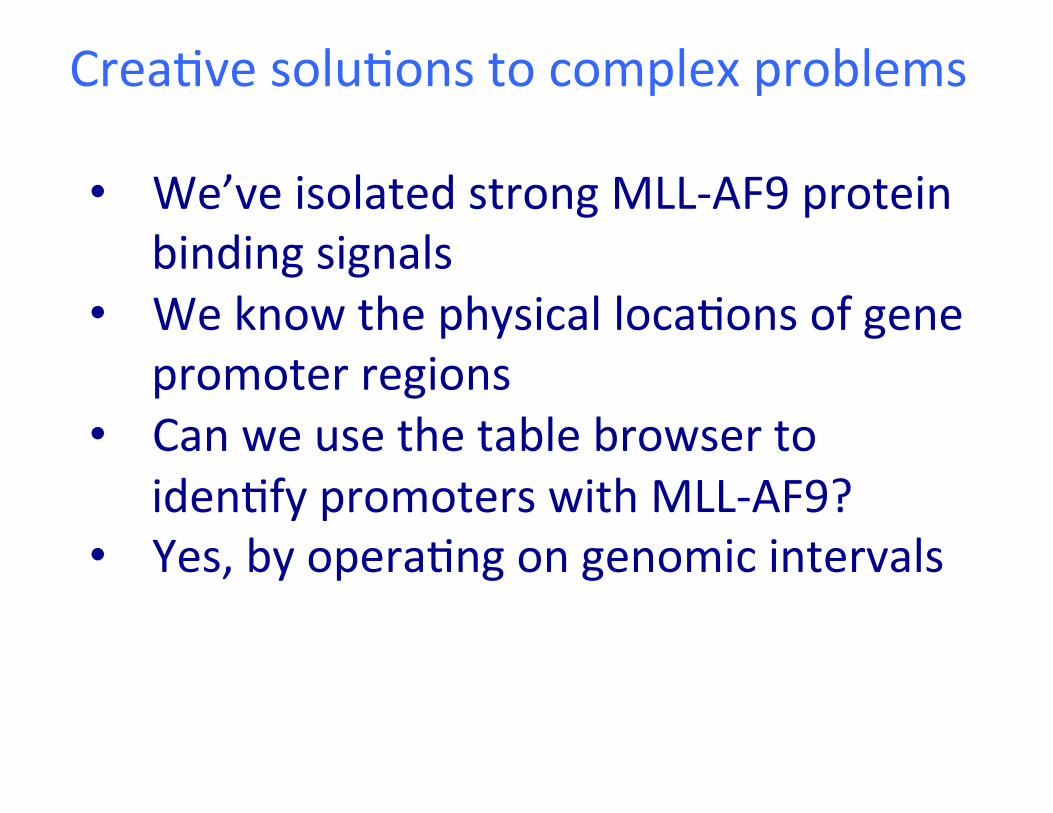
We’ve isolated strong MLL-‐AF9 protein binding signals
We know the physical loca�ons of gene promoter regions
Can we use the table browser to iden�fy promoters with MLL-‐AF9?
Yes, by opera�ng on genomic intervals
Crea�ve solu�ons to complex problems

Intersec�ons of genomic intervals

Opera�ng on genomic intervals From Table Browser, choose mm9_promoter track Click on “create intersec�on” to bring up the Intersect window Select your MLL-‐AF9 custom track Select “all records” overlap op�on Click submit Screen returns to Table Browser
Click on summary sta�s�cs to see the number of intersec�ng promoters. Press back to return to Table Browser
On Table Browser, select output format “BED – browser extensible data” Click on “get output” On the next screen, choose “get BED”

Opera�ng on genomic intervals
Our BED file of MLL-‐AF9 bound promoters contains the informa�on necessary for func�onal enrichment analyses as well as addi�onal intersec�ons with other data, such as H3K79me2 levels BED files can be created from almost any annota�on track in the UCSC browser Propose a query you would like to make on the MLL-‐AF9 promoters and plan your a�ack Alterna�vely, take the fi�h column of the promoter file (Entrez gene iden�fiers) and run an enrichment analysis at h�p://david.abcc.ncifcrf.gov

Func�onal enrichment analyses with DAVID
Comprehensive set of func�onal annota�on tools for inves�gators to understand biological meaning behind large list of genes
We will use DAVID to analyze our MLL-‐AF9 target genes
Open h�p://david.abcc.ncifcrf.gov and choose “Start Analysis”

“Upload Gene List” Dialog box Step 1: Copy and Paste the entrez gene ID’s from MLL-‐
AF9_promoters.bed file (column 5) Step 2: On “Select Iden�fier”, choose “ENTREZ_GENE_ID”
Step 3: Choose “Gene List” on “List Type” Step 4: Submit List
DAVID: Upload Gene List
Note: Entrez Gene ID’s are a preferred way to search for gene func�ons They can account for the fact that a gene may go by several different names

For species, highlight Mus musculus and click “Select Species”
Rename the list
DAVID: Analyze Gene List
Choose “Func�onal Annota�on Tool”

DAVID: What does all this stuff mean????
Each Annota�on Category on the le� can be expanded to reveal a number of op�onal databases to query This allows for powerful customiza�on For this exercise, we will accept the default op�ons
Choose “Func�onal Annota�on Chart”

Hint: Rerun using op�ons Count >= 4 removes weak results Fold enrichment provides you a new, valuable metric FDR gives you another choice mul�ple tes�ng correc�on
DAVID: Don’t drown in the details
A func�onal annota�on tool will present you with many choices Stay focused, take notes of what parameters you tried

DAVID: Examine enriched terms Top enriched biological processes pertain to transcrip�onal regula�on and cell cycle
Func�onal Annota�on Chart default fields are: category, term, related term (RT), genes, count, percentage, p-‐value (univariate modified Fisher’s), and Benjamini p-‐value (correc�on for mul�ple tes�ng)
Terms with arrows can be sorted
Hint. If you have a long list of records, try sor�ng by Fold Enrichment and FDR fields to get a different sense of the data

DAVID: Explore a par�cular result Clicking on the genes list bar for GO BP term “regula�on of transcrip�on”
Hint: If you want to capture the list of genes, click on download file
Text file easier to paste into Excel than html!

Clicking on the gene link for Meis homeobox 1 brings up gene informa�on, links to publica�ons, database entries
DAVID: Explore a par�cular result deeper

DAVID: Addi�onal direc�ons to take
Func�on annota�on clustering provides another way to explore rela�onships between related terms in your results Help get at the underlying biology Genes enriched in TF regulatory ac�vity, cell cycle, SAND domain

Exercise 1 Summary
Access, load data to UCSC genome browser Importance of viewing scales We are not limited to simple, passive browsing of chromosomes (Empowered by Table Browser) Intersect MLL-‐AF9 enriched signal and promoters Func�onal enrichment analyses in DAVID Biological inferences: 1. MLL-‐AF9 target genes o�en involved in cell cycle,
regula�on of transcrip�on

Exercise 2: Associate Broad H3K4me3 peaks in
HSC with genes and func�ons
Scale
chr19:
_14563
10 kb mm9
32,825,000 32,830,000 32,835,000 32,840,000RefSeq Genes
User Supplied Track
m24_H3K4me3
m24_RatioDepth
Pten
100 _
0 _
100 _
-10 _
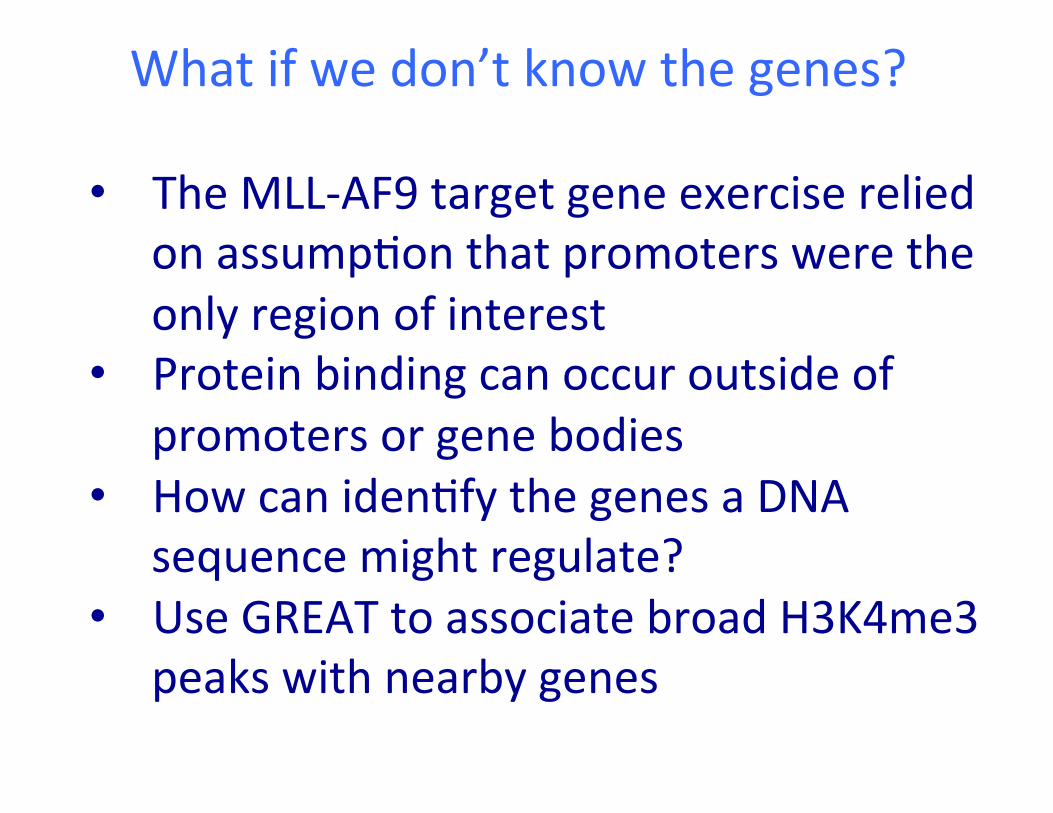
The MLL-‐AF9 target gene exercise relied on assump�on that promoters were the only region of interest
Protein binding can occur outside of promoters or gene bodies
How can iden�fy the genes a DNA sequence might regulate?
Use GREAT to associate broad H3K4me3 peaks with nearby genes
What if we don’t know the genes?

Explore broad H3K4me3 peaks of HSC in GREAT
Defining a Gene regulatory domain

GREAT Interface from UCSC Table Browser
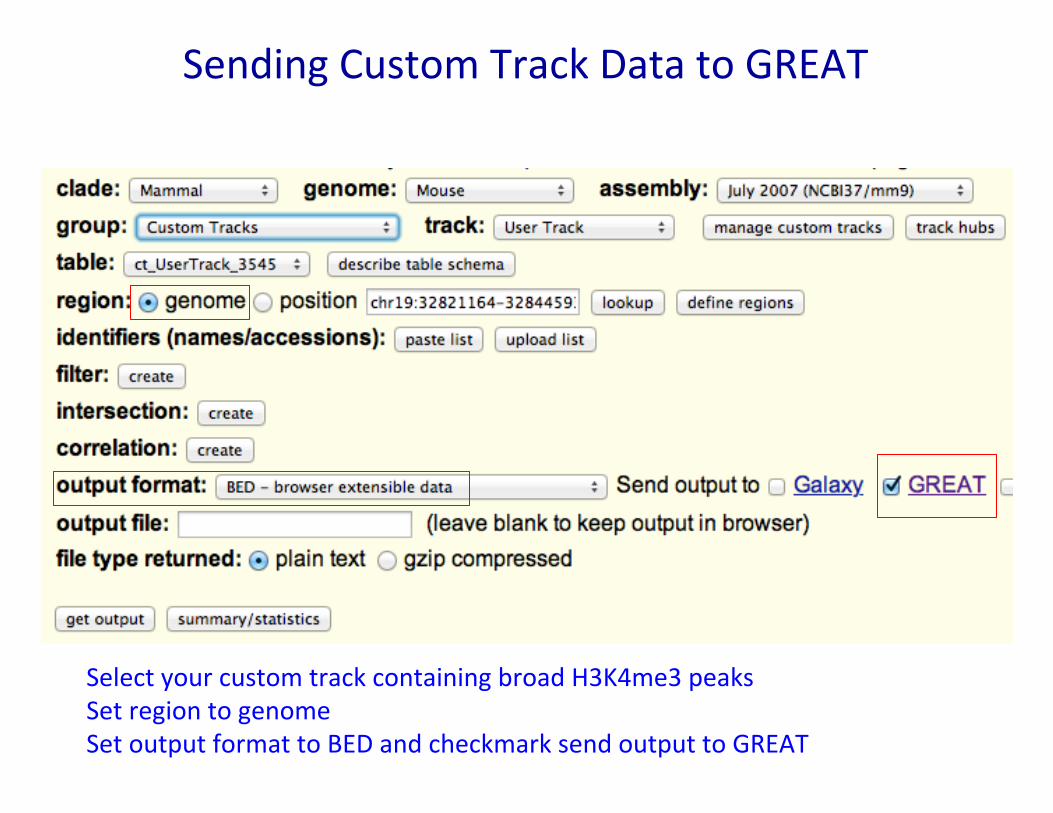
Sending Custom Track Data to GREAT
Select your custom track containing broad H3K4me3 peaks Set region to genome Set output format to BED and checkmark send output to GREAT
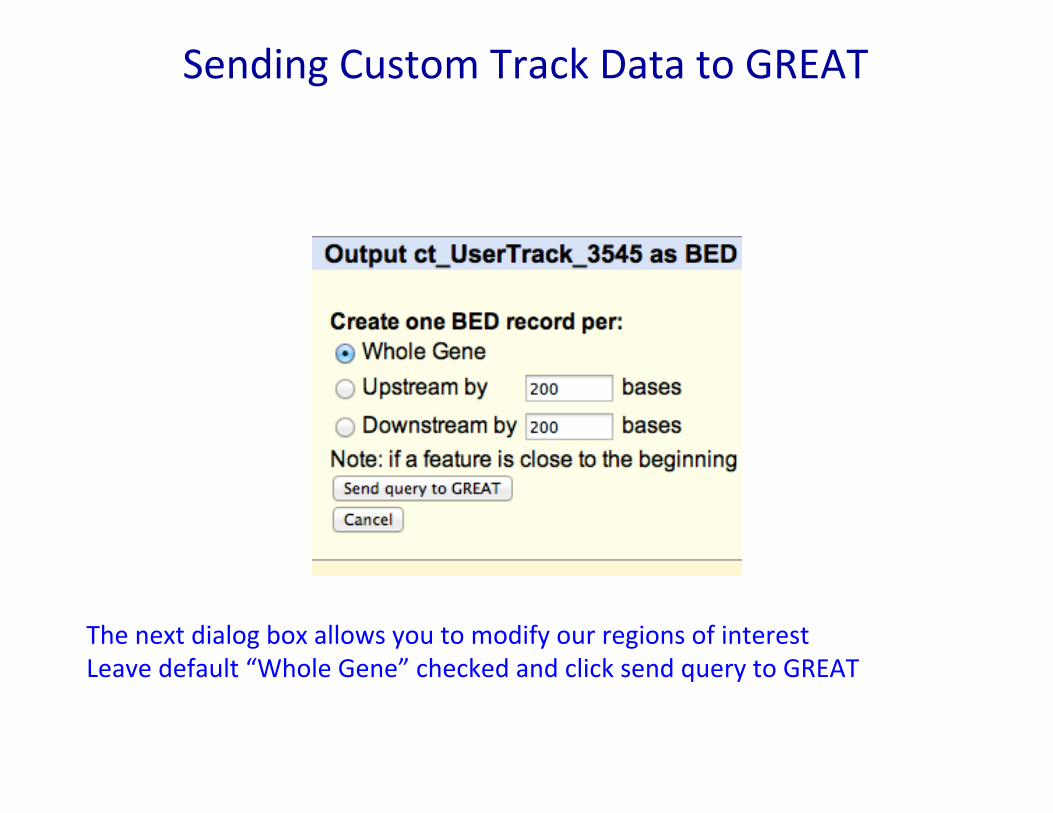
Sending Custom Track Data to GREAT
The next dialog box allows you to modify our regions of interest Leave default “Whole Gene” checked and click send query to GREAT
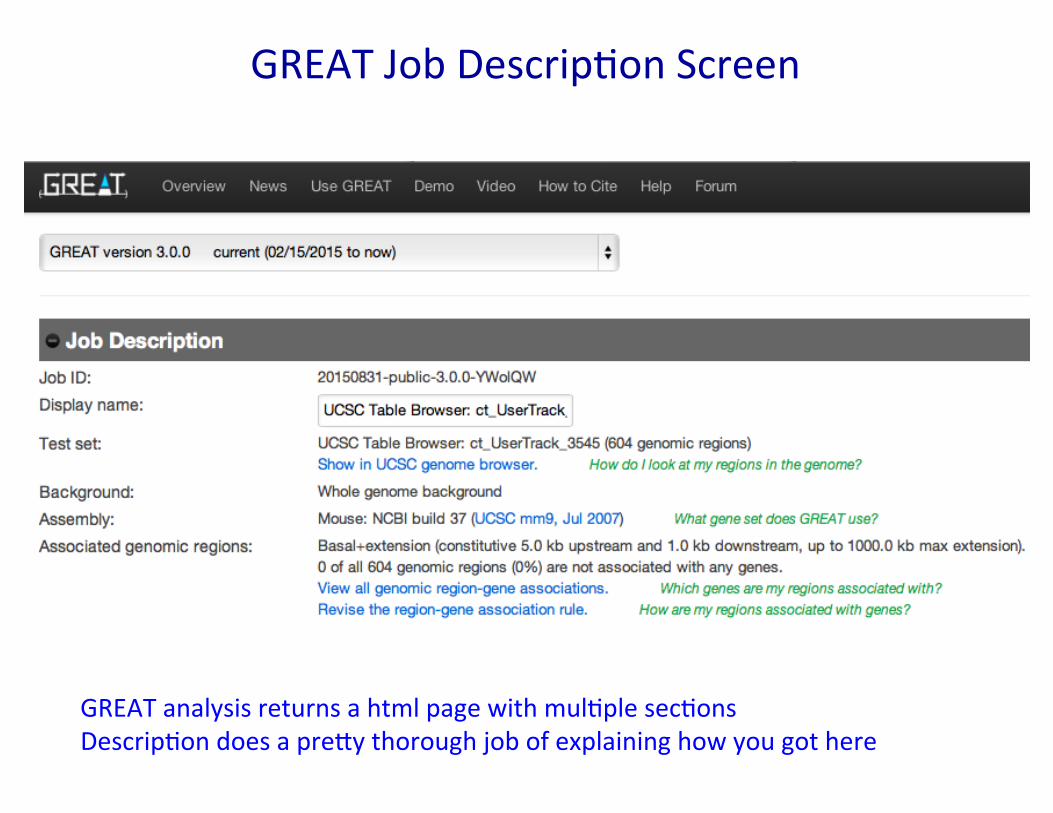
GREAT Job Descrip�on Screen
GREAT analysis returns a html page with mul�ple sec�ons Descrip�on does a pre�y thorough job of explaining how you got here

GREAT: Viewing Region – Gene Associa�ons
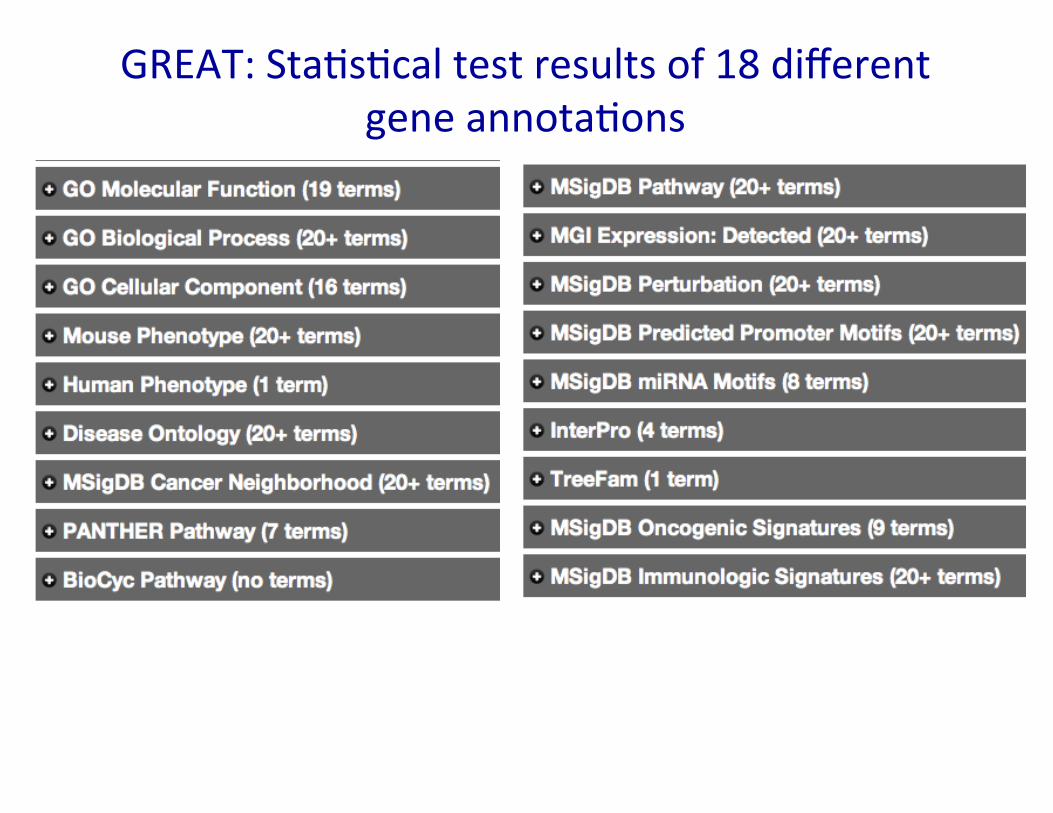
GREAT: Sta�s�cal test results of 18 different gene annota�ons

Results table for the first ontology GO MF

Review tabular results for enriched term “transcrip�on cofactor ac�vity”

Review predicted region – gene associa�ons therein
Can download tables
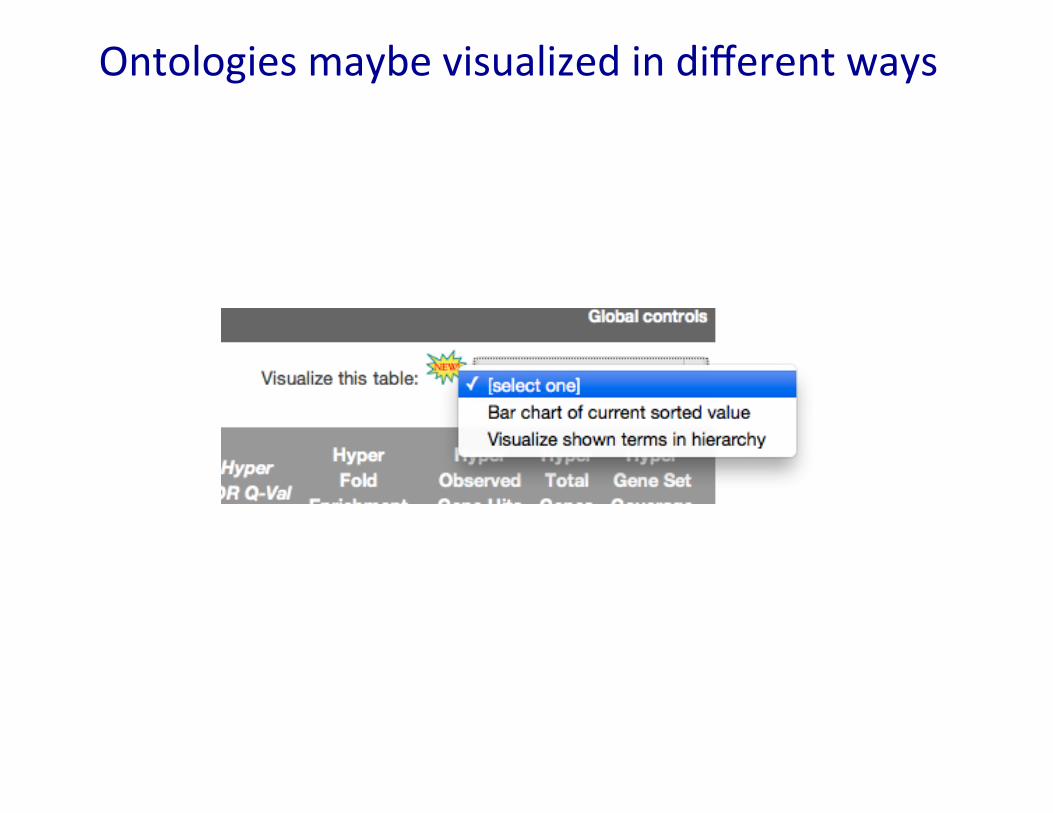
Ontologies maybe visualized in different ways

Sta�c bar plot customize appearance
Save file Perfect for Lab mee�ng presenta�ons!!
Detailed explana�on of plot
Display op�ons

0 2 4 6 8 10 12 14 16 18m alignant neoplasm of ... nd hem opoiet ic t issue
hem atologic cancerleukem ia
lym phoid cancerlym phoproliferat ive disease
im m unoproliferat ive diseaseDNA virus infect ious disease
bone m arrow cancerbone m arrow disease
18.0117.64
15.7911.71
11.2111.20
10.218.91
8.61
Disease Ont ology-log10(Binom ial p value)
Job ID: 20150902-public-3.0.0-0QMl7gDisplay nam e: H3K4m e3_m 24_b19_run03_peaks.clean.cutoff.4kb.bed5
Top enriched diseases in broad H3K4me3 peaks of HSC
Example of customizing plot appearance Exported as PDF

aabbnnoorrmm aall bblloooodd cceellllabnorm al blood cellmm oorrpphhoollooggyy//ddeevveellooppmm eem orphology/developm e
ttt
2 .3 6
aabbnnoorrmm aallabnorm alhheemm aattooppooiieessiisshem atopoiesis
2 .3 6
aabbnnoorrmm aallabnorm alhheemm aattooppooiieett iicchem atopoiet ic
ssyysstteemmsystemmm oorrpphhoollooggyy//ddeevveellooppmm eem orphology/developm e
ttt
2 .2 1
hheemm aattooppooiieett iicchem atopoiet icssyysstteemm pphheennoottyyppeesystem phenotype
2 .1 9
ddeeccrreeaasseedddecreasedhheemm aattooppooiieett iicc cceellllhem atopoiet ic cell
nnuumm bbeerrnum ber
2 .8 4
aabbnnoorrmm aall lleeuukkooccyytteeabnorm al leukocytemm oorrpphhoollooggyym orphology
2 .4 8
aabbnnoorrmm aallabnorm alhheemm aattooppooiieett iicc cceellllhem atopoiet ic cell
nnuumm bbeerrnum ber
2 .5 4
aabbnnoorrmm aall iimm mm uunneeabnorm al im m unessyysstteemm cceellllsystem cellmm oorrpphhoollooggyym orphology
2 .4 7
aabbnnoorrmm aallabnorm almm oonnoonnuucclleeaarr cceellllm ononuclear cell
mm oorrpphhoollooggyym orphology
2 .5 7
aabbnnoorrmm aall iimm mm uunneeabnorm al im m unessyysstteemm mm oorrpphhoollooggyysystem m orphology
2 .2 6
aabbnnoorrmm aall llyymm pphhooccyytteeabnorm al lym phocytemm oorrpphhoollooggyym orphology
2 .7 2
aabbnnoorrmm aall lleeuukkooccyytteeabnorm al leukocytecceellll nnuumm bbeerrcell num ber
2 .5 8
aabbnnoorrmm aall bboonneeabnorm al bonemm aarrrrooww cceellllm arrow cell
mm oorrpphhoollooggyy//ddeevveellooppmm eem orphology/developm ettt
2 .7 3
aabbnnoorrmm aall llyymm pphhooccyytteeabnorm al lym phocytecceellll nnuumm bbeerrcell num ber
2 .7 3
ddeeccrreeaasseedd lleeuukkooccyytteedecreased leukocytecceellll nnuumm bbeerrcell num ber
2 .7 7
ddeeccrreeaasseedddecreasedllyymm pphhooccyyttee cceelllllym phocyte cell
nnuumm bbeerrnum ber
2 .9 5
aabbnnoorrmm aallabnorm allleeuukkooppooiieessiissleukopoiesis
2 .6 1
aabbnnoorrmm aall iimm mm uunneeabnorm al im m unessyysstteemm oorrggaannsystem organmm oorrpphhoollooggyym orphology
2 .3 9
aabbnnoorrmm aall mm yyeelloobbllaassttabnorm al m yeloblastmm oorrpphhoollooggyy//ddeevveellooppmm eem orphology/developm e
ttt
2 .6 2
aabbnnoorrmm aall BB cceellllabnorm al B cellmm oorrpphhoollooggyym orphology
2 .9 6
Very General: Hematopoie�c
system phenotype
More Specific: Abnormal
hematopoie�c cell number
Very Specific: Decreased lymphocyte cell number
Visualize hierarchical rela�onships in DAG
Most gene annota�on systems contain an organiza�onal hierarchy
We are examining Mouse Phenotypes set
DAG plots systems of events and rela�onships between them
Nodes (circles) are the enriched terms sized according to fold-‐enrichment

Exercise 2 Summary
Easy to pass a dataset from UCSC browser to GREAT How to define gene regulatory domains with dataset Results can be visualized in different ways Biological inferences: 1. Broad H3K4me3 peaks are highly enriched for
genes involved in regula�on of TF binding 2. Subset of genes func�on in hematopoiesis,
implicated in cancers of bone marrow
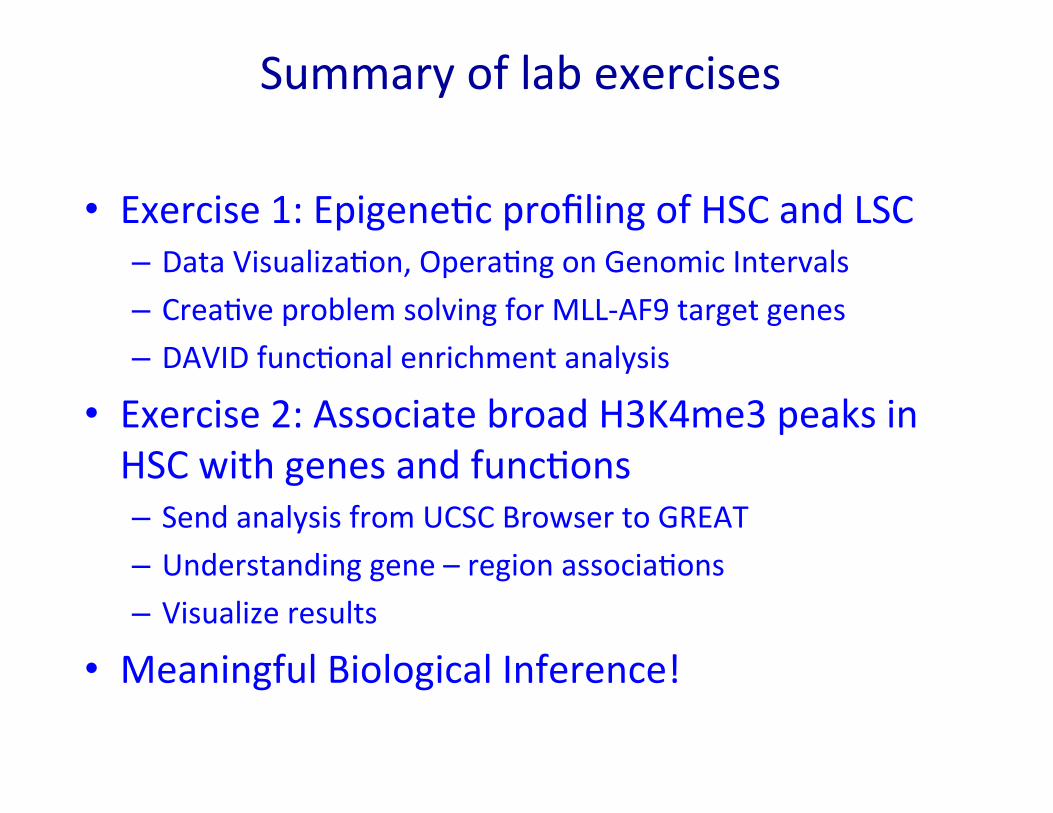
Exercise 1: Epigene�c profiling of HSC and LSC – Data Visualiza�on, Opera�ng on Genomic Intervals – Crea�ve problem solving for MLL-‐AF9 target genes – DAVID func�onal enrichment analysis
Exercise 2: Associate broad H3K4me3 peaks in HSC with genes and func�ons – Send analysis from UCSC Browser to GREAT – Understanding gene – region associa�ons – Visualize results
Meaningful Biological Inference!
Summary of lab exercises

Thanks for your �me and a�en�on