a field study of a comprehensive violence risk assessment battery
TRANSCRIPT
CRIMINAL JUSTICE AND BEHAVIOR, 201X, Vol. XX, No. X, Month 2015, 1 –17.
DOI: 10.1177/0093854815572252
© 2015 International Association for Correctional and Forensic Psychology
1
A Field Study oF A ComprehenSive violenCe riSk ASSeSSment BAttery
TESS M.S. NEALArizona State University
SARAH L. MILLER
R. CLAyTON SHEALyThe University of Alabama
We used archival data to examine the predictive validity of a prerelease violence risk assessment battery over 6 years at a forensic hospital (N = 230, 100% male, 63.0% African American, 34.3% Caucasian). Examining “real-world” forensic deci-sion making is important for illuminating potential areas for improvement. The battery included the Historical-Clinical-Risk Management–20, Psychopathy Checklist–Revised, Schedule of Imagined Violence, and Novaco Anger Scale and Provocation Inventory. Three outcome “recidivism” variables included contact violence, contact and threatened violence, and any reason for hospital return. Results indicated measures of general violence risk and psychopathy were highly correlated but weakly associated with reports of imagined violence and a measure of anger. Measures of imagined violence and anger were corre-lated with one another. Unexpectedly, Receiver Operating Characteristic curve analyses revealed that none of the scales or subscales predicted recidivism better than chance. Multiple regression indicated the battery failed to account for recidivism outcomes. We conclude by discussing three possible explanations, including timing of assessments, controlled versus field studies, and recidivism base rates.
Keywords: anger; violence; risk assessment; recidivism; incremental validity; field study
Mental health providers in correctional, hospital, and community settings often rely on violence risk assessments to make decisions about client placements. “Dangerousness
to others” became a primary criterion in the 1960s in federal law for involuntary hospital-ization of individuals with mental disorders in the United States and continued to be used in subsequent case law (e.g., Barefoot v. Estelle, 1983; Baxstrom v. Herold, 1966; O’Connor v. Donaldson, 1975). Tort liability required mental health treatment providers to consider patients’ potential for violence beginning in the 1970s, and the dangerousness standard was expanded to authorize involuntary outpatient treatment in the 1980s, typically through state statutory and case law (Appelbaum, 1994).
Although the field of risk assessment initially began with unstructured clinical judg-ments that yielded poor predictions (Monahan, 1981; Steadman & Cocozza, 1974), signifi-cant progress has been made since that time. The extensive and impressive body of research
AuthorS’ note: Correspondence concerning this article should be addressed to Tess M.S. Neal, New College of Interdisciplinary Arts & Sciences - SBS, Arizona State University, 4701 West Thunderbird Rd, Glendale AZ 85306. E-mail: [email protected]
572252 CJBXXX10.1177/0093854815572252Criminal Justice and Behaviorneal et al. / Comprehensive violence risk Assessment Batteryresearch-article2015
at UNIV NEBRASKA LIBRARIES on April 16, 2015cjb.sagepub.comDownloaded from
2 CRIMINAL JUSTICE AND BEHAVIOR
regarding modern violence risk assessment has provided significant practical advances for the clinicians tasked with performing such assessments in real-world settings. For instance, several structured assessment instruments have been developed to assist clinicians in for-mally assessing violence risk (e.g., Douglas, Hart, Webster, & Belfrage, 2013; Hare, 2003; Harris, Rice, & Quinsey, 1993).
Despite these advances, the utility of the research on violence risk assessment tools is limited by the extent to which the tools can translate to clinical sites (especially those unaffiliated with academic organizations or researchers) given that almost all of the research demonstrating the reliability and validity of these measures has been conducted in controlled settings. Fewer studies have examined how these instruments perform in “the real world,” though it is to be expected that poorer reliability and validity values will be seen when these tools are administered by everyday practitioners. Given that most risk assessments and subsequent treatment- and placement-related decisions are done in the field rather than in more controlled research settings, understanding the strengths and weaknesses of these tools in the field is critical for targeting potential areas for improvement.
In the present study, we analyzed existing assessment data from a forensic psychiatric hospital in which clinicians are frequently tasked with conducting prerelease violence risk assessments to inform discharge decisions. The hospital policy specified a standard battery for violence risk assessments, which included not only well-known and frequently used violence risk assessment tools but also an index of anger, an approach not often discussed in the violence risk assessment literature. We sought to add to the violence risk assessment literature by (a) testing the field reliability and predictive validity of well-researched mea-sures and (b) examining the degree to which measuring anger adds incremental validity to the risk assessment battery. We thought the anger measure might improve the assessment because it measured a different trait (anger) via a different method (self-report as opposed to clinician-rated) than the measures most often studied in the violence risk assessment literature.
AdvAntAgeS oF multitrAit, multimethod meASurement
The potential advantage of our approach is supported by the methodological and sta-tistical benefits of using a multitrait, multimethod approach to measurement (Campbell & Fiske, 1959; Walters, 2006). For example, in a meta-analysis examining multimethods by comparing risk tools with self-report measures in the prediction of criminal justice out-comes, Walters (2006) found that both kinds of measures accounted for incremental vari-ance. That is, clinician-completed tools and self-report tools each contributed valuable and unique predictive validity information. Using a multitrait, multimethod approach is particularly beneficial when the variables or tools used are independent of one another and provide unique and incrementally valid information (see Faust & Ahern, 2012; Kahneman, 2011). Using more tools is not better, especially when the tools or variables provide overlapping or redundant information. Thus, an investigation like this of the strongest components of an assessment battery will yield data not only for the hospital itself (e.g., to inform policy and practice at the particular institution where these data were gathered) but also for other facilities regarding the reliability and validity of these tools in real-world settings.
at UNIV NEBRASKA LIBRARIES on April 16, 2015cjb.sagepub.comDownloaded from

Neal et al. / COMPREHENSIVE VIOLENCE RISK ASSESSMENT BATTERy 3
Anger And violenCe riSk
Anger has long been associated with aggression and violence from both a theoretical perspective and as demonstrated through empirical evidence (Craig, 1982; Novaco, 2003; Novaco & Jarvis, 2002). Recent studies have shown anger to be related to physical aggres-sion in inpatient settings (Doyle & Dolan, 2006a; McDermott, Quanbeck, Busse, yastro, & Scott, 2008) as well as in the community (Doyle, Carter, Shaw, & Dolan, 2012; Doyle & Dolan, 2006b; Monahan et al., 2001; Skeem et al., 2006). As a result, the assessment of anger has increased in forensic psychiatric and correctional settings, and treatment pro-grams targeting anger have been developed in hopes of reducing violence (see, for example, Haddock et al., 2009).
One self-report measure developed to assess the internal experience of anger is the Novaco Anger Scale and Provocation Inventory (NAS-PI; Novaco, 2003), which was the measure used in this study (see “Method” section). The NAS-PI has been shown to substan-tially correlate in the expected direction with other measures of anger and hostility, observ-ers’ ratings of angry behaviors, and occurrence of violent behaviors (Grisso, Davis, Vesselinov, Appelbaum, & Monahan, 2000; Novaco, 2003; Steadman et al., 2000). Doyle et al. (2012) found the NAS to be predictive of community violence following discharge from acute psychiatric hospitals in England up to 20 weeks postdischarge and noted that anger was more predictive of violence than impulsiveness and psychopathy.
hypotheSeS
We developed several a priori hypotheses. First, we expected the established violence risk assessment measures would demonstrate acceptable unique and conjoint predictive validity on the outcomes of interest given the extant research demonstrating good predictive validity in more controlled research settings. Second, we expected the anger measure would correlate with the existing measures but would add unique incremental validity to the risk assessment battery when included with the existing risk assessment tools. Third, we expected the field reliability of the well-researched violence risk assessment measures would be lower than samples documenting the reliability of the tools’ more controlled research settings, given the typical decrease in cross-validation samples and in applied ver-sus research samples (see, for example, DeMatteo et al., 2014; Monahan et al., 2005).1
method2
pArtiCipAntS
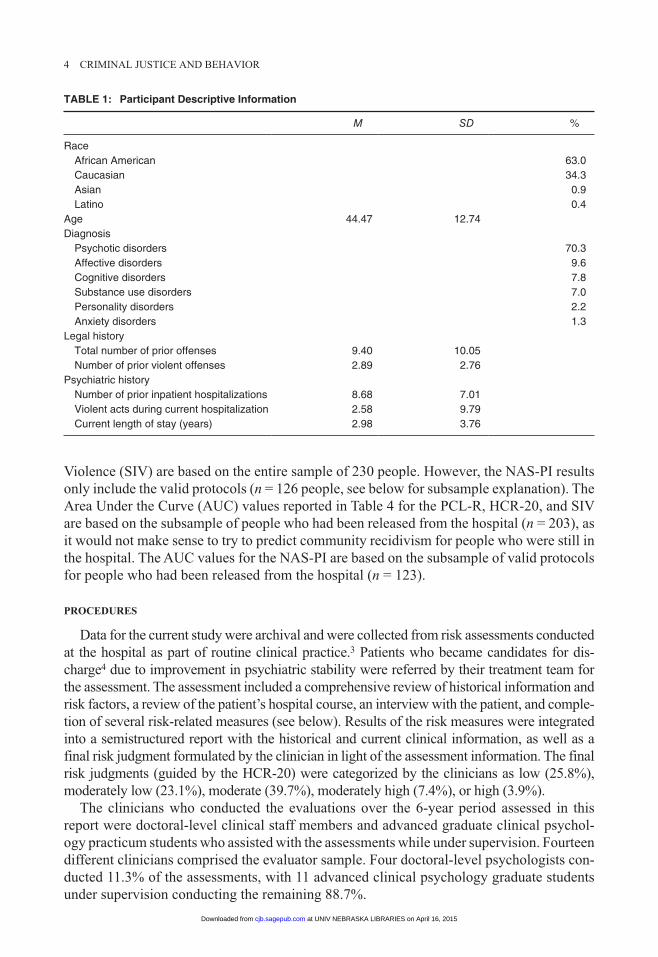
Participants were male inpatients in a maximum security forensic psychiatric hospital in the southern United States. Patients who were considered for discharge between 2003 and 2009 were included in the current study. A formal assessment of violence risk was conducted as part of routine practice for each patient prior to his consideration for release from the hospital. A total of 230 participants were identified as having had a prerelease violence risk assessment during this period. Descriptive statistics for the participants are provided in Table 1.
The various analyses included different subsets of participants, given the parameters of each particular analysis. Specifically, the scale descriptive statistics reported in Table 2 and the bivariate correlations reported in Table 3 for the Psychopathy Checklist–Revised (PCL-R), Historical-Clinical-Risk Management–20 (HCR-20), and Scheduled of Imagined
at UNIV NEBRASKA LIBRARIES on April 16, 2015cjb.sagepub.comDownloaded from
4 CRIMINAL JUSTICE AND BEHAVIOR
Violence (SIV) are based on the entire sample of 230 people. However, the NAS-PI results only include the valid protocols (n = 126 people, see below for subsample explanation). The Area Under the Curve (AUC) values reported in Table 4 for the PCL-R, HCR-20, and SIV are based on the subsample of people who had been released from the hospital (n = 203), as it would not make sense to try to predict community recidivism for people who were still in the hospital. The AUC values for the NAS-PI are based on the subsample of valid protocols for people who had been released from the hospital (n = 123).
proCedureS
Data for the current study were archival and were collected from risk assessments conducted at the hospital as part of routine clinical practice.3 Patients who became candidates for dis-charge4 due to improvement in psychiatric stability were referred by their treatment team for the assessment. The assessment included a comprehensive review of historical information and risk factors, a review of the patient’s hospital course, an interview with the patient, and comple-tion of several risk-related measures (see below). Results of the risk measures were integrated into a semistructured report with the historical and current clinical information, as well as a final risk judgment formulated by the clinician in light of the assessment information. The final risk judgments (guided by the HCR-20) were categorized by the clinicians as low (25.8%), moderately low (23.1%), moderate (39.7%), moderately high (7.4%), or high (3.9%).
The clinicians who conducted the evaluations over the 6-year period assessed in this report were doctoral-level clinical staff members and advanced graduate clinical psychol-ogy practicum students who assisted with the assessments while under supervision. Fourteen different clinicians comprised the evaluator sample. Four doctoral-level psychologists con-ducted 11.3% of the assessments, with 11 advanced clinical psychology graduate students under supervision conducting the remaining 88.7%.
Table 1: Participant Descriptive Information
M SD %
Race African American 63.0 Caucasian 34.3 Asian 0.9 Latino 0.4Age 44.47 12.74 Diagnosis Psychotic disorders 70.3 Affective disorders 9.6 Cognitive disorders 7.8 Substance use disorders 7.0 Personality disorders 2.2 Anxiety disorders 1.3Legal history Total number of prior offenses 9.40 10.05 Number of prior violent offenses 2.89 2.76 Psychiatric history Number of prior inpatient hospitalizations 8.68 7.01 Violent acts during current hospitalization 2.58 9.79 Current length of stay (years) 2.98 3.76
at UNIV NEBRASKA LIBRARIES on April 16, 2015cjb.sagepub.comDownloaded from
Neal et al. / COMPREHENSIVE VIOLENCE RISK ASSESSMENT BATTERy 5
The practicum students and the psychologists participated in a yearly intensive training process in which a detailed didactic training session was provided for the students on the use of the HCR-20 and the PCL-R, followed by group practice by the students and all the staff psychologists. Everyone worked through one case individually based on a chart review and then all discussed their scoring and the manualized instructions until everyone was in agreement about how the measures should be scored in that case. Then, the same process occurred for a second case in which both a chart review and a group interview with the patient occurred. The practicum students (and new staff psychologists) were then required to observe and shadow code assessments in five in vivo assessments conducted by doctoral-level clinicians. If the ratings on the HCR-20 and PCL-R were in reasonable agreement (85% was the benchmark), then students and new psychologists were allowed to begin conducting assessments under supervision.
An important note is that after the trainings, only a single evaluator (i.e., one of the doctoral-level clinical staff or else an advanced practicum student under the supervision of one of the doctoral-level clinical staff) conducted the “real” assessments: The assessments that represent the sample in the current article. Thus, the interrater reliability of the instru-ments as used in routine practice in this sample is not known and intraclass correlation coefficients (ICCs) cannot be calculated.
We obtained violence recidivism data from two sources: by searching the state’s criminal record system for any new violent arrests of each discharged patient (at least 18 months postdischarge), and by searching the hospital’s record system for information about patients who had been readmitted due to violence after discharge. We used the definition of violence provided by the HCR-20 in coding our data: “actual, attempted, or threatened harm to a person or persons” (Webster & Douglas, 2001, p. 24). We collected follow-up outcome data in July 2011. By the time of the follow-up data collection, 88.3% of the patients in the sample had been released from the hospital. Of those who had been released, 15.7% had returned to the forensic hospital. Time-at-risk varied for people who were released (M = 38.11 months, SD = 23.14 months, range = 22 days to 7.75 years). To control for time at risk in the analyses, we calculated rate of violence by dividing the number of violent acts after release from the hospital by the number of days a person was at risk in the community (see, for example, Douglas, Ogloff, Nicholls, & Grant, 1999).5
Violence as a reason for return was present in 11.7% of cases (e.g., threats to kill, physi-cal assaults, sexual assaults, domestic violence). Other reasons for return included sub-stance abuse, nonviolent legal infractions, eloping from the step-down treatment facility, and medication noncompliance. New legal charges included both violent offenses (e.g., domestic violence, arson, sodomy, rape, sexual assault, hijacking, aggravated stalking) and nonviolent offenses (e.g., escape, breaking and entering, burglary, obstruction of justice, possession of or receiving controlled substances, public intoxication, driving offenses, false report, disorderly conduct, violation of conditional release, theft of a motor vehicle, com-munity notification violation).
meASureS
hare pCl-r: 2nd edition
The PCL-R is an index of psychopathy, a personality disorder consisting of behavioral (e.g., manipulativeness, impulsivity), interpersonal (e.g., superficial charm, deceitfulness), and affective (e.g., callousness, lack of remorse, shallow affect) traits (Hare, 2003). The
at UNIV NEBRASKA LIBRARIES on April 16, 2015cjb.sagepub.comDownloaded from

6 CRIMINAL JUSTICE AND BEHAVIOR
measure consists of a four-facet model containing interpersonal (Facet 1) and affective (Facet 2) components of Factor 1, and lifestyle (Facet 3) and antisocial (Facet 4) compo-nents of Factor 2. The clinician is asked to consider and rate the presence and degree of 20 psychopathic personality traits in a given evaluee when completing the PCL-R, and scores are summed for a total. Interrater reliabilities reported in the manual range from ICCs of .41 to .94 for individual items, .67 to .94 for Facet scores, and .87 to .93 for Total scores.
hCr-20
The HCR-20 is a 20-item structured guide to assist clinicians in considering empirically supported factors associated with future violence (Webster & Douglas, 2001). The measure uses historical risk factors (static factors) as well as current, future-oriented, and potentially changeable risk factors (dynamic factors). The HCR-20 has been studied in a variety of civil psychiatric, forensic psychiatric, and correctional populations, and there is a wealth of data supporting its reliability and predictive validity for violence outcomes (see Douglas, Blanchard, Guy, Reeves, & Weir, 2010). Version 3 was recently published (Douglas et al., 2013), but the current study was based on archived risk assessments conducted using on Version 2.
Schedule of imagined violence (Siv)
The SIV is an eight-item interview-based instrument with coded response categories designed to assess the quantity and quality of thoughts about harming others (Grisso et al., 2000). The full measure is administered only if the evaluee endorses the first item, which asks whether he has fantasies of hurting other people. As part of the MacArthur Violence Risk Assessment Study, Grisso et al. (2000) found 30% of participants from the clinical sample endorsed violent fantasies within the past 2 months (i.e., were SIV positive) at the baseline interview. Patients with higher symptom severity were significantly more likely to be SIV positive, as were patients who also had a substance abuse disorder. The MacArthur study found that violent thoughts as measured by the SIV were predictive of engaging in violent acts and were positively related to measures of psychopathy, anger, and impulsivity (Grisso et al., 2000). Based on those findings, the forensic hospital highlighted in the cur-rent article adopted the SIV into their violence risk assessment protocol. Thus, we opted to analyze the SIV data along with the available PCL-R, HCR-20, and NAS-PI data.
Four percent of the 230 patients in our sample (n = 9) were SIV positive during the assessment (i.e., they reported active thoughts or fantasies about violent acts). This number is significantly lower than the 30% rate reported by Grisso et al. (2000) in their sample of civil (nonforensic) psychiatric inpatients. Likely reasons for these differences are presented in the discussion below.
nAS-pi
The NAS-PI is a two-part, 85-item instrument that includes an assessment of the cogni-tive, physical, and behavioral experience of anger, as well as anger regulation and types of situations that may stimulate anger. The NAS-PI measures trait as opposed to state anger. That is, it is not intended to measure current angry affect; rather, it measures a person’s propensity to experience anger in everyday life. The NAS-PI includes a response style
at UNIV NEBRASKA LIBRARIES on April 16, 2015cjb.sagepub.comDownloaded from
Neal et al. / COMPREHENSIVE VIOLENCE RISK ASSESSMENT BATTERy 7
validity indicator and employs a paper-and-pencil self-report methodology (at a fourth-grade reading level). Internal reliability estimates in the NAS-PI standardization sample were .94 for the NAS Total Score and .95 for the PI, with estimates ranging between .76 and .89 for the subscales (Novaco, 2003). The measure took on average between 30 and 45 min to complete for each patient in this sample.
Although the NAS-PI was built into the violence risk assessment battery conducted by the clinicians at this forensic hospital, it was not always completed. In the 6-year period from which these data are drawn, NAS-PI was completed in 65.6% of the evaluations (n = 151).6 Of the 151 completed NAS-PI protocols, 126 were valid (83.4%). That is, the incon-sistency index was 4 or higher (Novaco, 2003) on 25 (16.6%) of the completed protocols, rendering them uninterpretable. In the analyses that include the NAS-PI, we only included the subsample of valid protocols.
reSultS
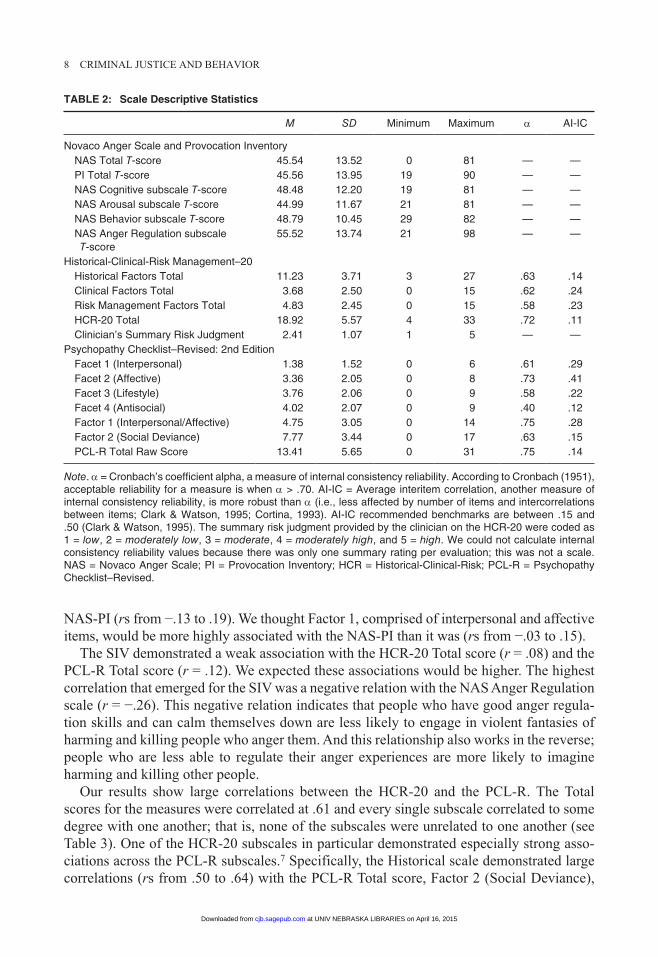
We used SPSS version 22.0 for all analyses. Please refer to Table 2 for descriptive statis-tics for the measures and for internal consistency reliability values for the PCL-R and HCR-20. Note that, consistent with our expectation, both measures evidenced somewhat lower reliability values in this “real-world” sample than is typically reported in research reports. We were able to calculate these values for the PCL-R and HCR-20 because we had access to individual item values. However, we had only scaled scores for the NAS-PI and thus could not report on its internal consistency reliability in this sample.
pAtternS oF CorrelAtionS
We set out to examine the relations between established measures of violence risk (HCR-20, PCL-R, SIV) and the NAS-PI. We used Cohen’s (1988) conventions to interpret effect sizes, where correlations of .10 indicated a weak association, .30 indicated a moderate asso-ciation, and .50 indicated a strong or large association. The patterns of correlations revealed that the NAS-PI had moderately weak associations with the HCR-20 (r = .16) and PCL-R total scores (r = .20). One subscale of the NAS-PI (Anger Regulation) was moderately cor-related with the SIV in a negative direction (r = −.26). Consistent with previous studies (e.g., Douglas, Vincent, & Edens, 2006), the HCR-20 and the PCL-R demonstrated a strong association (r = .61; see Table 3).
One subscale each from the HCR-20 and the PCL-R demonstrated stronger relations with the NAS-PI than the other subscales. Specifically, the Clinical scale of the HCR-20, which includes items assessing lack of insight, negative attitudes, active symptoms of men-tal illness, impulsivity, and unresponsiveness to treatment, demonstrated moderate associa-tions with four of the NAS-PI scales: the NAS Total score (r = .28), the Arousal scale (r = .28), the Behavior scale (r = .32), and the Regulation scale (r = −.29). The negative correla-tion between the Clinical HCR-20 scale and the NAS Anger Regulation scale suggests that as clinical symptoms increase, a person’s ability to regulate his anger effectively decreases (and vice versa). The HCR-20 Historical and Risk Management scales were generally weakly correlated with the NAS-PI (rs from .03 to .21).
Factor 2 of the PCL-R, which indexes socially deviant behaviors, demonstrated some association (rs between .20 and .24) with the NAS Total, Arousal, and Behavior scales. The other factors and facets of the PCL-R were generally at best weakly correlated with the
at UNIV NEBRASKA LIBRARIES on April 16, 2015cjb.sagepub.comDownloaded from
8 CRIMINAL JUSTICE AND BEHAVIOR
Table 2: Scale Descriptive Statistics
M SD Minimum Maximum α AI-IC
Novaco Anger Scale and Provocation Inventory NAS Total T-score 45.54 13.52 0 81 — — PI Total T-score 45.56 13.95 19 90 — — NAS Cognitive subscale T-score 48.48 12.20 19 81 — — NAS Arousal subscale T-score 44.99 11.67 21 81 — — NAS Behavior subscale T-score 48.79 10.45 29 82 — — NAS Anger Regulation subscale
T-score55.52 13.74 21 98 — —
Historical-Clinical-Risk Management–20 Historical Factors Total 11.23 3.71 3 27 .63 .14 Clinical Factors Total 3.68 2.50 0 15 .62 .24 Risk Management Factors Total 4.83 2.45 0 15 .58 .23 HCR-20 Total 18.92 5.57 4 33 .72 .11 Clinician’s Summary Risk Judgment 2.41 1.07 1 5 — —Psychopathy Checklist–Revised: 2nd Edition Facet 1 (Interpersonal) 1.38 1.52 0 6 .61 .29 Facet 2 (Affective) 3.36 2.05 0 8 .73 .41 Facet 3 (Lifestyle) 3.76 2.06 0 9 .58 .22 Facet 4 (Antisocial) 4.02 2.07 0 9 .40 .12 Factor 1 (Interpersonal/Affective) 4.75 3.05 0 14 .75 .28 Factor 2 (Social Deviance) 7.77 3.44 0 17 .63 .15 PCL-R Total Raw Score 13.41 5.65 0 31 .75 .14
Note. α = Cronbach’s coefficient alpha, a measure of internal consistency reliability. According to Cronbach (1951), acceptable reliability for a measure is when α > .70. AI-IC = Average interitem correlation, another measure of internal consistency reliability, is more robust than α (i.e., less affected by number of items and intercorrelations between items; Clark & Watson, 1995; Cortina, 1993). AI-IC recommended benchmarks are between .15 and .50 (Clark & Watson, 1995). The summary risk judgment provided by the clinician on the HCR-20 were coded as 1 = low, 2 = moderately low, 3 = moderate, 4 = moderately high, and 5 = high. We could not calculate internal consistency reliability values because there was only one summary rating per evaluation; this was not a scale. NAS = Novaco Anger Scale; PI = Provocation Inventory; HCR = Historical-Clinical-Risk; PCL-R = Psychopathy Checklist–Revised.
NAS-PI (rs from −.13 to .19). We thought Factor 1, comprised of interpersonal and affective items, would be more highly associated with the NAS-PI than it was (rs from −.03 to .15).
The SIV demonstrated a weak association with the HCR-20 Total score (r = .08) and the PCL-R Total score (r = .12). We expected these associations would be higher. The highest correlation that emerged for the SIV was a negative relation with the NAS Anger Regulation scale (r = −.26). This negative relation indicates that people who have good anger regula-tion skills and can calm themselves down are less likely to engage in violent fantasies of harming and killing people who anger them. And this relationship also works in the reverse; people who are less able to regulate their anger experiences are more likely to imagine harming and killing other people.
Our results show large correlations between the HCR-20 and the PCL-R. The Total scores for the measures were correlated at .61 and every single subscale correlated to some degree with one another; that is, none of the subscales were unrelated to one another (see Table 3). One of the HCR-20 subscales in particular demonstrated especially strong asso-ciations across the PCL-R subscales.7 Specifically, the Historical scale demonstrated large correlations (rs from .50 to .64) with the PCL-R Total score, Factor 2 (Social Deviance),
at UNIV NEBRASKA LIBRARIES on April 16, 2015cjb.sagepub.comDownloaded from

9
Ta
bl
e 3
: b
ivar
iate
Co
rrel
atio
ns
Wit
hin
an
d b
etw
een
Mea
sure
s
PI
NA
SH
CR
-20
PC
L-R
SIV
T
otal
Cog
Aro
Beh
Reg
Tot
alH
CR
Tot
alF
acto
r 1
Fac
tor
2F
acet
1F
acet
2F
acet
3F
acet
4P
os
NA
S T
otal
.49
.73
.75
.68
−.1
0.1
6.1
0.2
8.1
6.2
0.0
6.2
0−
.02
.11
.18
.11
.06
PI T
otal
.57
.56
.57
−.0
7.0
8.1
1.1
3.0
6.1
9.1
5.1
3.0
8.1
6.0
3.1
3.0
7C
og.7
9.7
9−
.12
.20
.09
.18
.21
.19
.07
.19
.05
.10
.15
.11
.02
Aro
.80
−.1
8.2
0.1
5.2
8.1
7.2
0.0
3.2
4.0
6.0
8.1
7.1
7.0
8B
eh−
.15
.19
.18
.32
.14
.23
.13
.20
.09
.19
.19
.12
.03
Reg
.01
.04
−.2
9.0
3−
.02
−.0
3−
.04
.07
−.1
3−
.07
.08
−.2
6H
CR
-20
Tot
al.3
9.2
2.6
5.6
1.4
2.5
5.4
6.2
9.4
5.4
5.0
8H
.43
.21
.63
.40
.64
.50
.23
.51
.54
.04
C.2
9.3
1.3
0.2
7.1
2.3
6.2
7.1
7.0
2R
.35
.22
.35
.22
.17
.37
.20
.03
PC
L-R
Tot
al.7
8.8
4.7
4.6
2.6
3.7
5.1
2F
acto
r 1
.37
.78
.90
.22
.38
.02
Fac
tor
2.4
6.2
1.8
2.8
2.1
5F
acet
1.4
5.2
8.4
8.1
0F
acet
2.1
2.2
2−
.04
Fac
et 3
.34
.15
Fac
et 4
.10
Not
e. P
I =
Pro
voca
tion
Inve
ntor
y; N
AS
= N
ovac
o A
nger
Sca
le;
HC
R =
His
toric
al-C
linic
al-R
isk;
PC
L-R
= P
sych
opat
hy C
heck
list–
Rev
ised
; S
IV =
Sch
edul
e of
Im
agin
ed
Vio
lenc
e; C
og =
Cog
nitiv
e su
bsca
le;
Aro
= A
rous
al s
ubsc
ale;
Beh
= B
ehav
ior
subs
cale
; R
eg =
Reg
ulat
ion
subs
cale
; H
= H
isto
rical
sec
tion
of t
he H
CR
-20;
C =
Clin
ical
se
ctio
n; R
= R
isk
Man
agem
ent s
ectio
n; P
os =
pos
itive
end
orse
men
t of S
ched
uled
of I
mag
ined
Vio
lenc
e.
at UNIV NEBRASKA LIBRARIES on April 16, 2015cjb.sagepub.comDownloaded from
10 CRIMINAL JUSTICE AND BEHAVIOR
Facet 1 (Interpersonal), Facet 3 (Lifestyle), and Facet 4 (Antisocial). The Historical scale includes static items from a person’s history that are similarly measured by the PCL-R, such as relationship instability, violence at a young age, and prior supervision or conditional release failure. Thus, it might be expected that the Historical scale would demonstrate the strongest associations with the PCL-R.
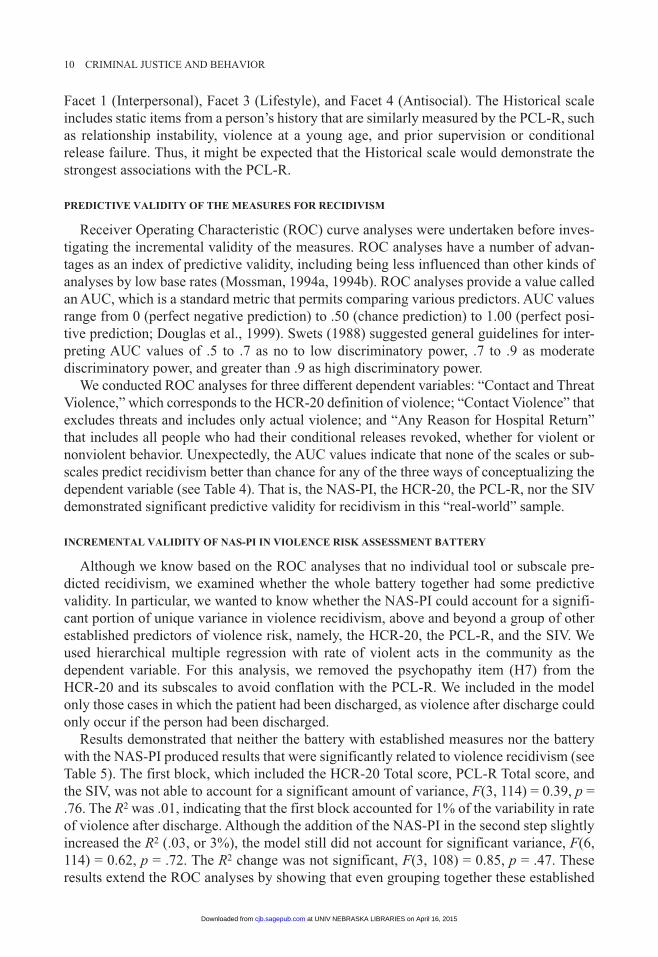
prediCtive vAlidity oF the meASureS For reCidiviSm
Receiver Operating Characteristic (ROC) curve analyses were undertaken before inves-tigating the incremental validity of the measures. ROC analyses have a number of advan-tages as an index of predictive validity, including being less influenced than other kinds of analyses by low base rates (Mossman, 1994a, 1994b). ROC analyses provide a value called an AUC, which is a standard metric that permits comparing various predictors. AUC values range from 0 (perfect negative prediction) to .50 (chance prediction) to 1.00 (perfect posi-tive prediction; Douglas et al., 1999). Swets (1988) suggested general guidelines for inter-preting AUC values of .5 to .7 as no to low discriminatory power, .7 to .9 as moderate discriminatory power, and greater than .9 as high discriminatory power.
We conducted ROC analyses for three different dependent variables: “Contact and Threat Violence,” which corresponds to the HCR-20 definition of violence; “Contact Violence” that excludes threats and includes only actual violence; and “Any Reason for Hospital Return” that includes all people who had their conditional releases revoked, whether for violent or nonviolent behavior. Unexpectedly, the AUC values indicate that none of the scales or sub-scales predict recidivism better than chance for any of the three ways of conceptualizing the dependent variable (see Table 4). That is, the NAS-PI, the HCR-20, the PCL-R, nor the SIV demonstrated significant predictive validity for recidivism in this “real-world” sample.
inCrementAl vAlidity oF nAS-pi in violenCe riSk ASSeSSment BAttery
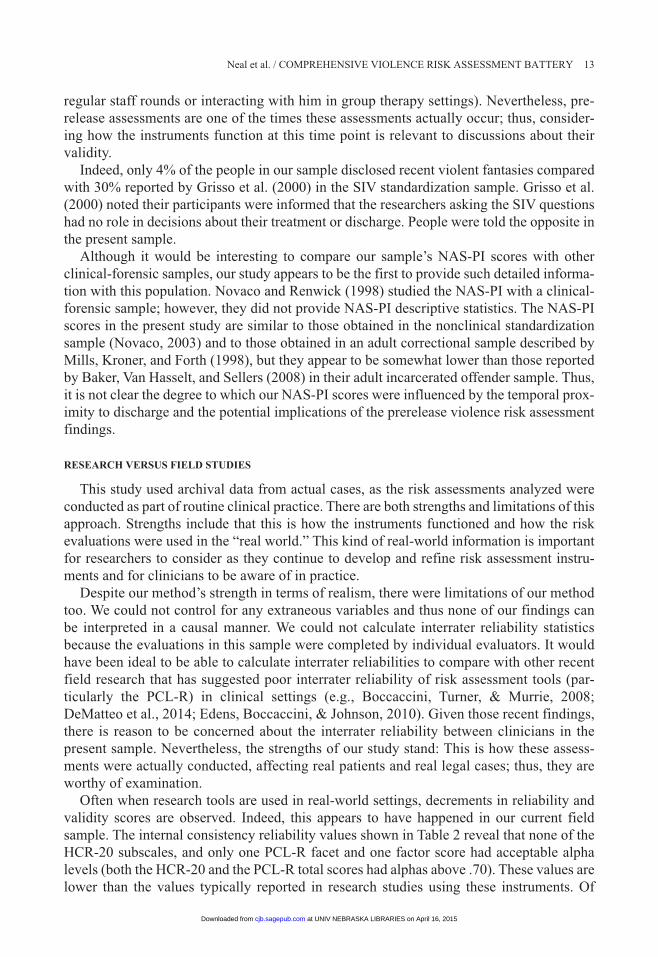
Although we know based on the ROC analyses that no individual tool or subscale pre-dicted recidivism, we examined whether the whole battery together had some predictive validity. In particular, we wanted to know whether the NAS-PI could account for a signifi-cant portion of unique variance in violence recidivism, above and beyond a group of other established predictors of violence risk, namely, the HCR-20, the PCL-R, and the SIV. We used hierarchical multiple regression with rate of violent acts in the community as the dependent variable. For this analysis, we removed the psychopathy item (H7) from the HCR-20 and its subscales to avoid conflation with the PCL-R. We included in the model only those cases in which the patient had been discharged, as violence after discharge could only occur if the person had been discharged.
Results demonstrated that neither the battery with established measures nor the battery with the NAS-PI produced results that were significantly related to violence recidivism (see Table 5). The first block, which included the HCR-20 Total score, PCL-R Total score, and the SIV, was not able to account for a significant amount of variance, F(3, 114) = 0.39, p = .76. The R2 was .01, indicating that the first block accounted for 1% of the variability in rate of violence after discharge. Although the addition of the NAS-PI in the second step slightly increased the R2 (.03, or 3%), the model still did not account for significant variance, F(6, 114) = 0.62, p = .72. The R2 change was not significant, F(3, 108) = 0.85, p = .47. These results extend the ROC analyses by showing that even grouping together these established
at UNIV NEBRASKA LIBRARIES on April 16, 2015cjb.sagepub.comDownloaded from

Neal et al. / COMPREHENSIVE VIOLENCE RISK ASSESSMENT BATTERy 11
measures of violence risk (HCR-20, PCL-R, SIV) with the NAS-PI could not account for violent recidivism in this sample.
diSCuSSion
This study set out to examine the performance of various violence risk assessment tools in the field. Our data came from actual assessment instruments rated by real-world clinicians in real-world circumstances over a 6-year period. We also wanted to add to the literature regard-ing the measurement of anger in violence risk assessments and to identify the incremental validity of the NAS-PI as one part of a violence risk assessment battery. We thought the addi-tion of the NAS-PI would yield incremental validity because it measured a different trait (anger) and relied on a different method (self-report by paper-and-pencil) than other instru-ments used in this hospital’s violence risk assessment battery (see Campbell & Fiske, 1959).
We wanted to determine whether including the NAS-PI in the battery was worth the time and effort expended. The answer is not clear due to the broad null predictive validity find-ings. We expected the established violence risk tools (the HCR-20, the PCL-R, and the SIV)
Table 4: ROC analyses for Three Dependent Variables
Contact and Threat Violence Contact ViolenceAny Reason for Hospital
Return
n = 19 n = 11 n = 35
AUC SE 95% CI AUC SE 95% CI AUC SE 95% CI
NAS Total .45 .06 [.33, .58] .43 .09 [.25, .62] .44 .05 [.34, .55]PI Total .50 .07 [.37, .63] .42 .09 [.24, .60] .47 .06 [.35, .58]Cog .42 .07 [.29, .54] .41 .09 [.23, .59] .49 .06 [.37, .61]Aro .41 .07 [.28, .53] .39 .09 [.20, .57] .43 .06 [.32, .55]Beh .46 .06 [.34, .59] .43 .09 [.25, .61] .43 .06 [.31, .54]Reg .45 .07 [.31, .59] .40 .09 [.22, .58] .40 .06 [.29, .52]HCR-20 Total .43 .06 [.31, .54] .44 .07 [.31, .57] .52 .05 [.42, .62]H .46 .06 [.34, .57] .48 .07 [.34, .63] .53 .05 [.43, .63]C .42 .06 [.30, .55] .41 .07 [.27, .54] .42 .05 [.33, .51]R .38 .05 [.28, .48] .43 .07 [.30, .57] .49 .05 [.39, .58]Summary .44 .07 [.31, .58] .47 .09 [.28, .65] .51 .05 [.42, .62]PCL-R Total .47 .06 [.34, .59] .48 .07 [.33, .62] .49 .05 [.39, .60]Factor 1 .45 .07 [.32, .59] .49 .08 [.32, .65] .46 .06 [.35, .57]Factor 2 .45 .06 [.33, .57] .42 .07 [.28, .55] .50 .05 [.40, .61]Facet 1 .49 .06 [.37, .62] .50 .08 [.34, .66] .51 .05 [.41, .61]Facet 2 .42 .07 [.29, .56] .48 .08 [.32, .64] .44 .06 [.33, .55]Facet 3 .39 .06 [.27, .51] .38 .07 [.24, .52] .46 .05 [.36, .56]Facet 4 .56 .06 [.44, .68] .56 .08 [.40, .71] .57 .05 [.47, .67]SIV+ .55 .07 [.42, .68] .52 .09 [.35, .70] .49 .05 [.39, .56]
Note. ROC = Receiver Operating Characteristic; AUC = Area Under the Curve; SE = standard error; CI = confidence interval; NAS = Novaco Anger Scale; PI = Provocation Inventory; Cog = Cognitive subscale; Aro = Arousal subscale; Beh = Behavior subscale; Reg = Regulation subscale; H = Historical section of the HCR-20; C = Clinical section; R = Risk Management section; PCL-R = Psychopathy Checklist–Revised; SIV = Schedule of Imagined Violence. SIV+ = positive endorsement of Scheduled of Imagined Violence. “Summary” refers to the summary risk judgment provided by the clinician on the HCR-20. These values were coded as 1 = low, 2 = moderately low, 3 = moderate, 4 = moderately high, and 5 = high.
at UNIV NEBRASKA LIBRARIES on April 16, 2015cjb.sagepub.comDownloaded from

12 CRIMINAL JUSTICE AND BEHAVIOR
would have predictive validity for violent reoffending and set out to determine whether the NAS-PI could be useful on top of those effects. However, we found that none of the tools had predictive validity in this field sample. Thus, before we make any conclusions about whether including the NAS-PI as part of a prerelease risk assessment battery is empirically justified, further research is needed, particularly in field samples. We now turn to three potential explanations for our null findings, including (a) timing of the assessments, (b) research versus field studies, and (c) recidivism base rates.
timing
Perhaps the most likely reason for the null findings is the fact that these assessments were conducted by clinicians before release to inform the release decision and identify high-risk patients in need of risk management services. That is, the results of the risk assessment likely created a pre- and postrelease management effect. The clinical task of risk assessment is to use the tools to manage and prevent risk, not just to predict it (Douglas & Skeem, 2005; Hart, 1998). Thus, patients assessed as being at higher risk for violence would be less likely to be released or subjected to more intensive and assertive community interventions, para-doxically rendering the clinical judgments successful from a clinical (risk management) perspective while simultaneously inaccurate from a research (or violence prediction) per-spective (see Hart, 1998).
A related explanation for the null findings is the timing of the evaluations after a period of treatment, with the potential of the evaluation to end the hospitalization period. These violence risk assessments were conducted when patients were being considered for release after having been treated in the hospital for varying lengths of time. Patients knew they were being considered for release and many may have realized that if their true reports were damaging, it could interfere with a swift discharge process. The self-report measures in particular (the NAS-PI and the SIV) may have been sensitive to a guarded response bias, and the clinical and risk management items could have been affected (especially if the clinician doing the assessment knew the patient over time, such as hearing about him in
Table 5: Hierarchical Multiple linear Regression for Rate of Violence Recidivism
Step 1 r β t p
Constant — — 1.55 .13 HCR-20 Total −.09 −.07 −0.52 .60 PCL-R Total −.08 −.04 −0.27 .79 SIV Positive −.03 −.03 −0.35 .73Step 2 Constant — — 0.26 .80 HCR-20 Totala −.09 −.04 −0.31 .76 PCL-R Total −.08 −.05 −0.36 .72 SIV positive −.03 −.01 −0.04 .97 NAS Total −.09 −.12 −0.93 .35 NAS Regulation .12 .10 1.04 .30 PI Total .02 .12 0.98 .33
Note. All reported beta weights are standardized coefficients. The rs represent zero-order correlations. HCR = Historical-Clinical-Risk; PCL-R = Psychopathy Checklist–Revised; SIV = Schedule of Imagined Violence; NAS = Novaco Anger Scale; PI = Provocation Inventory.aDoes not include Item 7.
at UNIV NEBRASKA LIBRARIES on April 16, 2015cjb.sagepub.comDownloaded from
Neal et al. / COMPREHENSIVE VIOLENCE RISK ASSESSMENT BATTERy 13
regular staff rounds or interacting with him in group therapy settings). Nevertheless, pre-release assessments are one of the times these assessments actually occur; thus, consider-ing how the instruments function at this time point is relevant to discussions about their validity.
Indeed, only 4% of the people in our sample disclosed recent violent fantasies compared with 30% reported by Grisso et al. (2000) in the SIV standardization sample. Grisso et al. (2000) noted their participants were informed that the researchers asking the SIV questions had no role in decisions about their treatment or discharge. People were told the opposite in the present sample.
Although it would be interesting to compare our sample’s NAS-PI scores with other clinical-forensic samples, our study appears to be the first to provide such detailed informa-tion with this population. Novaco and Renwick (1998) studied the NAS-PI with a clinical-forensic sample; however, they did not provide NAS-PI descriptive statistics. The NAS-PI scores in the present study are similar to those obtained in the nonclinical standardization sample (Novaco, 2003) and to those obtained in an adult correctional sample described by Mills, Kroner, and Forth (1998), but they appear to be somewhat lower than those reported by Baker, Van Hasselt, and Sellers (2008) in their adult incarcerated offender sample. Thus, it is not clear the degree to which our NAS-PI scores were influenced by the temporal prox-imity to discharge and the potential implications of the prerelease violence risk assessment findings.
reSeArCh verSuS Field StudieS
This study used archival data from actual cases, as the risk assessments analyzed were conducted as part of routine clinical practice. There are both strengths and limitations of this approach. Strengths include that this is how the instruments functioned and how the risk evaluations were used in the “real world.” This kind of real-world information is important for researchers to consider as they continue to develop and refine risk assessment instru-ments and for clinicians to be aware of in practice.
Despite our method’s strength in terms of realism, there were limitations of our method too. We could not control for any extraneous variables and thus none of our findings can be interpreted in a causal manner. We could not calculate interrater reliability statistics because the evaluations in this sample were completed by individual evaluators. It would have been ideal to be able to calculate interrater reliabilities to compare with other recent field research that has suggested poor interrater reliability of risk assessment tools (par-ticularly the PCL-R) in clinical settings (e.g., Boccaccini, Turner, & Murrie, 2008; DeMatteo et al., 2014; Edens, Boccaccini, & Johnson, 2010). Given those recent findings, there is reason to be concerned about the interrater reliability between clinicians in the present sample. Nevertheless, the strengths of our study stand: This is how these assess-ments were actually conducted, affecting real patients and real legal cases; thus, they are worthy of examination.
Often when research tools are used in real-world settings, decrements in reliability and validity scores are observed. Indeed, this appears to have happened in our current field sample. The internal consistency reliability values shown in Table 2 reveal that none of the HCR-20 subscales, and only one PCL-R facet and one factor score had acceptable alpha levels (both the HCR-20 and the PCL-R total scores had alphas above .70). These values are lower than the values typically reported in research studies using these instruments. Of
at UNIV NEBRASKA LIBRARIES on April 16, 2015cjb.sagepub.comDownloaded from

14 CRIMINAL JUSTICE AND BEHAVIOR
course, lower internal reliability values indicate more error, more “noise” in the data, and correspondingly make it more difficult to detect actual relations in data. Therefore, the lower reliability ratings of the scales in this field sample may also have contributed to our null findings. Nevertheless, given that these tools are designed to be used in field settings just like the one we examined, these data are important.
reCidiviSm BASe rAte
The accuracy of our recidivism data is limited by reliance on available archival data in official sources. First, searching the state criminal record system posed challenges in iden-tifying sought individuals—a problem not unique to our study. Missing birthdates, incorrect spellings of names, inconsistent use of middle initials, inconsistent use of nicknames, and so forth in the criminal record system likely affected the accuracy of the criminal recidivism data. Second, although we searched two sources for recidivism information (criminal record and the hospital’s readmission records), violent behavior not captured in these official records was missed. Furthermore, arrests that occurred in other states and psychiatric admis-sions to other hospitals also were not captured.
Studies modeled after the MacArthur Violence Risk Assessment Study have included more sources of information about violent recidivism, such as self-report and interviews with collateral sources. In those studies (e.g., Doyle et al., 2012; Grisso et al., 2000; Steadman et al., 2000), using the additional sources of information modestly increased the measured base rate of violence and increased the statistical power of their analyses. Although we did not have the resources to obtain these additional sources of information for our study, the base rate of violence after discharge in our sample was 15.4%—similar to the 18.7% base rate reported in the MacArthur Study (Steadman et al., 2000). Studying a low-base rate event with our sample size (N = 230) may have posed statistical power challenges for detecting relations. Future studies should employ larger samples and use additional, varied methods of collecting follow-up violence recidivism data.
ConCluSion
This study adds to the literature by providing data concerning how various tools used in violence risk assessments perform in the real world. It also adds to the growing body of literature about the NAS-PI, contributing information about how the measure functions in a clinical-forensic sample. This information is particularly useful given that we examined it in routine clinical practice as opposed to in a structured research paradigm. Although the patterns of correlations emerged in ways that were generally consistent with expectations, the predictive validity analyses failed. This suggests that none of these tools, separately or together as part of a battery, could predict recidivism better than chance in our field sam-ple. These null findings stand in contrast to a large body of literature documenting the reliability and validity of the HCR-20, PCL-R, and SIV in violence risk assessments. Thus, our results must be interpreted within the context of this larger body of research.
We provided three possible explanations for our findings. First, the risk assessments were conducted as a clinical risk management evaluation rather than for research and risk predic-tion, and thus higher risk patients may have received additional treatment to reduce their risk. In addition, our field study had lower internal consistency reliability ratings for the tools than
at UNIV NEBRASKA LIBRARIES on April 16, 2015cjb.sagepub.comDownloaded from

Neal et al. / COMPREHENSIVE VIOLENCE RISK ASSESSMENT BATTERy 15
typical research studies, a common problem when tools are used in the “real world” as com-pared with in highly controlled research studies. We also think the timing of the assessments is especially relevant. These evaluations were conducted just prior to release for these patients, who knew they were about to be released, especially if their assessments went well. This circumstance is typical in clinical settings but different than what typically occurs in controlled research studies examining the performance of these tools. We conclude that addi-tional examination of the field validity of established violence risk assessment measures in prerelease assessment contexts is needed.
AuthorS’ note
Sarah L. Miller is now in independent forensic practice in Maine. This research was supported in part by the American Psychology–Law Society (AP-LS) Grant-In-Aid program, and the first author was supported in part by a National Science Foundation (NSF) Interdisciplinary Postdoctoral Fellowship (SES 1228559) during the writing of this article. Any opinions, findings, conclusions, or recommendations expressed in this article are those of the authors and do not necessarily reflect those of AP-LS or NSF. Portions of these results were pre-sented at the 2013 annual AP-LS conference in Portland, OR.
ACknoWledgmentS
Special thanks are owed to John Toppins, Director of Psychology at Taylor Hardin Secure Medical Facility for his support and behind-the-scenes work on this project. Thanks also to Barbara Tidmore and Christina Gardner at Taylor Hardin Secure Medical Facility for helping us find the information compiled in this study, and to Thomas Grisso at the University of Massachusetts Medical School and Kevin Douglas at Simon Frasier University for their insightful comments.
noteS
1. Even in the MacArthur Violence Risk Assessment Study—arguably the “gold standard” of violence risk assessment research studies—the predictive validity of the Iterative Classification Tree model of violence risk prediction decreased sub-stantially on a cross-validation sample as compared with the development sample (i.e., the Area Under the Curve decreased from .80 in the development sample to .63 in the cross-validation sample; Monahan et al., 2000; Monahan et al., 2005, respectively).
2. In this write-up, we conformed to the Risk Assessment Guidelines for the Evaluation of Efficacy (RAGEE guidelines) by providing specific information about this violence risk assessment study to add to the literature (see, for example, Singh, yang, Mulvey, & The RAGEE Group, 2014). The RAGEE guidelines were developed to increase transparency and consis-tency in the methodological reporting of predictive validity studies of violence risk assessments.
3. Although we examined events that happened in the past, our design allowed us to examine the predictive validity of archival data. This is because all of the assessments and measures were completed in the past, prior to the patients’ hospital release—They were completed as prospective violence risk assessment batteries/reports. years after these real-world prospec-tive assessments were conducted, we looked at how well they were able to assess the risk of future violence that happened after the assessments were completed. Thus, this is not a postdictive validity study because we did not conduct the risk assess-ment “after the fact,” or test later in an attempt to get a valid score for something that happened earlier. The assessments hap-pened prior to the outcomes of interest. We simply coded the archival data.
4. Many of the patients in our sample were conditionally released with a court order that imposed conditions on the patients’ behavior to remain in the community (e.g., in group home settings, at home with or without family members). Others were discharged without court-ordered conditional releases to a less restrictive setting within the department of mental health (i.e., a state psychiatric hospital). A few were discharged to the community unconditionally.
5. This variable was calculated to reflect time in the community. If the person remained in the community throughout the duration of the follow-up period, his time “counted” until the day we gathered the follow-up data (in July 2011). If the person returned to the hospital, his time “stopped” on the day of his return.
6. Reasons for nonattempts or invalid attempts at administering the NAS-PI included descriptions of evaluees with cogni-tive or communication disabilities that interfered with the task, evaluees who responded in a fixed manner to virtually all of the items, and evaluees who were distracted or otherwise unable to concentrate on the task.
7. Although this is a strong correlation, the measures are still providing unique, nonoverlapping information. With a cor-relation of.61, their shared variance is 37%.
at UNIV NEBRASKA LIBRARIES on April 16, 2015cjb.sagepub.comDownloaded from

16 CRIMINAL JUSTICE AND BEHAVIOR
reFerenCeS
Appelbaum, P. S. (1994). Almost a revolution: Mental health law and the limits of change. New york, Ny: Oxford University Press.
Baker, M. T., Van Hasselt, V. B., & Sellers, A. H. (2008). Validation of the Novaco Anger Scale in an incarcerated offender population. Criminal Justice and Behavior, 35, 741-754. doi:10.1177/0093854808316275
Barefoot v. Estelle, 463 U.S. 880 (1983).Baxstrom v. Herold, 383 U.S. 107 (1966).Boccaccini, M. T., Turner, D. B., & Murrie, D. C. (2008). Do some evaluators report consistently higher or lower PCL-R
scores than others? Findings from a statewide sample of sexually violent predator evaluations. Psychology, Public Policy, and Law, 14, 262-283. doi:10.1037/a0014523
Campbell, D. T., & Fiske, D. W. (1959). Convergent and discriminant validation by the multitrait-multimethod matrix. Psychological Bulletin, 56, 81-105.
Clark, L., & Watson, D. (1995). Constructing validity: Basic issues in objective scale development. Psychological Assessment, 7, 309-319. doi:10.1037/1040-3590.7.3.309
Cohen, J. (1988). Statistical power analysis for the behavioral sciences (2nd ed.). Hillsdale, NJ: Lawrence Erlbaum.Cortina, J. M. (1993). What is coefficient alpha? An examination of theory and applications. Journal of Applied Psychology,
78, 98-104. doi:10.1037/0021-9010.78.1.98Craig, T. J. (1982). An epidemiological study of problems associated with violence among psychiatric in-patients. American
Journal of Psychiatry, 139, 1262-1266.Cronbach, L. J. (1951). Coefficient alpha and the internal structure of tests. Psychometrika, 16, 297-334. doi:10.1007/BF02310555DeMatteo, D., Edens, J. F., Galloway, M., Cox, J., Toney Smith, S., & Formon, D. (2014). The role and reliability of the
Psychopathy Checklist—Revised in US sexually violent predator evaluations: A case law survey. Law and Human Behavior, 38, 248-255. doi:10.1037/lhb0000059
Douglas, K. S., Blanchard, A., Guy, L. S., Reeves, K., & Weir, J. (2010). HCR-20 violence risk assessment scheme: Overview and annotated bibliography (HCR-20 Violence Risk Assessment White Paper Series. #1). Burnaby, British Columbia, Canada: Mental Health, Law, and Policy Institute, Simon Fraser University.
Douglas, K. S., Hart, S. D., Webster, C. D., & Belfrage, H. (2013). HCR-20V3: Assessing risk of violence—User guide. Burnaby, British Columbia, Canada: Mental Health, Law, and Policy Institute, Simon Fraser University.
Douglas, K. S., Ogloff, J. R., Nicholls, T. L., & Grant, I. (1999). Assessing risk for violence among psychiatric patients: The HCR-20 violence risk assessment scheme and the Psychopathy Checklist: Screening Version. Journal of Consulting and Clinical Psychology, 67, 917-930. doi:10.1037/0022-006X.67.6.917
Douglas, K. S., & Skeem, J. L. (2005). Violence risk assessment: Getting specific about being dynamic. Psychology, Public Policy, and Law, 11, 347-383. doi:10.1037/1076-8971.11.3.347
Douglas, K. S., Vincent, G. M., & Edens, J. F. (2006). Risk for criminal recidivism: The role of psychopathy. In C. Patrick (Ed.), Handbook of psychopathy (pp. 533-554). New york, Ny: Guilford Press.
Doyle, M., Carter, S., Shaw, J., & Dolan, M. (2012). Predicting community violence from patients discharged from acute mental health units in England. Social Psychiatry & Psychiatric Epidemiology, 47, 627-637.
Doyle, M., & Dolan, M. (2006a). Evaluating the validity of anger regulation problems, interpersonal style, and disturbed mental state for predicting inpatient violence. Behavioral Sciences & the Law, 24, 783-798. doi:10.1002/bsl.739
Doyle, M., & Dolan, M. (2006b). Predicting community violence from patients discharged from mental health services. British Journal of Psychiatry, 189, 520-526. doi:10.1192/bjp.bp.105.021204
Edens, J. F., Boccaccini, M. T., & Johnson, D. W. (2010). Inter-rater reliability of the PCL-R total and factor scores among psychopathic sex offenders: Are personality features more prone to disagreement than behavioral features? Behavioral Sciences & the Law, 28, 106-119. doi:10.1002/bsl.918
Faust, D., & Ahern, D. C. (2012). Clinical judgment and prediction. In D. Faust (Ed.), Coping with psychiatric and psycho-logical testimony (6th ed., pp. 147-208). New york, Ny: Oxford University Press.
Grisso, T., Davis, J., Vesselinov, R., Appelbaum, P. S., & Monahan, J. (2000). Violent thoughts and violent behavior follow-ing hospitalization for mental disorder. Journal of Consulting and Clinical Psychology, 3, 388-398. doi:10.1037/0022-006X.68.3.388
Haddock, G., Barrowclough, C., Shaw, J., Dunn, G., Novaco, R., & Tarrier, N. (2009). Cognitive-behavioural therapy v. social activity therapy for people with psychosis and a history of violence: Randomized controlled trial. The British Journal of Psychiatry, 194, 152-157. doi:10.1192/bjp.bp.107.039859
Hare, R. D. (2003). The Hare Psychopathy Checklist-Revised technical manual (2nd ed.). Toronto, Ontario, Canada: Multi-Health Systems.
Harris, G. T., Rice, M. E., & Quinsey, V. L. (1993). Violent recidivism of mentally disordered offenders: The development of a statistical prediction instrument. Criminal Justice and Behavior, 20, 315-335. doi:10.1177/0093854893020004001
Hart, S. D. (1998). The role of psychopathy in assessing risk for violence: Conceptual and methodological issues. Legal and Criminological Psychology, 3, 121-137. doi:10.1111/j.2044-8333.1998.tb00354.x
Kahneman, D. (2011). Thinking, fast and slow. New york, Ny: Farrar, Straus and Giroux.
at UNIV NEBRASKA LIBRARIES on April 16, 2015cjb.sagepub.comDownloaded from

Neal et al. / COMPREHENSIVE VIOLENCE RISK ASSESSMENT BATTERy 17
McDermott, B. E., Quanbeck, C. D., Busse, D., yastro, K., & Scott, C. L. (2008). The accuracy of risk assessment instruments in the prediction of impulsive versus predatory aggression. Behavioral Sciences & the Law, 26, 759-777. doi:10.1002/bsl.842
Mills, J. F., Kroner, D. G., & Forth, A. E. (1998). Novaco Anger Scale: Reliability and validity within an adult criminal sample. Assessment, 5, 237-248. doi:10.1177/107319119800500304
Monahan, J. (1981). The clinical prediction of violent behavior. Rockville, MD: U.S. Department of Health and Human Services.
Monahan, J., Steadman, H. J., Appelbaum, P., Robbins, Mulvey, E. P., Silver, E., . . . Grisso, T. (2000). Developing a clinically useful actuarial tool for assessing violence risk. The British Journal of Psychiatry, 176, 312-319. doi:10.1192/bjp.176.4.312
Monahan, J., Steadman, H. J., Robbins, P. D., Appelbaum, P., Banks, S., Grisso, T., . . . Silver, E. (2005). An actuarial model of violence risk assessment for persons with mental disorder. Psychiatric Services, 56, 810-815. doi:10.1176/appi.ps.56.7.810
Monahan, J., Steadman, H. J., Silver, E., Appelbaum, P. S., Robbins, P. C., Mulvey, E. P., . . . Banks, S. (2001). Rethinking risk assessment: The MacArthur study of mental disorder and violence. Oxford, UK: Oxford University.
Mossman, D. (1994a). Assessing predictions of violence: Being accurate about accuracy. Journal of Consulting and Clinical Psychology, 62, 783-792.
Mossman, D. (1994b). Further comments on portraying the accuracy of violence predictions. Law and Human Behavior, 18, 587-594.
Novaco, R. W. (2003). The Novaco Anger Scale and Provocation Inventory Manual. Los Angeles, CA: Western Psychological Services.
Novaco, R. W., & Jarvis, K. J. (2002). Brief cognitive behavioral intervention for anger. In F. W. Bond & W. Dryen (Eds.), Handbook of brief cognitive behavioral therapy (pp. 77-100). Hoboken, NJ: John Wiley.
Novaco, R. W., & Renwick, S. J. (1998). Anger predictors of the assaultiveness of forensic hospital patients. In E. Sanavio (Ed.), Behavior and cognitive therapy today: Essays in honor of Hans J. Eysenck (pp. 199-208). Oxford, UK: Elsevier Science.
O’Connor v. Donaldson, 422 U.S. 563, 95 S. Ct 2485 (1975)Singh, J. P., yang, S., Mulvey, E. P, & The RAGEE Group. (2014). Reporting standards for risk assessment predictive
validity studies: The Risk Assessment Guidelines for the Evaluation of Efficacy (RAGEE) Statement. Law & Human Behavior. Advance online publication. Retrieved from http://dx.doi.org/10.1037/lhb0000090
Skeem, J. L., Schubert, C., Odgers, C., Mulvey, E. P., Gardner, W., & Lidz, C. (2006). Psychiatric symptoms and community violence among high-risk patients: A test of the relationship at the weekly level. Journal of Consulting and Clinical Psychology, 74, 967-979. doi:10.1037/0022-006X.74.5.967
Steadman, H. J., & Cocozza, J. J. (1974). Some refinements in the measurement and prediction of dangerous behavior. American Journal of Psychiatry, 131, 1012-1014.
Steadman, H. J., Silver, E., Monahan, J., Appelbaum, P. S., Robbins, P. C., Mulvey, E. P., . . . Banks, S. (2000). A classifica-tion tree approach to the development of actuarial violence risk assessment tools. Law and Human Behavior, 24, 83-100. doi:10.1023/A:1005478820425
Swets, J. A. (1988). Measuring the accuracy of diagnostic systems. Science, 240, 1285-1293.Walters, G. D. (2006). Risk-appraisal versus self-report in the prediction of criminal justice outcomes: A meta-analysis.
Criminal Justice and Behavior, 33, 279-304. doi:10.1177/0093854805284409Webster, C. D., & Douglas, K. D. (2001). Purpose of the companion guide. In K. D. Douglas, C. D. Webster, S. D. Hart, D.
Eaves, & J. R. P. Ogloff (Eds.), HCR-20 violence risk management companion guide (pp. 1-12). Vancouver, British Columbia: Mental Health, Law, and Policy Institute, Simon Fraser University.
tess m.S. neal, PhD, is an assistant professor of psychology in the Interdisciplinary College of Arts and Sciences at Arizona State University. She obtained her PhD in clinical psychology at the University of Alabama before completing a clinical-forensic postdoctoral residency at the University of Massachusetts Medical School and a National Science Foundation inter-disciplinary postdoctoral research fellowship at the University of Nebraska Public Policy Center. Her research interests focus on clinical and legal decision making.
Sarah l. miller, PhD, ABPP, is a board-certified forensic psychologist working in independent practice. She also works as a supervising psychologist for Correct Care Solutions in the Maine Department of Corrections.
r. Clayton Shealy, PhD, is an associate clinical professor and the director of the Psychology Clinic at the University of Alabama. His interests include ethics, psychotherapy, and psychological assessment.
at UNIV NEBRASKA LIBRARIES on April 16, 2015cjb.sagepub.comDownloaded from