a financially feasible plan for equal access to early …2).pdf · a financially feasible plan for...
TRANSCRIPT

A financially feasible plan for equal access to Early Childhood Programs in the Republic of Macedonia
fair play
fair p
layA
finan
cial
ly fe
asib
le p
lan
for e
qual
acc
ess
to E
arly
Chi
ldho
od P
rogr
ams
in th
e Re
publ
ic o
f Mac
edon
ia
CIP - Каталогизација во публикацијаНационална и универзитетска библиотека “Св. Климент Охридски”, Скопје
373.2(497.7)
RAVENS, Jan vanFair Play / Jan van Ravens. - Skopje : Ministry of Labour and Social
Policy, 2010. - 106 стр. : табели, граф. прикази ; 29 цм
фусноти кон текстот. - Библиографија: стр. 97-100
ISBN 978-608-4595-14-4
а) Предучилишно воспитание и образование - Македонија
COBISS.MK-ID 85100042
1
By Jan van Ravens, consultant,
[email protected] 2010
This publication has been prepared with technical and financial support by the United Nations Children’s Fund (UNICEF).
A financially feasible plan for equal access to Early Childhood Programs in the Republic of Macedonia
fair play

2

3
Contents
Executive Summary .................................................................... 5
Acknowledgements ................................................................... 11
Acronyms.................................................................................. 13
Lists of Tables and Figures ....................................................... 15
Introduction .............................................................................. 17
1. Trends in enrolment in formal KG .......................................... 19
2. The priority age group for ECD .............................................. 25
3. Disparities in preschool enrolment ........................................ 31
4. ECD Centers ........................................................................... 37
5. Policy principles for expanding access .................................. 45
6. The costs of universal access at ages 4 and 5 ....................... 57
7. Financial sustainability ........................................................... 69
8. Recommendations ................................................................. 85
References .................................................................................. 87

4

5
Executive Summary
In 2004, the National Strategy for the Development of Education 2005-2015 and Amendment on the Law on Children’s Protection expressed the urgent need
for alternative forms of pre-school education, reaching all children in Macedonia regardless of background. This report answers the “how-question”: how can we redeem in 2010 the legal promise made in 2004? How can we turn the undisputed legal rights of less privileged children into reality? Preconditions for answering this question are (i) the fiscal constraints that Macedonia faces today; (ii) the grand movement towards local self-governance; and (iii) the adage that central government ensures access to key services for all children.
Specifying these key services, an article in The Lancet states that children should engage in group activities from age 3 onwards. Another authoritative source recommends starting this two years before entry in primary school, at age 4. Both sources agree that from conception onwards, disadvantaged parents should receive professional support in rearing their children.
6
The latter could be achieved by investing in the already existing patronage system. Strongly health oriented, it would need to be broadened to include early stimulation, while the case load of nurses must be reduced. ECD centers are also well positioned to support parents. While enhancing parental support is strongly recommended, the focus of this report is on expanding enrolment of children themselves. Recognizing the country’s difficult financial situation today, the report sees the enrolment of just the 4 and 5 year olds as a first step, to be followed by the inclusion of the 3 year olds as the financial situation improves.
Enrolment in formal kindergarten among 4 and 5 year olds stands at about 23%. Most of these children are from urban double income families and nearly all children’s mothers completed secondary or higher education. Few Albanian and Roma children are included. Research on the benefits of ECD demonstrated that programs yield the highest returns when they are targeted at the disadvantaged. Precisely these groups remain excluded. The financial situation of Macedonia cannot explain the low level of pre-school enrolment; Macedonia fares poorly compared to most other countries in its region even when per capita income is taken into account. Given its high costs and its reliance on richer groups, kindergartens are very unlikely to expand rapidly to include poorer groups.
Many countries have successfully addressed this problem by creating non-formal or community-based ECD Centers. Macedonia adopted this important innovation in 2000 by creating 350 ECD Centers in disadvantaged areas with financial assistance of the World Bank and support of UNICEF. Sadly, many closed down as a result of the conflict of 2001 and due to a lack of structural funding. But a recent evaluation of 17 of the remaining ones – enrolling about 800 children - showed that they have a strong potential to enhance child development and to support parents. Already applying the Early Learning Development Standards they could deliver quality programs that are tailored to the needs and conditions of the families in their catchment areas, if only structural funding were available and if teaching time would increase to for instance 3 hours per day on 5 days per week with one hour of extra time per session for the teacher.
The experience in other countries is that such half-day programs can be sustainable if they are not merely introduced alongside the existing pre-school system but are integrated in a new system, with new checks and balances, in which the kindergartens also find a proper place. This calls for a set of policy principles based on the adage of social justice, or “fair play”.

7
A first principle is that child development is defined as the primary function of ECD programs. In this respect, half-day programs appear to be as good as - if not better than - full-day programs. Hence, half-day programs for the 4 and 5 year olds – and eventually the 3 year olds - are the core public service that deserves public funding. A secondary function of ECD programs is that they free up parents for work, study or other activities. This usually requires a costly full-day program with meals and dormitories. In most countries in the world, this custodial function is a private affair. There is no argument to strongly subsidize the custodial function for a rich minority of the population if the child development function is entirely unfulfilled for the poorer majority. Thus it is proposed that the half-day program be subsidized for all - rich and poor alike - and that those who wish a full-day program pay a fair price for the additional services. Kindergartens could continue to provide the same full-day programs for the same clientele as always, but the funding arrangement would change.
A second policy principle concerns the supply side. If Macedonia is to see a rapid expansion of half-day programs, it may be neither feasible nor wise to create a large number of new ECD Centers in a short time-span. Existing kindergartens may enlarge their capacity for half-day programs as well, while new providers such as private kindergartens and company- and home-based facilities may also emerge. This requires a stringent accreditation system. Institutions that achieve the accreditation obtain the right to provide the half-day program to four and five year olds in exchange for a per capita subsidy. This creates a “level playing field”. The existing kindergartens may assume the additional role of resource centers.
Sustainable funding is the third principle. Contributions from foreign donors and private sponsors are only to be used to cover initial costs such as refurbishment, inventory, program development, and initial training. Recurrent costs should be borne and secured by government and citizens, and they should allow for maintenance of buildings, regular replacement of inventory, and continuous investment in programs and in human resources.
The fourth and last principle is the fair sharing of the burden of the recurrent costs. These are estimated at 387 million denar per year. This is based on a unit cost for the half-day program of about 9,700 denar per child per year, multiplied by the 35,000 children of 4 and 5 years without access to kindergarten. This is topped up by 14.7% to cover the extra costs faced in areas with low population density. Four sources are available to cover the 387 million denar.

8
1. Parents can pay a user fee of 400 denar per month for the half-day program. But to avoid exclusion of the poorest, this fee must be waived for at least the families on Social Financial Assistance. In this case the revenue would be 142 million denar per year. Waiving the fee for the larger group that lives under the poverty line reduces this to 67 million denar. A third possibility is to make the half-day programs free of charge, sooner or later. In that case the revenue would of course be zero.
2. There is ample scope for efficiency gains in the existing kindergartens, where the costs per child per year are almost half the annual income of the average Macedonian. In other countries in the region the unit cost is less than a fifth of annual income on average. Halving the gap with these other countries frees up 310 million denar per year; a less ambitious target leads to savings of 155 million denar.
3. A part of the resources for the half-day program can be mobilized by a modest increase in the fee for full-day kindergarten. This fee stands at about 1500 de-nar but the real costs are four times higher. Families with a child in full-day care receive ten times more state subsidy than families that have a child in a half-day program and pay the fee. Raising the full-day fee to 2000 denar generates 106 million denar; raising it to 2500 makes 211 million denar available. In the latter case, the families using kindergarten would still receive eight times more state subsidy than those using half-day programs.
4. The share of the 387 million denar that the government needs to cover depends of course on how much the three aforementioned sources will generate. For each of the three there are two or three variants which produce a total of 12 possibilities or funding scenarios. It appears that in most scenarios the burden for government is close to zero or even negative. Only if no fees are charged for the half-day programs; if efficiency gains in kindergarten are modest; and if the fee for kindergarten is hardly increased, the remaining burden for government exceeds 100 million denar. To be more precise: 126 million denar.
This amount of money is dwarfed by the estimated increase in three reference budgets (education, health, social policy) even under very cautious assumptions regarding economic growth. Moreover, the demographic development – in particular the decrease of student numbers in primary and secondary education – opens up a unique window of opportunity to expand ECD services in the coming 5 years.

9
The sharing of the costs is essentially a political question which cannot be answered by this report. It will have to be negotiated by stakeholders in Macedonia. It is hoped that this report facilitates that dialogue.
It is also recommended to start in 2011 with the implementation of the proposed policy in ten municipalities: the five in which ECD Centers are already operational, and five new ones that are to be selected on the basis of willingness and needs. It would be good if some of these pilot municipalities are home to a kindergarten that wants to assume the role of resource center.

10
11
Acknowledgements
This report was commissioned by the National Office of UNICEF in the Republic of Macedonia. The author wishes to express his sincere gratitude first and foremost
to Dr. Nadica Janeva, Director of the Mother and Child Institute, Health Care Centre, Skopje and driving force behind the ECD Network of Macedonia, and to Dr. Nora Sabani, the Education for Development Specialist of the UNICEF Country Office in Skopje. Without their excellent assistance, this report would not have been written.
Highly appreciated and critically important was also the information provided by the following people.
In Konce Municipality: Ljupka Jovanova, educator in the ECD Centre in Konce village; Blazo Jovanov: Municipality Inspector; and Lence Krsteva, Financial As-sistant.
In Radovis Municipality: Daniela Kacareva and Ljupka Trenceva, educators in the ECD Center in the Roma community Sein Maale; and Violeta Efnudieva, Head of Finance Sector.
In Bitola Municipality: school principal Ilija Krbalevski of the ECD centre Dolno Orizari; and Mayor Lazar Kotevski of Novaci Municipality.
The parents that were met in the ECD Centers were experts in their own way. They helped to understand the needs and dreams of the people for whom this report was written.
Jan van Ravens, The NetherlandsFaculty of the Edward Zigler Center in Child Development and Social Policy,
Yale University, USA

12

13
Acronyms
CEE/CIS Central and Eastern Europe and Commonwealth of Independent StatesCGECCD Consultative Group on Early Childhood Care and DevelopmentCSR Corporate Social ResponsibilityECCE Early Childhood Care and EducationECD Early Childhood DevelopmentEFA Education for AllGDP Gross Domestic ProductGER Gross Enrolment RateGNP Gross National ProductKG KindergartenMICS Multiple Indicator Cluster SurveyNER Net Enrolment RateNGO Non-governmental OrganizationNSDE National Strategy for the Development of Education OECD Organization for Economic Development and CooperationSFA Social Financial AssistanceUNDP United Nations Development ProgrammeUNESCO United Nations Education and Science OrganizationUNICEF United Nations Children’s Fund

14
15
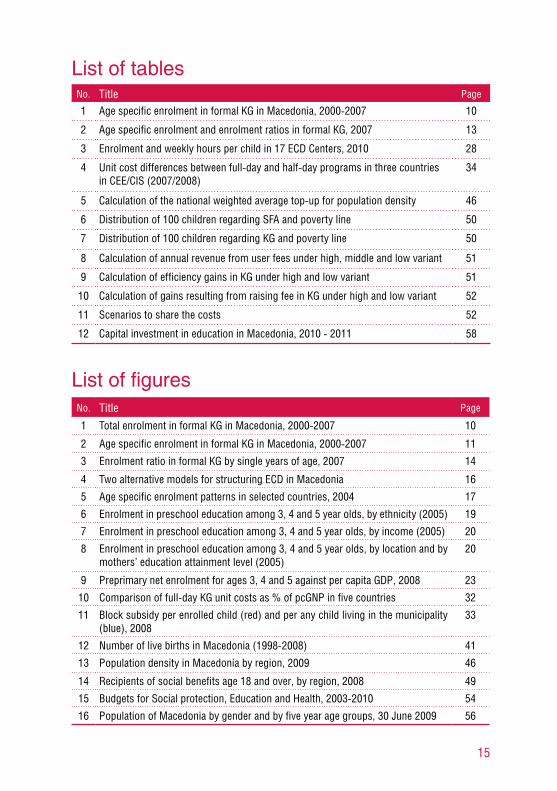
List of tablesNo. Title Page
1 Age specific enrolment in formal KG in Macedonia, 2000-2007 10
2 Age specific enrolment and enrolment ratios in formal KG, 2007 13
3 Enrolment and weekly hours per child in 17 ECD Centers, 2010 28
4 Unit cost differences between full-day and half-day programs in three countries in CEE/CIS (2007/2008)
34
5 Calculation of the national weighted average top-up for population density 46
6 Distribution of 100 children regarding SFA and poverty line 50
7 Distribution of 100 children regarding KG and poverty line 50
8 Calculation of annual revenue from user fees under high, middle and low variant 51
9 Calculation of efficiency gains in KG under high and low variant 51
10 Calculation of gains resulting from raising fee in KG under high and low variant 52
11 Scenarios to share the costs 52
12 Capital investment in education in Macedonia, 2010 - 2011 58
List of figuresNo. Title Page
1 Total enrolment in formal KG in Macedonia, 2000-2007 10
2 Age specific enrolment in formal KG in Macedonia, 2000-2007 11
3 Enrolment ratio in formal KG by single years of age, 2007 14
4 Two alternative models for structuring ECD in Macedonia 16
5 Age specific enrolment patterns in selected countries, 2004 17
6 Enrolment in preschool education among 3, 4 and 5 year olds, by ethnicity (2005) 19
7 Enrolment in preschool education among 3, 4 and 5 year olds, by income (2005) 20
8 Enrolment in preschool education among 3, 4 and 5 year olds, by location and by mothers’ education attainment level (2005)
20
9 Preprimary net enrolment for ages 3, 4 and 5 against per capita GDP, 2008 23
10 Comparison of full-day KG unit costs as % of pcGNP in five countries 32
11 Block subsidy per enrolled child (red) and per any child living in the municipality (blue), 2008
33
12 Number of live births in Macedonia (1998-2008) 41
13 Population density in Macedonia by region, 2009 46
14 Recipients of social benefits age 18 and over, by region, 2008 49
15 Budgets for Social protection, Education and Health, 2003-2010 54
16 Population of Macedonia by gender and by five year age groups, 30 June 2009 56

16

17
Introduction
In its National Strategy for the Development of Education 2005-2015 (NSDE), the Republic of Macedonia (2004) made a critically important and straightforward
decision regarding the policy field of Early Childhood Development (ECD). Macedonia decided to substantially enlarge the intake of children at preschool level, be it in the well-known Kindergartens, be it in alternative and innovative programs. In doing so, there will be a strong focus on children in disadvantaged groups and areas. This was anchored in the Law on Children’s Protection by an Amendment in 2004 (article 20), which emphasizes the needs of children in remote or demographically jeopardized areas.
Given these strong legal and policy statements, this report does not need to rehearse the large body of evidence that demonstrates the positive impact of regular and alternative ECD programs on the child, the family, the society and the economy. Nobody needs to be convinced anymore. Macedonia has moved beyond the stage of advocacy for ECD. Instead, this report focuses on the “how-question”. How can we redeem, in 2010, the legal promise made in 2004. How can we turn the legal rights of less privileged children into reality.
To answer this question, the report investigates the financial feasibility of providing universal access to (at least) half-day ECD programs for (again at least) the children of 4 and 5 years old. The argumentation for these two choices – an initial focus on half-day programs and on 4 and 5 year olds – will be elaborated in this report. It will be argued that this is a defensible compromise between what is necessary from a
18
child development perspective and what is affordable in the present context of fiscal constraints in Macedonia.
Furthermore, the report is aligned with current developments in terms of governance and finance in Macedonia, including agreed principles of fiscal decentralization (Martinez-Vasquez, Timofeev, Feruglio, 2007) and proposed instruments for the elaboration of these principles (Cyan, Martinez-Vazquez and Timofeev, 2009). The report assumes that the context in which ECD programs will be expanded in the coming years is determined by, on the one hand, the grand movement towards local self-governance and on the other hand a central government that remains at all times accountable for access to key services for children and families. The first four chapters analyze the current situation. Chapter 1 looks at enrolment in formal kindergarten, which is still the dominant ECD program in Macedonia today. It reconfirms that this program caters predominantly for children from privileged groups. Chapter 2 asks which age group needs to be prioritized in light of scarce resources; an international comparison supports the analysis. The third chapter discusses disparities in access to ECD services against the backdrop of declining living standards for children. Once again, international benchmarking is applied. Chapter 4 draws lessons from the experience with the ECD Centers that were created in the year 2000: what can we learn from the ones that still function well, and what were the reasons why other Centers could not be sustained?
Chapter 5 is the hinge point of this report. Based on the four preceding chapters, and faithful to current thinking about governance and finance in Macedonia, it formulates the key policy principles that could guide the expansion of ECD programs in the near future. The following chapters are elaborations of these principles. Chapter 6 estimates the costs of universal access for the four and five year olds, while chapter 7 demonstrates that this policy can be financially sustainable on the long term.
Chapter 8, finally, makes recommendations. The key recommendation is to start in 2011 with the implementation of the proposed policy in 10 municipalities: the 5 in which ECD Centers are already operational, and 5 other ones to be selected on the basis of willingness and needs.

19
Trends in enrolment in formal KG
In our search of a way to universalize access to early childhood programs in Macedonia, we begin by analyzing trends in enrolment in the dominant institution:
the official Kindergarten that has been the sole institution for ECD for many decades. Whenever this report speaks of the formal Kindergarten, as distinct from the more recent alternative institutions such as ECD centers, this term refers to this institution. It is abbreviated to KG. Macedonia has excellent age specific enrolment data for the KG, and table 1 summarizes them for the years 2000-2007. First, we focus on absolute numbers of enrolled children; later in this chapter we relate these numbers to population data arriving at enrolment ratios.
Table 1: Age specific enrolment in formal KG in Macedonia, 2000-2007
2000 2001 2002 2003 2004 2005 2006 2007
Younger than 3 673 754 620 805 491 764 927 1491
3 years 3091 3346 3239 3472 3280 3423 3684 4440
4 years 3603 3624 3787 3771 3949 3854 4254 4822
5 years 7189 6510 6996 6698 7421 8419 8038 5948
6 years 18857 17563 17078 17031 16797 17931 19695 906
7 years & older 1807 2202 1992 2119 1784 697 1397 74
Total 35220 33999 33712 33896 33722 35088 37995 17607
Source: Macedonia’s submission to the TransMONEE database http://www.unicef-irc.org/databases/transmonee/
Note: these data refer to kindergartens, infant schools of preschool organization and for infant-schools of elementary education. Not included are children 0-2 in nurseries that are under the jurisdiction of the Ministry of Labor and Social Welfare.
1

20
First, we look at total enrolment in the KGs. Figure 1 shows the development throughout recent years. Comments follow below this figure
Figure 1: Total enrolment in formal KG in Macedonia, 2000-2007
2000 2001 2002 2003 2004 2005 2006 2007
40000
35000
30000
25000
20000
15000
10000
5000
0
Source: Macedonia’s submission to the TransMONEE database http://www.unicef-irc.org/databases/transmonee/Note: see note under table 1.
Clearly, the fact that total enrolment halved between 2006 and 2007 is caused by the change in primary entry age, from age seven to age six. But apart from that specific policy intervention, total enrolment did not change much between 2000 and 2006. It continued to drop slowly until 2002; remained low until 2004, and only climbed up modestly between 2004 and 2006. In other words, figure 1 as such does not give any reason for hope that enrolment in formal KG will strongly rise autonomously. Total capacity is just too limited, and even at forehand is seems that the financial means of both government (national and local) and parents seem insufficient to expect a strong push to enrolment in this rather expensive type of ECD program (in-depth information about unit costs in KG as well as alternative ECD centers will follow in chapter 5 of this report).
What figure 1 conceals, however, is age-specific enrolment. It could be the case that for certain distinct age groups the picture is different. Like figure 1, figure 2 is derived from the data in table 1, but it zooms in on four age groups: the children younger than 3 years old, the 3 year olds, the 4 and the 5 year olds. The reason for omitting the 6 and 7 year olds is that their enrolment levels are strongly affected by the change of the entry age of primary education in 2007. Through this policy measure, the 6 and 7 year olds have practically disappeared from formal KG, as table 1 shows. Once again, comments on figure 2 follow after it.

21
Figure 2: Age specific enrolment in formal KG in Macedonia, 2000-200
2000 2001 2002 2003 2004 2005 2006 2007
8000
7000
6000
5000
4000
3000
2000
1000
0
under 3 3 years old 4 years old 5 years old
Source: Macedonia’s submission to the TransMONEE database http://www.unicef-irc.org/databases/transmonee/Note: see note under table 1.
The most volatile figure in figure 2 is the number of enrolled 5 year olds. The purple bar goes up and down, indicating that families who had a 5 year old child in this particular period were facing changing circumstances. The drop in enrolment of 5 year olds between 2006 and 2007 may be related to the lowering of the primary entry age; some families may have decided to enroll their 5 year olds children in primary education rather than in formal KG, for instance because it is cheaper. We see this in many countries.
Enrolment among 3 and 4 year olds (the red and the green bars) is remarkably stable, with only a slight rise in 2006 and 2007. This suggests (i) that there is a certain “sociological group” in Macedonia, most probably consisting of high and/or double income families, that have both the need and the means to enroll their children in formal KG, and (ii) that there is very limited scope that this privileged group be enlarged significantly. In addition to this “stable access group”, there is a marginal group that seeks to enroll just their 5 year old children. This marginal group is symbolized by the part of the purple bar that rises above the red and green ones. It can be seen from figure 2 that the size of this marginal group varies strongly over the years and was reduced to just about 1000 children in 2007.
Finally there is a small but slightly increasing group of families that can even afford to enroll children in the age range of 0-3. The blue bars show continuous growth between 2004 and 2007. The group may still be small compared to the other age groups, but the total amount of money involved is significant as the care for these

22
young children is more labor intensive. In fact, if we would include the children of 0-2 in nurseries (see note under table 1 and figures 1 and 2) this age group would be significant both in numbers and in costs.
If we look at the bigger picture that figure 2 presents, we notice a tendency towards “compression”. In 2004, for instance, the number of 5 year olds in formal KG was nearly 7500, which was about twice as high as the number of 3 or 4 year olds, while the number of under-3 was negligible. By 2007, the number of 5 year olds was hardly higher than the number of children of 3 or 4 years old, while the under-3 are slowly climbing up to that level. In other words, access to formal KG is increasingly compressed to one and the same, small sociological group that claims most of the roughly 17500 places in formal KG on a permanent basis. All other children are excluded, not just for one or two years, but throughout their early childhood.
Table 2: Age specific enrolment and enrolment ratios in formal KG, 2007
Age Groups Total number of children Enrolled in KG
Enrolment Ratio (in %)
Boys Girls Both
0 11479 10836 22315 541 2.4
1 11248 10868 22116 1337 6.0
2 11984 11042 23026 1005 4.4
3 11958 11284 23242 4440 19.1
4 11840 11068 22908 4822 21.0
5 12516 11773 24289 5948 24.5
6 13182 12353 25535 906 3.5
7 12480 11625 24105 74 0.3
Total 0-7
187536 17681 9.4
Total 0-6
163431 17607 10.8
Total 0-5
137896 16701 12.1
Total 3-5
70439 15210 21.6
Total 4-5
47197 10770 22.8
Source: Macedonia’s submission to the TransMONEE database http://www.unicef-irc.org/databases/transmonee/
Note: see note under table 1.

23
Exactly how big that excluded group is cannot be concluded from data on absolute numbers of enrolled children. It requires us to take overall population data into account and to calculate enrolment ratios. Table 2 presents for each age group: (i) the total number of children in Macedonia; (ii) the absolute number of children in that particular age group that is enrolled; and (iii) the age specific enrolment ratio, which is the number of enrolled children per age group divided by the total number of children, expressed as a percentage. Table 2 has broken down the whole age range of 0-7 into single years of age, including the 0-3. For reasons explained below, this table also includes several groupings: 0-7, 0-6, 0-5, 3-5 and 4-5. For each of these groupings there is an enrolment ratio as well.
By breaking down the enrolment data to single years of age, it becomes even more evident that enrolment is nowadays mainly concentrated among the 3, 4 and 5 year olds, with age specific enrolment ratios of 19.1, 21.0 and 24.5% respectively. Figure 3 (further below) illustrates this. As the absolute numbers in table 1 already suggested, enrolment ratios among 6 and 7 year olds were reduced sharply since the lowering of the primary entry age. Enrolment ratios among the 0, 1 and 2 year olds are low despite recent growth; together with the children of 0-2 in nurseries they amount to 4334 in 2007 and 4515 in 2008, resulting in a ratio of about 8%.
More important in table 2 is the calculation of the total enrolment ratio. In the case of ECD, this is a complex matter that needs some reflection in this report. In principle, enrolment ratios in education are calculated by taking the number of enrolled children as the numerator, and the total number of children in the relevant age group as the denominator. In primary, secondary and tertiary education, it is relatively clear what the relevant age group is; it is determined by law. For ECD, one could argue that all children of 0-7 are eligible for formal KG, so this should be the age range on which we should focus. As table 2 shows, this choice would result in an overall enrolment ratio of on 9.4%.
However, the 7 year olds should be in primary education, not in KG. Indeed, their number is very limited. But the absolute number of 7 year olds is much higher; it is roughly as large as the number of children in any other age cohort. So by omitting the 7 year olds, the numerator decreases only marginally, while the denominator decreases more significantly. Hence, the overall enrolment ratio among the 0-6 is 10.8%, which is higher than the 9.4% for the 0-7 group. Likewise, the ratio increases further to 12.1% if we omit also the 6 year olds.

24
Similar considerations pertain to the youngest children. Enrolment among the 0-3 is very low and by omitting these children from the overall enrolment ratio – i.e. by zooming in on the 3-5 year olds – the ratio jumps to 21.6%. A focus on the 4-5 year olds, finally, results in a ratio of 22.8%. Figure 3 illustrates that enrolment among the core group of 3-5 (or 4-5) is indeed in the order of 20% to 25%. Although this implies that no less than 75% to 80% of all Macedonian children are still excluded, the figure of 20-25% gives a more adequate and somewhat less gloomy picture than the figure of around 12% that is often mentioned in Macedonian policy documents as the enrolment ratio.
Figure 3: Enrolment ratio in formal KG by single years of age, 2007
30
25
20
15
10
5
0Age
Enro
lmen
t rat
io
Source: Macedonia’s submission to the TransMONEE database http://www.unicef-irc.org/databases/transmonee/
Note: see note under table 1.
One of the conclusions of this chapter is that calculating the current enrolment ratio is not just a technical matter. The outcome of that calculation depends strongly on the age range on which we focus (0-5? 3-5? 4-5?). This is essentially a matter of policy, preferably based on scientific evidence and international comparison. This is the subject for the next chapter.
25
The priority age group for ECD
In any expansion strategy of ECD programs it is necessary to define a realistic level of ambition in terms of the age range that needs to be covered. Simply enrolling
all children from birth until entry in primary school is unaffordable, even if programs would be available that are less costly than the formal KG. A quick look at figure 3 in the previous chapter underscores this: raising all the blue bars to a level of 100% is a daunting challenge, while limiting this task to the two or three bars that already exceed 20% would make it much more realistic.
Moreover, enrolling all of the 0-6 is unnecessary and perhaps even undesirable from a child development perspective. Among ECD experts - see for instance the report on the Multiple Indicator Cluster Survey (MICS) conducted in Macedonia in 2005-2006 (State Statistical Office of the Republic of Macedonia, 2007:45) - there is broad consensus:
that children are best reared in the home environment during the first three or four years of their lives, provided that certain conditions are fulfilled within that environment:
parents need certain parental skills; toys and other stimuli must be present; a healthy environment must be available et cetera;
that parental education can help to fulfill such conditions, especially in disad-vantaged groups and areas (Evans, 2006)
2

26
that children should partake in group activities – play, learning, singing, pre-literacy – from age 3 or 4 onwards, until they enter in primary school.
However, there is some variation in opinion regarding the exact age at which these group experiences must be introduced. Two very authoritative statements differ slightly in this regard. On the one hand there is the Consultative Group on Early Childhood Care and Development (CGECCD, 2008) in which major ECD stakeholders are represented including UNICEF and the World Bank. Their policy statement called “The Four Cornerstones” proposes that children be enrolled in group activities during the last two years before entry in primary school. In the current Macedonian situation – with entry in primary education at age 6 - this would imply enrolment in KG or an alternative ECD center during ages 4 and 5. This would be preceded by support to parents, from birth onwards but preferably from conception onwards. This can take the form of parental education in groups; of parental support on a one-to-one basis e.g. through home-visiting; or of a combination of the two.
On the other hand there is a series of three articles in the reputable medical scientific journal The Lancet, published in 2007. In one of these articles, Engle et al (2007:238) propose to implement interventions in infancy through families and caregivers, and add group learning activities from 3 to 6 years, particularly for disadvantaged children. In other words, Engle et al advise to start group participation one year earlier than the CGECCD.
Engle et al also recommend the use of existing services (2007:238) for the expansion of ECD. In the Macedonian context, the so-called patronage system could be a platform from which to develop support to parents further. At present, the patronage reaches 78% of the families (Janeva, 2008)1. However, as it is strongly medicalised, the patronage system should be enhanced by integrating cognitive and socio-psychological elements and early stimulation and learning (Janeva, 2008, referring to an extensive literature review by Regalado, 2001). The experience in other countries proves that such an enhancement is feasible, especially when links are being built between support to parents and the kind of ECD centers that are described in chapter 4 of this report (van Ravens, 2010a and 2010b). The patronage system would also need to be strengthened by decreasing the present case load of 6600 per nurse (in Skopje it is as high as 8660) to the norms of 5000 in urban areas and 3000-4000 in rural areas. Alternatively, parental support can be delivered via the ECD centers. But anyhow, the need for strong support to parents in Macedonia is
1 Janeva (2008) also reports that 98% of the children in Macedonia are included in preven-tive health examinations and parental advisory in the first year of their lives.

27
paramount. The aforementioned MICS report (State Statistical Office of the Republic of Macedonia, 2005:92-93) shows that the extent to which the home-environment is conducive to child development and early learning varies strongly according to the wealth of the family, the education level of the parents, and ethnicity (with the Albanian and Roma minorities lagging behind).
Figure 4 presents the model proposed in The Lancet and the one proposed by the CGECCD in one framework, translated to the Macedonian context.
Figure 4: Two alternative models for structuring ECD in Macedonia
Age Following the model proposed in “The Lancet”
Following the model proposed by the CGECCD
Prenatal
Support to parents
Support to parents
0
1
2
3
KG or ECD center4KG or ECD center5
Clearly, the choice between these two models is a critical one and requires thorough political debate. The model proposed in The Lancet may have a stronger impact on child development as it implies that enrolment in group activities starts one year earlier. But the Lancet model is also more costly since the unit cost of one year of group enrolment is higher than that of one year of support to parents, as the experience in other countries shows (van Ravens, 2008a, 2008b, 2009, 2010b).
In order to inform the debate about the two models, figure 5 presents a number of “country profiles” regarding enrolment in ECD programs by age group. These profiles are copied from the 2007-edition of the Education for All Global Monitoring Report which focused on ECD. Unfortunately, the data for these countries stem from 2004, so for comparability we also need to use 2004-data for Macedonia (when the entry age for primary education was still 7). But what counts here is putting the situation of Macedonia in an international perspective.
A discussion follows again after the figure; for a good understanding it is important to know in advance that the dark brown bars represent enrolment in preschool programs, while the light brown bars represent primary school enrolment. The horizontal lines mark enrolment levels of 20, 40, 60, 80 and 100 percent. Below the

28
horizontal axe we find are the ages (3-7); the bold figure is the entry age in primary education for each country.
Figure 5: Age specific enrolment patterns in selected countries, 2004
3 4 5 6 7
FYR Macedonia
3 4 5 6 7
Finland
3 4 5 6 7
Slovenia
3 4 5 6 7
Kyrgystan
3 4 5 6 7
USA
3 4 5 6 7
Switzerland
3 4 5 6 7
France
3 4 5 6 7
Netherlands
Source: copied from UNESCO, 2006:140-141
Figure 5 shows that in most of the eight countries enrolment in preschool programs starts at age 3. In France, enrolment at age 3 is even universal, but this is rather exceptional. Together with Italy and Belgium, France is one of the few countries with widely accessible, subsidized preschool programs open to very young children. In Slovenia, the United States and Finland we find that enrolment at age 3, and even at ages 4 and 5, is not universal. In these countries we see a gradual increase with age, while enrolment becomes universal at age 6, be it in preschool, be it in primary education. It should be noted however, that many of the not enrolled children in these countries are cared for in private facilities or facilities made available by employers. This is also the case in Switzerland and the Netherlands, where public enrolment at age 3 is low or even absent, while private enrolment among 3 year olds is high.
The poorest country in figure 5, Kyrgyzstan has low enrolment for all ages, but remarkably enrolment at age 3 is not lower than at ages 4 and 5. This is caused by the fact that a small elite is using all of the public resources for ECD programs as a cheap form of daycare (van Ravens, 2010c) whereas upper and middle class families in many other countries pay for such services in private facilities. The situation in Macedonia seems to differ only gradually – not essentially – from that

29
in Kyrgyzstan. In light of the international comparison it seems highly unfair that all public resources go to a small group of children who least need the service from a child development perspective. More information to substantiate this will follow in chapter 5 of this report.
For more information on preschool enrolment patterns in other countries, please use the following link http://www.unesco.org/education/GMR/2007/chapter6.pdf and scroll down to pages 140 and 141, where 60 country profiles are presented.
The conclusion from the international comparison is that public provision of ECD programs at age 3 is not exceptional. However, it is seldom universal, while Switzerland and the Netherlands – but also countries like Australia and Korea – show that it is possible to leave enrolment at age 3 up to the market. The underlying argument is that enrolment at age 3 is not strictly necessary from a child development perspective, and that if parents nevertheless want to enroll their children at this age, it is for practical reasons – usually the fact that both parents are working – rather than educational ones.
So although the choice between the Lancet model (enrolment from age 3 onwards) and the GCECCD model (enrolment from age 4 onwards) is a political one that warrants thorough public debate, this report will base itself on the CGECCD model for the time being. The CGECCD model is less costly than the Lancet model, and in the future one can always move from the former to the latter.
Turning back to table 2 and figure 3, we can now conclude that the challenge for the coming years is to bring enrolment at age 4 from 21.0% to 100%, and enrolment at age 5 from 24.5% to 100%. In absolute numbers this comes down to raising enrolment from about 9000 children of 4 and 5 years old, to about 47000. More precise estimations of the future number of children that are to be enrolled will follow in chapter 6 of this report.

30

31
Disparities in preschool enrolment
The previous chapter concluded that Macedonia has a long way to go until all of the 4 and 5 year olds are enrolled in some form of preschool education. About
75% to 80% are not reached, and this chapter investigates the extent to which this exclusion is related to certain background characteristics such as ethnicity, wealth, location (urban or rural) and education level of the parents.
Figure 6: Enrolment in preschool education among 3, 4 and 5 year olds, by ethnicity (2005)
30
25
20
15
10
5
0Macedonian Albanian Roma Other
Source: State Statistical Office of the Republic of Macedonia/UNICEF, 2007
3

32
Figure 6 shows that children of Macedonian origins have a much higher chance of being enrolled than children with an Albanian or Roma backgrounds (the highest enrolment level is found among children belonging to “other groups”, but this category is less significant in terms of absolute numbers). Unfortunately, such an ethnic disparity is far from unusual, but in Macedonia it is more pronounced than for instance in Serbia and Kyrgyzstan (UNICEF Innocenti Research Center, 2009:108).
(Figure 6 concerns not only children of 4 and 5 years olds but also of 3 years old, because this is the age range presented in the MICS-2005 report which is the source for this figure).
Similar disparities exist between children of different income groups. Figure 7 divides families in 5 income groups of equal size (20% each) and presents the enrolment ratios for each of them. Once again it concerns 3, 4 and 5 year olds.
Figure 7: Enrolment in preschool education among 3, 4 and 5 year olds, by income (2005)
30
25
20
15
10
5
0Poorest Second Middle Fourth Richest
Source: State Statistical Office of the Republic of Macedonia/UNICEF, 2007
Unsurprisingly, enrolment increases with income, although the difference between the fourth and fifth quintiles is small. In other words, access is predominantly the privilege of the 40% richest groups. Since children’s development chances are usually associated with socio-economic status, figure 7 provides the evidence that ECD programs in Macedonia are not reaching the children that need these most.

33
Figure 8, finally, looks at disparities between urban and rural children, and at those between children with mothers with no education, mothers with just primary education, and mothers with secondary education or higher.
Figure 8: Enrolment in preschool education among 3, 4 and 5 year olds, by location and by mothers’ education attainment level (2005)
25
20
15
10
5
0Urban Rural No education Primary
EducationSecundary or
higher
Source: State Statistical Office of the Republic of Macedonia/UNICEF, 2007
Once again: it is not unusual that urban children have better access to ECD services than rural children, but in Macedonia the disparity is truly exceptional. The same goes for the gap between children of mothers with no education or just primary, and the ones with secondary and higher. This warrants special attention.
The background characteristics such as ethnicity, income and location (urban/rural) can be regarded as “proxies” for children’s needs. We know from a large body of scientific evidence that children from certain ethnic minorities, from low income groups, and from rural areas are usually disadvantaged in various ways compared to children not belonging to these groups. In contrast, the education level of the mother is more than just a proxy; it directly indicates the family’s need for support in the upbringing of the child. Mothers with poor literacy skills, for instance, have no access to written knowledge about good practice in child rearing, and neither can they read stories to their children. From education achievement surveys such as PISA and TIMSS we know that maternal education is the single most powerful predictor of children’s performance in education.
34
So basically, figure 8 tells us that the 20 to 25% of the Macedonian children of 4-5 years old that are enrolled in ECD programs today do not strongly need the service from a child development perspective. Their home environment generally offers the conditions for sound development, and they are mainly enrolled because it enables their parent(s) to work. Once again, this questions the justification of spending nearly all of the public resources allocated to ECD programs for this privileged group. As the Position Paper on ECD of the UNICEF Regional Office for CEE/CIS (2007:II.3) states – referring to the Convention on the rights of the Child – it is necessary to begin with the most vulnerable, by reducing social inequality by breaking the intergenerational transmission of poverty. There are economic arguments for this strategy as well. Many documents about the benefits of ECD quote American programme evaluations that found that money invested in ECD results in societal gains of four to seven times the initial investment, or even more. But it should be kept in mind that these American programmes focus strongly on marginalized groups. The more marginalized, the higher the returns. From ECD investments in the most privileged groups, one can hardly expect economic returns since there is little or no added value in educating their children in an institution compared to educating them in their favorable home learning environment.
Meanwhile, there are indications that an increasing number of children are indeed at risk in Macedonia. The percentage of stunted children increased from 8 to 12% between 1999-2000 and 2004-2006, according to the UNICEF Innocenti Research Center (2009:20). The same source reports that under-five mortality decreased markedly in many countries in the CEE/CIS region21between 2000 and 2007, while it increased only in Macedonia and Ukraine (UNICEF Innocenti Research Center, 2009:19). National data from the State Statistical Office and the Institute for Mother and Child Health show a fluctuation rather than a decline, but at 13.3 deaths per 1000 live births (in 2009) the under-5 mortality is still more than thrice the level of the EU (4 in 2007).One could perhaps argue that a stagnation or decline in child health indicators is caused by a more general decrease of living standards rather than by a more specific lack of services for young children. This hypothesis, however, does not hold out in light of a number of empirical findings. Macedonia’s mortality rate among 15-19 year olds is the lowest of the CEE/CIS region, and it is lower even than that of Finland, Spain and the United Kingdom (UNICEF Innocenti Research Center, 2009:23), while the suicide rate among the same age group – which can be seen as a proxy for the perceived quality of life in a country – is lower than in the same three countries plus
2 CEE/CIS stands for Central and Eastern Europe and the Commonwealth of Independent States (formerly the Soviet Union)
35
Germany, and one of the lowest in the CEE/CIS region (UNICEF Innocenti Research Center, 2009:24). Remarkable are also the small numbers of Macedonian children that live in institutions (UNICEF Innocenti Research Center, 2009:32) or in foster care or gardianship (UNICEF Innocenti Research Center, 2009:34).
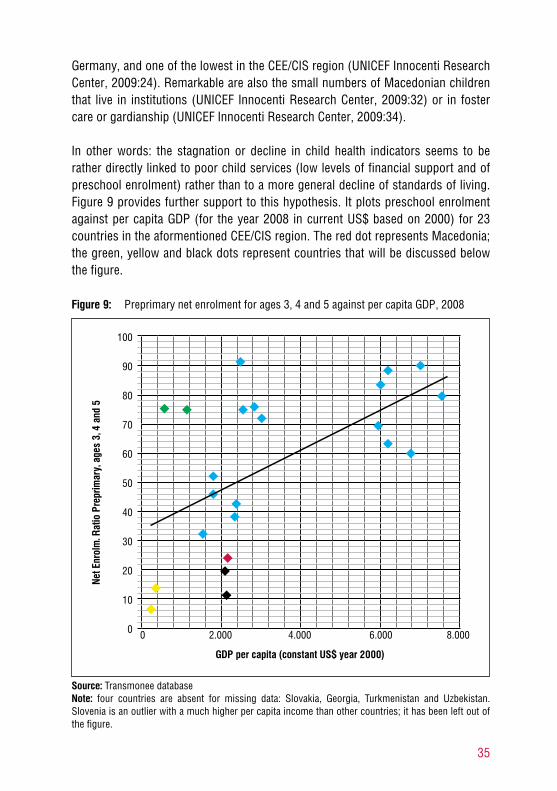
In other words: the stagnation or decline in child health indicators seems to be rather directly linked to poor child services (low levels of financial support and of preschool enrolment) rather than to a more general decline of standards of living. Figure 9 provides further support to this hypothesis. It plots preschool enrolment against per capita GDP (for the year 2008 in current US$ based on 2000) for 23 countries in the aformentioned CEE/CIS region. The red dot represents Macedonia; the green, yellow and black dots represent countries that will be discussed below the figure.
Figure 9: Preprimary net enrolment for ages 3, 4 and 5 against per capita GDP, 2008
100
90
80
70
60
50
40
30
20
10
0 0 2.000 4.000 6.000 8.000
Net E
nrol
m. R
atio
Pre
prim
ary,
age
s 3,
4 a
nd 5
GDP per capita (constant US$ year 2000)
Source: Transmonee databaseNote: four countries are absent for missing data: Slovakia, Georgia, Turkmenistan and Uzbekistan. Slovenia is an outlier with a much higher per capita income than other countries; it has been left out of the figure.

36
As one would expect, the regression line goes up. In other words: the richer a country, the higher its enrolment level for preschool education. So at first sight, this supports the argument that Macedonia is “excused’ for its low level of preschool enrolment because of its low income per head of the population. However, figure 9 allows us to assess the position of individual countries against this general tendency. In the figure, we find Macedonia – the red dot – below the regression line. This means that is performance is worse that that of most of the other countries, even if we take the low income level into account. Moldova and Ukraine – the two green dots in the upper left corner – have even lower income levels than Macedonia but much higher enrolment levels. Kyrgyzstan and Tajikistan – the two yellow dots in the lower left corner – fare worse than Macedonia but are extremely poor. Only Azerbaijan and Bosnia and Herzegovina – the two black dots below Macedonia – do really perform worse than Macedonia, having equal income levels but even lower enrolment ratios.
One could argue that figure 9 contains two distinct groups of countries: the seven relatively rich countries in the upper right corner – Czech Republic, Hungary, Poland, the Baltic states, Croatia – versus the countries on the left hand side, with a per capita income of 3000 US$ or lower. In such cases, drawing a regression line can be a bit misleading. However, if we would focus on just the latter group, the conclusion for Macedonia would be even more pronounced: it is actually among the richer countries within that smaller group, but has one of the lowest enrolment ratios.
Having underscored the urgent need to expand ECD programs in Macedonia, and having seen that other countries in the region demonstrate that such an expansion is actually feasible, we now examine the community based ECD centers that were created in Macedonia about ten years ago in an attempt to overcome the disparities described above.

37
ECD Centers
In addition to the formal preschool system of Kindergartens that was analyzed in the previous chapters, Macedonia also has a system of alternative centers for
early childhood development. We could refer to these as non-formal, in the sense that they are not, or not yet, part of the official state system. Another term, often used in the literature on ECD, could be “community-based ECD Centers”. Both these terms, however, have their objections. The new ECD Centers may not forever remain outside the state system, and whether they should rely entirely on communities is open for debate. Thus, we shall use the more neutral term “ECD Centers” – or simply Centers - in this chapter and throughout the further report.
Although the ECD Centers seem less important than the formal KGs in terms of total enrolment – they nowadays welcome about 800 children, against some 17,500 in the KGs – they are a critical factor in the innovation of Macedonia’s architecture for ECD. As in many other countries, the Centers deliberately cater for other groups than the more formal institutions, and in doing so they have different characteristics, offer different services, and operate usually in more cost-effective manner. In Kyrgyzstan, for example, non-formal ECD is growing rapidly, challenging the entire preschool system to innovate (van Ravens, 2010c). The experience in Kyrgyzstan is that the older and the new institutions are not enemies, but components of a new and more balanced system, in which both are indispensible.
If Macedonia’s system for ECD is ever to reach all children in the country, it will at least partly have to be through new, innovative and cost-effective programs. This does certainly not imply that the existing ECD Centers will have to be copied – they
4
38
are not perfect – but it is beyond any doubt that we can learn important lessons from the experience with these Centers.
This is the objective of this chapter. Mindful of the advice to build on existing structures as much as possible (Engle et al, 2007), this chapter describes the Macedonian ECD Centers in terms of their enrolment and services. Financial analysis will follow later in this report. Unless indicated otherwise, the information in this chapter comes from a recent assessment report by Nadica Janeva and her team (Janeva, 2010); from a strategic evaluation of the ECD situation in Macedonia (Janeva, 2007/2008); from information provided by UNICEF office in Skopje; and from site visits conducted in June 2010.
The objectives and functions of the ECD Centers
The creation of ECD Centers in Macedonia began in the year 2000, when the World Bank made a grant available that enabled communities to start their own Centers with the assistance of UNICEF. From the very beginning, the objective was to reach out for disadvantaged children, as there were major concerns about their low level of enrolment in formal KG and about their health and development status. At the time, Macedonia was divided in 33 municipalities – nowadays 85 - and although there was at least a KG in each municipality, the density was so low that even the traveling distance prevented many children in rural areas to enroll, not to mention their parents’ inability to pay the fee.
In the 23 most disadvantaged municipalities (of the 33), a total of 350 ECD Centers were created within a total of 196 neighborhoods, villages or hamlets. Enrolment data from the early years are lacking, but if most of the Centers enrolled about 45 to 50 children – as the remaining Centers are doing nowadays – then total enrolment in the ECD Centers must have been in the order of magnitude of 10,000 or more. This is substantial compared to the 17,500 children that are nowadays in KG. It is encouraging to know that it is possible in Macedonia to create the capacity to make a big step towards universal enrolment within just a few years. Both in a financial and in a managerial respect, the job was done boldly, so there are grounds to hope and expect that the job can be done again.
Less encouraging is the fact that many Centers could not be sustained. Most of the initial 350 Centers have been closed, and a combination of two factors seems to have

39
caused this. First, the conflict of 2001 and its aftermath made it difficult to continue the operation of the Centers. Second, the initiative lost momentum as the financial and logistical support of the international agencies was phased out: the classical story of so many development projects. Thus, it is clear that the sustainability of any new initiatives must be ensured by solid financial arrangements. Start-up costs may be (partly) covered by incidental contributions, but recurrent costs should rely only on structural contributions (e.g. from central and/or local government; from user fees). Chapter 7 will further elaborate this principle.
Having learned this lesson, we now focus on the Centers as such. As said, the Centers aimed especially at reaching out for disadvantaged and poor communities, where children not only have very limited access to formal KG, but where conditions for rearing children in the home environment are equally worrisome. As a consequence, the repertoire of activities of the Center is broader than that of the formal KGs. The following list of five core functions is based on Janeva’s recent report (2010:1):
Support the local community to identify vulnerable groups of children;
Organize activities focused on providing support to young children and their parents (italics JvR) in the community (intensive cooperation with parents);
Assist and support the parents to improve access to basic social services for their young children;
Use Early Learning and Development Standards (ELDS) to enhance early stimu-lation and child development, for better preparation for formal education and life;
Raise the awareness of the importance of ECD in the local community.
Apart from the focus on vulnerable children, the emphasis on support to parents is worth noting. Not only are parents being educated in order to better care for their children in the home environment, they are also being empowered to claim good child services. For illiterate mothers, literacy courses are provided so that they can read to their children; have better access to written information about child rearing; and become more aware of their rights and opportunities. The application of ELDS (4th bullet point) illustrates that ECD Centers, non-formal as they may be, are by no means lagging behind when it comes to using state-of-the-art instruments. In fact, in many countries this type of ECD providers tend to be more innovative than more
40
traditional providers, including the private sector (van Ravens, 2009, 2010a, 2010c). The last bullet point, too, points at a typical characteristic of ECD Centers: raising awareness. ECD Centers never come alone; they are always introduced by means of a process of community mobilization. Building this form of social capital and networks around the ECD Center is a condition for sustainability: communities and community members will only ensure the continuity of an ECD Center – financially and through in kind contributions – if there is belief in its necessity and trust in one another’s willingness to support it.
Services and enrolment in the ECD Centers
Currently UNICEF is supporting 22 ECD Centers, located in the most disadvantaged areas. The status of the other ones varies. A recent assessment on the request of UNICEF revealed that in some cases (21%) the space is no longer functional, while in other cases it is used for other purposes than ECD. But generally the conclusion was that the Centers can easily be put back into use as ECD Centers, if only financial arrangements are in place to secure the recurrent operational costs.
In April and May 2010, a more in-depth assessment has taken place in 17 of the 22 UNICEF supported Centers (Janeva, 2010). Generally, the Centers are clearly underfunded and suffer from a scarcity of learning materials, sanitary facilities, opportunities for play outside, et cetera. Municipalities take responsibility for the space but rarely contribute to recurrent costs such as salaries and materials. Site visits conducted for this report in June 2010 also revealed a mixed picture, where a more affluent community such as Bitola was more supportive to the Center than a less affluent community such as Radovish. As said, in chapter 6 of this report we will estimate what it would cost to operate an ECD Center on the condition that certain quality requirements are to be met.
For now we look at the services rendered by the Centers. The following age-wise overview is derived from the in-depth assessment.
Age 0-1. Some Centers conduct monthly home-visits.
Age 1-3. Parents gather twice a month for group sessions
Age 3-6. Children themselves come to the Centers for both individual and group learning activities. Some Centers also continue parental education for this age group.
41
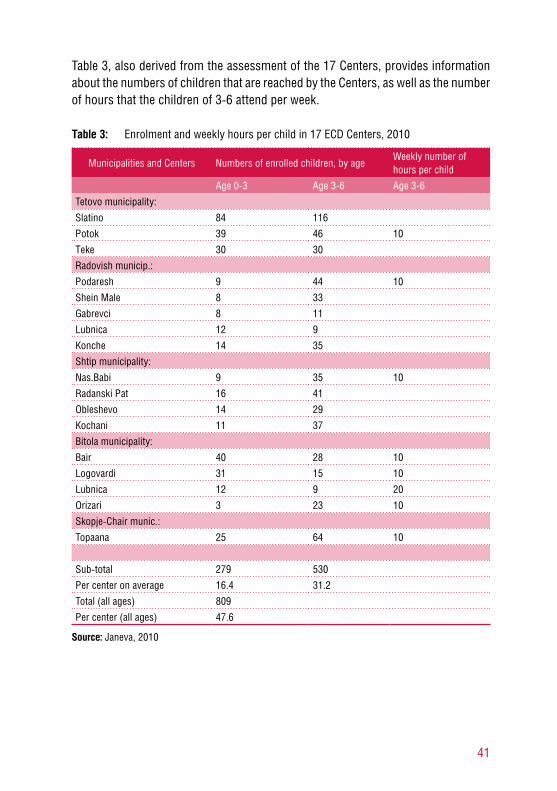
Table 3, also derived from the assessment of the 17 Centers, provides information about the numbers of children that are reached by the Centers, as well as the number of hours that the children of 3-6 attend per week.
Table 3: Enrolment and weekly hours per child in 17 ECD Centers, 2010
Municipalities and Centers Numbers of enrolled children, by ageWeekly number of hours per child
Age 0-3 Age 3-6 Age 3-6
Tetovo municipality:
Slatino 84 116
Potok 39 46 10
Тeke 30 30
Radovish municip.:
Podaresh 9 44 10
Shein Male 8 33
Gabrevci 8 11
Lubnica 12 9
Konche 14 35
Shtip municipality:
Nas.Babi 9 35 10
Radanski Pat 16 41
Obleshevo 14 29
Kochani 11 37
Bitola municipality:
Bair 40 28 10
Logovardi 31 15 10
Lubnica 12 9 20
Orizari 3 23 10
Skopje-Chair munic.:
Topaana 25 64 10
Sub-total 279 530
Per center on average 16.4 31.2
Total (all ages) 809
Per center (all ages) 47.6
Source: Janeva, 2010

42
It can be seen from table 3 that the total number of children enrolled in these 17 Centers is about 800. About one third is in the age range of 0-3 and two thirds is 3-6. On average, the Centers are welcoming 47.6 children, ranging from about 20 (Gabrevci, Lubnica in Radovish, and Lubnica in Bitola) to 85 (Topok), 89 (Topaana), and 200 (Slatino).
The number of hours that the children of 3-6 are attending is in most cases 10 per week, usually divided over 5 days. These sessions of 2 hours are held separately for the 3 year olds, the four year olds and the 5 year olds, which results in six consecutive hours of work for the teacher. Together with the activities for the under-3, the total workload is that of a fulltime job. Depending on the size of the groups, but also on the financial situation, the teachers work alone or in duos.
In practice, there is a lot of variation among the Centers in terms of the way they provide their services. This has to do with different context in which they work. In certain areas some children may live in remote villages or hamlets that are too small to run a Center in a cost-effective manner. Home-based delivery can then be a solution, reducing investment costs and combining age-groups. In Bitola, a Center would wish to purchase a vehicle in order to gather children from the various villages and hamlets. Alternatively, the regular school-bus (for primary education) could collect the younger children, at limited extra costs. A mobile ECD Center is also an option. In other cases, Centers face the problem that many parents migrate regularly to do seasonal work, either taking the children along, or leaving them with carers (e.g. grandparents) who are not always able to bring the children to the Center. All this may lead to tailor-made programming and delivery in order to suit the specific needs of specific groups. In chapter 7 we will take all these possible modalities into account, looking for a funding mechanism that is simple and allows for the flexibility that the Centers need to reach all children in their catchment areas.
For now there is one more issue to address: the striking contrast between the 2-hour program that children in the Centers receive, and the predominantly full-day program delivered by the regular KGs where only 2.1% of the children attend less than 4 hours per day in 2009 (against 6.4% in 2006). Is a program of just 2 hours per day sufficient to bring the developmental impetus that one would wish for these children?
A duration of 2 hours per day – or 10 hours per week - may be close to the limit. But a much better story can be told for half-day programs, where the teacher attends the children during about 3 hours per day – or 15 per week – and has an additional

43
one hour for preparation and interaction with parents, resulting in a half-day job of 4 hours. An international literature review has been conducted to compare the developmental impact of this model with that of a full-day programme3.1
The main conclusion of this review is that from a child development perspective, half-day programs are at least as good as full-day programs. One of the reasons is that the full-day programme of the formal KG - as it is found throughout Central and Eastern Europe and the countries formerly part of the Soviet Union - typically limits the activities that enhance child development to just a few hours in the morning. For the rest of the time, children eat, sleep or are engaged in activities that they can also undertake outside the programme. Children that attend an ECD program in the morning and spend the afternoon in a different environment – e.g. with peers, with family – benefit from variation in learning environment, which explains that some studies even found half-day programs to be superior to full-day programs. It should be repeated, that this only “works” if the environments in which the rest of the day is spent are conducive to playing, to learning, and to child development more generally. Hence the importance of support to parents (see chapter 2). Ironically, the more privileged children who now spend the whole day in KG, would have a better environment to come home to in the afternoon than the children who have no access at all….
These and other considerations are the stepping stones towards the next chapter which is the hinge point of this report. Based on the first four chapters, and faithful to current thinking about governance and finance in Macedonia, it formulates the key policy principles that could guide the expansion of ECD programs in the near future.
3 This literature review can be found in a study on preschool education in Kyrgyzstan (van Ravens, 2010c:32-34). It is based on studies from transition countries (MacLean and Orozova, 2007; Evans, 2008; Comenius Foundation for Child Development, 2009) and from OECD countries (Sammons et al, 2007; Reynolds and Temple, 2008).

44

45
Policy principles for expanding access
Fair play. This motto, highly valued in the world of sports and games, can be a useful metaphor in ECD. At micro-level, it could concern a group of children
growing up together in a village or neighborhood. For them, fair play could imply mutual respect and honesty during their interaction. In policy terms, it could imply that all of these children have equal access to playing, to learning and to development more in general. That takes us to the macro-level. Here, one could translate fair play as social justice: a fair distribution of public resources, aimed at providing essential services to all children, regardless of income, their parents’ education level, ethnicity, gender or any other socio-economic criterion.
This chapter aims at converting the idea of fair play into a more concrete set of policy principles to guide the further expansion and improvement of early childhood services in Macedonia. Obviously, such policy principles need to be in accordance with arrangements in the areas of governance and finance; it would be wrong to simply adopt and adapt a financial arrangement for ECD from another country and implement it just like that.
This means, however, that we need to jump on a riding train. Macedonia’s arrangements for governance and finance are in motion. Leaving behind the systems from before the transition years, Macedonia is heading towards a new future. Decentralization and fiscal innovation are likely to have a central place in that new future, but exactly what the new arrangements will look like is not yet entirely clear.
5

46
Fortunately, we can rely on two excellent reports issued by the UNDP Office in Skopje (Martinez-Vasquez, Timofeev and Feruglio, 2007 and Cyan, Martinez-Vazquez and Timofeev, 2009). Addressing fiscal decentralization in general, the first of the two reports formulates a number of broad principles that have inspired this chapter. The second report – “Financing equitable service delivery for all citizens” - provides some particularly useful tools for a financial arrangement for universal access to ECD programs from which this report will benefit.
“Business as usual” is no option
The data in figure 10 for Macedonia are based exclusively on the 35 municipalities that receive so-called block grants for KG. A majority of 43 municipalities have no KG and receive no money at all, while a minority of 6 municipalities receive an allocation grant, which is always smaller than a block grant. For each of the 35 municipalities receiving a block grant, the total amount of money per year (data from the Ministry of Labor and Social Affairs) has been divided by the total number of enrolled children in 2008 (data from State Statistical Office). This results in the state subsidy per child per year for each municipality.
Figure 10: Comparison of full-day KG unit costs as % of pcGNP in five countries
Armenia Kyrgyzstan Macedonia Moldova Poland
50,0
45,0
40,0
35,0
30,0
25,0
20,0
15,0
10,0
5,0
0,0
Source: see text below.
This indicator is shown in figure 11 (below) as the red bars. Apart from the two high outliers to the right (Krushevo and M. Brod), the variation is limited. Most of
47
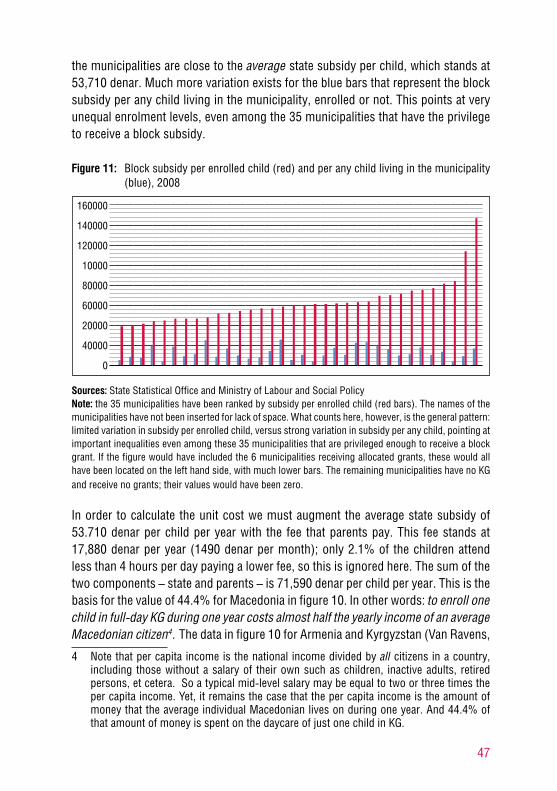
the municipalities are close to the average state subsidy per child, which stands at 53,710 denar. Much more variation exists for the blue bars that represent the block subsidy per any child living in the municipality, enrolled or not. This points at very unequal enrolment levels, even among the 35 municipalities that have the privilege to receive a block subsidy.
Figure 11: Block subsidy per enrolled child (red) and per any child living in the municipality (blue), 2008
160000
140000
120000
10000
80000
60000
20000
40000
0
Sources: State Statistical Office and Ministry of Labour and Social PolicyNote: the 35 municipalities have been ranked by subsidy per enrolled child (red bars). The names of the municipalities have not been inserted for lack of space. What counts here, however, is the general pattern: limited variation in subsidy per enrolled child, versus strong variation in subsidy per any child, pointing at important inequalities even among these 35 municipalities that are privileged enough to receive a block grant. If the figure would have included the 6 municipalities receiving allocated grants, these would all have been located on the left hand side, with much lower bars. The remaining municipalities have no KG and receive no grants; their values would have been zero.
In order to calculate the unit cost we must augment the average state subsidy of 53.710 denar per child per year with the fee that parents pay. This fee stands at 17,880 denar per year (1490 denar per month); only 2.1% of the children attend less than 4 hours per day paying a lower fee, so this is ignored here. The sum of the two components – state and parents – is 71,590 denar per child per year. This is the basis for the value of 44.4% for Macedonia in figure 10. In other words: to enroll one child in full-day KG during one year costs almost half the yearly income of an average Macedonian citizen4.1The data in figure 10 for Armenia and Kyrgyzstan (Van Ravens,
4 Note that per capita income is the national income divided by all citizens in a country, including those without a salary of their own such as children, inactive adults, retired persons, et cetera. So a typical mid-level salary may be equal to two or three times the per capita income. Yet, it remains the case that the per capita income is the amount of money that the average individual Macedonian lives on during one year. And 44.4% of that amount of money is spent on the daycare of just one child in KG.

48
2008a and 2010c), for Poland (Comenius Foundation for Child Development, 2009) and for Moldova (Orivel, Ana and Tuhari, 2007) have been calculated in various ways. Their average is 19.3%, which is less than half of the 44.4% of Macedonia.
Based on the information above, it is possible to provide a rough indication of what it would cost to provide access to all children of four and five years old in a business as usual scenario: The annual number of newborns in Macedonia has stabilized at about 22,500; Already enrolled are 21% of the 4 year olds and 24.5% of the 5 year olds (table
2); So the number of excluded 4 and 5 year olds is: (79 + 75.5) / 200 * 22,500 * 2
= 34,763; Multiplying this number of children with a unit cost of 71,590 denar results in
an extra annual cost of about 2.5 billion denar (more precisely 2,488,683,170 denar) which is roughly 40 million euro;
From this, one could subtract the fee paid by the parents, but it should be kept in mind that many of the families who are nowadays excluded from KG will not be able to pay a substantial fee, so the scope for reducing the 2.5 billion denar by charging fees is limited.
Half-day programs: better and cheaper
A totally different picture emerges if one looks at the option of universalizing access for the 4 and 5 year olds by means of half-day programs of about 3 hours per day, without meals and sleeping facilities. While chapter 6 of this report will calculate the unit cost of such programs in detail for Macedonia, the experience from other countries in the CEE/CIS region suggests that the half-day unit cost are about four times lower than the unit costs of full-day KG, as table 4 shows.
Table 4: Unit cost differences between full-day and half-day programs in three CEE/CIS countries (2007/2008)
Currency Unit cost full-day Unit cost half-day Ratio
Armenia US$ 216 34.2 6.32
Kyrgyzstan Som 6010 1670 3.60
Poland Zloty 4500 1200 3.75
Sources: Van Ravens, 2008a and 2010c, and Comenius Foundation for Child Development, 2009

49
So instead of a price tag of 2.5 billion denar, we would now be looking at an amount in the order of magnitude of 0.6 billion denar. Hypothetically, this amount can even be reduced further if the present enrollment in full-day KG would also be transferred to half-day programs. In fact, even the present KG budget of 1,100 million denar would be sufficient to reach more than 60,000 children by a half-day program5.2This is more than the 45,000 children of four and five years old that live in Macedonia today, and not even far from the 67,500 children of three, four and five.
Given the fact that half-day programs are just as good as - if not better than - full-day programs when it comes to child development (as we saw in chapter 4), there is a very strong case indeed to promote half-day programs. It’s better and it’s cheaper.
The problem is, of course, that full-day programs have a second function, in addition to child development. This concerns the fact that they free up parents – and in some countries the older siblings – from the need to care for the children, allowing them to go to work, to study, or undertake leisure activities. This brings us to the heart of the political issue: is that second function – let us call it the custodial function as distinct from the developmental function – a key social function that justifies substantial public spending? Or is it not?
There are two situations in which the answer is to this question would be positive:
In very poor countries, both parents often need to generate income in order to survive; the same goes for single parents. If they cannot afford daycare, the result is that older siblings are burdened with the care for their younger brothers and sisters, which prevents them from attending school. Under such circumstances, countries may support basic full-day programs from the public purse. However, these circumstances do generally not apply to the families that benefit from the formal KG in Macedonia today. Chapter 3 pointed at the fact that the KGs’ clientele are mostly urban and well-educated people in the upper part of the income distribution. In fact, Janeva, Petroska-Beska and Eminovska (2009) report that 75% of the children in the nurseries and 72% of the chil-dren in the other KG-groups are from double-income families. In a country with the high unemployment6,3where countless families do not even have a single
5 The total amount of money spent on block grants is 1,080,000,000, and the amount for allocated grants is 20,000,000 denar. Together this makes 1,100,000,000 denar (Official Gazette of the Republic of Macedonia, No. 114/09). If we divide this by one fourth of the full-time unit cost of 70,000 denar, the outcome is 62857 children.
6 The unemployment rate stood at 33.8% in June 2010, which was at that time the highest in the world. Source: http://www.balkaninsight.com/en/main/news/29047/
50
income, double-income families are an extremely select group indeed. They could easily afford to pay a higher fee, if not the full cost price. In many other countries, they are typically the clientele for private daycare.
The second situation that would justify public funding for day-care facilities would be scarcity on the labor market. If employers would be so short of per-sonnel that it impedes economic growth, and if their own efforts to provide daycare would be insufficient, public financial support to daycare could facili-tate non-working parents – often mothers - to accept a job and hence serve the common goal of economic growth. Again, this circumstance does not occur in Macedonia today. As said, Macedonia has high unemployment rate, and even providing one job per family is a major challenge. Only if the provision of a second job per family becomes a realistic option, and if that second job would still not enable the family to pay for daycare, there would be a case for public support.
The conclusion is that under the present circumstances, the child development function should be prioritized over the custodial function. There are no arguments to heavily subsidize the custodial function for a rich minority of the population if the child development function is entirely unfulfilled for the poorer majority. That is not fair play.
The implication of this conclusion is that in as far as public funding is concerned, the further expansion of ECD programs should be concentrated in half-day programs for the time being. Another implication could be that if people want full-day care they should pay for whatever is added to that half-day program: meals, sleeping facilities and additional activities. These “extras” would be a private affair, as they are in many other countries. Obviously, this principle of “paying for the extras” has implications for the KGs themselves and for the parents that presently use the KG. We first discuss the KGs.
Implications for the KGs
The principle of “paying for the extras” does not necessarily affect the way in which existing KGs operate. The public part (the half-day child development program) and the private part (the extras) can be offered in combination. There is no reason why one and the same institution could not offer the half-day child development program and the full-day care in one integrated program. In essence, this is what KGs have

51
always done. What changes is the flow of money: the funding for the half-day child development program comes from the public purse and possibly from a small user fee, while the extras are paid directly by parents (or their employers).
In fact, the KGs could become busier than they ever were as a result of the proposed policy. There will be a massive demand for half-day child development programs. Partly this demand would be met by an expansion of ECD Centers, but it is very likely that existing KGs will obtain a share of this new market. Some of them may add a few half-day groups to their existing activities, others may replace (a part of) their daycare activities by child development activities. In both cases, the work of the KG staff will become more interesting and more rewarding. Some staff will stop changing nappies and start educating children. Some others may start educating adults.
It can be envisaged that existing KGs will assume the function of resource center, supporting the new ECD Centers. The latter will be strongly in need of supervision, in-service training, and up-to-date curricula and materials. KGs are very well positioned to fulfill these functions. Finally, the rapid expansion of ECD programs in Macedonia may generate a big demand for pre-service training and this may partly become “new business” for the KGs as well; for instance, they could serve as training sites for interns from the pedagogical faculties.
More in general: if it would be decided that the half-day program can be delivered by ECD Centers and existing KGs alike, there is no reason to exclude other potential providers, such as schools, community centers, private KGs and home-based facilities. The policy principle would then be that an accreditation is a condition for receiving the funding for the half-day program, and that any institution – public, private or faith-based - that is willing and able to meet the requirements to obtain the accreditation has access to this “level playing field”, as economists would call it. There should be no exclusion at forehand. KGs could play a role in the accreditation system, for instance participate in accreditation.
Implications for present users of full-day KG
Various people who have been consulted for this report have emphasized that an overnight introduction of the principle of “paying for the extras” for existing KGs would meet with fierce resistance from the present clientele of the KGs. The latter see access to full-day programs as a right, and may not even be aware that the fee

52
they pay is but a part of the cost price. The fact that comparable groups in other countries pay a much higher price is of no relevance to them; they simple don’t want to lose their privilege.
This poses an important dilemma. On the one hand, having wealthy people pay a fair price for services that are essentially private would be a good example of social justice and it could free up an important part of the public resources needed to reach every child with a half-day program. In fact, it even would be sufficient, as we saw above (in the text below table 4). On the other hand, a plan that is bound to meet with fierce resistance is strongly at risk of failing. This report cannot resolve this dilemma, since it is essentially political: is there political will to overcome the resistance or not? What this report will do, is to be flexible and present a number of scenarios, each of which accommodates a certain political outcome. For this, we use an instrument that we call the “dynamic funding mix”.
The dynamic funding mix
Funding arrangements for ECD rely often on multiple sources of money. Based on this chapter and on the literature on community-based ECD, we identify five sources. Together, the five would need to mobilize the required resources, but their “mix” may vary. As long as their respective shares add up to 100%, any mix will do. Moreover, the mix may change over time: one or two contributors may gradually withdraw while others become more prominent. Different mixes represent different scenarios. This will be an issue for the next chapter. Here we discuss the five sources.
Government. If we accept the half-day program for child development as a core social service – like other forms of education, healthcare, et cetera – then financial support from the government should be there. It would be an entitlement. Exactly how the intra-governmental responsibilities (between central government and municipality) are divided depends on the further developments in the area of fiscal decentralization in Macedonia, which is difficult to foresee at this stage. But in general it is clear that government should contribute. The challenge is to find additional resources (from the four sources below) to lessen the burden for government.
Means-tested fees. The experience with ECD Centers in Macedonia and elsewhere tells us that parents are very often willing to contribute both

53
financially and in-kind to the sort of program for which this reports advocates. So even though charging a fee for a child development program is not entirely consistent with the fact that primary education and many health services are free, we could still consider the introduction of a user fee in order to lessen the financial burden for government. As time goes by, and Macedonia’s state financial situation improves, one could imagine that the fee be reduced. Perhaps it will be abolished one day.However, even if parents are willing to pay a fee they may not always be able to do so. Thus, a user fee may lead to the exclusion of the poorest children, who usually need the service most. A common solution is to apply a means-tested fee: dependent on parental income. This can be done either in very sophisticated manner, by defining multiple income categories and charging a different fee for each of them (a sliding scale). Or we can keep it simple by proposing to waive the fee entirely for the poorer families, and by charging the same fee for everybody else (as some ECD Centers already do). This report will follow the latter option, keeping in mind that more refined schemes can be developed in the further elaboration of the plans proposed in this report.
Efficiency gains in KGs. As we saw earlier in this chapter, the unit cost of full-day KG is 44.4% of per capita income, whereas in four other CEE/CIS countries it is 19.3% on average. Janeva, Petroska-Beska and Eminovska (2009) found a possible explanation for the high costs in Macedonia in wasteful expenditure such as (i) overstaffing7,4(ii) the provision of excessive quantities of food, and (iii) the inclusion of “ghost-children” in financial reporting8.5Zafeirakou (2006:34-35) reports similar irregularities. It seems fair that the KGs reduce their expenditure and that the efficiency gains be available for the expansion of half-day programs.
A gradual introduction of the “pay for the extras” principle in existing KGs. As said, raising the fee for the existing full-day KG program is a politically sensitive issue. Yet it would be inconsistent with widely accepted principles of social
7 An example is the appointment of unnecessary support staff such as a fulltime adminis-trator in a KG with only a few dozens of children. In 2008, the ratio of pedagogical staff to children was quite normal at 1:19.6, but the overall staff to child ratio (also including the support staff) was 1:10.8. This implies that there were almost as many support staff as pedagogical staff. Source of the figures in this footnote: State Statistical Office, Statistical Review No. 2.4.9.02/614.
8 Fictive children – i.e. children who do not attend KG or who do not even exist - are re-ported to the authorities as being enrolled with a view to increase the grant that the KG receives.

54
justice not to ask privileged groups to give up at least a part of their privileges to support a process of service expansion for groups that are presently excluded from essential services. Exactly how large this contribution should be is up for debate, as is the case for the entire funding mix.
Private sector. Various roles can be played in ECD by private actors. They can be providers (private KGs); they can offer in-company facilities; they can subsidize their employees, making the KG-fee affordable. But more substantial private contributions to ECD are usually made under the banner of Corporate Social Responsibility (CSR). Feeling responsible for the well-being of children, companies can make substantial contributions be it at local level, national level, or even international level. There is a preference, however, to use such contributions to cover initial costs (e.g. capital investment in classrooms) rather than recurrent costs. The latter should be secured from more structural sources, such as governments, communities and families.
Summary of this chapter
The set of policy principles developed in this chapter can be summarized as follows:
In as far as government policy is concerned, the further expansion of ECD will be in half-day programs, focused on child development. This is the core public service. It’s an entitlement.
In as far as there is demand for an expansion of daycare, this is essentially a private affair. In principle, parents will pay for the extras such as meals, sleeping facilities and additional activities. To what extent the fee for daycare in existing KGs will be raised, is essentially a political matter, but it would be fair from a social justice point of view.
Accreditation is a condition for receiving funding for the delivery of the half-day program. But there is a level playing field. Any institution that meets the requirements can obtain the accreditation: public or private; existing or new; and for every child.
Funding will come from a dynamic mix of five sources: Government Means-tested user fees

55
Efficiency gains in existing KGs Raising the fees for full-daycare programs in KGs Private sector
The following two chapters will elaborate this set of policy principles. Chapter 6 estimates the costs of the proposed policy, while chapter 7 demonstrates that it can be funded in a sustainable manner.

56

57
The costs of universal access
at age 4 and 5
Can the government and citizens of Macedonia structurally afford universal access of all four and five year olds to half-day child development programs?
To answer this question, we must first have a fairly good estimation of what this would cost. We use an approach suggested by the UNDP Office in Skopje.
Presently, government resources for ECD are merely distributed on the basis of the existence of a physical facility (Martinez-Vasquez, Timofeev and Feruglio, 2007:vii) rather than people’s needs. This leads to a clear anti-rural bias (ibidem), and, almost by implication, an anti-poor and anti-minority bias. This outdated approach should be replaced by the use of per client expenditure norm(s) (Cyan, Martinez-Vazquez and Timofeev, 2009:iv). This means that for every client – in our case for every four or five year old child – a certain amount of money should be made available to cover (a part of) the real costs of the service. The formula proposed by the UNDP is:
Exp-i = c-i * Norm * p-i
(Cyan, Martinez-Vazquez and Timofeev, 2009:11) in which: Exp is total expenditure by government for the service in question c is a factor or coefficient by which we multiply the norm because of special
circumstances. For instance, if the population density in a certain municipality is low, the costs may be higher than in a municipality with the average density (e.g. it may be needed to organize transport for children in remote hamlets, or it may be necessary to accept small group sizes in some places, which is more
6

58
expensive per child). If this is expected to raise the costs by 15%, then the factor c will be 1.15 for that municipality.
Norm is the per client expenditure norm, i.e. what needs to be paid per child per year
p (this stands for population) is the target group, i.e. total number of clients in a mu nicipality that need to be served. In our case this the number of children of four and five years old in the municipality that are not yet enrolled in KG
i (added to Exp, to c and to Norm) is the municipality in question. This expresses that the coefficient c and the number of clients p are specific to a certain municipality, and that total expenditure (Exp) also differs per municipality.
For this report, we have to customize the formula.
The government is only one of five sources in the funding mix. So initially we look for the total costs rather than for the total government expenditure. Exactly how much the share of the government is, will be addressed in chapter 7.
We replace “norm” by “unit cost”.
We drop the i because this report looks at long term sustainability at national level, not yet at municipality level.
Regarding the coefficients (the c), there are two relevant criteria: The population density differs strongly among municipalities and has an
important impact on costs. Hence the coefficient “c-density”. Eventually, this will be calculated separately for each municipality and will lead to diffe rentiation between municipalities in terms of both costs and funding. For the this report, we need to know primarily the cost implications at national level.
As we discussed in relation to the dynamic funding mix, the fee for the half-day program will have to be means-tested to avoid exclusion of the poorer children. Some municipalities have more poor families than oth-ers. However, this will be dealt with in the funding part of this chapter, as the fee is part of the funding, not the costing. So at this stage we will not introduce a coefficient to accommodate variation in income.
Thus, the formula becomes:
Total costs = p * unit cost * c-density
The next three sections will each address one of the three factors of the formula.

59
The target group: the number of not-enrolled four and five year olds (p)
Figure 12 shows that the annual number of newborns in Macedonia has dropped since 199891and has stabilized in recent years at a level of 22,500 to 23,000 children.
Figure 12: Number of live births in Macedonia (1998-2008)
30000
25000
20000
15000
10000
5000
01998 1999 2000 2001 2002 2003 2004 2005 2006 2007 2008
Sources: State Statistical Office and Institute for mother and child health
In its publication “Macedonia in figures 2009”, the State Statistical Office (2009:8) confirms the low dynamics of the population. Immigration (776) and emigration (751) were very much in balance in 2008. With 22,500 to 23,000 newborns, the number of four/five year olds is likely to stabilize at 22,500, which makes 45,000 for the two age cohorts together.
Of these 45,000 children, 21% of the four year olds were already enrolled in KG in 2007, as table 2 showed. For the five year olds the figure is 24.5%. It is difficult to assess if – and in which direction – these figures are going to change in the coming years. Table 1 showed that the absolute number of enrolled four year olds was on an upward trend, but the reverse was the case for the five year olds. Given the fact that no powerful policies are in the making to boost enrolment in the existing KGs,
9 The decrease has actually started earlier. In 1994, for instance, the number of live births was 33,487, though this figure concerns Macedonian children born within the country as well as abroad.

60
we assume that the enrolment among four and five year olds will on average remain at the present level. That would mean that out of the 45,000 children of four and five years old, about 22.75% (the average of 21 and 24.5) will already be enrolled, leaving 34,763 excluded children as our target group. This is the p in our formula.
Unit costs
The estimation of the unit costs of an ECD program is partly an empirical activity and partly a normative activity. Empirical, because it is always necessary to look at existing programs in the real world. But also normative, because existing programs may be over- or under-funded. It may be the case that too much money goes into a programme, as we noted with regards to the formal KGs in Macedonia in chapter 5. It can also be that not enough money is invested in programs. This is the case for the Macedonian ECD Centers.
Janeva (2010) paints a bleak picture of the state in which these Centers are today. The following quote is from page 2 of this assessment report: More than 40% of the visited premises neither have sanitary facilities, nor have minimal equipment and teaching (didactic) materials to enrich the setting where the children stay and where the activities to stimulate early learning are conducted. Educators who work in the centers, also maintain the hygiene of the centers. Activities are mainly conducted inside the premises, whereas the space outside and the yards are not used for any activities. (end of quote).
So rather than to simply replicate underfunded programs, we should estimate what the programs would cost if they meet certain standards. Many experts and practitioners that were interviewed for this report stressed the need for a legal framework for the alternative ECD programs, as the legal framework for the formal KG is irrelevant, even for the formal KGs themselves. This legal framework – ideally based on the Early Learning and Development Standards – would include standards that the programs should meet, from which we can derive standards regarding space, inventory, teacher qualifications, et cetera. On their turn, these more operational standards can be the starting point for financial norms.
In the absence of this legal framework, this report estimates unit costs in a more hypothetical manner, looking with one eye at what is there, and with another eye at what should be there.
61
Teacher salary
The main component of most educational programs is the salary of the teacher. In Macedonia, teacher salaries at this level are relatively fixed at 10,500 denar per month, or 126,000 denar per year. There is an annual increase – the more years of service, the higher the salary – but this increase is very limited at 0.5% per year. To the 126,000 we must add a levy of 11,11% for personnel tax. This is not received by the teacher but must be paid by the employer. Finally, there is the reservation that the state makes for social funds: 60% of the 126,000 denar per year. All this brings the total salary costs of the teacher to 215,460 denar per year.
Training and supervision
If the coming years will see a rapid expansion of half-day ECD programs, it will be a challenge to provide quality training to a sufficient numbers of new teachers. If all new teachers have to pass through the lengthy academic study, this may become a bottleneck to the expansion process. An additional issue is that in the regions that are most deprived of ECD programs, there are few adults who are qualified even to enter the academic study. The new teachers would have to come from elsewhere and this is usually problematic, as is the experience with educational expansion all around the world. It is often difficult to recruit teachers from elsewhere to begin with, and if they come they may have difficulty adapting to the local situation. As a consequence, there is a trend towards recruiting local people that are well-motivated but perhaps not quite strong from a strictly academic point of view. These teachers appear to fare quite well under the condition that they receive frequent refresher training and frequent supervision (van Ravens, 2008b, 2009, 2010a, 2010c). The experience elsewhere is that the costs of training and supervision amount to 15% of salary costs, which in the case of Macedonia would come down to 32,319 denar per year.
Utilities
Obviously, the costs of the utilities depend on the space. How large is it? Is it well isolated against the cold in winter? Yet, most ECD Centers are much smaller than the formal KGs and usually accommodate a group of 20 children or 10 to 15 parents. For such a space, electricity and heating tend to cost 40,000 denar per year. The costs of water are in the order of 10,000 denar per year. The money spent on cleaning, maintenance and minor repairs depends on the state of the room, but
62
generally it amounts to about 20,000 denar per year. This brings the total for utilities to 70,000 denar per year.
Material expenses
For an ECD Center, this concerns stationary; learning materials including books and posters; toys; and inventory. While stationary is purchased on a regular basis, the other materials are bought more irregularly. A common approach is to annualize these cost. This means that the price is divided by the number of years in which they can be used before they need to be replaced, in order to arrive at costs per year. For toys and learning materials, 40,000 denar per year is usually spent. For more long-lasting inventory - such as chairs, tables, desks – UNICEF has develop a standard set for 20 children and 12 parents. This set costs US$ 2,19010.72The life cycle of this inventory can be set at 10 years (Carter et al, 2008; van Ravens, 2010c), which means that on the long run, 219 US$ or 11,000 denar per year must be set aside for gradual replacement over the years. Without this reservation, we cannot speak of sustainable funding. Of course this reservation policy does not resolve the problem of how to finance the up-front investment; to this we will return below. The total annual costs for material expenses amounts to 51,000 denar.
Not included: food, nutrients, medical supply, transport
Some components that are often included in ECD costing are not included here. The argument for not including food in the costing is that the daily number of hours is kept short enough to expect that children attend the Center in between meals: between breakfast and lunch or between lunch and dinner. Nutrients and medical supplies are often part of the costs of ECD Centers that integrate learning and health care; this is less the case for Macedonia which has separate structures for healthcare. Transport costs, finally, are not included because they are addressed in the next section, where we discuss the financial implications of low population density.
10 The official price of the set is US$ 3290, but the package also includes toys, didactic materials, picture books and drawing materials. This is already included in the 40,000 denar annual replacement costs. So to avoid double counting, we subtract this fom the UNICEF package.

63
Recurrent unit costs
If we add up the costs of the teacher; the training and supervision; the utilities; and the material expenses, we arrive at 369,000 denar per year. These are the recurrent costs of one Center or any other organization that provides the half-day ECD program. We assumed that one group of 20 children can benefit at the time. In practice, this always needs to be reduced by a 10% for occasionally unused places; not every Center will always be able to fill up the group to 20. But since it concerns a half-day program, a facility can accommodate 2 groups, during five days per week. For example, the four year olds can attend in the morning (and may have a sleep at home in the early afternoon), and the five year olds can attend in the afternoon. The teacher then works 2 shifts of 3 hours each per day with the children, leaving 2 hours per day for preparation, interaction with parents, interaction with counterparts in the municipality, et cetera. Thus, the total capacity of one equipped classroom with one teacher becomes 2 x 18 = 36 children. This brings the recurrent unit costs to 369,000 / 38 = 9,711 denar (per child per year).
This outcome can be benchmarked using table 4 of this report. This table showed that half-day unit costs are roughly four times lower than full-day unit costs in three reference countries in CEE/CIS. At first sight, the outcomes for Macedonia does not seem to be in accordance with this finding: the half-day unit cost of 9,711 is seven times lower than the full-day unit cost of 71,590, not four times lower. However, two facts can easily explain away the difference. First, in the 9,711 denar we have not yet included additional operational costs related to low population density; this will be done in the next section of this chapter, and it will augment the national average costs. Second, expressed as a percentage of per capita GDP, the full-day unit costs in Macedonia are exceptionally high (44.4%) compared to those in Armenia, Kyrgyzstan, Moldova and Poland (19.3% on average) as figure 10 showed.
Initial investment
In addition to the recurrent costs, there are also initial investment costs. We touched upon this when addressing the US$ 2190 (110,000 denar) worth of inventory. Program providers need to make annual reservations for the gradual replacement of this inventory, but even if they do it does not take away the problem that at the start of a program this money needs to be made available. Banks usually do not lend to ECD Centers, and if they would it would create the problem of having to pay the interest.

64
Moreover, the inventory is but a part of the problem. The costs of a fence to create a safe environment for play outside, are in the same order of magnitude as the inventory, while installment of central heating can be much more expensive. By far the most expensive is the refurbishment of the often dilapidated buildings that municipalities make available for ECD programs. This may be a matter of millions of denars, but it really depends on the state of the building. A part of the Centers that were initiated by the World Bank and UNICEF can be re-opened against relatively low costs, but in other cases the costs will be more substantial. Finally, the extent to which municipalities are able to contribute financially, too, differs from case to case. Generally, municipalities tend to benefit somewhat from a reduction of under-collection of local taxes; the immanent increase of the VAT may also help. But there remain important differences between municipalities in terms of local economic development.
All this makes it difficult if not impossible to work with general cost estimations and general norms regarding initial investment. For these reasons, this report treats initial investment as a separate issue. It will be assessed case by case. Support will be sought from private sector and international organizations. We will return to this at the end of the next chapter on funding.
C-density
The last factor in the formula is the coefficient that will do justice to differences in population density. For its calculation we use a simulation. We reduce complexity by pretending that not the 85 municipalities of Macedonia are the locus of financing for the ECD program, but the eight regions. In reality this will of course not be the case; it is merely assumed in order to keep the exercise simple. What counts here is the calculation of the density coefficient at national level. In this regard, the outcomes are very unlikely to differ substantially from an exercise based on municipalities. Eventually, with the implementation of this plan, the exercise will of course need to be repeated for the municipalities, as there are sparsely populated municipalities in densely populated regions, and vice versa.
The basic idea is that unit costs are higher for ECD Centers located in sparsely populated areas. But some areas are more sparsely populated than others. The challenge is to find a mechanism that does justice to this variation. At the same time, that mechanism should be simple, as Centers need to have freedom to decide how exactly they use the extra financial space. Some may use it to finance transport for children, other may bring the Center to the children, using a mobile kindergarten.

65
Part of the money may go to transport costs for teachers, part of it may be used to support home-based facilities in small and isolated hamlets. It is impossible to orchestrate this from central government. Therefore, a simple top-up on the unit cost should be provided. This section proposes a way to determine this area-specific top-up. Figure 13 shows the variation in population-density for the eight regions of Macedonia, presenting also the national average.
Figure 13: Population density in Macedonia by region, 2009
Vard
ar
East
Sout
hwes
t
Sout
heas
t
Pela
goni
a
Polo
g
Nor
thea
st
Skop
je
Mac
edon
ia
350
300
250
200
150
100
50
0
Source: Regions of the Republic of Macedonia 2009. Skopje, State Statistical Office (2010a:79-93)
As expected, the capital city’s region has the highest population density, with quite a gap vis-à-vis the other regions. Vardar has the lowest value. Starting from these data, table 5 calculates the top-up for each region and the weighted average for Macedonia. An explanation follows after the figure.
The first column of table 5 presents the population density data as shown in figure 13. As Skopje region has a high population density, suppliers of ECD programs in this region need zero top-up. Therefore, Skopje serves as the reference point. So in the second column, the other regions’ values for population density have been subtracted from that of Skopje. The data in this column are the inverse of density, i.e. sparseness. Here, Vardar has the highest value, while Skopje is at zero.
The data in the column called “sparseness” have been multiplied by a factor (0.086445) that was calibrated in such a way that the outcome for Vardar is 25%.

66
The argument is that this percentage represents the extra money that ECD Centers in the most sparsely populated areas need to cover the costs of coping with distance (travel cost, school bus, et cetera). In the other regions, the percentage is lower. In Skopje it is again zero.
Table 5: Calculation of the national weighted average top-up for population density
Population density
Population sparseness
Top-up per region
Population ages 1 - 4
Top-up times pop.
Weighted average
East 38 289 25.0% 6317 157924
Southwest 51 276 23.9% 6497 155123
Southwest 67 261 22.5% 8730 196817
Southeast 63 264 22.9% 7335 167649
Pelagonia 50 277 24.0% 9546 228912
Polog 129 198 17.2% 13858 237674
Northeast 75 252 21.8% 7846 170851
Skopje 327 0 0.0% 29327 0
Macedonia 82 (19.6%) 89456 1314950 14.7%
Sources: Population density: Regions of the Republic of Macedonia 2009. Skopje, State Statistical Office (2010a:79-93). Population numbers: Estimations of the Population by Sex and Age, by Municipalities and by Statistical Regions, 2009. Skopje, State Statistical Office (2010b: 66-67)
The average top-up for Macedonia is 19.6% (bottom row) but this is the un-weighted average, hence the brackets. In order to arrive at the weighted average, the values in the column called “top-up per region” are multiplied by the numbers of children aged 1 to 4, as these are the children who will be our target group in the coming years. The outcomes of this multiplication are added up and divided by the total number of children of 1 – 4 in Macedonia. This gives us the national weighted average: 14.7%. This is much lower than the un-weighted average of 19.6% because, obviously, relatively many children live in the more densely populated regions of Skopje and Polog.
67
An average top-up of 14.7% means that c-density is 1.147.
Total costs
We can now complete the formula that has guided this chapter:
Total costs = p * unit cost * c-density
This becomes: 34,763 * 9,711 denar * 1.147 = 387,208,266 denar per year.
Rounded off: for 387 million denar per year Macedonia can provide a half-day ECD program to all the children of four and five years old who are not in KG.

68
69
Financial sustainability
In this chapter we look at ways to cover the costs requirements. First we address the recurrent total costs of 387 million denar per year, then the initial investment
costs.
The dynamic funding mix
One of the policy principles developed in chapter 5 is that the costs of the half-day ECD programs be shared among five sources, and that the mix may change over time: Government Means-tested user fees Efficiency gains in existing KGs Raising the fees for full-daycare programs in KGs Foreign donors and private sector
For sustainability reasons, the foreign donors and the private sector are assumed to contribute to the initial investment, not the recurrent costs; this will be discussed in the last part of this chapter. Of the remaining four sources, we first discuss the user fees; the efficiency gains in KG; and the full-day fees in KG. Finally we look at what is left for the government to cover, in various scenarios.
7
70
Means-tested user fees
In the presently functioning ECD Centers, parents often pay a fee of 400 denar per child per month. On an annual basis, this would be some 5,000 denar. This is already a substantial share of the 9,711 denar unit cost. However, many parents cannot afford this fee, and for them the fee is waived. In some Centers in particularly disadvantaged areas, practically no family pays the fee. This means that it is absolutely crucial to have a nationally agreed – and legally formulated – policy concerning fee reduction and fee waiving. Families should not have to wonder how much or whether they have to pay. There should be clear criteria and it should not differ from municipality to municipality.
In chapter 4 (on page 37) we noted that various possibilities exist to elaborate such a fee policy. They range from a complex sliding scale with multiple fees for multiple income brackets, to a simple dichotomy whereby some pay the entire fee and others pay no fee. For this report, we elaborate just the latter option. A sliding scale system may eventually be preferred, but it does not necessarily lead to a different funding mix.
Concretely, the government could transfer a vertical subsidy to the municipality for every enrolled child, and this per capita subsidy will be 400 denar per month higher for every child for whom the fee is waived. The result is that it makes no difference for the ECD Center and the municipality whether the child is from a poor family or not. At the end of the day they receive the same amount for every child, since waived fees are compensated in the per capita subsidy. The question then is, of course, what the criterion is for waiving or not waiving the fee. It has to be a straightforward criterion, and it should not be possible to cheat.
In a slightly different context, Verme (2008:8) proposes the participation in Social Financial Assistance (SFA) schemes as a criterion for access to a certain entitlement. However, this raises two questions. First, as Verme notes elsewhere (2008:5), half of the people receiving SFA are not poor. We may add that the reverse – exclusion of people who deserve to be included – may occur as well, at least to some extent. Second, the numbers of people receiving SFA do not correspond with the number of people under the poverty line. In October 2007, 62,997 households were receiving SFA, comprising a total of 219,063 family members (Ministry of Labor and Social Policy, 2008:25). This was about 10% of the total population. The map in figure 14 shows that the highest percentages of beneficiaries (over 15%) are found in the richer regions Skopje and Polog. In the more remote areas, the participation is below 7.5%.

71
Figure 14: Recipients of social benefits age 18 and over, by region, 2008
Number of recipients of social financial benefit aged 18 and over, in %
Republic of Macedonia
Total number of recipients of social financial benefits aged 18 and over, 2008
> 15.0 10.1 - 15.0 7.6 - 10.0 <= 7.5
Pelagonia
Southwest
East
Northeast
Vardar
Skopje
Southwest
Polog
Source: copied from Regions of the Republic of Macedonia 2009a. Skopje, State Statistical Office (2010:20)
The poverty rate, however, was close to 30% in 2007. This is three times higher than the coverage of the SFA. Among families with children – our target group – the poverty rate was even higher, at 48.5% (Pereznieto and uzunov, 2008)110.1Indeed, the criteria for the SFA (Ministry of Labor and Social Policy, 2008:23) are such that it is possible, for instance, to be prevented to participate in the SFA for having a small livelihood, even if the income from that livelihood is so low that one is still considered poor. This is likely to be the case for many poor farmers in the remote areas, as the map in figure 14 suggests. Moreover, there are other benefits – e.g. for disability – that have priority over the SFA; this, too, may partly explain why the poverty rate is so much higher than the SFA coverage.
The best way to handle the discrepancy between SFA coverage and poverty rate in this report is to use it for the creation of two variants: one in which the participation in the SFA is the more stringent criterion for having the fee waived, and one in which living under the poverty line is the less stringent criterion. (The latter criterion will be more difficult to administer).
11 To be precise, the overall poverty rate rose from 49.3% in 2002 to 66.6% in 2005, and then dropped to 48.5% in 2007. The poverty rate for families with children stood at 29.4% in 2007 (Pereznieto and Uzunov, 2008).

72
To calculate the percentage of children for whom the fee will be waived, we argue as follows for the first variant – the one in which reception of the SFA is the criterion: Number of SFA beneficiaries as share of total population: 10% Share of 4 and 5 year olds enrolled in KG: 23% Number of SFA beneficiaries with children in KG: negligible The likely distribution is as in table 6:
Table 6: Distribution of 100 children regarding KG and SFA
In KG Not in KG Total
In SFA 0 10 10
Not in SFA 23 67 90
Not in SFA 23 77 100
So out of a 100 children, 77 are not in KG and will be enrolled in a half-day program. Out of these 77 children, 10 are in the SFA scheme. This is 13% of our target group. We round off to 15% as the poorer families have more children on average.
For the children living under the poverty line the argumentation is similar: Under the poverty line: 48.5% of all families with children The number of children that live under the poverty line but are enrolled in KG is
small, but not negligible, based on KG enrolment data The likely distribution is as in table 6:
Table 7: Distribution of 100 children regarding KG and poverty line
In KG Not in KG Total
Under poverty line 2 46 48
Above poverty line 21 31 52
Total 23 77 100
So 46 of the 77 children that are in the target group for the half-day program are under the poverty line. This is 60%. In this case it would not be good to round off upward for the higher number of children in poor families, since this is already implied in the use of the poverty rate for families with children.
A third possibility is of course to charge no fee at all. This makes a lot of sense, because it is not clear why a fee should be paid for ECD programs while access to primary and higher forms of education is free.

73
Table 8 calculates the total annual revenue from user fees under the high (15% waived), middle (60% waived) and low variant (free for all). It multiplies the percentage of children for whom a fee is paid with the total target group, and then the absolute number of fee-payers is multiplied by 12 times the monthly fee of 400 denar.
Table 8: Calculation of annual revenue from user fees under high, middle and low variant
Variant Fee waived Fee paid Target group Fee payers Revenue
High 15% 85% 34763 29549 142 mln den.
Middle 60% 40% 34763 13905 67 mln den.
Low 100% 0% 34763 0 0
Efficiency gains in existing KGs
The second funding source is the scope for efficiency gains that can be made in formal KG. Figure 10 showed that expenditure on KG in Macedonia stands at 44.4% of GNP, against an average of 19.3% of GNP in four other CEE/CIS countries. A few possible targets can be formulated. The first is to close the gap entirely and bring the 44.4% down to 19.3%. Although there is no reason why this would not be possible, it does seem very ambitious. A more realistic possibility is to halve the gap, and bring KG costs down to 31.9% of GNP. Obviously this can only be done in a long term process, but the expansion of half-day programs will also take its time. Another aim could be to reach the level of the second highest value, which is the one of Moldova. However, Moldova’s value happens to be very close to the first target of 31.9%, so this option can be disregarded. Finally one could consider halving the gap with Moldova. This results in the least ambitious target of 38.2%. Table 9 calculates the efficiency gains, once again for the high and the low variant. It multiplies the two expenditure targets (31.9% and 38.2% of per capita GNP) with the budget and divides the outcome by the present expenditure (44.4% of per capita GNP). This results in the “new budget”, which is subtracted from the old budget to get the efficiency gains.
Table 9: Calculation of efficiency gains in KG under high and low variant
Variant Exp. target Budget Factor New budget Eff. gains
High 31.9% GNP 1,100 mln 31.9/44.4 790 млн 310 mln den.
Low 38.2% GNP 1,100 mln 38.2/44.4 946 млн 155 mln den.
Source for budget:: see footnote 4 of this report
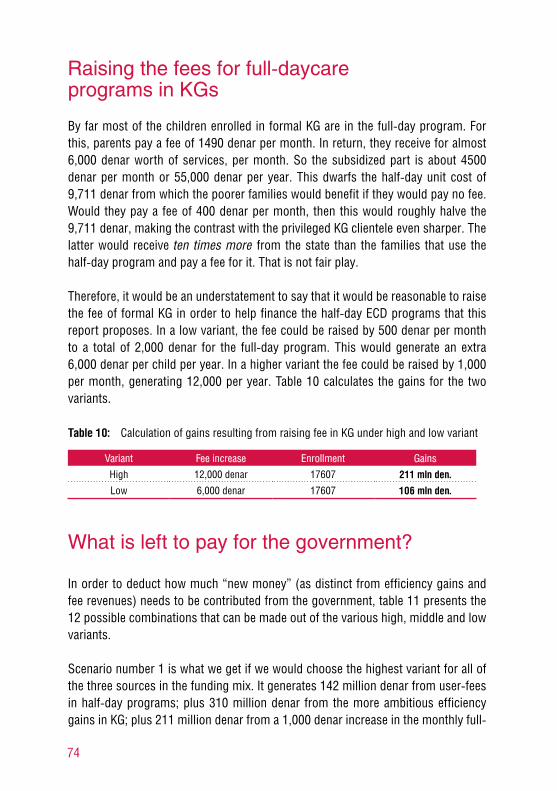
74
Raising the fees for full-daycare programs in KGs
By far most of the children enrolled in formal KG are in the full-day program. For this, parents pay a fee of 1490 denar per month. In return, they receive for almost 6,000 denar worth of services, per month. So the subsidized part is about 4500 denar per month or 55,000 denar per year. This dwarfs the half-day unit cost of 9,711 denar from which the poorer families would benefit if they would pay no fee. Would they pay a fee of 400 denar per month, then this would roughly halve the 9,711 denar, making the contrast with the privileged KG clientele even sharper. The latter would receive ten times more from the state than the families that use the half-day program and pay a fee for it. That is not fair play.
Therefore, it would be an understatement to say that it would be reasonable to raise the fee of formal KG in order to help finance the half-day ECD programs that this report proposes. In a low variant, the fee could be raised by 500 denar per month to a total of 2,000 denar for the full-day program. This would generate an extra 6,000 denar per child per year. In a higher variant the fee could be raised by 1,000 per month, generating 12,000 per year. Table 10 calculates the gains for the two variants.
Table 10: Calculation of gains resulting from raising fee in KG under high and low variant
Variant Fee increase Enrollment Gains
High 12,000 denar 17607 211 mln den.
Low 6,000 denar 17607 106 mln den.
What is left to pay for the government?
In order to deduct how much “new money” (as distinct from efficiency gains and fee revenues) needs to be contributed from the government, table 11 presents the 12 possible combinations that can be made out of the various high, middle and low variants.
Scenario number 1 is what we get if we would choose the highest variant for all of the three sources in the funding mix. It generates 142 million denar from user-fees in half-day programs; plus 310 million denar from the more ambitious efficiency gains in KG; plus 211 million denar from a 1,000 denar increase in the monthly full-

75
day fee in KG. The total is 663 million denar. Scenario 12 is made up from the lowest variants: no user fee for the half-day programs, modest efficiency gains in KG, and a modest increase of the full-day fee. The total here is 261 million denar. Scenarios 2-11 represent all the possible intermediate combinations.
For all scenarios, the total is subtracted from the overall cost requirements which are in all cases 387 million denar. The end result is the money that government needs to supplement.
Table 11: Scenarios to share the costs
Scen. User-fee Efficiency KG-fee Total Required Government
1 142 310 211 663 387 -276
2 142 310 106 558 387 -171
3 142 155 211 508 387 -121
4 142 155 106 403 387 -16
5 67 310 211 588 387 -201
6 67 310 106 483 387 -96
7 67 155 211 433 387 -46
8 67 155 106 328 387 59
9 0 310 211 521 387 -134
10 0 310 106 416 387 -29
11 0 155 211 366 387 21
12 0 155 106 261 387 126
It can be seen from table 11 that in most scenarios the outcome for the Government is negative, meaning that the other three sources actually generate more money than is required. Only in scenarios 8, 11 and 12 is the outcome positive, while in scenarios 4 and 10 are negative but close to the breakeven point.
Not surprisingly, the highest price needs to be paid in scenario 12: 126 million denar per year. This is “new money”, in that government needs to generate it. The income from efficiency gains in KG will also flow through the government’s channels, but this old money: it is already in the budget but would be gradually re-allocated. We now examine the feasibility of generating a structural amount of 126 million denar per year.
76
Feasibility analysis for worst-case government contribution
Before examining the general development of the government budget, there are two more specific issues to be addressed.
The first concerns the change in the entry age in primary education from seven to six. As a result of this, the total number of children in preschool education dropped from 37995 in 2006 to 17607 in 2007 (see table 1). This is a difference of more than 20,000 children. A large part of them were in the school preparation program, but there are also a few thousands of children who are now in primary and would otherwise have been in full-day KG. The unit costs in the latter are probably about three times higher than in the former (van Ravens, 2010c). So if the “transfer” from KG to primary concerns about 5,000 children, the gains would have been in the order of magnitude of 240 million denar, structurally12.2In their child-focused public expenditure review, Pereznieto and Uzunov (2008) wonder where this money has gone. A part of it may have been used to finance the additional costs of primary enrolment for the group that was formerly excluded from preschool education or followed the short program. Yet, a substantial amount of money must have been saved. If this money could somehow be found and made available for the half-day programs, it could cover a part of the requirement of 126 million denar in scenario 12.
The second issue concerns the individual, social and economic benefits that result from ECD programs. A strong body of research has shown that any amount of money invested in ECD, will lead to returns that are four to seven times the initial investment (Heckman, 2006). For programs targeted at disadvantaged groups, the returns can even be higher. An objection against these arguments is that no matter how high the returns are, the initial investment still needs to be made. Or instance, in as far as ECD programs lead to better health and higher tax revenues later in life, there is gap of decades between the moment of investment and that of the returns. Moreover, the returns may benefit others than the ones who make the investment. Economists would call this market failure.
Nevertheless, some returns appear quite quickly, and also within the sphere of the government who makes the investment. Reduction of drop-out in education and
12 The estimation is as follows. An individual child in full-day KG costs 6000 denar per month. If that same child would be in primary, it would only cost 2000 per month. The difference is 4000 denar. Table 1 suggests that about 5000 children of age 6 were for-merly in KG. 4000 denar * 5000 children * 12 months = 240 million denar.

77
higher learning achievement occur only a few years after early childhood. The same goes for reduced spending on high cost medical interventions during childhood, resulting from improved preventive healthcare. Finally, the salary of the teacher – the largest cost component – has an immediate impact that is often forgotten. If “ECD jobs” are created in an environment where few people have regular salary jobs at all, this has direct multiplier effects in the local community (van Ravens, 2010b) as well as savings for the state (Verme, 2008). For example, the appointment of an employee with a salary of just 6,000 denar per month leads to 55,841 denar per year worth of savings on social assistance and health insurance and to gains for the state in the form of tax income and social contributions (Verme, 2008:8).
With this in mind, we now look at ways to generate 126 million denar, knowing it is a matter of investment, not of state consumption.
Development of relevant budgets
Funding a new public service is easiest when it can be financed from the growth of a budget, rather than from the budget as it stands. If the new service would go at the cost of existing services such as schools, universities, hospitals, social assistance, then it is likely that fierce resistance will occur, both from the beneficiaries and the suppliers. This resistance is less likely – though not entirely avoidable – if the new service comes from budget growth. To examine the scope for budget growth, we first look at figure 15 that shows the development of the budgets for social protection, education and health. The rationale for choosing these three fields is merely that they are the “natural” fields for early childhood development. The three budgets serve merely as reference points; the figure is not intended to suggest that the half-day programs must be co-financed from a combination of these budgets.
Figure 15 shows that, generally, all three budgets have grown in recent years, despite some minor ups and downs. Each of the three budgets has nowadays an order of magnitude of 20 billion denar, and their aggregate was 64 billion in 2010.
The next question is: what is the scope for budget growth? In principle, budgets can grow in two ways: as a percentage of GDP, and as a result of GDP growth.
Expressed as percentages of GDP, all three budgets are in the order of magnitude of 5.5 to 6% (Pereznieto and Uzunov, 2008). The commitment of the government to raise the education budget to 6% is either nearly achieved or has been achieved already. This means that the scope for budget growth relative to GDP is limited.

78
Figure 15: Budgets for Social protection, Education and Health, 2003-2010, in billions denar
2003 2004 2005 2005 2006 2007 2009 2010
Social protection Education Health
25
20
15
10
5
0
Sources: for 2007-2010: Government data; for 2003-2006: Pereznieto and Uzunov (2008)
However, even if budgets are constant relative to GDP, they may still grow in an absolute sense. It all depends on economic growth as such. In Macedonia, the annual growth rate has been in the order of 4 to 5% ever since 1999, interrupted only in 2001-2003 because of the special situation in these years. The impact of the present global financial crisis will of course be uncertain in the coming years. But it should be kept in mind that the resource requirements for the half-day program are so limited that even a small increase in GDP will suffice to cover them. For instance: if GDP would grow by only one percent, and if the three budgets would remain constant in terms of their share of GDP, the extra fiscal space would be 640 million denar. This is five times the resource requirement of 126 million denar in scenario 12. The 640 million would even largely exceed the total costs of the policy, which are 387. So even if no fee would be charged for the half-day program; if no efficiency gains would be made in KG; and if the fee in KG would not be raised, a 1% economic growth would still suffice.
It needs to be kept in mind that economic growth is cumulative, while the resource requirements are not. In other words, if the economic growth would be 1% during for instance five consecutive years, the end result would be an increase of (more than) 5%, which roughly comes down to an extra fiscal space of more than 3 billion denar. In contrast, the 127 million denar resource requirement is structural, but
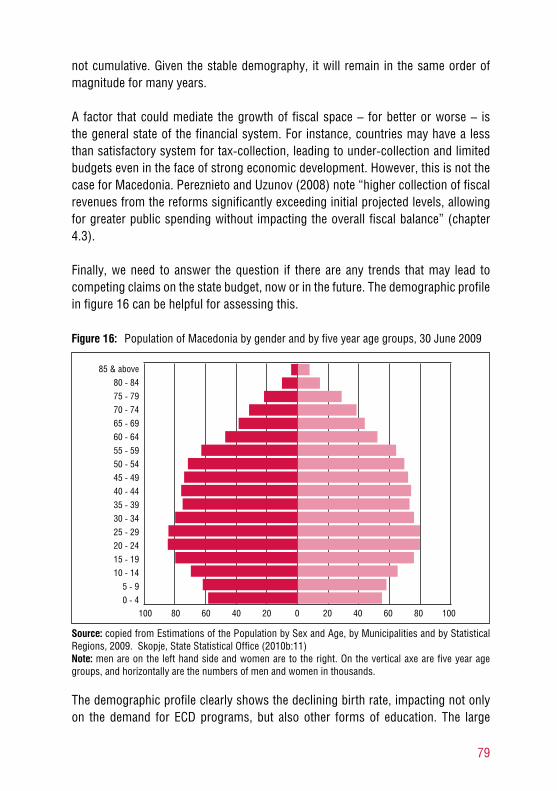
79
not cumulative. Given the stable demography, it will remain in the same order of magnitude for many years.
A factor that could mediate the growth of fiscal space – for better or worse – is the general state of the financial system. For instance, countries may have a less than satisfactory system for tax-collection, leading to under-collection and limited budgets even in the face of strong economic development. However, this is not the case for Macedonia. Pereznieto and Uzunov (2008) note “higher collection of fiscal revenues from the reforms significantly exceeding initial projected levels, allowing for greater public spending without impacting the overall fiscal balance” (chapter 4.3).
Finally, we need to answer the question if there are any trends that may lead to competing claims on the state budget, now or in the future. The demographic profile in figure 16 can be helpful for assessing this.
Figure 16: Population of Macedonia by gender and by five year age groups, 30 June 2009
100 80 60 40 20 0 20 40 60 80 100
85 & above
80 - 84
75 - 79
70 - 74
65 - 69
60 - 64
55 - 59
50 - 54
45 - 49
40 - 44
35 - 39
30 - 34
25 - 29
20 - 24
15 - 19
10 - 14
5 - 9
0 - 4
Source: copied from Estimations of the Population by Sex and Age, by Municipalities and by Statistical Regions, 2009. Skopje, State Statistical Office (2010b:11)Note: men are on the left hand side and women are to the right. On the vertical axe are five year age groups, and horizontally are the numbers of men and women in thousands.
The demographic profile clearly shows the declining birth rate, impacting not only on the demand for ECD programs, but also other forms of education. The large

80
age cohorts born before 1990 are moving out of the education system, freeing up space and resources at all levels. Of course it needs to be kept in mind that there are challenges to be faced regarding the quality of education, while there is also the need to raise enrolment ratio at the higher levels. All this will cost money. But it is unlikely that this will absorb all of the fiscal space created by the decreasing numbers of pupils.
Another implication is that physical space and human resources become available as primary schools receive diminishing numbers of pupils, even though this will not be equally the case in all regions. Using classrooms in primary school, and retraining primary school teachers to become ECD teachers are serious options. It may prevent many teachers from becoming unemployed, limiting the expenditure on unemployment benefits to some extent.
The demographic profile also forecasts the growing number of retirees in the coming years. The difference between the 55-59 group and the 60-64 group is particularly large, especially for men. This represents a new challenge for Macedonian state finance, picking up momentum about five years from now. In other words: the five years ahead of us are a unique window of opportunity to expand ECD programs, with a view to reach every child.
Initial investment
This last section of the report is about the physical space (buildings, classrooms, office-space) and the inventory that is needed to run the half-day programs. This differs essentially from the recurrent unit costs addressed above in the previous sections of this chapter. The latter need to be covered entirely by structural contributions, preferably from internal sources: contributions from government at various levels based in structural taxation, and user fees. Conversely, if the funding of recurrent costs would (partially) rely on contributions from foreign donors and private companies, the service provision would be in jeopardy once these contributions are discontinued.
This is not the case for initial investment. If a foreign donor or private company sponsors the refurbishment/construction and equipment of a number of ECD Centers and then withdraws, this physical infrastructure is still there. The service provision can be continued as long as maintenance and replacement costs have been factored into the recurrent unit cost. This we have done.

81
Hence it is financially sound to seek financial and in-kind contributions from foreign donors and private companies for initial investment. In a very rough assessment of the financial challenge, we first look at table 12 on capital investment in education for 2010 and 2011.
Table 12: Capital investment in education in Macedonia, 2010 - 2011 (in mln euros)
2010 2011 ?? Потоа ??
Higher Education 5.71 5.74 -
Primary and Secondary Education: - - -
- Dormitories 0.10 0.10 -
- equipping schools 3.59 3.59 -
- sector modernization 0.71 - -
- gymnasiums 7.90 2.50 52.40
- rehab secondary schools 3.51 3.51 -
- construction primary schools 8.37 8.37 -
Total 29.89 23.81 52.40Source: Public Investment Programme of the Republic of Macedonia, 2009-2011 (Government of the Republic of Macedonia, 2009)
The table shows that educational investment has an order of magnitude of 24-30 million euros or, roughly, 1.5 to 2 billion denar per year. The largest budget components are construction of primary schools and – for 2010 only – gymnasiums. Given the demographic situation, one would expect that these two components will decrease, and that the same may be the case for “equipping schools” and “rehab secondary schools”. It should be possible to raise a significant amount of money for ECD Centers. Further government contributions will come from municipalities making existing space available for refurbishment and equipping. Partly, this may concern the stock of ECD Centers created in 2001 that can be put into use again, partly it may concern new space. This report cannot become more specific in terms of resource requirements as this needs to be assessed at the level of the municipalities individually.
After such assessments, it will be possible to approach foreign donors (the EU with its various programs, the World Bank, various bilateral donors) and national and international private companies with requests and proposals to contribute. It is hoped that this report be instrumental in creating trust and willingness in these development partners to invest in the children of Macedonia.

82

83
Recommendations
1. In 2004, the National Strategy for the Development of Education 2005-2015 and Amendment on the Law on Children’s Protection expressed the urgent need for alternative forms of pre-school education, reaching all children in Macedonia regardless of background. Macedonia has failed to act upon these policy and legal statements for the last six years. This affects the credibility of the country’s social policy. Therefore it is strongly recommended to develop and implement a policy response as soon as possible.
2. Concretely, it is recommended to implement half-day ECD programs for children of four and five years old, to be followed by children of three years old as soon as the financial situation allows it.
3. While kindergartens are well placed to deliver these half-day programs, many new providers will also be needed. It is important that old and new institutions are not juxtaposed but are integrated in an innovated system with new checks and balances. This inspires the following recommendations.
4. The half-day program should be adopted as the core public service, accessible and subsidized for rich and poor alike. Those who wish their children to be cared for during the full day, should pay a fair price for the extra services that this incurs.
8

84
5. New institutions are needed: ECD Centers, private kindergartens, company- and home-based facilities. This requires a stringent accreditation system. Institutions that acquire the accreditation obtain the right to provide the half-day program and receive a per capita subsidy in exchange for every four or five year old child that is enrolled.
6. For reasons of sustainability, it is recommended to limit the use of contributions from foreign donors and private sponsors to covering initial investments: construction and refurbishment; inventory; programme development; initial training. Recurrent costs should allow for maintenance; replacement; and investment in programs and people.
7. The recurrent costs should be covered structurally from a combination of sources. User fees can be asked but should be waived for those who cannot afford them. Efficiency gains in kindergartens should be reinvested in the half-day programs as well. Fees in kindergarten can be raised, too. Government must cover what remains to be covered.
8. It is highly recommended to implement the proposed policy in the five municipalities where ECD Centers already exist, and in another five to be selected on the basis of needs and willingness. Kindergartens should be requested to develop the role of resource center.
85
References
Carter, J., Biersteker, L., and Streak, J., 2008. Costing center-based early childhood development programmes for children under age five: case studies from the western cape. Pretoria, Human Sciences Research Council
Cyan, M., Martinez-Vazquez, J., and Timofeev, A., 2009. Financing equitable service delivery for all citizens. Skopje, UNDP
Comenius Foundation for Child Development, 2009. A good start. How to introduce alternative early childhood education services in local communities. Warszawa, Comenius Foundation for Child Development
Consultative Group on Early Childhood Care and Development, 2008. The Four Cornerstones. To secure a strong foundation for young children. www.ecdgroup.com
Engle, P., Black, M., Behrman, J., Cabral de Mello, M., Gertler, P., Kapiriri, L., Martorell, R., and Young, M. 2007. Strategies to avoid the loss of developmental potential in more than 200 million children in the developing world. In: The Lancet, 369 (9557, 20 January, pp. 229-242
Evans, J. (Judith), 2006. Parenting Programmes: An important ECD Intervention Strategy. Background Paper for the EFA Global Monitoring Report 2007, Paris, UNESCO
Evans, J. (John), 2008. Mountain Societies Development Support Programme Kyrgyzstan. Evaluation of the early childhood development program. Bishkek, Aga Khan Foundation

86
Grantham-McGregor, S., Cheung, Y., Cueto, S., Glewwe, P,. Richter, L., and Strupp, B. 2007. Developmental potential in the first five years for children in developing countries. In: The Lancet, 369 (9555), 6 January, pp. 60-70
Heckman, J., 2006. Skill Formation and the Economics of Investing in Disadvantaged Children. In: Science. no. 5782 vol. 312, pp. 1900-1902.
Irwin, L., Siddiqi, A., and Hertzman, C. 2007. Early Child Development: A Powerful Equalizer. Geneva, World Health Organization
Janeva, N., 2008. Strategic Evaluation of the Situation in Early Childhood Development and Preschool Education in the Republic of Macedonia. UNICEF, Skopje
Janeva, N., 2010. Report on the status of the ECD Centers following the conducted field visits. UNICEF, Skopje
Janeva, N., Petroska-Beska, V. and Eminovska, E., 2009. Roma Education Inclusion Report for Macedonia. Open Society Institute, Roma Education Fund, UNICEF
Kirandzhiska, S., Panova, L., Shehu, F., Damovska, L. and Atanasovska, T., 2005. Draft Programme for the Development of Preschool Education. Skopje, Republic of Macedonia
Maclean, H. And Orozova, R., 2007. No wolves along the way: towards a national ECD model for Kyrgyzstan – UNICEF’s pilot interventions in Batken rayon. Bishkek, UNICEF Office in Kyrgyzstan
Martinez-Vasquez, J., Timofeev, A., and Feruglio, N., 2007. Fiscal decentralization in FYR Macedonia: an assessment. Skopje, UNDP
Ministry of Labor and Social Policy of the Republic of Macedonia, 2008. A review of the Social Protection System of the Republic of Macedonia. Skopje, Ministry of Labor and Social Policy
Myers, R., 2004. In search of quality of programs in early childhood care and education. Background paper for Education for All Global Monitoring Report, Paris, UNESCO
Official Gazette of the Republic of Macedonia, No. 114/09
Orivel, F., Ana, F., Tuhari, I., 2007. Republic of Moldova. Financial and Legal Analysis of Community-based Child and Family Centers. UNICEF Moldova, Chisinau
Pereznieto, P., and Uzunov, V., 2008. Child-focused public Expenditure Review. Skopje, UNICEF Country Office
87
Regalado, M., 2001. Primary Care Services Promoting Optimal Child Development From Birth to Age 3 Years: A review of the literature. American Medical Association, Chicago
http://archpedi.ama-assn.org/cgi/reprint/155/12/1311.pdf
Republic of Macedonia, 2004. National Strategy for the Development of Education 2005-2015. Skopje, Republic of Macedonia
Reynolds, A. And Temple, J., 2008. Cost-effective Early Childhood Development Programs from Preschool to Third Grade. In: the Annual Review of Clinical Psychology. 2008. 4. 109-39. Berkeley, University of California
Sammons, P., Silva, K., Melhuish, E., Siraj-Blatchford, I., Taggart, B., Barreau, S. And Grabbe, Y. 2007. Influences on children’s attainment and progress in key stage 2: social/behavioural outcomes in year 6. London, University of London
State Statistical Office of the Republic of Macedonia/UNICEF, 2007. Multiple Indictor Cluster Survey 2005-2006. State Statistical Office of the Republic of Macedonia, Skopje
State Statistical Office of the Republic of Macedonia, 2009. Macedonia in figures, 2009. State Statistical Office of the Republic of Macedonia, Skopje
State Statistical Office of the Republic of Macedonia, 2010a. Regions of the Republic of Macedonia 2009. State Statistical Office of the Republic of Macedonia, Skopje
State Statistical Office of the Republic of Macedonia, 2010b. Estimations of the Population by Sex and Age, by Municipalities and by Statistical Regions, 2009. State Statistical Office of the Republic of Macedonia, Skopje
TransMONEE database: a database operated by the UNICEF Innocenti Research institute. See: http://www.unicef-irc.org/databases/transmonee/
UNESCO, 2006. Education for All Global Monitoring Report. Strong Foundations: Early Childhood Care and Education, Paris, UNESCO
UNESCO, 2007. Education for All Global Monitoring Report. Will we make it? Paris, UNESCO
UNESCO, 2008. Education for All Global Monitoring Report. Overcoming inequality: why governance matters. Paris, UNESCO
UNICEF Innocenti Research Center, 2009. Innocenti Social Monitor 2009. Florence, Innocenti Research Center
UNICEF, 2007. Learning Achievement in the CEE/CIS region. A comparative analysis of the results from the 2006 PISA. Geneva, UNICEF

88
UNICEF Regional Office for CEE/CIS, 2007. Developmental Readiness for Schooling; Early Childhood Development in CEE/CIS. Geneva, UNICEF Regional Office for CEE/CIS
Van Ravens, J., 2008a. Scenarios for ECD in Armenia: financial and legal analysis of national preschool education programs, policies and strategies in the republic of Armenia. UNICEF Office, Jerevan
Van Ravens, J., 2008b. Expanding ECCE in Bangladesh: it can be done. An assessment of the financial feasibility of achieving Education for All goal one. UNESCO Office, Dhaka
Van Ravens, J., 2009. ECD in Nepal: expansion, inclusion, quality. A study to support the further development of Nepal’s national policy for ECD. UNICEF Office, Kathmandu
Van Ravens, J., 2010a. Holistic ECD for all in Indonesia: supporting communities to close the gap. UNICEF Office, Jakarta
Van Ravens, J., 2010b. Financing ECD in Tanzania: Cost and Financing Scenarios to Support the Implementation of the Integrated ECD Policy of Tanzania. UNICEF Office, Dar es Salaam
Van Ravens, J., 2010c. A better future for every child. Financially feasible scenarios for the equitable expansion of preschool education in Kyrgyzstan. World Bank, UNICEF and Aga Khan Foundation, Bishkek
Van Ravens, J. and Aggio, C., 2008. Expanding early childhood care and education: How much does it cost? Working Paper 46. The Hague, Bernard van Leer Foundation
Verme, P., 2008. A Proposal for a Reform of the Social Assistance System and for the introduction of Conditional Cash Transfers in the Republic of Macedonia. Skopje, Ministry of Labour and Social Policy
Walker, S,. Wachs, T., Gardner, J., Lozoff, B., Wasserman, G., Pollitt, E., and Carter, J. 2007. Child development: risk factors for adverse outcomes in developing countries. In: The Lancet, 369(9556) 13 January, pp. 145-157
Zafeirakou, A., 2006. Providing access to education and care for all children 0 to 7. Early childhood care and education in South East Europe: progress, challenges new orientations. Background paper for the EFA Global Monitoring Report. Paris, UNESCO

89

A financially feasible plan for equal access to Early Childhood Programs in the Republic of Macedonia
fair play
fair p
layA
finan
cial
ly fe
asib
le p
lan
for e
qual
acc
ess
to E
arly
Chi
ldho
od P
rogr
ams
in th
e Re
publ
ic o
f Mac
edon
ia