a focus on racial/ethnic health disparities with the tus dennis r. trinidad, ph.d., mph tus cps...
TRANSCRIPT
A focus on racial/ethnic health disparities with the TUS
Dennis R. Trinidad, Ph.D., MPH
TUS CPS NCTOHPre-Conference Workshop
June 9, 2009

Overview
• Use of the TUS to compare groups of states with differing tobacco control strategies– Messer, Pierce, Al-Delaimy, Zhu
• Examining factors associated with smoking cessation – Pérez-Stable, Messer, Emery

Comparing Smoking in States with Different Tobacco Control Strategies• In the U.S. smoking prevalence rates have been
historically higher for the African-American (AA) adult population compared to the non-Hispanic white (NHW) population
• However, in recent years, the prevalence gap between AAs and NHWs has narrowed
• Objective: – To compare trends in AA and NHW smoking between
states categorized as having three different levels of tobacco control practice in the 1990s
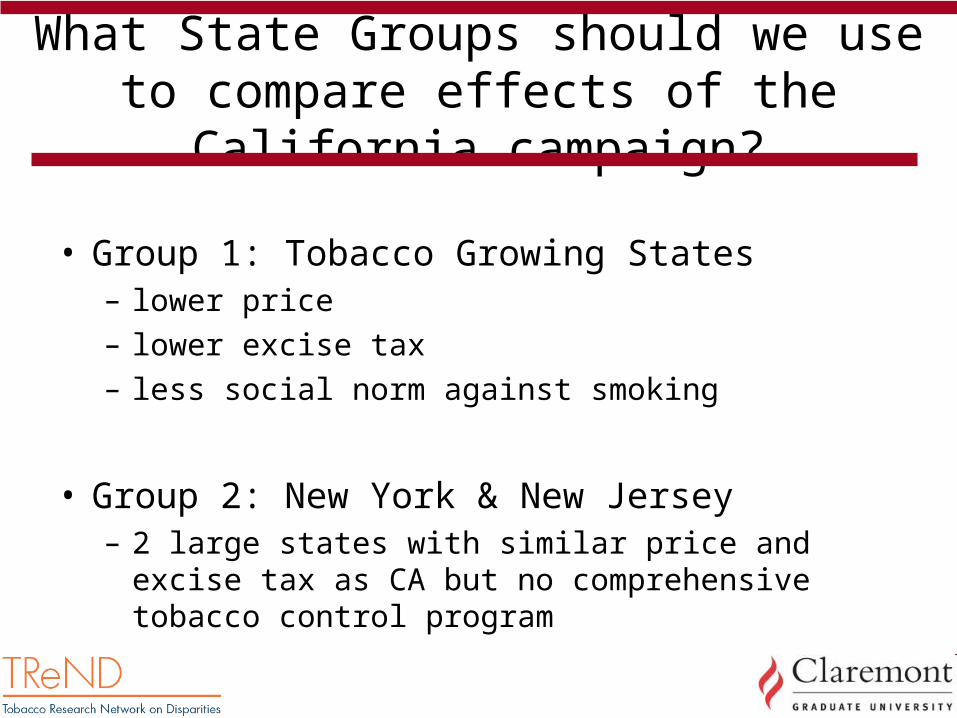
What State Groups should we use to compare effects of the California campaign?
• Group 1: Tobacco Growing States– lower price– lower excise tax– less social norm against smoking
• Group 2: New York & New Jersey– 2 large states with similar price and excise tax as CA
but no comprehensive tobacco control program

Cash receiptsExcise Tax 1994 & rank 2005
1. North Carolina $871m $0.05 (50th)
2. Kentucky $615m $0.03 (51st)
3. Tennessee $178m $0.20 (45th)
4. South Carolina $187m $0.07 (49th)
5. Virginia $147m $0.20 (45th)
6. Georgia $133m $0.37 (41st)
Top 6 Tobacco Growing StatesTobacco and the Economy

1993 (rank) 2005 (rank)
New York $0.80 (3rd) $1.50 (8th)
New Jersey $0.64 (12th) $2.40 (2nd)
California $0.59 (17th) $0.87 (21st)
Large Population States with High Excise Taxes on Cigarettes

Different Strategies across States
• California– high cigarette price– comprehensive tobacco control program
• New York & New Jersey– high cigarette price– no comprehensive tobacco control program
• Tobacco growing states– low cigarette price– no comprehensive tobacco control program

Methods
• TUS CPS from– 1992-93– 1995-96– 1998-99– 2001-02
• Examine Daily Smoking Prevalence in adults 20–64 years old– Largest contributor to lung cancer
• The respondents of TUS survey were asked: – ‘‘Have you ever smoked 100 cigarettes?’’
• Yes → Ever Smoker
– ‘‘Do you smoke cigarettes every day, some days or not at all?’’• Every day → Daily Smoker

0%
5%
10%
15%
20%
25%
30%
1990 1992 1994 1996 1998 2000 2002Year
California NY+NJ Tobacco states
Prevalence of Daily SmokingNon-Hispanic Whites, 1992-2001

0%
5%
10%
15%
20%
25%
30%
1990 1992 1994 1996 1998 2000 2002
Year
California NY+NJ Tobacco states
Prevalence of Daily SmokingAfrican Americans, 1992-2001

African Americans
0
5
10
15
20
25
30
1992-93 1995-96 1998-99 2001-02
CA
TGS
NY/NJ
Non-Hispanic Whites
0
5
10
15
20
25
30
1992-93 1995-96 1998-99 2001-02
CA
TGS
NY/NJ
% D
ail
y S
mo
ke
rs%
Da
ily
Sm
ok
ers

Results: African American Daily Smoking Prevalence
• From 1992–93 to 2001–02, in models adjusted for age, income, education, gender:– Large decline in daily smoking among African
Americans across states• ~3% decline/year
– P<0.001
– Non-Hispanic whites• ~0.5% decline/year, NY/NJ & tobacco states
– P>0.2
• ~3% decline/year, CA– P<0.001


Examination of factors associated with smoking cessation across race/ethnic groups in the U.S.
• 2003 TUS CPS Special Cessation Supplement
• Analyzed for behaviors related to smoking cessation by race/ethnicity
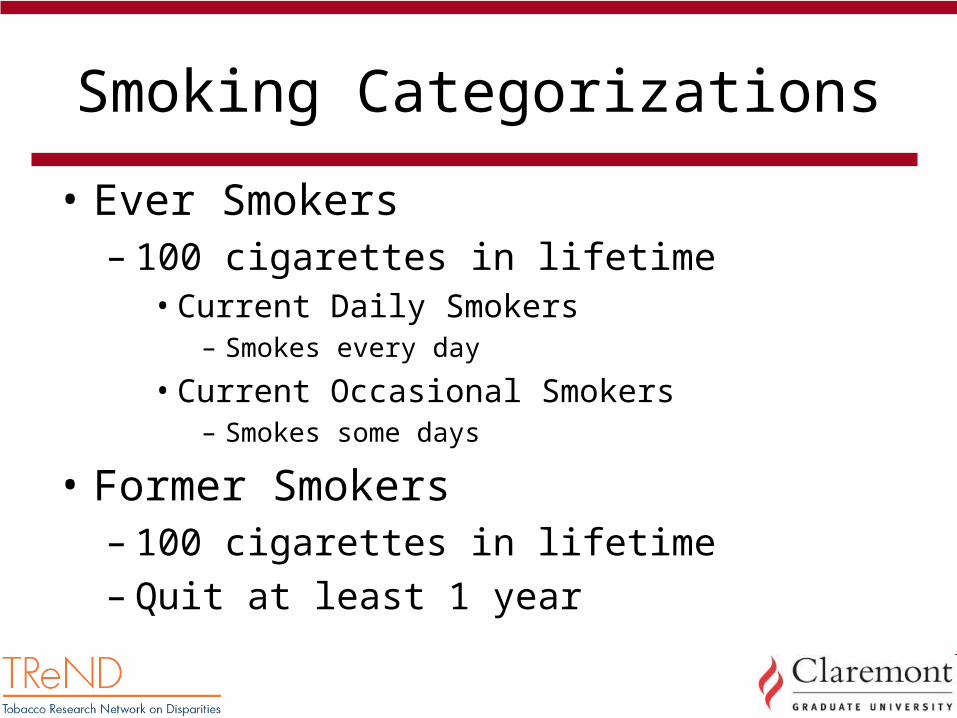
Smoking Categorizations
• Ever Smokers– 100 cigarettes in lifetime
• Current Daily Smokers– Smokes every day
• Current Occasional Smokers– Smokes some days
• Former Smokers– 100 cigarettes in lifetime– Quit at least 1 year

Population Description
11.4
4.5
12.5
71.6
AfrAm
A/PI
H/L
NHW
Mean Age
(adults 18+)
African American 42.6
Asian/PI 41.8
Hispanic/Latino 38.8
Non-Hispanic White 47.1

African Americans
32%
Quit at Least
1yr30%
Current Some Day16%
Current Daily49%
Ever Smokers

Asian/Pacific Islander Americans
22%Quit at Least
1yr40%
Current Some Day16%
Current Daily38%
Ever Smokers

Hispanics/Latinos
25% Quit at Least
1yr37%
Current Some Day 21%
Current Daily37%
Ever Smokers

Non-Hispanic Whites
44%Quit at Least
1yr43%
Current Some Day9%
Current Daily44%
Ever Smokers

Ever Smokers (100+ cigarettes in Lifetime)
• Smaller proportion of the population of racial/ethnic minorities have ever smoked compared to Non-Hispanic Whites

Ever Smokers(100+ cigarettes in Lifetime)
0
10
20
30
40
50
African American Asian/PI Hispanic/Latino Non-Hispanic White
Pe
rce
nt
Ev
er
Sm
ok
ers
Quitting Smoking
• Smaller proportion of the population of racial/ethnic minorities have ever smoked compared to Non-Hispanic Whites
– But proportions of successful quitting are smaller among African Americans (especially) and Hispanics/Latinos

Former Smokers(Quit at Least 1 Year)
0
10
20
30
40
50
African American Asian/PI Hispanic/Latino Non-Hispanic White
Pe
rce
nt
Fo
rme
r S
mo
ke
rs
Among Ever Smokers

Quitting Smoking
• Smaller proportion of the population of racial/ethnic minorities have ever smoked compared to Non-Hispanic Whites
– But proportions of successful quitting are smaller among African Americans (especially) and Hispanics/Latinos
• Such that almost 50% of African American ever smokers still currently smoked daily

Current Daily Smoking
0
10
20
30
40
50
African American Asian/PI Hispanic/Latino Non-Hispanic White
Pe
rce
nt
Cu
rre
nt
Da
ily S
mo
ke
rs
Among Ever Smokers

Quit Attempts

Stopped Smoking at Least 1 Dayin Past Year in an Attempt to Quit
Among Daily Smokers
0
10
20
30
40
50
60
70
African American Asian/PI Hispanic/Latino Non-Hispanic White
Pe
rce
nt
Qu
it 1
+ D
ay
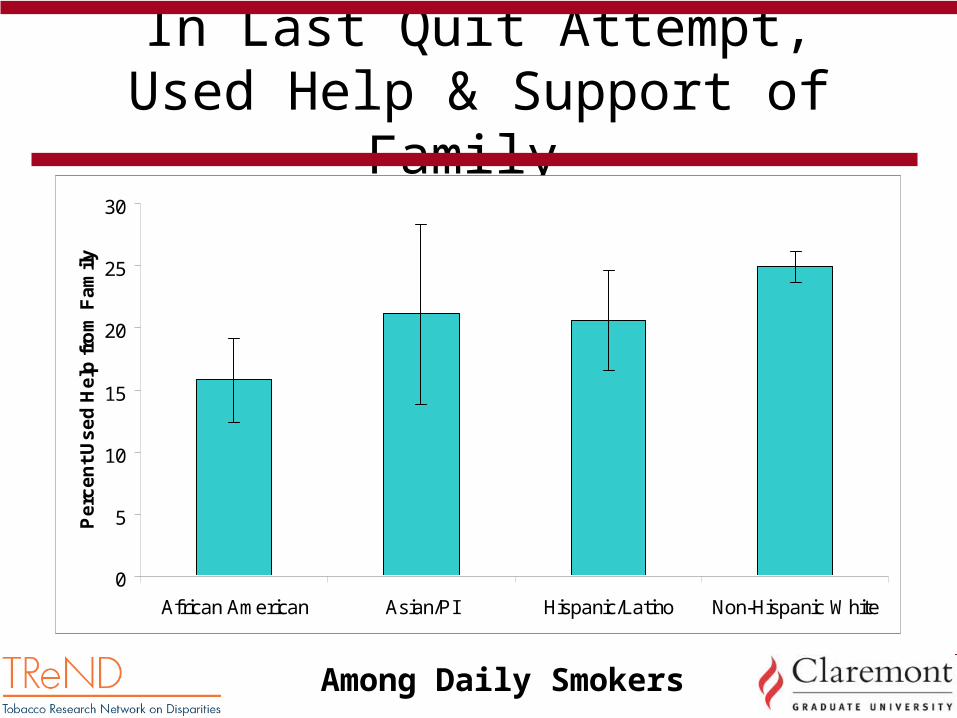
In Last Quit Attempt,Used Help & Support of Family
Among Daily Smokers
0
5
10
15
20
25
30
African American Asian/PI Hispanic/Latino Non-Hispanic White
Pe
rce
nt
Us
ed
He
lp f
rom
Fa
mily

Relapse among smokers in the past year
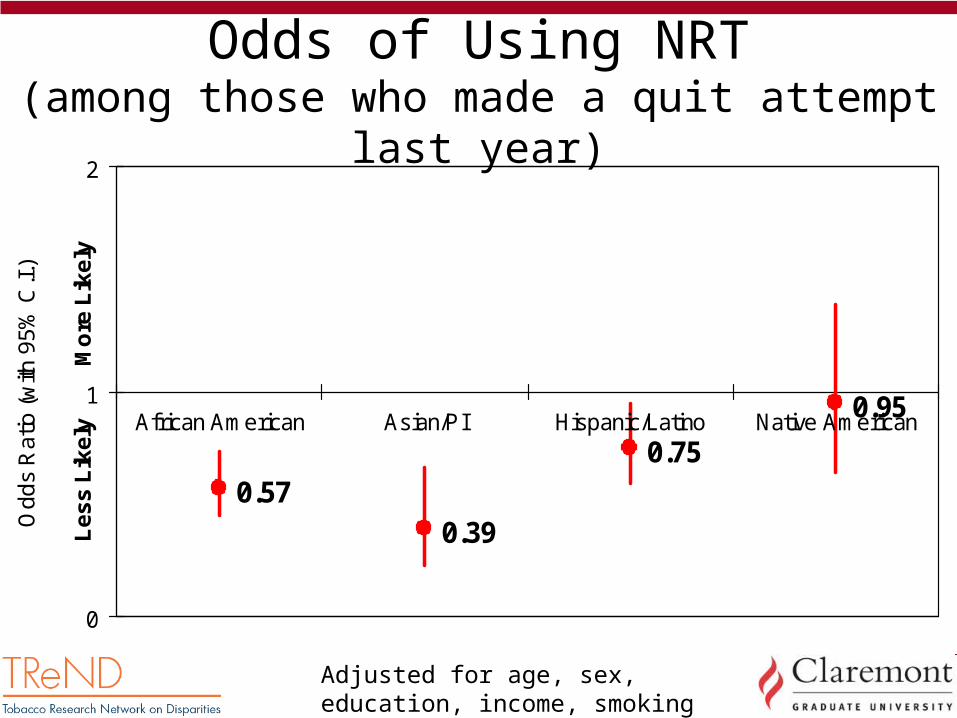
0.570.39
0.75
0.95
0
1
2
African American Asian/PI Hispanic/Latino Native American
Odd
s R
atio
(with
95%
C.I.
)
Les
s L
ikel
y
M
ore
Lik
ely
Odds of Using NRT(among those who made a quit attempt last year)
Adjusted for age, sex, education, income, smoking consumption

0.56
1.42
1.77
0.70
0
1
2
African American Asian/PI Hispanic/Latino Native American
Odd
s R
atio
(with
95%
C.I.
)
Les
s L
ikel
y
M
ore
Lik
ely
Presence of a Total Home Smoking Ban among Current Daily Smokers
Adjusted for age, sex, education, income, smoking consumption

Successful (6 months +) quits among smokers in the last year who made at least a 1-day attempt
OR L 95% U 95% p-value
Age group
20-34 1.00 1.00 1.00 .
35-49 0.68 0.59 0.79 <0.001
50-64 0.84 0.72 0.97 0.022
Highest educational level
< H. S. 1.00 1.00 1.00 .
H.S. graduate 0.99 0.79 1.25 0.945
Some college 1.13 0.89 1.43 0.313
College graduate 1.72 1.39 2.12 <0.001
Under 2X poverty level No 1.00 1.00 1.00 .
Yes 0.81 0.69 0.95 0.012
Race/ethnicity
African American 0.51 0.36 0.72 <0.001
Asian/PI 1.05 0.66 1.69 0.824
Hispanic/Latino 1.22 0.92 1.61 0.159
Native American 0.75 0.48 1.18 0.218
NH White 1.00 1.00 1.00 .

Discussion
• Differences across race/ethnic groups highlight significant challenges in addressing smoking and smoking cessation for various groups
• Specific needs and program focus for cessation may vary across groups such that 1 size fits all strategies might not be optimal

Future Research
• Future research on reasons racial/ethnic minorities are less likely to use NRT
• Population groups & subgroups– Native Americans/American Indians– Race/ethnic subgroups– Gender– Acculturation

Acknowledgements
• Tobacco Research Network on Disparities – Funded by the National Cancer Institute and the American
Legacy Foundation
• Tobacco-Related Disease Research Program of the University of California Office of the President (#12KT-0158, 15RT-0238)
• National Institutes of Health (#CA12344)• National Cancer Institute (Redes En Acción, U01-
CA86117)• Robert Wood Johnson Foundation (#RWJF04498) • American Cancer Society (#MRSGT 07-277-01)