a framework for infrastructure - planningmi.org · a framework for infrastructure ... federal tax...
TRANSCRIPT


A FRAMEWORK FOR INFRASTRUCTURE
INVESTMENT IN THE 21ST CENTURY
Gregory P. Kacvinsky, OHM Advisors
Michigan Association of Planning
2016 Annual Conference – Kalamazoo, Michigan
October 26, 2016

Identified Need
Need to boost worldwide investment in infrastructure by 60%:
• $36 trillion spent in the previous 18 years• $57 trillion needed during next 18 years
ASCE: Over $200 billion/year additional funding needed
Source: Infrastructure productivity: How to save $1 trillion a year
McKinsey Global Institute (MGI), January 2013
Source: American Society of Civil Engineers, 2013 Infrastructure Report Card

Identified Need
US must raise infrastructure
spending by 1% of GDP*
• $170-$180 billion per year
(similar to ASCE $200B/yr)
• Works out to $5B per year in
Michigan
*Source: Game changers: Five opportunities for US growth and renewal
McKinsey Global Institute (MGI), July 2013

Population / Infrastructure Trends
Tax Policies (long-term trends)
Spending on Infrastructure
Physical Condition and Environmental Factors
Now, what do we do about it?
10.0
11.0
12.0
13.0
14.0
15.0
16.0
17.0
18.0
19.0
20.0
1945 1950 1955 1960 1965 1970 1975 1980 1985 1990 1995 2000 2005 2010 2015
Ta
x R
even
ues
(%
of
GD
P)
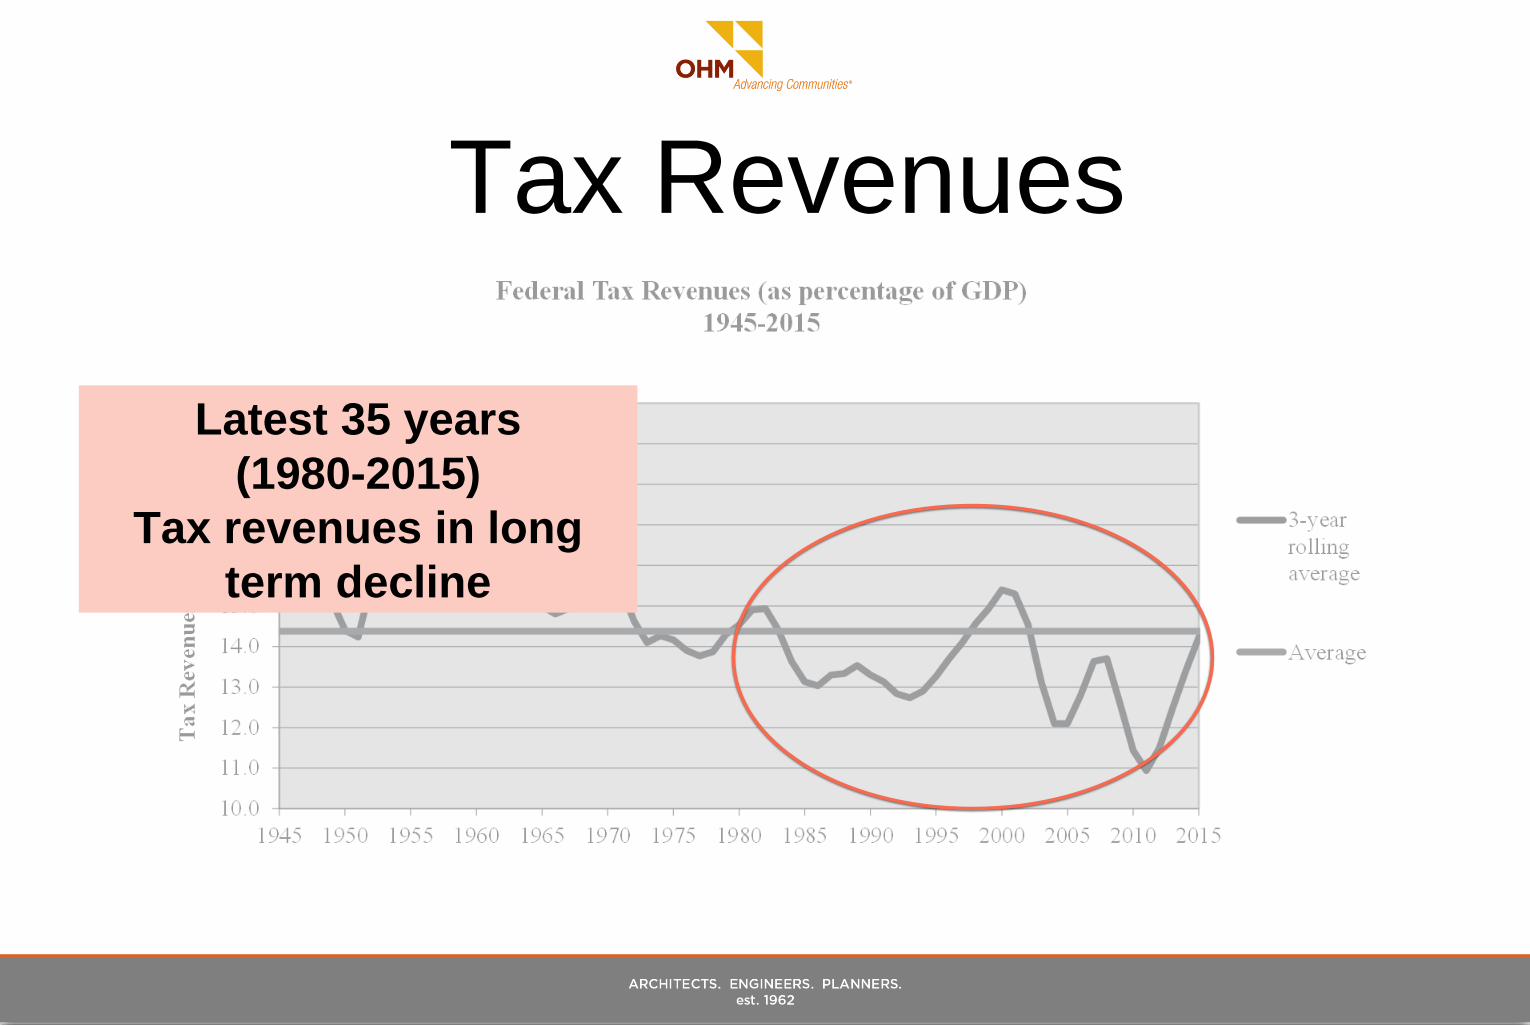
Federal Tax Revenues (as percentage of GDP)
1945-2015
3-year
rolling
average
Average

Population vs. InfrastructureLong-Term Trends

Infrastructure FootprintUS: Population vs. Land Development (1982-2007)
Sources:
Population: US Census Bureau
Development: USDA-NRCS

Infrastructure FootprintUS: Population vs. Land Development (1982-2007)
Sources:
Population: US Census Bureau
Development: USDA-NRCS

Infrastructure Footprint
Sources:
Population: US Census Bureau
Development: USDA-NRCS
Sources:
Population: US Census Bureau
Development: USDA-NRCS
0%
10%
20%
30%
40%
50%
60%
1982 1987 1992 1997 2002 2007 2012
Per
cen
t In
crea
se v
s. 1
982
Michigan: Population vs. Urban Footprint1982-2012
Urban Footprint Population

Infrastructure Footprint
Source:
SEMCOG
Developed before 1970
Developed after 1970
Population in 1970: 4.7 million
Population in 2015: 4.7 million

Infrastructure FootprintState of Michigan
30 years (1982-2012):
Population increased by 8%
Developed land area increased by 50%
Over a 5:1 ratio in infrastructure footprint
expansion relative to population

Infrastructure FootprintUS: Population vs. Land Development (1982-2012)
On average, each taxpayer is paying
for 20% more infrastructure
Purchasing power for roads is 30%
less than in mid 1980s (adjusted for
inflation, considering both state and
federal fuel taxes)

Infrastructure FootprintUS: Population vs. Land Development (1982-2012)
Unlike roads (which are visible),
underground utilities are much older
and poorly maintained
Little to no political motivation to
match funding levels to actual needs
Sewer/water rates not keeping up
No funding source for stormwater

Infrastructure Footprint
On average, we are responsible
for nearly 40% more
infrastructure than our parents
Infrastructure FootprintState of Michigan
Combined impact of increased
footprint and revenue shortfalls:
50% decrease in available investment
per mile of road
Impact on sewers and water
systems: varies by community, but
similar in magnitude

Infrastructure Footprint
• How did this happen?
• Land is cheap
• Few or no incentives to redevelop older
areas
• Old design standards offer little to no room
for creative design
• Desire for lower taxes
• Desire for bigger lots, larger houses

Tax PolicyLong-Term Trends
10.0
11.0
12.0
13.0
14.0
15.0
16.0
17.0
18.0
19.0
20.0
1945 1950 1955 1960 1965 1970 1975 1980 1985 1990 1995 2000 2005 2010 2015
Ta
x R
even
ues
(%
of
GD
P)
Federal Tax Revenues (as percentage of GDP)
1945-2015
3-year
rolling
average
Average

Tax Revenues
20.0
25.0
30.0
35.0
40.0
45.0
50.0
Incom
e T
ax
-%
of
GD
P
Tax Revenue as Percentage of GDP
Source: Heritage Foundation, 2016
20
21
22
23
24
25
26
27
28
Inco
me T
ax
-%
of
GD
PTax Revenue as Percentage of GDP
Source: Heritage Foundation, 2016

Tax Revenues
France:
45%
United Kingdom:
33%
Germany:
37%Tax Revenue as % of GDP (incl. state/local taxes)

Jamaica:
24%
United States:
25%
Papua New Guinea
25%
Tax Revenues
Tax Revenue as % of GDP (incl. state/local taxes)

• Large percentage of aging infrastructure built with
sources of revenue that are no longer there:
• Federal-Driven• Interstate system (initial investment: 1950s – 1970s)
• Sewer systems and treatment plants (EPA grants,
ended in 1980s)
• Water distribution systems (EPA grants, ended in
1980s)
• Developer-Driven• Local roads
• Sewers (storm and sanitary)
• Water mains
Tax Revenues

• States and municipalities have inherited these assets
• Much of this infrastructure is reaching the end of its
useful life
• There are no programs of the size/magnitude of those
we enjoyed in the 1950s – 1970s
Tax Revenues
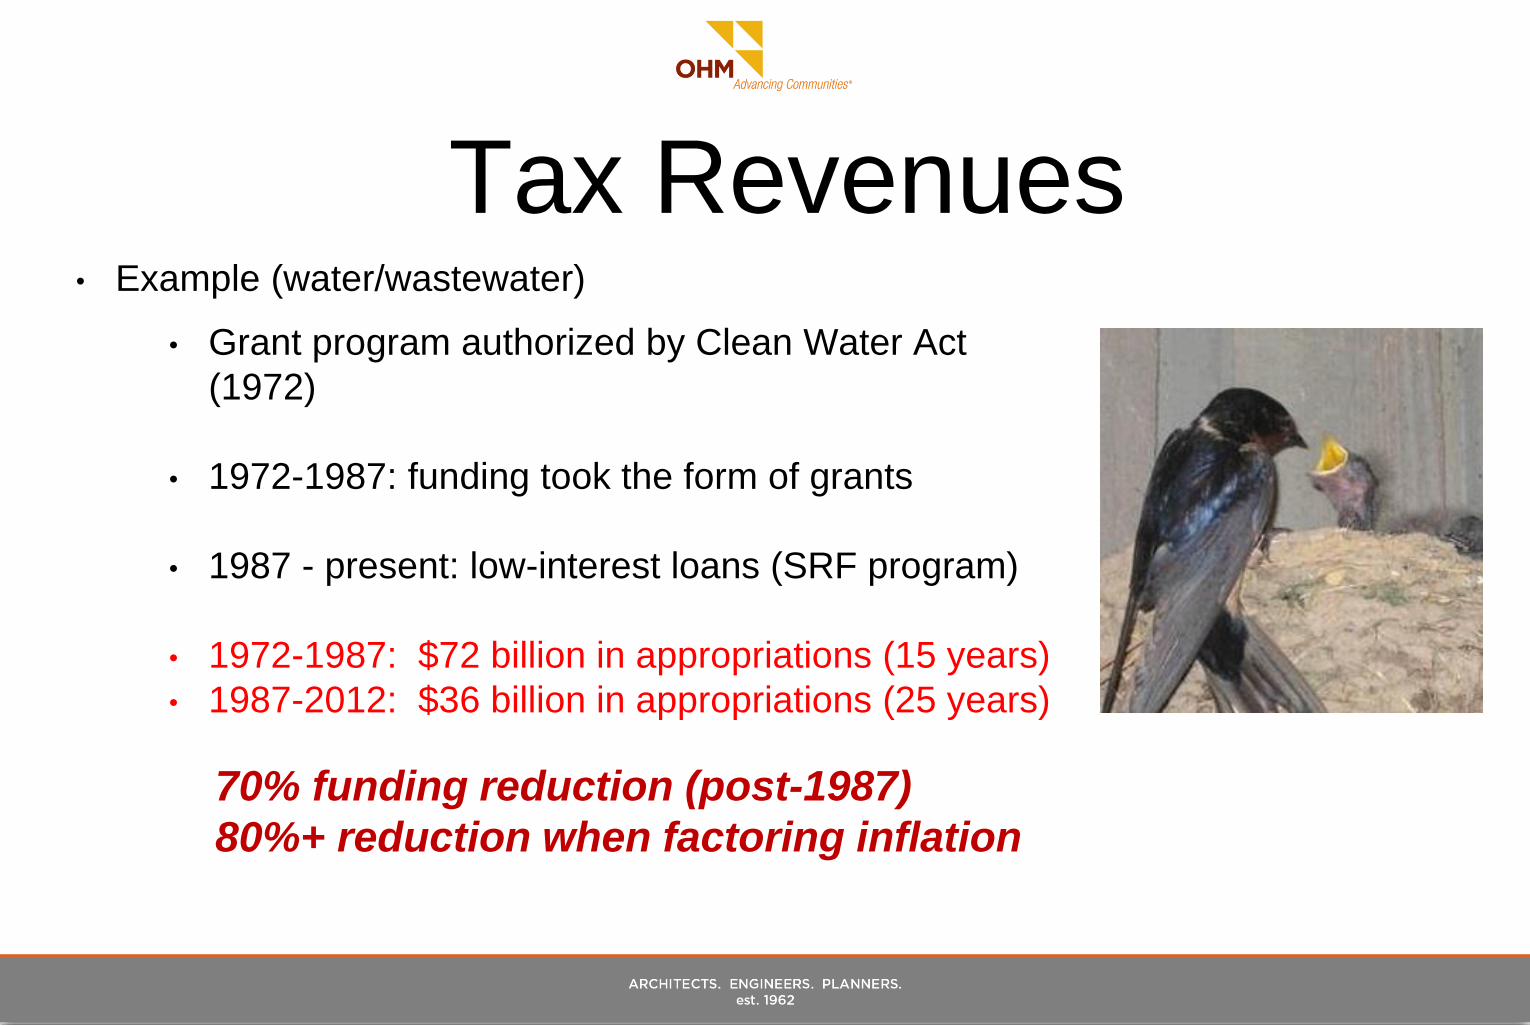
• Example (water/wastewater)
• Grant program authorized by Clean Water Act
(1972)
• 1972-1987: funding took the form of grants
• 1987 - present: low-interest loans (SRF program)
• 1972-1987: $72 billion in appropriations (15 years)
• 1987-2012: $36 billion in appropriations (25 years)
70% funding reduction (post-1987)
80%+ reduction when factoring inflation
Tax Revenues

Source: White House Office of Management and Budget
Tax Revenues
10
11
12
13
14
15
16
17
18
19
20
1945 1950 1955 1960 1965 1970 1975 1980 1985 1990 1995 2000 2005 2010 2015
Fed
eral
Tax R
even
ues
(% o
f G
DP
)
Federal Tax Revenues (as percentage of GDP)
1945-2016
3-yr rollingaverage
Post-WWIIAverage

Tax Revenues
First 35 years
(1945-1980)
Tax revenues helped to
support infrastructure
investment
Tax Revenues
Latest 35 years
(1980-2015)
Tax revenues in long
term decline

Headlee: 30% loss in Taxable value is mostly permanent (inflation adjusted)Southeast Michigan
$100
$120
$140
$160
$180
$200
$220
$240
19
99
20
00
20
01
20
02
20
03
20
04
20
05
20
06
20
07
20
08
20
09
20
10
20
11
20
12
20
13
20
14
20
15
20
16
Bill
ion
s
SEV:
-$81 Billion (-36%) from peak in
2006 to 2016
Taxable Value:
-$54 Billion (-30%) from peak in
2007 to 2016
Inflation Adjusted to 2010 dollars

Fuel Taxes
$0.10
$0.15
$0.20
$0.25
$0.30
$0.35
1990 1993 1996 1999 2002 2005 2008 2011 2014 2017
Fu
el
tax (
$/g
al)
Fuel Tax History
1990-2017
Construction
Cost Index
(ENR)
Federal
Michigan

State Transportation Funding
$200
$400
$600
$800
$1,000
$1,200
$1,400
New
Yo
rk
Wyo
min
g
No
rth
Dak
ota
Sou
th D
ako
ta
Was
hin
gto
n
Mo
nta
na
Ve
rmo
nt
Illin
ois
Pen
nsyl
van
ia
Uta
h
De
law
are
New
Jer
sey
Min
nes
ota
Nev
ada
Iow
a
Ore
gon
Lou
isia
na
Haw
aii
New
Mex
ico
Mar
ylan
d
Wis
con
sin
Wes
t V
irgi
nia
Cal
ifor
nia
Neb
rask
a
Kan
sas
Mas
sach
use
tts
Co
lora
do
Mai
ne
Okl
aho
ma
Idah
o
Flo
rid
a
Ken
tuck
y
Mis
sou
ri
Mis
siss
ippi
Texa
s
Co
nnec
ticu
t
Ari
zona
New
Ham
psh
ire
Vir
gin
ia
Oh
io
Geo
rgia
Rh
ode
Isla
nd
Ala
bam
a
Ind
iana
Ark
ansa
s
Mic
hig
an
No
rth
Car
olin
a
Ten
nes
see
Sou
th C
aro
lina
Per Capita Transportation SpendingFederal + State + Local ($ per year)
Excludes Washington DC and Alaska

State Transportation Funding
$200
$400
$600
$800
$1,000
$1,200
$1,400
New
Yo
rk
Wyo
min
g
No
rth
Dak
ota
Sou
th D
ako
ta
Was
hin
gto
n
Mo
nta
na
Ve
rmo
nt
Illin
ois
Pen
nsyl
van
ia
Uta
h
De
law
are
New
Jer
sey
Min
nes
ota
Nev
ada
Iow
a
Ore
gon
Lou
isia
na
Haw
aii
New
Mex
ico
Mar
ylan
d
Wis
con
sin
Wes
t V
irgi
nia
Cal
ifor
nia
Neb
rask
a
Kan
sas
Mas
sach
use
tts
Co
lora
do
Mai
ne
Okl
aho
ma
Idah
o
Flo
rid
a
Ken
tuck
y
Mis
sou
ri
Mis
siss
ippi
Texa
s
Co
nnec
ticu
t
Ari
zona
New
Ham
psh
ire
Vir
gin
ia
Oh
io
Geo
rgia
Mic
hig
an
Rh
ode
Isla
nd
Ala
bam
a
Ind
iana
Ark
ansa
s
No
rth
Car
olin
a
Ten
nes
see
Sou
th C
aro
lina
Per Capita Transportation Spending - Including 2017 Michigan Tax IncreaseFederal + State + Local ($ per year)
Excludes Washington DC and Alaska

Spending on Infrastructure

Infrastructure Spending
0.5
0.7
0.9
1.1
1.3
1.5
1.7
1.9
2.1
2.3
2.5
1960 1970 1980 1990 2000 2010 2020
% o
f G
DP
Federal Spending on Physical Resources* (1962-2017)* Energy, Natural Resources, Environment, Commerce, Transportation, Community Development
5-yearrollingaverage
55-yearaverage
Source:
White House Office of
Management and Budget

Social Security / Medicare
Source:
White House Office of
Management and Budget
1.0
3.0
5.0
7.0
9.0
11.0
13.0
15.0
17.0
19.0
1960 1970 1980 1990 2000 2010 2020
% o
f G
DP
Federal Spending on Human Resources* (1962-2017)* Health, Medicare, Unemployment, Social Security, VA Benefits
5-yearrollingaverage
55-yearaverage

Spending Priorities
Source:
White House Office of
Management and Budget
0.0
2.0
4.0
6.0
8.0
10.0
12.0
14.0
16.0
18.0
1960 1970 1980 1990 2000 2010 2020
% o
f G
DP
Federal Spending: Human Resources vs. Physical Resources
HumanResources
PhysicalResources

StimulusPublic Works Stimulus (ARRA)
Total stimulus: $832 billion
$48 billion for transportation (5.7%)
$10 billion for water/sewer (1.2%)
Overall infrastructure funding gap:
$200B/year

Bottom Line
Federal Government
getting out of the
business of
infrastructure
States and local
governments WILL
take on the additional
burden

August 7, 2016

Physical Condition
&
Environmental Factors

Visible
Problems

Hidden
Problems

Hidden
Problems


Changing impact
of wet weather
on collection
systems
August 11, 2014
(Metro Detroit)

Now, what do we do about it?

Assume shift in revenue burden to
local government is here to stay
Appeal to the right audience and
SELL IT
Charge for ALL utilities
(even stormwater!)
Develop a business plan for
your infrastructure (including Capital
Improvement Plans)
Update master plans to favor the
use of existing infrastructure

Appeal to the Right Interests at the Right Time
Elected
Officials
Voters

Appeal to the Right Interests at the Right Time
Elected
Officials
• May require 2-3 separate
messages to reach each type of
elected official
Business owner/leader
Budget Hawk
Environmental advocate
• Keep your messages simple and
direct – address their key interests

Appeal to the Right Interests at the Right Time
Elected
Officials
• Examples
Business owner/leader Impact of failing infrastructure on local businesses
Budget HawkIncreased cost of emergency repairs (long-term budget impacts)
Environmental advocatePollution impacts of failing infrastructure
Better V I S U A L S help

Appeal to the Right Interests at the Right Time
Voters
• Hire a Public Relations Firm
Targeted, Coherent Message
Professionally-crafted materials
for mailing, website, TV, etc.
Bedside Manner
Engineers are not naturally gifted
at communicating with the public
Referenda
Maximize the chances of a
successful millage

Maximize Revenues from Utilities
• Stormwater Utilities
• Stormwater spending bleeds money
from the General Fund
• Almost all communities in Michigan
don’t have a stormwater utility
• Many communities don’t have the
ability to tackle stormwater capital
needs

Funding Imbalance – Typical Community
136 miles of sewer
3,200 manholes
6 pump stations
Budget: ~$7 million/yr
200 miles of watermain
2,500 hydrants
2,800 valves
Water Tower
Budget: ~$10 million/yr
165 miles of storm sewer
22 miles open channel
10,500 structures
30 major culverts/bridges
Budget: $270,000/yr

Old Reality: Enclosed system
(pipes and manholes) – inlet to outfall

Old Reality: Flood control rules
Get it to the river quickly and efficiently

Old Reality: Stormwater detention
(1970s on) – peak flow control

New Reality: Stormwater quality (post-2000)
source control and stream corridor management


Proposed
stormwater utility
legislation in
Michigan!

State of Michigan
Potential for about $400-$500 million
per year in stormwater user fee
revenues* if all communities adopt
stormwater enterprise funds.
* Average Midwest stormwater utility
revenue is $50 per capita per year
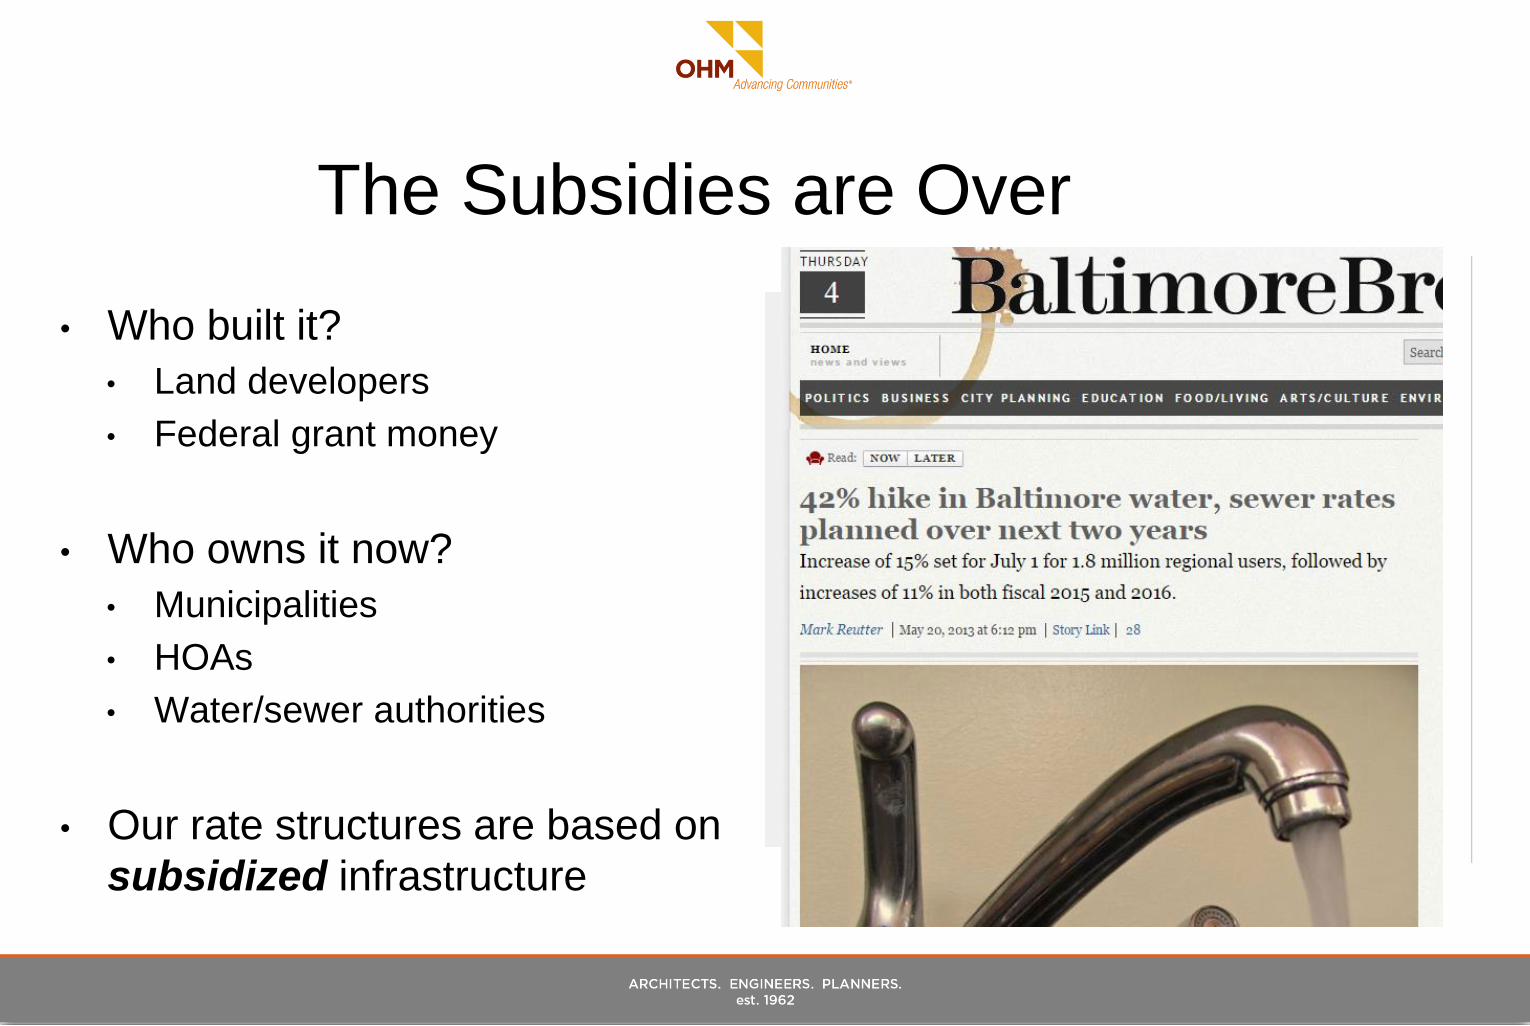
The Subsidies are Over
• Who built it?
• Land developers
• Federal grant money
• Who owns it now?
• Municipalities
• HOAs
• Water/sewer authorities
• Our rate structures are based on
subsidized infrastructure

Lastly….look INWARD
• Urban expansion (without population
growth) is paralyzing us
• Master plans must discourage
greenfield development until we can
backfill underpopulated urban areas
• Build where we already have the
infrastructure

…and finally…
JOBS!

• Multiplier effect on investment
• $170B-$180B annual
investment can raise annual
GDP by $320B and create 1.8
million jobs*
*Source: Game changers: Five opportunities for US growth and renewal
McKinsey Global Institute (MGI), July 2013

John Oliver (HBO)
Infrastructure Segment
https://www.youtube.com/watch?v=Wpzvaqypav8Segment @ 17m 14s

What Now?
• Redefine it:
• More education on tax and spending history
• Understand who built it and who owns it
• More emphasis on health, public safety, and
consequences
• Increased emphasis on what is BELOW the
ground
• More aggressive education for kids, general
public, and elected officials
10.0
11.0
12.0
13.0
14.0
15.0
16.0
17.0
18.0
19.0
20.0
1945 1950 1955 1960 1965 1970 1975 1980 1985 1990 1995 2000 2005 2010 2015
Ta
x R
even
ues
(%
of
GD
P)
Federal Tax Revenues (as percentage of GDP)
1945-2015
3-year
rolling
average
Average

What Now?
• Charge for it:
• Accept the local “bootstrap” reality (no more
federal handouts)
• Create Stormwater Utilities
• Couple fees to CPI or CCI (inflation)

What Now?
• Sell It!
• We’re still not loud enough
• Use PR firms
• Make the case for each audience
(four separate messages):
• Business model / finance
• Economics
• Environmental
• Public safety

Asking for your help…
• Current / Pending Legislation
• HB 5991
• Enabling legislation for stormwater
utilities
• Potential for action after the
election

Thank you!