a framework for publishing novel bacterial species...
TRANSCRIPT

A Framework for Publishing Novel Bacterial Species Discovered in the Undergraduate Microbiology Lab
Jeff Newman Lycoming College, Williamsport PA
June 17, 2016
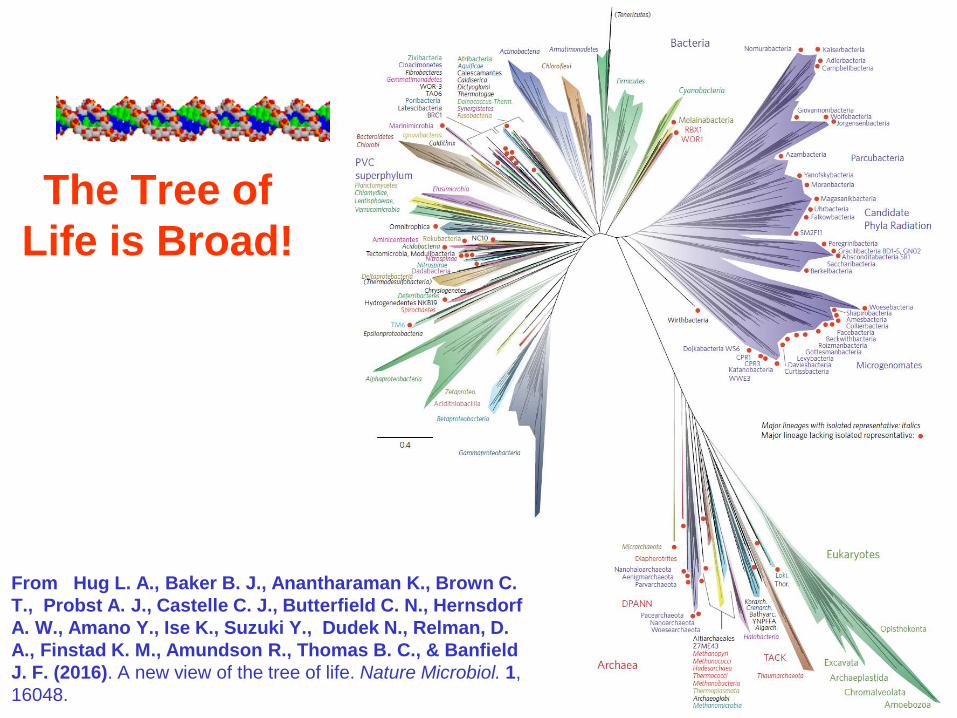
The Tree of Life is Broad!
From Hug L. A., Baker B. J., Anantharaman K., Brown C. T., Probst A. J., Castelle C. J., Butterfield C. N., HernsdorfA. W., Amano Y., Ise K., Suzuki Y., Dudek N., Relman, D. A., Finstad K. M., Amundson R., Thomas B. C., & BanfieldJ. F. (2016). A new view of the tree of life. Nature Microbiol. 1, 16048.

The Tree of Life is DEEP!
From Locey, K.J. and Lennon J.T. (2016) Scaling laws predict global microbial diversity. Proc Natl Acad Sci USA 113:5970-5975.

A Framework for Publishing Novel Bacterial Species Discovered in the Undergraduate Microbiology Lab
Jeff Newman Lycoming College, Williamsport PA
June 17, 2016

The Journey• Starting point: CURE - Micro UK’s from
freshwater creeks, 16S seq novel species• Compare phenotypes to closest type strains
– Literature family/genus specific tests• Minimal Standards• Best Practices: DDHMLSTGenomes• Calculate Phylogenomic Metrics
(GGDC, ANI, AAI, ROSA)• RAST/SEED viewer for genome analysis,
correlation with phenotypes • Simple web/excel tools use
RAST output to:– Calculate AAI, BBH, ROSA– ID unique and shared genes– Create Venn Diagram
• Publish new genera & species!
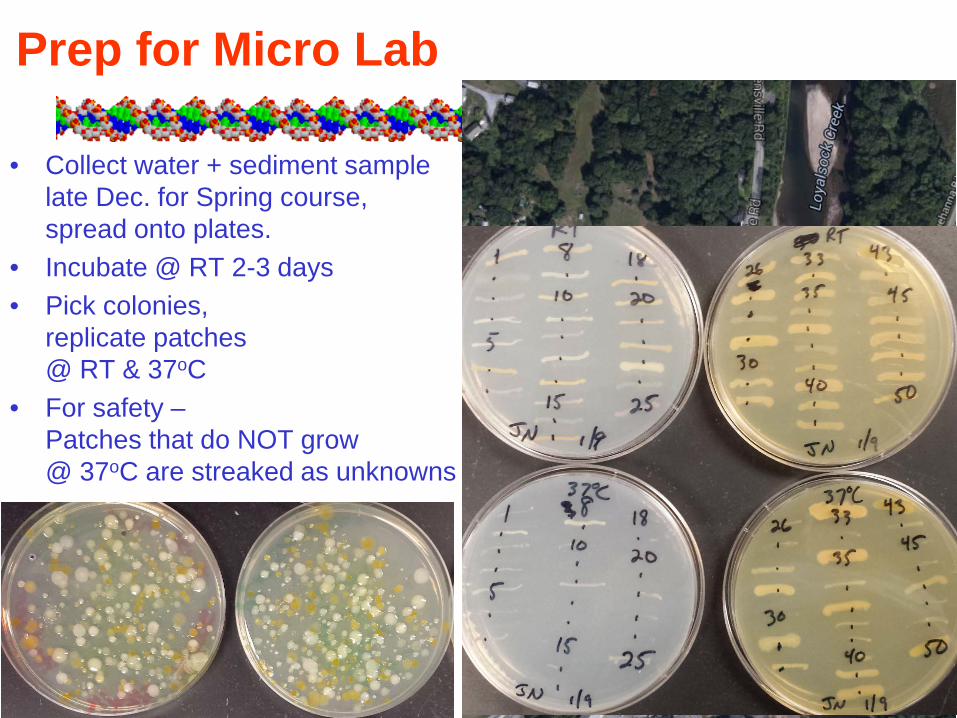
Prep for Micro Lab
• Collect water + sediment sample late Dec. for Spring course, spread onto plates.
• Incubate @ RT 2-3 days• Pick colonies,
replicate patches @ RT & 37oC
• For safety –Patches that do NOT grow @ 37oC are streaked as unknowns

The LycoMicro Unknown Microbe Lab
Week 1 - Aseptic technique/Inoculation - pipetting sterile media- selection of knowns and unknowns- streak plates, inoculation of liquid- preparation of frozen permanents
Week 2 – Staining & Microscopy- Gram stain- Endospore stain- Wet mount
Week 3 – Antibiotic sensitivity, pH, [NaCl], Temperature, Oxygen requirements- Kirby-Bauer Disk Diffusion assay (10)- oxidase, catalase, Gas-Pak Jar

Week 4 – Carbohydrate & Nitrogen Metabolism- MRVP, citrate, phenol red, TSI- urease, nitrate reduction, SIM
Week 5 – Exoenzymes, Differential/Selective media- caseinase, lipase, amylase, DNase, - EMB, HEA, MSA, PhenylEthanol, - Bile Esculin, Brilliant Green, EG Min.
Week 6 - PCR of 16S rDNA, gel, send for sequencing.- Bergey’s Manual Hypothesis
The LycoMicroUnknown Microbe Lab
27f
1492r
16S rRNA gene ~ 1500 bp

Week 7 – FAME Analysis-Biolog GenIII Plates
(BUG+Blood also tests Hemolysis)Databases give possible ID
The LycoMicro Unknown Microbe Lab
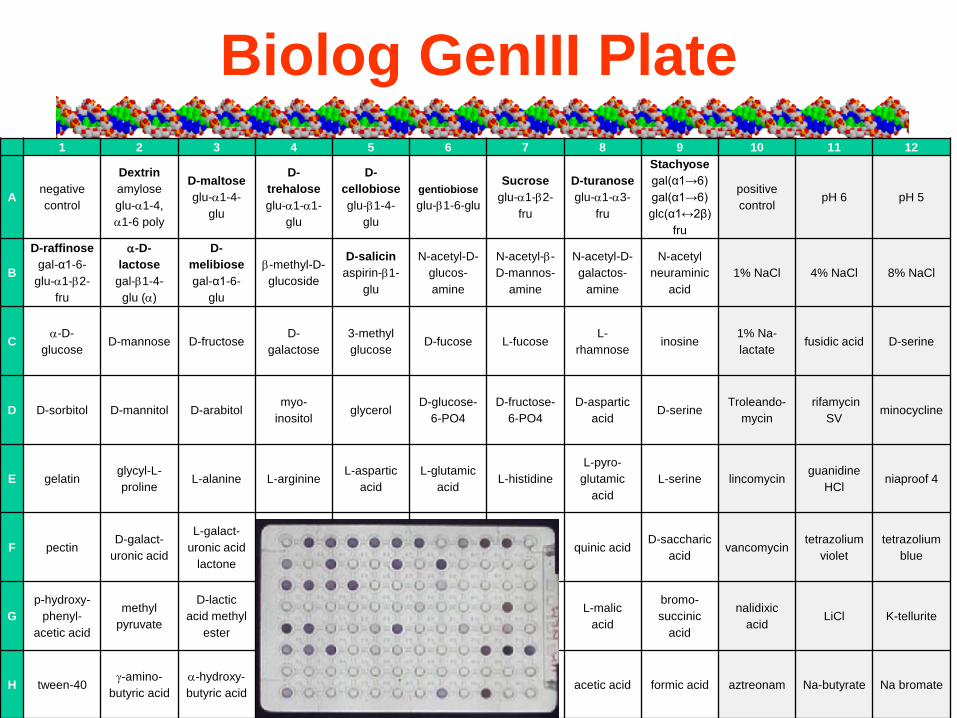
Biolog GenIII Plate1 2 3 4 5 6 7 8 9 10 11 12
A negative control
Dextrinamylose glu-α1-4, α1-6 poly
D-maltose glu-α1-4-
glu
D-trehaloseglu-α1-α1-
glu
D-cellobioseglu-β1-4-
glu
gentiobioseglu-β1-6-glu
Sucroseglu-α1-β2-
fru
D-turanoseglu-α1-α3-
fru
Stachyosegal(α1→6) gal(α1→6) glc(α1↔2β)
fru
positive control
pH 6 pH 5
B
D-raffinosegal-α1-6-
glu-α1-β2-fru
α-D-lactose
gal-β1-4-glu (α)
D-melibiosegal-α1-6-
glu
β-methyl-D-glucoside
D-salicinaspirin-β1-
glu
N-acetyl-D-glucos-amine
N-acetyl-β-D-mannos-
amine
N-acetyl-D-galactos-
amine
N-acetyl neuraminic
acid1% NaCl 4% NaCl 8% NaCl
C α-D-glucose
D-mannose D-fructoseD-
galactose3-methyl glucose
D-fucose L-fucoseL-
rhamnoseinosine
1% Na-lactate
fusidic acid D-serine
D D-sorbitol D-mannitol D-arabitolmyo-
inositolglycerol
D-glucose-6-PO4
D-fructose-6-PO4
D-aspartic acid
D-serineTroleando-
mycinrifamycin
SVminocycline
E gelatinglycyl-L-proline
L-alanine L-arginineL-aspartic
acidL-glutamic
acidL-histidine
L-pyro-glutamic
acidL-serine lincomycin
guanidine HCl
niaproof 4
F pectinD-galact-
uronic acid
L-galact-uronic acid
lactone
D-gluconic acid
D-glucuronic
acid
Glucuron-amide
mucic acid quinic acidD-saccharic
acidvancomycin
tetrazolium violet
tetrazoliumblue
Gp-hydroxy-
phenyl-acetic acid
methyl pyruvate
D-lactic acid methyl
esterL-lactic acid citric acid
α-keto-glutaric acid
D-malic acid
L-malic acid
bromo-succinic
acid
nalidixic acid
LiCl K-tellurite
H tween-40γ-amino-
butyric acidα-hydroxy-butyric acid
β-hydroxy-D,L-butyric
acid
α-keto-butyric acid
acetoacetic acid
propionic acid
acetic acid formic acid aztreonam Na-butyrate Na bromate

Week 8 – Analyze DNA sequence @ http://www.ezbiocloud.net/eztaxon ,
- Construct Phylogenetic Tree w/MEGA, - Literature Research (IJSEM)
The LycoMicro Unknown Microbe Lab
Pantoea anthophila JJMEscherichia coli
Acinetobacter johnsoniiPseudomonas aeruginosa
Neisseria gonorrhoeaeAquaspirillum sinuosumHelicobacter pyloriBdellovibrio bacteriovorus
Blastopirellula marinaCytophaga hutchinsonii
Sphingobacterium anhuienseChryseobacterium indologenes
Prochlorococcus marinusGeovibrio ferrireducens
Lactococcus lactisStreptococcus pyogenes
Exiguobacterium undaeBacillus subtilisStaphylococcus aureus
Oerskovia jenensisArthrobacter aurescens
Streptomyces coelicolorCorynebacterium callunae
Nitrospira moscoviensisAquifex pyrophilus
Thermomicrobium roseumChloroflexus aurantiacus
0.02

EZ-Taxon• http://www.ezbiocloud.net/eztaxon • Database contains
type strains =official representativesof a species– Good pairwise scores– “CompGen” compares
to all members of Genus, can easilydownload and format sequences for trees

EZ-Taxon
What is threshold for positive ID?

• The Gold Standard– Less than 70% DNA-DNA hybridization (green line)
• % Identity with 16S rDNA sequence– 97% (red line) vs. 98.5% (blue line)… but only 1 gene
• Fig from Stackebrandt & Ebers, 2006, Microbiol.Today33:152
How are bacterial species defined?

Systematics and Taxonomy
• Official definition of prokaryotic species is 70% DNA-DNA hybridization (DDH) – difficult to physically measure
• ~70% DDH = ~98.7% identical 16S rRNA sequence = ~95% average nucleotide identity (ANI) = ~95% amino acid identity (AAI)
• New species, genera, families should be compared to closest relatives & described in the International Journal of Systematic and Evolutionary Microbiology (IJSEM)– Type species, Type strain is “official” representative of group– Deposit in 2 culture collections
ATCC, DSMZ, JCM, BCCM/LMG, CCUG, KCTC– Sequences (at least 16S rRNA) deposited in GenBank

Bio447 - Research Methods• Complete & deposit 16S sequence• Determine reference organisms
from phylogenetic tree• Sequence & compare genome(s)• Obtain reference organisms• Repeat experiments in
parallel to determine differences and similarities
• Prepare poster for ASM• Write a paper for IJSEM
B. indicus
B. cibi
B. sp. SJS

Fatty Acid 1 2 3
iso-C14:0 17.3 7.2 5.9C14:0 2.1 2.8 2.1
iso-C15:0 20.3 46.4 48.9anteiso-C15:0 30.0 15.7 14.9
C16:1 ω7c alcohol 4.5 4.6 4.9
iso-C16:0 8.7 3.4 3.7
C16:1 ω11c 2.2 5.6 5.7
C16:0 8.2 4.4 3.2
iso-C17:1 ω10c 1.93 2.5 3.3
Summed in Feature 4 0.3 2.0 2.2
iso-C17:0 1.9 1.7 1.6
anteiso-C17:0 3.9 2.3 2.4
Table 1. Fatty acid composition (%) of Bacillus sp SJS, B. indicus LMG 22858T, and B. cibi DSM 16189T
Fatty
Aci
ds

Biolog GenIII plates
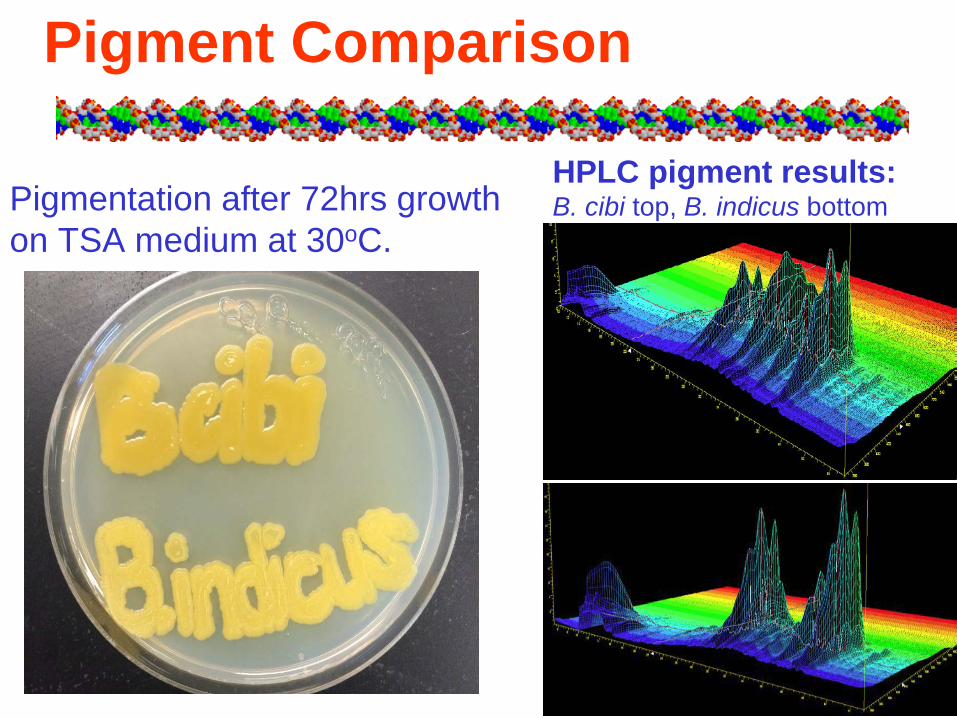
Pigment Comparison
Pigmentation after 72hrs growth on TSA medium at 30oC.
HPLC pigment results: B. cibi top, B. indicus bottom

The Journey• Starting point: CURE - Micro UK’s from
freshwater creeks, 16S seq novel species• Compare phenotypes to closest type strains
– Literature family/genus specific tests• Minimal Standards• Best Practices: DDHMLSTGenomes• Calculate Phylogenomic Metrics
(GGDC, ANI, AAI, ROSA)• RAST/SEED viewer for genome analysis,
correlation with phenotypes • Simple web/excel tools use
RAST output to:– Calculate AAI, BBH, ROSA– ID unique and shared genes– Create Venn Diagram
• Publish new genera & species!

• Wetterstrand KA. DNA Sequencing Costs: Data from the NHGRI Large-Scale Genome Sequencing Program Available at: www.genome.gov/sequencingcosts. Accessed [6-15-16].

GCAT GCAT-SEEK
• Genome Consortium for Active Teaching (GCAT) founded in 2000 to bring Genomics (Microarrays) to the undergraduate curriculum.
• Multiple HHMI & NSF funded workshops
• GCAT-SEEKquence “spin-off” to bringNextGen sequencing to the undergraduate curriculum.
• 3 genomes (Ion Torrent & 454 as part of pilot)• NSF Research Collaboration Network,
Juniata’s HHMI Genomics Leadership Initiative

Shared MiSeq(2x300) Runs
Sample Reads est. Bases est.GSF665-1-E_coli-C06b 217,320 130,391,966GSF665-2-Chryseobacterium-LO 1,317,872 790,723,170GSF665-3-Linfield-KH 809,893 485,935,870GSF665-4-Linfield-NH 301,171 180,702,758GSF665-5-Exiguobacterium 794,482 476,689,384GSF665-6-Plesiomonas_shigelloides 656,143 393,685,659GSF665-7-Halosimplex_carlsbadense 595,655 357,393,201GSF665-8-Phage_Eapen 573,447 344,068,354GSF665-9-Phage_Aspire 170,895 102,536,927GSF665-10-strain_3572 593,179 355,907,159GSF665-11-Gracilibacillus_dipsosauri 986,925 592,154,880GSF665-12-Serratia_S12 827,533 496,519,794GSF665-13-Rhodococcus_T1Sofl-14 297,153 178,292,067GSF665-14-Janthinobacterium-BJB1 823,488 494,092,592GSF665-15-Janthinobacterium-BJB349 883,287 529,972,260GSF665-16-Janthinobacterium-BJB304 1,098,516 659,109,346GSF665-17-Janthinobacterium-BJB317 549,616 329,769,324GSF665-18-Iodobacter-BJB302 206,973 124,183,611GSF665-19-Asaia_bogorensis 1,096,204 657,722,373GSF665-20-Asaia_siamensis 820,818 492,490,968GSF665-21-Asaia_astilbes 783,447 470,068,239GSF665-22-Asaia_platycodi 808,325 484,994,710GSF665-23-Asaia_krungthepensis 1,152,811 691,686,698GSF665-24-Asaia_prunellae 1,035,414 621,248,288GSF665-27-Serratia -DL 129,258 77,554,903GSF665-28-Phage-KitKat 53,773 32,263,632GSF665-29-Cyanobacterium-RC610 909,265 545,559,194GSF665-30-Serratia_marcescens-RH 307,886 184,731,584GSF665-31-Bacillus_cibi 693,101 415,860,714GSF665-32-Pedobacter-BMA 1,200,365 720,218,713GSF665-33-Flavobacterium-KMS 185,975 111,585,274GSF665-34-Flavobacterium_hibernum 1,432,517 859,510,422GSF665-36-Flavobacterium_hydatis 744,893 446,935,512GSF665-39-Kaistella_koreensis 1,238,892 743,334,928GSF665-40-Kaistella_haifense 1,067,969 640,781,490
Total 25,364,460 15,218,675,963Average 724,699 434,819,313
• NextGen Instruments generate more data than most UG faculty can use or afford.
• November 2013 – 27 bacteria @$200 each (including Flavobacterium aquatile)
• April, 2014 – Opened to Microedu Listserv 35 Bacteria and Phage from 16 institutions @$190/sample
• October 2014 – 30 phage, viruses and bacteria @$175/sample.

Assembly statistics
[SoftGenetics Assembler: Assembly Results Statistics Report]• Total Reads Number: 2056329• Matched Reads Number: 1983986• Unmatched Reads Number: 72343• Assembled Sequences Number: 61• Average Sequence Length: 57497• Minimum Sequence Length: 158• Maximum Sequence Length: 641985• N50 Length: 366076[Final Contig Merge Results Statistics Report]• Final Contig Merge Sequences Number: 13• Final Contig Merge Average Sequence Length: 269063• Final Contig Merge Minimum Sequence Length: 173• Final Contig Merge Maximum Sequence Length: 856388• Final Contig Merge N50 Length: 586767• Matched Reads Count: 1977550• Number of Matched Bases: 562514128• Average Read Length: 285• Average Coverage: 161• Reference Length: 3507364

Genomes deposited
in GenBank
species strain WGS genome size contigsBacillus cibi DSM 16189 JNVC02 4,072,175 24Bacillus indicus LMG 22858 JGVU02 4,129,127 22Bacillus sp SJS (colbertis) SJS JAQV02 4,148,893 36Chryseobacterium angstadtii KM LFND01 5,202,773 11Chryseobacterium antarcticum LMG 24720 JPEP01 3,123,663 4Chryseobacterium aquaticum KCTC 12483 LLYZ01 3,813,178 21Chryseobacterium formosense LMG 24722 JPRP01 4,364,663 10Chryseobacterium greenlandense UMB34 LMAI01 4,036,521 21Chryseobacterium hispalense DSM 25574 JARQ01 4,363,762 27Chryseobacterium jeonii DSM 17048 JSYL01 3,261,282 35Chryseobacterium luteum DSM 18605 JPRO01 4,718,546 49Chryseobacterium piperi CTM JPRJ01 4,340,594 89Chryseobacterium soli DSM 19298 JPRH01 4,754,478 26Chryseobacterium solincola DSM 22468 JSYK01 2,345,236 14Chryseobacterium sp BLS98 BLS98 LFNF01 4,412,600 8Chryseobacterium sp FH2 FH2 LFNE01 3,988,758 24Chryseobacterium sp. JM1 JM1 JPRN01 5,256,156 31Chryseobacterium vrystaatense LMG 22846 JPRI01 5,487,842 18Epilithonimonas diehli FH1 FH1 JPLZ01 3,975,884 12Epilithonimonas lactis LMG 24401 JPLY01 4,236,390 22Flavobacterium aquatile LMG 4008 JRHH01 3,490,856 7Flavobacterium chilense LMG 26360 LSYT01 5,924,510 21Flavobacterium chungangense LMG 26729 JASY01 5,591,549 45Flavobacterium hibernum DSM 12611 JPRK01 5,283,672 30Flavobacterium hydatis DSM 2063 JPRM01 5,877,671 99Flavobacterium reichenbachii LMG 25512 JPRL01 5,501,401 12Flavobacterium sp AED (franzi) AED JSYM01 3,925,153 15Flavobacterium sp JRM JRM JSYO01 5,380,719 169Flavobacterium sp KJJ KJJ JARP01 4,603,121 10Flavobacterium sp KMS KMS JSYP01 5,597,129 58Flavobacterium sp VMW VMW LHVT01 5,627,095 59Flavobacterium sp. ABG (douthatii) ABG LEKS01 5,270,010 89Flavobacterium succinicans LMG 10402 JATV01 3,652,806 48Kaistella koreensis CCUG LFNG01 3,154,203 64Pedobacter borealis DSM 19626 JAUG01 5,544,917 216Pedobacter ginsenosidimutans KACC 14530 LMZQ01 6,517,553 86Pedobacter kyungheensis KACC 16221 JSYN01 6,358,642 67Pedobacter sp 20-19 R20-19 JCKI01 5,006,523 15Pedobacter sp. BMA BMA LECU01 5,040,634 20

95% ANI ~ 70% DDH ~ 69% Conserved (>90%)


Determine Phylogenomic Metrics –Kostas Lab ANI Calculator

Determine Phylogenomic Metrics –Chun Lab EzGenome ANI Calculator

Genome-Genome Distance Calculator (GGDC) at the DSMZ calculates digital DDH

ANI & GGDC
• text
Flavobacterium JRM
Flavobacterium KMS
Flavobacterium hydatis
Flavobacterium hibernum
Flavobacterium sp. JRM - 74.2 41.7 23.4
Flavobacterium sp. KMS 96.95 - 40.8 23.3
Flavobacterium hydatis 90.54 90.22 - 23.3
Flavobacterium hibernum 78.36 78.25 78.38 -
Table 2. and Average Nucleotide Identity (ANI) (species
threshold = 95%) calculated by Kostas lab ANI Calculatorhttp://enve-omics.ce.gatech.edu/ani/

Annotation with RAST
• http://rast.nmpdr.org/
• Upload genome as a .fasta file,
• Get GC mol% composition• 1-24 hrs later…

RAST Annotation = Genes identified and classified by function

Many genes assigned to expandable subsystems

Phenotype Comparisons

Seed Viewer Sequence Based Comparison Tool

RAST – Sequence based comparison tool to ID orthologs

C.populense lacks carotenoid biosynthetic genes
C.hispalense C.populense

Explain phenotypic differences – e.g. Pigment “Landscapes”
C.populense CF314
C.hispalense carotenoid
flexirubin
Flexirubinsonly

Sequence-Based Comparison color codes similarity
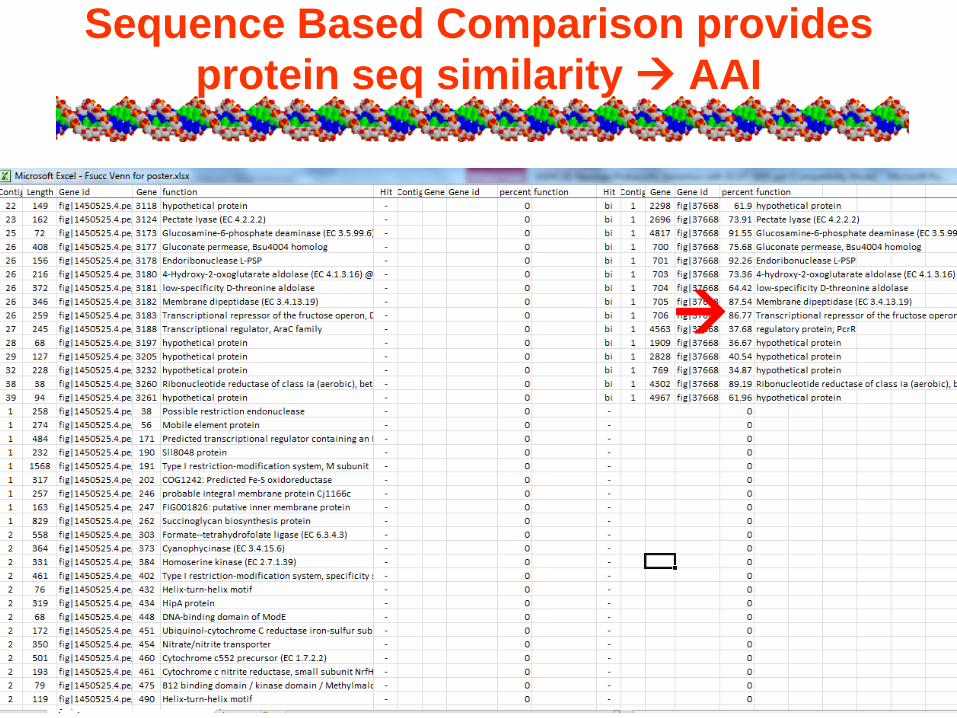
Sequence Based Comparison provides protein seq similarity AAI

AAI has broader range

Different genera in same family have AAI of ~51 to ~71-75

Sequence Based Comparison can ID unique and shared genes…..

Venn Diagram Tool

Venn Diagram Template

Identify Core, Genus or Family-Specific Genes

Links/Tools available at novelmicrobe.com


Novel Species “Micro”-libs

Thank You!
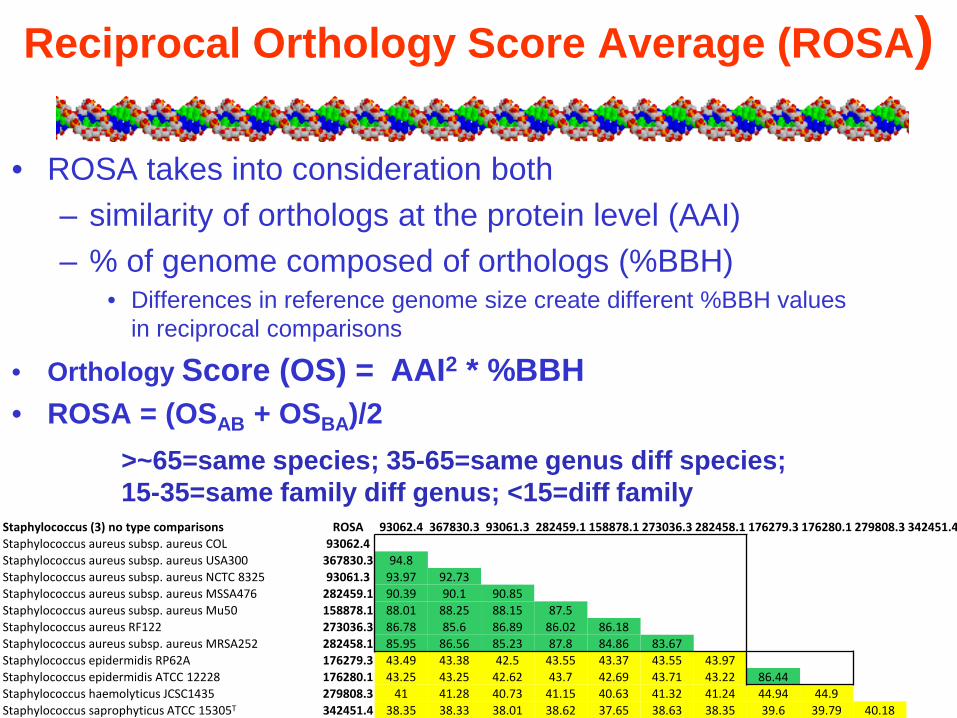
Staphylococcus (3) no type comparisons ROSA 93062.4 367830.3 93061.3 282459.1 158878.1 273036.3 282458.1 176279.3 176280.1 279808.3 342451.4Staphylococcus aureus subsp. aureus COL 93062.4Staphylococcus aureus subsp. aureus USA300 367830.3 94.8Staphylococcus aureus subsp. aureus NCTC 8325 93061.3 93.97 92.73Staphylococcus aureus subsp. aureus MSSA476 282459.1 90.39 90.1 90.85Staphylococcus aureus subsp. aureus Mu50 158878.1 88.01 88.25 88.15 87.5Staphylococcus aureus RF122 273036.3 86.78 85.6 86.89 86.02 86.18Staphylococcus aureus subsp. aureus MRSA252 282458.1 85.95 86.56 85.23 87.8 84.86 83.67Staphylococcus epidermidis RP62A 176279.3 43.49 43.38 42.5 43.55 43.37 43.55 43.97Staphylococcus epidermidis ATCC 12228 176280.1 43.25 43.25 42.62 43.7 42.69 43.71 43.22 86.44Staphylococcus haemolyticus JCSC1435 279808.3 41 41.28 40.73 41.15 40.63 41.32 41.24 44.94 44.9Staphylococcus saprophyticus ATCC 15305T 342451.4 38.35 38.33 38.01 38.62 37.65 38.63 38.35 39.6 39.79 40.18
• ROSA takes into consideration both – similarity of orthologs at the protein level (AAI)– % of genome composed of orthologs (%BBH)
• Differences in reference genome size create different %BBH values in reciprocal comparisons
• Orthology Score (OS) = AAI2 * %BBH• ROSA = (OSAB + OSBA)/2
Reciprocal Orthology Score Average (ROSA)
>~65=same species; 35-65=same genus diff species; 15-35=same family diff genus; <15=diff family

Reciprocal Orthology Score Average (ROSA)

ROSA Thresholds
Table 4. ROSA Values at Different Phylogenetic levels.
Level Same Different expected range min max mean n= below
rangeabove range
8 species strain >65 49 99.59 85.98 312 3 N/A7 genus species 35-65 6.85 95.8 36.63 521 294 386 family genus 15-35 5.8 54.99 18.86 524 125 195 order family 10-15 4.75 23.19 11.58 314 79 224 class order 8-10 4.15 14.99 8.22 286 121 583 phylum class 6-8 4.3 11.4 6.62 123 42 142 domain phylum 3-6 1.85 7.66 4.45 211 10 61 domain <3 1.36 4.44 2.42 47 0 9