a future of innovation and growth
TRANSCRIPT

A Clean Edge Report for the
Advancing Massachusetts' Clean-Energy Leadership
APRIL 2010
A FUTURE OF INNOVATION AND GROWTH:
table of contents
eXecUtIVe sUMMaRY................................................................................ ........................... 2
IntRoDUctIon..................................................................................................................... 8
clean-eneRGY state leaDeRsHIP scoRecaRD ............................................................... 9
MassacHUsetts assets anD baRRIeRs ......................................................................... 13
leaDeRsHIP scoRecaRD: MassacHUsetts In tHe toP 15 clean-eneRGY states ... 19
ReGUlatoRY IncentIVes anD DRIVeRs ......................................................................... 23
fInancIal IncentIVes anD DRIVeRs ............................................................................. 32
KnoWleDGe caPItal anD econoMIc/WoRKfoRce DeVeloPMent ............................. 40
stRateGY anD RecoMMenDatIons ................................................................................ 44
aboUt tHe aUtHoRs ......................................................................................................... 48
aPPenDIX: leaDeRsHIP scoRecaRD DefInItIons ........................................................ 49

© 2010 Clean Edge, Inc. (www.cleanedge.com).A Clean Edge report for the Massachusetts Clean Enery Center2
By a range of different measures, Massachusetts stands out as a clean-energy leader among states
in the U.S. It has made the growth of clean energy a clear legislative and economic development
priority in the state, with strong results to date in leading-edge policies, industry expansion, job
creation, and increased investment and deployment.
This report, prepared by Clean Edge Inc. for the Massachusetts Clean Energy Center (MassCEC),
compares and contrasts Massachusetts’ clean-energy leadership with other leading states by a
variety of quantitative and qualitative measures. After an initial screening process to select the
Top 15 clean-energy states in the U.S., we created a Leadership Scorecard comparing these states
in 56 categories that encompass regulatory incentives, financial incentives, knowledge capital, and
economic/workforce development. While this is not a definitive, weighted ranking, it provides an
important and valuable benchmarking on states’ performance. Massachusetts places second in this
ranking, behind only California. Rounding out the Top 15 clean-energy states are OR, CO, NJ, CT,
NY, MD, WA, AZ, IL, FL, PA and TX.
assessing Massachusetts clean-energy assets and barriers
The state’s Top 2 ranking, and much of what we heard from more than 20 interviews with leading
clean-energy stakeholders in the state, places Massachusetts in an impressive and enviable position.
The state’s world-class academic and innovation resources, strong government leadership, active
venture capital community, highly educated workforce, and deep commitment to energy efficiency
eXecUtIVe sUMMaRY
statetotal Marks earned (out of 56 possible)
Percent of total Marks Possible
California 48 86%
Massachusetts 45 80%
Oregon 43 77%
Colorado 35 63%
New Jersey 35 63%
Connecticut 34 61%
New York 34 61%
Maryland 32 57%
Washington 32 57%
Minnesota 30 54%
Arizona 28 50%
Illinois 28 50%
Florida 24 43%
Pennsylvania 24 43%
Texas 20 36%
clean-eneRGY state leaDeRsHIP scoRecaRD
Source: Clean Edge, Inc., 2010
© 2010 Clean Edge, Inc. (www.cleanedge.com).A Clean Edge report for the Massachusetts Clean Enery Center 3
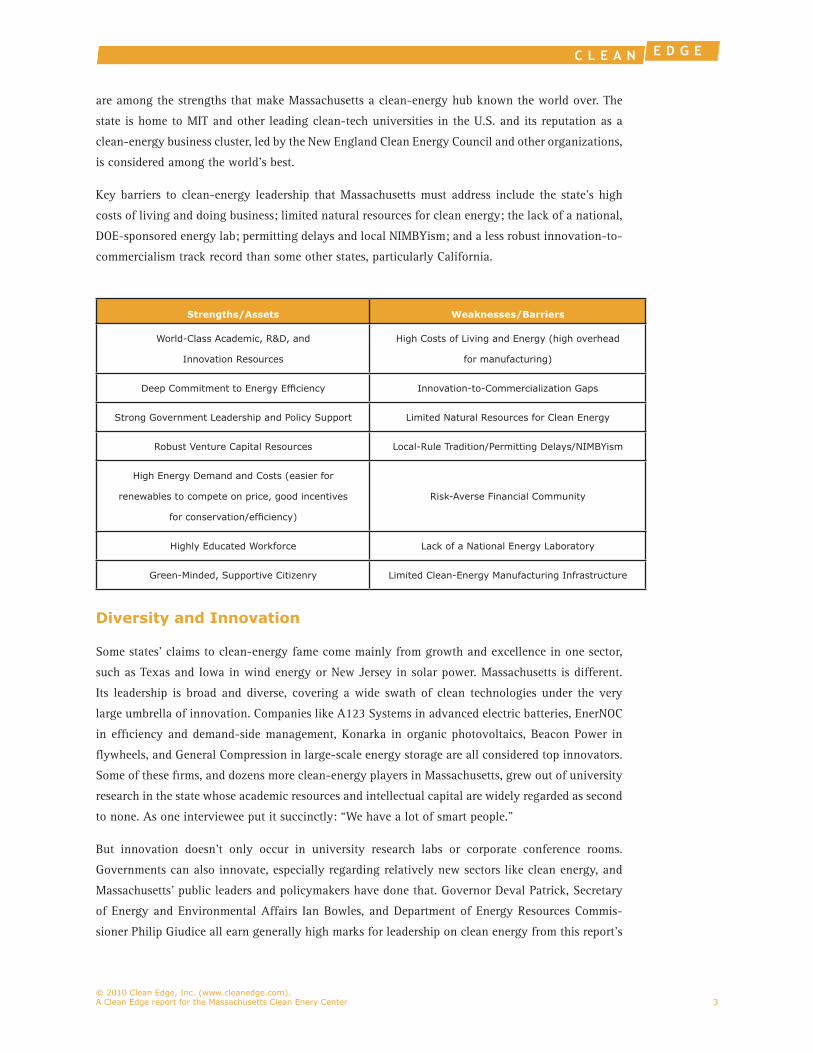
are among the strengths that make Massachusetts a clean-energy hub known the world over. The
state is home to MIT and other leading clean-tech universities in the U.S. and its reputation as a
clean-energy business cluster, led by the New England Clean Energy Council and other organizations,
is considered among the world’s best.
Key barriers to clean-energy leadership that Massachusetts must address include the state’s high
costs of living and doing business; limited natural resources for clean energy; the lack of a national,
DOE-sponsored energy lab; permitting delays and local NIMBYism; and a less robust innovation-to-
commercialism track record than some other states, particularly California.
Diversity and Innovation
Some states’ claims to clean-energy fame come mainly from growth and excellence in one sector,
such as Texas and Iowa in wind energy or New Jersey in solar power. Massachusetts is different.
Its leadership is broad and diverse, covering a wide swath of clean technologies under the very
large umbrella of innovation. Companies like A123 Systems in advanced electric batteries, EnerNOC
in efficiency and demand-side management, Konarka in organic photovoltaics, Beacon Power in
flywheels, and General Compression in large-scale energy storage are all considered top innovators.
Some of these firms, and dozens more clean-energy players in Massachusetts, grew out of university
research in the state whose academic resources and intellectual capital are widely regarded as second
to none. As one interviewee put it succinctly: “We have a lot of smart people.”
But innovation doesn’t only occur in university research labs or corporate conference rooms.
Governments can also innovate, especially regarding relatively new sectors like clean energy, and
Massachusetts’ public leaders and policymakers have done that. Governor Deval Patrick, Secretary
of Energy and Environmental Affairs Ian Bowles, and Department of Energy Resources Commis-
sioner Philip Giudice all earn generally high marks for leadership on clean energy from this report’s
strengths/assets Weaknesses/barriers
World-Class Academic, R&D, and
Innovation Resources
High Costs of Living and Energy (high overhead
for manufacturing)
Deep Commitment to Energy Efficiency Innovation-to-Commercialization Gaps
Strong Government Leadership and Policy Support Limited Natural Resources for Clean Energy
Robust Venture Capital Resources Local-Rule Tradition/Permitting Delays/NIMBYism
High Energy Demand and Costs (easier for
renewables to compete on price, good incentives
for conservation/efficiency)
Risk-Averse Financial Community
Highly Educated Workforce Lack of a National Energy Laboratory
Green-Minded, Supportive Citizenry Limited Clean-Energy Manufacturing Infrastructure

© 2010 Clean Edge, Inc. (www.cleanedge.com).A Clean Edge report for the Massachusetts Clean Enery Center4
interviewees and high rankings in this report’s comparative analysis matrices. The Global Warming
Solutions Act, the Green Communities Act, and the Green Jobs Act (creating the MassCEC) lead a
healthy list of leading-edge, aggressive policy initiatives. The state’s leadership in the Northeast
states’ Regional Greenhouse Gas Initiative (RGGI), arguably the most successful cap-and-trade
systems for carbon emissions in the U.S., has also been exemplary.
Three Key Sectors: Energy Efficiency, Solar, and Energy Storage
While the state’s clean-tech activities are broad, three areas in particular rise to the top: energy
efficiency, solar, and energy storage.
Massachusetts (and most of New England) is blessed – some might say cursed – with an ideal set of
factors that make energy efficiency and conservation attractive: extreme climate, high energy prices,
and aged building stock. All these factors make Massachusetts a ripe area for efficiency, the sector
that many call clean-tech’s “low-hanging fruit.” State government, utilities, and industry have all
shown strong leadership on efficiency, with companies like EnerNOC and Conservation Services
Group emerging as key innovators in the sector.
Massachusetts may not come immediately to mind as a sunny state. But many early advances in
solar PV were pioneered here, and by the end of 2010, Massachusetts solar PV installations are
projected to show 18x growth over four years from 3.5 megawatts (MW) to 63 MW. The number
of in-state solar installers has quadrupled in 18 months. The state’s Commonwealth Solar rebate
program, sold out in 2009 and renewed in 2010, offers up to $10,500 in rebates for residential PV
systems and up to $5,500 for commercial systems of 5 kilowatts (kW) or less. We expect to see even
more startup companies joining a robust roster of Massachusetts innovators that includes Evergreen
Solar, Konarka, Solectria, 1366 Technologies, Spire Solar, and Wakonda Technologies.
The third key industry sector showing strong Massachusetts clean-energy leadership is advanced
energy storage – from electric-vehicle batteries to utility-scale electricity storage. It’s a fast-growing,
increasingly important niche that depends heavily on the type of R&D breakthroughs in which
Massachusetts excels, at MIT and many other institutions. Bay State companies such as A123
Systems, Boston-Power, Evercel, General Compression, Premium Power, and others give the state a
solid cluster of storage innovation and commercialization.
the Keys to success: Innovation and Diversity
For the greatest impact, the state should play to its nation-leading strength in research, develop-
ment, and innovation, across a range of clean-energy sectors. Efficiency, solar, and energy storage
deserve special attention and policy support as key leadership sectors, but not to the exclusion of
innovation, breakthroughs, and successful startups in a range of other sectors, including offshore
wind, wave and tidal power, low-carbon and green materials, cellulosic biofuels, and wood pel-
lets and other biomass sources. It is that diversity that will continue to attract the best students,
entrepreneurs, financiers, and policy experts from across the country and around the world – and

© 2010 Clean Edge, Inc. (www.cleanedge.com).A Clean Edge report for the Massachusetts Clean Enery Center 5
keep Massachusetts-educated talent seeking to stay in the state. Ultimately, Massachusetts’ greatest
clean-energy leadership is as a birthplace of ideas.
strategy and Recommendations
In order to best leverage its strengths and overcome its biggest barriers to advance its already strong
clean-energy leadership, we recommend nine key actions that the state should take:
Establish an energy-efficiency innovation center and pursue a 1. national Department of energy (Doe) laboratory.
The presence of a high-profile, multiple-stakeholder center for research in efficiency technologies
would help attract targeted funding and cement the state’s stature as a world hub in this sector. A
Massachusetts-based national DOE lab is the optimum scenario. The state is already applying for the
DOE’s Energy Efficient Building Systems Design Energy Innovation Hub – one of three such new
hubs announced in December 2009. The hub will be the core of a $129.7 million federal Energy
Regional Innovation Cluster – exactly what Massachusetts needs.
Adopt aggressive financial incentives for clean energy.2.
Massachusetts is already taking a number of key steps to finance clean energy in the state, most
notably its RPS solar carve-out program, which took effect in 2010. The state must closely monitor
the results of this program to ensure it is on pace to meet the state’s solar deployment targets. Other
potential incentives for solar and other technologies include a well-structured, carefully calibrated
feed-in tariff and production and/or investment tax credits for clean-energy projects.
establish a Massachusetts “Green bank” to accelerate funding 3. for clean-energy and energy-efficiency startups and projects.
We believe that an independent, government-sponsored enterprise that provides loan guarantees,
debt instruments, and other financing tools to stimulate private-sector lending and investments in
clean energy can work on the state level. We recommend that Massachusetts become the first state
to do this. Policy analysts say a Green Bank can leverage public spending by 10x to 20x – a $10
million state outlay could attract $100 million to $200 million in private capital. This could help
engage the state’s large traditional financial players in the clean-energy space where they have not
been active to date, address the shortage of seed-stage investments, and help keep capital within the
state for local projects, companies, and job creation.
continue to increase commercialization of clean-energy research 4. advances.
The gap from lab innovation to market commercialization is a key clean-energy weakness in
Massachusetts. The state took a big step to address this in March 2010 with the launch of the
Company Catalyst Program, which brings MassCEC funds to the Massachusetts Technology Transfer
© 2010 Clean Edge, Inc. (www.cleanedge.com).A Clean Edge report for the Massachusetts Clean Enery Center6
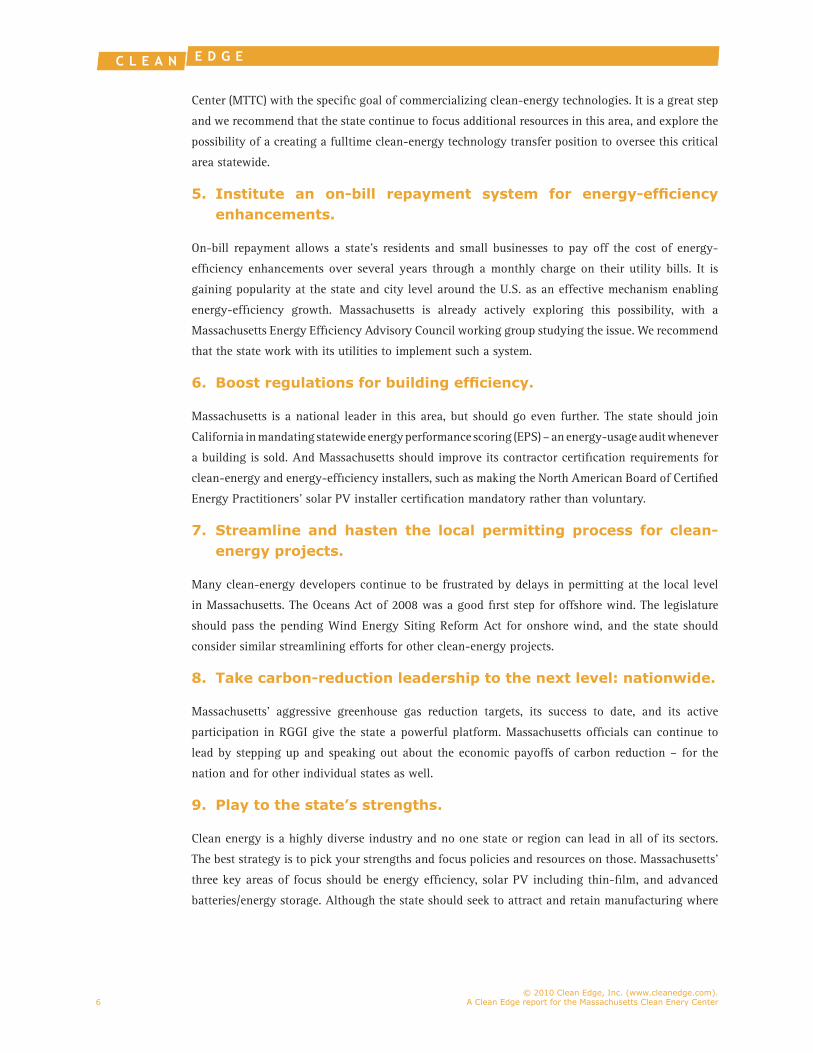
Center (MTTC) with the specific goal of commercializing clean-energy technologies. It is a great step
and we recommend that the state continue to focus additional resources in this area, and explore the
possibility of a creating a fulltime clean-energy technology transfer position to oversee this critical
area statewide.
Institute an on-bill repayment system for energy-efficiency 5. enhancements.
On-bill repayment allows a state’s residents and small businesses to pay off the cost of energy-
efficiency enhancements over several years through a monthly charge on their utility bills. It is
gaining popularity at the state and city level around the U.S. as an effective mechanism enabling
energy-efficiency growth. Massachusetts is already actively exploring this possibility, with a
Massachusetts Energy Efficiency Advisory Council working group studying the issue. We recommend
that the state work with its utilities to implement such a system.
Boost regulations for building efficiency.6.
Massachusetts is a national leader in this area, but should go even further. The state should join
California in mandating statewide energy performance scoring (EPS) – an energy-usage audit whenever
a building is sold. And Massachusetts should improve its contractor certification requirements for
clean-energy and energy-efficiency installers, such as making the North American Board of Certified
Energy Practitioners’ solar PV installer certification mandatory rather than voluntary.
streamline and hasten the local permitting process for clean-7. energy projects.
Many clean-energy developers continue to be frustrated by delays in permitting at the local level
in Massachusetts. The Oceans Act of 2008 was a good first step for offshore wind. The legislature
should pass the pending Wind Energy Siting Reform Act for onshore wind, and the state should
consider similar streamlining efforts for other clean-energy projects.
take carbon-reduction leadership to the next level: nationwide. 8.
Massachusetts’ aggressive greenhouse gas reduction targets, its success to date, and its active
participation in RGGI give the state a powerful platform. Massachusetts officials can continue to
lead by stepping up and speaking out about the economic payoffs of carbon reduction – for the
nation and for other individual states as well.
Play to the state’s strengths.9.
Clean energy is a highly diverse industry and no one state or region can lead in all of its sectors.
The best strategy is to pick your strengths and focus policies and resources on those. Massachusetts’
three key areas of focus should be energy efficiency, solar PV including thin-film, and advanced
batteries/energy storage. Although the state should seek to attract and retain manufacturing where

© 2010 Clean Edge, Inc. (www.cleanedge.com).A Clean Edge report for the Massachusetts Clean Enery Center 7
possible, it should mainly focus on extending its leadership as a hub of research breakthroughs and
innovation excellence in clean-energy technologies and business models. This globally influential,
innovation-centric approach will continue to create high-level scientific, technical, and business
management jobs, as well as thousands of green collar jobs in installing, operating, and maintaining
these technologies.

© 2010 Clean Edge, Inc. (www.cleanedge.com).A Clean Edge report for the Massachusetts Clean Enery Center8
IntRoDUctIon
Without question, Massachusetts is one of the top clean-energy leaders in the United States. The Bay
State is home to a robust range of assets for building a clean-energy economy, including world-class
university and research resources; strong state government leadership; solid venture capital invest-
ment; and a rich heritage of entrepreneurialism and technology development. Particularly in the past
three years, the state has elevated clean energy to one of its top economic development priorities,
along with high tech and biotechnology, with a range of public policy advances and financial levers.
Among other initiatives, the Green Communities Act, the Green Jobs Act, and the Global Warming
Solutions Act have clearly cemented the state’s position as a national leader in smart, proactive
policies promoting clean-energy development.
Around the U.S. and beyond, Massachusetts enjoys a reputation as a robust hub of clean-energy
innovation and wealth creation. To cite just one example, the Cambridge-based New England Clean
Energy Council has been named one of the top 10 clean-tech cluster organizations in the world
for 2010 by Sustainable World Capital, an Atlanta-based firm that facilitates investments in clean-
energy and sustainability companies.
Our primary and secondary research for this report bears this out. Our ranking matrix of the Top 15
clean-energy states – assessing those states’ strengths and weaknesses in 56 categories of regulatory
and financial policy, knowledge capital, and economic development – puts Massachusetts in second
place among all U.S. states, behind only California. In our interviews with 21 key Massachusetts
clean-energy leaders and principals in government, industry, academia, advocacy, research, and
finance, we asked each one to give the state two different grades from a low of 1 to a high of 10. On
the metric of where the state rates in clean-energy leadership compared to other states, the average
grade was an excellent 7.9. But on the question of how Massachusetts performs compared to where
they think it could or should be, the average grade dropped to 5.8.
Clearly there is no time to rest on any laurels – not when competing with states across the U.S.
and regions around the world for talent, jobs, and funding in what we believe is the key economic-
growth sector of the 21st century. There is no question that Massachusetts can improve its clean-
energy stature and improve its growth in job and wealth creation, carbon emissions reduction, and
technology innovation.
In this report, we map out paths for the state to do that. After examining Massachusetts’ top clean-
energy assets and barriers/weaknesses, we delve into the Leadership Scorecard, a detailed analysis
of how Massachusetts and the other Top 15 states measure up in Regulatory Incentives and Drivers,
Financial Incentives and Drivers, and Knowledge Capital and Economic/Workforce Development.
We then present a Nine-Point Action Plan, outlining policy recommendations and specific steps that
the state can take to continue driving its clean-energy economy forward – and perhaps move up in
any future state rankings.
Around the U.S.
and beyond,
Massachusetts enjoys
a reputation as a
robust hub of clean-
energy innovation
and wealth creation
© 2010 Clean Edge, Inc. (www.cleanedge.com).A Clean Edge report for the Massachusetts Clean Enery Center 9
clean-eneRGY state leaDeRsHIP scoRecaRD
To create Clean-Energy State Leadership Scorecard, Clean Edge first analyzed all 50 states for a range
of clean-energy initiatives and activities, from overall clean-energy patent and investment activity
to clean-tech supportive policies and institutions. This analysis enabled Clean Edge to cull the list
down to the Top 15 states. After narrowing the list, Clean Edge evaluated the Top 15 states in 56
different categories. All categories were weighted equally to come up with our Top 15 ranking of CA,
MA, OR, CO, NJ, CT, NY, MD, WA, MN, AZ, IL, FL, PA, and TX. California, Massachusetts and Oregon
topped the list, meeting 86 percent, 80 percent, and 77 percent of our criteria respectively. No. 15
Texas, by comparison, rated positively in only 36 percent of our categories. Detailed definitions
of each category can be found in the report’s Appendix on page 49. The report presents in-depth
discussions and analysis of the results in each sub-section of the matrix beginning on page 23 in
the Leadership Scorecard section.
It’s important to note that this report, and all of the state-by-state matrix data within it, represents a
snapshot of the Massachusetts and U.S. clean-energy landscape in April 2010. This is a fast-moving
sector on both the industry and policy fronts, and things can change on a weekly basis or faster.
As just one example, during the final preparation of this report, Colorado Gov. Bill Ritter signed a
bill raising his state’s renewable portfolio standard (RPS) mandate from 20 percent to 30 percent by
2020 – the most aggressive in the nation.
States across the country are clearly vying for clean-energy leadership, continuing to push the
envelope on policy and economic development initiatives. One year or even six months from now,
the Leadership Scorecard could look significantly different. Today’s leaders can quickly become to-
morrow’s laggards, and vice versa. It is imperative that Massachusetts, while celebrating its deserved
successes, continue to push forward and seek new aggressive, innovative strategies and policies that
will advance its position as a leading clean-energy state.
While this is not a definitive, weighted ranking, it provides an important and valuable benchmark-
ing on states’ performance. See matrix research on the following two pages.

© 2010 Clean Edge, Inc. (www.cleanedge.com).A Clean Edge report for the Massachusetts Clean Enery Center10
CA MA OR CO NJ CT NY MD WA MN AZ IL FL PA TX
stanDaRDs
Appliance/Equipment Efficiency Standards Beyond Federal • • • • • • • • •Contractor Certification • • • • • • •Energy Efficiency Resource Standard • • • • • • • • • • • •Procurement Mandates • • • • • • • • • • • •Renewable Energy/Energy Efficiency Technology Certification • • • • •Statewide Renewable Fuel Standard • • • • • • •
bUIlDInG coDes
Current Building Energy Codes Meet or Exceed Latest IECC and ASHRAE Standards
• • • • •
LEED Green Building Requirements for State-Owned Buildings • • • • • • • • • •Mandated Energy Performance Scoring Statewide for Residential or Commercial Buildings
•
Mandated Energy Efficiency Improvements for State-Owned Buildings • • • • • • • • • • • • •
UtIlItY ReGUlatIons
Decoupling • • • • • • • • • • •Public Benefit Fund • • • • • • • • • •Cost Recovery Other Than Public Benefit Fund • • • • • • • • • • • • • • •Smart Meters Penetration Greater Than 5% of State’s Electric Meters • • •Standardized Power Purchase Agreement • • • • • • • • • • •Strong Interconnection Law/Policy • • • • • • • • •Strong Net-Metering Law/Policy • • • • • • • • • • •
ReneWable PoRtfolIo stanDaRD
20% or Higher by 2020 or Earlier; or 25% by 2025 • • • • • • • • •Enforceable • • • • • • • • • • • •Incentives •Inclusion of Set-Asides • • • • • • • • •No Clean Coal or Nuclear Power • • • • • • • • • • • • •No Large Scale Hydro (30 MW or Greater) • • • • • • • • •Penalties • • • • • • • • • • • •
caRbon ReDUctIon coMMItMent
Climate Action Plan • • • • • • • • • • • • • •GHG Reduction Target Using 1990 Levels or Better by 2020 or Earlier • • • • • • • •GHG Reduction Targets Mandated by Law • • • • • • • • • • • • •Membership in Regional Climate Initiative • • • • • • • • • •
solaR anD WInD easeMent anD access laWs
Solar • • • • • • • • • • •Wind • • • • •
REG
ULA
TORY I
NCEN
TIV
ES
AN
D D
RIV
ERS

© 2010 Clean Edge, Inc. (www.cleanedge.com).A Clean Edge report for the Massachusetts Clean Enery Center 11
CA MA OR CO NJ CT NY MD WA MN AZ IL FL PA TX
FIN
AN
CIA
L IN
CEN
TIV
ES
AN
D D
RIV
ERS coMMeRcIal taX IncentIVes
Investment Tax Credit • • • • •Production Tax Credit • • •
ResIDentIal anD InDIVIDUal taX IncentIVes
Income Tax Exemption or Reduction • • • • •Property Tax Exemption or Reduction • • • • • • • • • • • •Sales Tax Exemption or Reduction • • • • • • • • • •
InVestMent actIVItY
State Equity Fund • • • • •Venture Capital and Other Private Investment ($400M+, 2007-09) • • • • • • • •Venture Capital and Other Private Investment (30+ Deals, 2007-09) • • • •
UtIlItY IncentIVes
Renewable Energy and/or Energy Efficiency Loans Offered by More Than 5% of Utilities
• • • • • • •
Renewable Energy and/or Energy Efficiency Rebates Offered by More Than 20% of Utilities
• • • • • • • • •
State Performance Incentives for Utilities • • • • • • • • • •
loan/casH IncentIVes
Direct Loan Programs • • • • • • • • • • • •Grant Programs • • • • • • • • • • • • • •Loan Guarantees • • • • • • • • • • • •PACE Financing Program and/or Legislation • • • • • • • • • • •On-Bill Repayment Mandate • • • • • • •Renewable Energy Certificate Incentives • • • • • • • • • • • • •Statewide Feed-In Tariff Program or Legislation • • •
KnoWleDGe caPItal
At Least One Global Top-Ranked Green MBA Program • • • • • • • • • • • •Campus Climate Commitment Member (20% or More) • • • • • • • • • •Innovative Clean Energy Academic Programs (5% or More) • • • • •Top-Ranked Overall Green Universities (10% or More) • • • • • • • •
econoMIc/WoRKfoRce DeVeloPMent
Clean-Energy Jobs as a Percentage of Total Jobs (0.5% or More of State Total)
• • • • • • • •
Clean-Energy Patents Registered (3% or More of U.S. Total, 2002-09) • • • • • • • •Presence of a Clean Energy Alliance Business Incubator • • • • •Presence of a Department of Energy National Lab • • • • • • • • •
total Marks 48 45 43 35 35 34 34 32 32 30 28 28 24 24 20
Percent of total Marks Possible 86% 80% 77% 63% 63% 61% 61% 57% 57% 54% 50% 50% 43% 43% 36%
KN
OW
LED
GE C
API
TAL
AN
D
ECO
NO
MIC
/WO
RKFO
RCE
DEVELO
PMEN
T
CA MA OR CO NJ CT NY MD WA MN AZ IL FL PA TX
© 2010 Clean Edge, Inc. (www.cleanedge.com).A Clean Edge report for the Massachusetts Clean Enery Center12
Report Methodology
For A Future of Innovation and Growth, Clean Edge used a comprehensive research methodology including external
interviews and primary and secondary research. The report is based on:
n Expert interviews. We spoke with more than 20 interviewees representing a range of interests in Massachu-
setts including industry, government, finance, research, and academia. These one-on-one interviews explored
Massachusetts’ strengths and weaknesses; past and current policy, financial, and academic initiatives; and
opportunities for the state to move forward in clean energy.
nDetailed matrix analysis. We reviewed more than 200 sources in evaluating and benchmarking Massachusetts
against the Top 15 states. This analysis resulted in 56 separate criteria on which we evaluated and ranked the
top states.
nOnline research of technology, financial, and policy news and announcements in Massachusetts and throughout
the U.S.
Interview participants in alphabetical order: (affiliations listed represent those held at the time interviews
were conducted)
Bill Aulet Abi Barrow Howard Berke Ian BowlesMIT Entrepreneurship
Center
Massachusetts Technology
Transfer Center
Good Energies/Konarka Commonwealth of
Massachusetts
Patrick Cloney Nicholas D’Arbeloff Rob Day John deVillarsMassachusetts Clean Energy
Center
New England Clean Energy
Council
Black Coral Capital BlueWave Strategies
Gregg Dixon Eric Emmons Andrew Friendly Dan GoldmanEnerNOC Siemens Venture Capital Advanced Technology
Ventures
Great Point Energy
B. Eric Graham Berl Hartman Marc Hoffman Stan KowalskiFraunhofer Center for
Sustainable Energy Systems
Environmental Entrepreneurs Consortium for Energy
Efficiency
FloDesign Wind
Turbine
Galen Nelson Bic Stevens Hemant Taneja Susan TierneyBoston Redevelopment
Authority
Stevens Capital
Management
General Catalyst Partners Analysis Group
David VieauA123 Systems

© 2010 Clean Edge, Inc. (www.cleanedge.com).A Clean Edge report for the Massachusetts Clean Enery Center 13
As befits its position of leadership, Massachusetts enjoys an abundance of key assets that support the
state’s intentions and successes in growing its clean-energy economy. The state also has weaknesses
in some areas – barriers that will need to be overcome for Massachusetts to significantly advance
its clean-energy leadership. Our interviews and research uncovered seven major assets and seven
significant barriers or weaknesses.
top state clean-energy assets
WORLD-CLASS ACADEMIC, R&D, AND INNOVATION RESOURCES Clearly topping the list of Massachusetts’ clean-energy assets are its second-to-none university,
research, and innovation resources. Virtually every expert we interviewed cited this strength, and
usually cited it first. The “education capital of the world,” in the words of one interviewee, feeds
the Massachusetts clean-energy economy with research breakthroughs, business ideas, and work-
ers skilled in engineering, materials sciences, biochemistry, entrepreneurship, policy expertise, and
many other relevant disciplines.
MIT is clearly the leader in this area and the envy of other regions vying for clean-energy leadership.
“We need an MIT,” said one Pacific Northwest principal in a 2008 Clean Edge/Climate Solutions
report, Carbon-Free Prosperity 2025, which examined that region’s clean-energy leadership. MIT
also earned kudos from interviewees for allying more with other institutions than it has in the past;
Fraunhofer USA’s Center for Sustainable Energy Systems at MIT, launched in 2008 to focus on
advanced research in solar and building efficiency technologies, is a prime example.
But Massachusetts’ innovation resources extend far beyond MIT’s Cambridge campus. Harvard,
Boston University, Western New England College, UMass campuses in Amherst, Boston, Dartmouth,
MassacHUsetts assets anD baRRIeRs
strengths/assets Weaknesses/barriers
World-Class Academic, R&D, and
Innovation Resources
High Costs of Living and Energy (high overhead
for manufacturing)
Deep Commitment to Energy Efficiency Innovation-to-Commercialization Gaps
Strong Government Leadership and Policy Support Limited Natural Resources for Clean Energy
Robust Venture Capital Resources Local-Rule Tradition/Permitting Delays/NIMBYism
High Energy Demand and Costs (easier for
renewables to compete on price, good incentives
for conservation/efficiency)
Risk-Averse Financial Community
Highly Educated Workforce Lack of a National Energy Laboratory
Green-Minded, Supportive Citizenry Limited Clean-Energy Manufacturing Infrastructure

© 2010 Clean Edge, Inc. (www.cleanedge.com).A Clean Edge report for the Massachusetts Clean Enery Center14
and Lowell, and dozens of other universities and business schools throughout the state combine
to form a rich resource, with new clean-energy-related curricula and activities springing up on a
regular basis. On The Aspen Institute’s 2009 ranking of the world’s Top 100 Green MBA programs,
Massachusetts is particularly strong with seven programs: Babson, Bentley, Boston College, BU,
Brandeis, MIT, and UMass-Boston. And the Bay State’s campuses ‘walk the walk’ as well; Harvard’s
20 LEED-certified buildings and renovation projects – spawning “Green is the New Crimson” ban-
ners in Harvard Yard – are the most of any higher-education institution in the world.
DeeP coMMItMent to eneRGY effIcIencY
Massachusetts’ extreme winter and summer climates, older building stock, and high energy prices
(see section below) make it a perfect place to realize the benefits of energy efficiency, and the state
has responded with efficiency leadership by its public officials, industry, and utilities. Home to such
efficiency pioneers as EnerNOC, Conservation Services Group, and Next Step Living, the Bay State
is a clear national leader in this fast-growing, labor-intensive, job-creating sector.
Among many progressive policy initiatives, the 2008 Green Communities Act’s least-cost procure-
ment mandate requires that the state’s utilities invest in all energy-efficiency deployments deemed
cheaper than new supply. As a result, the state’s investor-owned utilities are expected to spend $1.3
billion on efficiency in the next three years.
stRonG GoVeRnMent leaDeRsHIP anD PolIcY sUPPoRt
Governor Deval Patrick’s administration has clearly made clean energy a top priority, establishing
the Massachusetts Clean Energy Center (MassCEC) and working with the legislature to pass a great
deal of supportive legislation, most notably the Green Communities Act, the Global Warming Solu-
tions Act, and the Green Jobs Act. Secretary of Energy and Environmental Affairs Ian Bowles earns
high leadership marks from this report’s interviewees, as does Department of Energy Resources
Commissioner Philip Giudice, a former senior VP at EnerNOC. Massachusetts was the first state to
consolidate energy and environmental affairs into one cabinet post, a move that many feel should
be a model for other states, and ultimately the nation.
“Clean-tech leaders have great access to the secretary and the governor,” said one respondent.
“You’d be hard-pressed to find a group as dedicated as this one,” said another. Massachusetts has
also been a leader within the Northeast’s Regional Greenhouse Gas Initiative (RGGI), and the state’s
representatives in Congress, most notably Rep. Edward Markey and Sen. John Kerry, have been
top clean-energy leaders on the national stage. In ARPA-E grants for R&D announced in October
2009, Massachusetts companies received 23 percent of these available federal stimulus dollars. Mas-
sachusetts officials, competing with California in a Red Sox/Yankees-like rivalry, enjoy pointing out
that this was well ahead of California’s 14 percent.
RobUst VentURe caPItal ResoURces
Massachusetts has a rich venture-capital heritage from Route 128’s high-tech heyday in the 1980s,
and in clean energy, its VC community and funding levels are the envy of every other state except
one: California. From 2007 to 2009, Massachusetts’ clean-energy companies lured $1.1 billion in
VC and private investment deals, well ahead of third-place New York’s $855 million, according to

© 2010 Clean Edge, Inc. (www.cleanedge.com).A Clean Edge report for the Massachusetts Clean Enery Center 15
Bloomberg New Energy Finance data. Not surprisingly, California led the field by a wide margin
with $7 billion.
Pioneering Massachusetts venture firms like RockPort Capital Partners, Flybridge Capital Partners,
Advanced Technology Ventures, @Ventures, General Catalyst Partners, and Braemar Energy Ven-
tures give Massachusetts’ clean-energy entrepreneurs a strong resource from which to draw. Many
interviewees, however, feel that Massachusetts VCs have become too risk-averse and less willing to
lead with new ventures, particular at early stages of funding. We address this in more detail in the
Top State Barriers section on page 17 and the 9-Point Action Plan discussion on page 44.
HIGH eneRGY DeManD anD costs
Because of the climate issues noted in the efficiency section above, Massachusetts and its sur-
rounding region create high energy demand. On top of that, with few local conventional, fossil-fuel
energy resources, Massachusetts’ and New England’s electric grid relies heavily on fuels piped in
from outside the region: natural gas and oil. A very low percentage of coal in New England’s energy
mix – less than nine percent in 2009, according to ISO New England – is good news for regional
carbon emissions. But it means that nearly two-thirds (63 percent) of the region’s electricity comes
from two of the most expensive and volatile power sources in the nation, natural gas (38 percent)
and oil (25 percent) – giving Massachusetts some of the highest electric rates in the U.S.
Why is this an asset? It means that in Massachusetts, clean-energy sources like wind and solar – with
their costs generally declining over time – can more easily compete with natural gas and oil to reach
grid parity. High kilowatt-hour prices also greatly incentivize energy savings through efficiency and
conservation, another key to Massachusetts’ leadership in that area.
HIGHlY eDUcateD WoRKfoRce
The combination of the rich academic assets discussed above, and the high quality of life offered
in New England, gives Massachusetts’ clean-energy sector a local workforce that’s well trained in
relevant skills. Some 40 percent of people earning PhD degrees from MIT, for example, choose to
stay in the state. “The sheer amount of brainpower in places like Cambridge and Amherst is impres-
sive,” said one interviewee. The state has “a very rich and deep strength in technology skills,” said
another. And beyond its residents with four-year and graduate degrees, the state is working to train
community college students and low-income residents in clean-energy skills like solar panel and
weatherization installation with programs like Pathways out of Poverty.
GREEN-MINDED, SUPPORTIVE CITIZENRY
Despite notable pockets of NIMBYism that we will discuss next in the Barriers section, Massachu-
setts residents are generally quite supportive of clean energy and carbon emissions reduction. An
overwhelming 67 percent of Bay State voters support a national cap-and-trade system, with just 21
percent opposed, according to a Benenson Strategy Group poll taken in January 2010 just after Re-
publican Scott Brown’s victory in the state’s special U.S. Senate election. In the poll, Massachusetts
Republicans supported cap-and-trade by 47 to 38 percent, and those who voted for Brown favored
it by a 50-36 percent margin.
High kilowatt-hour
prices also greatly
incentivize energy
savings through
efficiency and
conservation

© 2010 Clean Edge, Inc. (www.cleanedge.com).A Clean Edge report for the Massachusetts Clean Enery Center16
Massachusetts’ long history of environmental awareness and activism has been a double-edged
sword at times, pitting local ‘enviros’ against clean-energy project developers. But the false di-
chotomy of environment vs. economy that’s present in many states is generally not the prevailing
view in Massachusetts. The message that clean energy is a key part of the state’s economic future has
resonated with the public, and that has helped the state’s political leadership move ahead on many
clean energy fronts – even in a recessionary, tight-budget period.
top state clean-energy barriers
HIGH costs of lIVInG anD eneRGY
Although the high energy costs cited in the Assets section are great incentive for renewables and
energy efficiency development and deployment in Massachusetts, they bring a major downside of
high overhead for businesses and enterprises of all types. Clean-energy companies, large and small,
are no exception. And energy is just one component of a slew of high costs for office and factory
space, labor, and housing; Massachusetts is among the most expensive states in the U.S. in all those
categories.
This poses challenges for the state in starting, expanding, retaining, and attracting clean-energy
companies. “It’s hard to launch and grow a business here,” one interviewee said bluntly. “It’s a high-
cost state.” It’s a particular challenge for clean-energy businesses with labor-intensive, production-
line operations, like manufacturers of wind turbines and related components. When Massachusetts
competes against lower labor-cost states like Michigan and North Carolina for clean-tech manu-
facturers, said one respondent, it is a bit like the larger manufacturing competition between the
U.S. and China. This barrier is one of several key reasons why we urge Massachusetts to focus on
its strength as a leader in high-value innovation, which we discuss in detail in the Clean-Energy
Industry Leadership section on page 19.
INNOVATION-TO-COMMERCIALIZATION GAPS
No one questions Massachusetts’ bona fides in clean-energy research talent and engineering ad-
vances in its labs and universities, from thin-film solar and demand-side management systems to
energy storage, cellulosic biofuels, wind turbine blade design, electric vehicle batteries, and scores
of other important technologies. But too often, these lab breakthroughs never “break through” to
commercial success. Interviewees blamed a range of factors for this, among them risk-averse local
financiers, lack of university-entrepreneurial partnerships, and an overall academically focused
research culture.
Some experts that we surveyed pointed to California and Silicon Valley as a much better model for
bringing innovation from lab to market. “Academics here do not have the same tradition of turning
innovations into commercial products,” said one expert. “It’s just a lack of that culture. They actively
distrust venture capitalists, and [breakthroughs] sit on the shelf here.” Many interviewees agreed.
“We have the best resources for developing new technologies, bar none,” said another. “But we’re
lacking in building out test beds and getting to commercialization.”

© 2010 Clean Edge, Inc. (www.cleanedge.com).A Clean Edge report for the Massachusetts Clean Enery Center 17
lIMIteD natURal ResoURces foR clean eneRGY
Falling squarely in the “through no fault of its own” category, Massachusetts is a small state with
comparatively limited resources for solar energy, onshore wind power, geothermal, and biomass. For
onshore wind especially, there just isn’t much open space; Massachusetts ranks third behind only
New Jersey and Rhode Island in population density among the 50 states. (Only four of the Top 15
are small states: Massachusetts, New Jersey, Connecticut and Maryland). So Massachusetts is not
the place where we’ll see large, utility-scale wind or solar deployments of the type in California,
Texas, and the Midwest. Compared with other states and regions, Massachusetts’ best clean-energy
resources are in two sectors still nascent and largely untapped in the U.S. today: offshore wind and
wave/tidal power. The Marine Renewable Energy Center on UMass-Dartmouth’s campus in Fall River
focuses on R&D in those sectors.
It should be noted, however, that the absence of Arizona or California-caliber solar resources need
not thwart the development of a thriving, job-creating solar industry. Germany, the world’s largest
solar PV market, has proven that. Massachusetts should continue to expand its focus on innovation
and deployment in solar.
local-RUle tRaDItIon/PeRMIttInG DelaYs/nIMbY-IsM
There’s no question that some clean-energy deployments are environmentally harmful and should
not be sited, but in the opinion of many, Massachusetts has taken this opposition to the extreme. A
combination of New England’s strong town-government system, local environmental activism, and
the plain old ‘not in my backyard’ (NIMBY) syndrome has frustrated many clean-energy developers
in the state. Even though the state’s citizenry strongly supports clean-energy growth in general,
specific local projects can be another story. “A lot of people may want a project but a few don’t,
and our distributed governance model makes it fairly easy for them to stop or delay it,” said one
expert.
Local opposition to the massive offshore Cape Wind project in Nantucket Sound is the most prominent
example, known the world over, but many other smaller-scale projects in Massachusetts have also
faced significant delays. The 12 megawatt (MW) Minuteman Wind project in the Berkshires took six
years for approval. Opposition to Madera Energy’s 47 MW combined heat and power biomass plant
in Greenfield has helped lead to a 2010 statewide ballot measure that would severely limit CO2 emis-
sions from biomass plants. A single 600 kilowatt (kW) wind turbine in a Newburyport industrial park
took more than three years from proposal to operation. It’s no coincidence that the nation’s leading
anti-wind coalition, National Wind Watch, is based in Massachusetts. Some frustrated clean-energy
developers say that things have gone beyond NIMBY to an even more colorful acronym, BANANA
– “build absolutely nothing anywhere near anything.” State clean-energy leaders acknowledge this
barrier and have started legislative actions, including the Ocean Act (passed in 2008) to ease offshore
wind development, and the Wind Energy Siting Reform Act (pending in the legislature) to streamline
permitting for onshore wind.
Many experts say
Massachusetts-
based VCs and
other investors
are falling even
farther behind as
risk-takers
© 2010 Clean Edge, Inc. (www.cleanedge.com).A Clean Edge report for the Massachusetts Clean Enery Center18
RIsK-aVeRse fInancIal coMMUnItY
Massachusetts is rightfully proud of its status as the No. 2 state for clean-energy venture capital,
behind California. But it is a distant second, and many experts say Massachusetts-based VCs and
other investors are falling even farther behind as risk-takers backing new, leading-edge ventures
in the state. As one example, the three VC firms funding FloDesign Wind Turbine, the promising
Wilbraham-based wind innovator, are all Silicon Valley firms, including Kleiner Perkins Caufield
& Byers. “There’s a large pool of capital here,” said one interviewee, “but not enough seed-stage
funding is getting done.”
Another big barrier is the absence of the large traditional Boston institutional finance players, like
Fidelity Investments, State Street Bank, and the state’s pension funds, in clean-energy investing.
“It’s not just a lack of money – you just don’t see them,” said one respondent. “They’re not even
surveying the landscape.”
lacK of a natIonal eneRGY laboRatoRY
As discussed above in the Assets section, Massachusetts boasts world-class clean-energy research
resources in its universities and other institutions. The one big omission in its research arsenal is
the lack of a national Department of Energy (DOE) research lab. Nine of the Top 15 states, and six
of the top eight, have at least one such DOE lab within their borders. “It would be a good focus of
funding and job creation,” said one respondent. But the state is already moving actively to rectify
this weakness, with MIT, UMass, Fraunhofer Institute, and the MassCEC joining forces to apply for
DOE’s planned $122 million Energy Innovation Hub for designing energy-efficient building systems,
one of three such hubs announced by Secretary of Energy Dr. Steven Chu in December 2009.
lIMIteD clean-eneRGY ManUfactURInG InfRastRUctURe
From shoes and textiles to computers and disk drives, Massachusetts has seen many waves of
manufacturing begin in the state and then move elsewhere. The clean-energy industry, just growing
up now, is not likely to establish a significant presence for large-scale manufacturing here. It may
have been possible five or more years ago, but today, with heated global competition to build local
and regional clean-tech economies, the state’s high costs (discussed in the first Barrier above) make
it unrealistic to compete with Ohio or China for large-scale production facilities.
The state can rightly point to some great individual success stories – Konarka manufacturing solar
PV thin film, for example, at a former Polaroid plant in New Bedford. And there is no lack of
potential for clean-energy job creation at all levels, from advanced materials research to home
weatherization installation. “We should just keep priming that engine of innovation, bring all the
R&D jobs that we can,” said one expert. “But promising vast numbers of manufacturing jobs here is
not being in touch with the new world order.”

© 2010 Clean Edge, Inc. (www.cleanedge.com).A Clean Edge report for the Massachusetts Clean Enery Center 19
In this section of the report, we explore Massachusetts’ current clean-energy leadership in detail.
What specific policies and actions have made the state a leader, and how does it stack up against
other leading states in a wide range of policy, financial, and economic development criteria? Be-
fore examining the national clean-energy leadership landscape uncovered by the research in our
state-by-state comparison matrices, we begin with a discussion highlighting the key facets behind
Massachusetts’ rise to a prominent position in the clean-energy sector.
Some states’ claims to clean-energy fame come mainly from growth and excellence in one sector,
such as Texas and Iowa in wind energy or New Jersey in solar power. Massachusetts is not like that.
Its leadership is broad and diverse, covering a wide swath of clean technologies under the very large
umbrella of innovation. Its leading clean-energy players – as seen by this report’s interviewees and
industry experts around the world – may not be the largest developers or manufacturers, but are
considered leading technology pioneers in their sectors.
Companies like A123 Systems in advanced electric batteries, EnerNOC in efficiency and demand-
side management, Konarka in organic photovoltaics, Beacon Power in flywheels, and General
Compression in large-scale energy storage are all considered top innovators. Some of these firms,
and dozens more clean-energy players in Massachusetts, grew out of university research in the state
whose academic resources and intellectual capital are widely regarded as second to none. As one
interviewee put it succinctly: “We have a lot of smart people.”
Although Massachusetts boasts a wide array of clean-energy prowess at academic institutions across
the state, MIT is its unquestioned leader. Sustainable World Capital named MIT the No. 1 clean-
tech university in the U.S. in its 2010 rankings, calling the venerable Cambridge campus “a true
clean-tech spinoff machine.” MIT’s clean-energy impact goes far beyond its world-class training of
engineers. The $200,000 MIT Clean Energy Prize for students is the most coveted of its kind in the
U.S.; 113 teams from 40 universities across the country entered the competition in 2009. The MIT
Energy Initiative, with the motto “linking science, innovation, and policy to transform the world’s
energy systems,” was founded in 2006. MIT pioneered business-plan competitions in clean energy,
and its Ignite Clean Energy Competition recently partnered with California’s similar Cleantech Open
effort to create the first true nationwide competition. The MIT Entrepreneurship Center, founded in
1990, now has a strong focus on clean-technology businesses. The list goes on, and MIT continues
to launch key research initiatives in solar, energy efficiency, and other areas.
Innovation in the statehouse
But innovation doesn’t only occur in university research labs or corporate conference rooms. Gov-
ernments also can and should think and act in new, innovative directions, especially regarding
relatively new sectors like clean energy, and Massachusetts’ public leaders and policymakers have
leaDeRsHIP scoRecaRD: MassacHUsetts In tHe toP 15 clean-eneRGY states

© 2010 Clean Edge, Inc. (www.cleanedge.com).A Clean Edge report for the Massachusetts Clean Enery Center20
done that. Governor Deval Patrick, Secretary of Energy and Environmental Affairs Ian Bowles, and
Department of Energy Resources Commissioner Philip Giudice all earn generally high marks for
leadership on clean energy from this report’s interviewees. Among the state’s key advances under
their stewardship are:
n Consolidating energy and environment under Bowles in one Cabinet post, the first state in
the nation to do that.
n Instituting the nation’s first exemption from a state gasoline tax for cellulosic biofuels.
n The Global Warming Solutions Act, which many consider the strongest greenhouse gas
(GHG) reduction act in the U.S., mandating a 10 to 25 percent reduction from 1990 levels
by 2020 and 80 percent by 2050. A February 2010 analysis by Eastern Research Group in
Lexington, Mass., projected that the state is on target to reduce statewide emissions by 18.6
percent by 2020.
n Establishment of the MassCEC under the Green Jobs Act of 2008. MassCEC is the first state
authority in the U.S. exclusively devoted to job creation and economic development in the
clean-energy sector.
n The Green Communities Act, which includes one of the nation’s most aggressive energy-
efficiency programs with $2 billion in public and private investments – three times more
per capita than the amount invested in California. Massachusetts also established a “stretch”
goal for cities and towns to set building efficiency standards 20 to 30 percent higher than
the statewide building code.
n Joining and leading within RGGI. The Northeast’s regional cap-and-trade system has gen-
erated $79 million in carbon credits to date for Massachusetts – with most of the money
going to further investments in efficiency.
n Continuing to fund and sometimes expand these programs through a major economic
downturn with severe pressure on state budgets.
The Crown Jewel: Energy Efficiency
Government policy leadership on energy efficiency makes sense, as this sector is a natural fit for the
state. Massachusetts (and most of New England) is blessed – some might say cursed – with an ideal
set of factors that make energy savings attractive. Its legendary cold winters and often hot, humid
summers create high demand for heating or cooling roughly eight months of the year. Electric rates
and heating oil prices are high. The aged building stock is often poorly insulated. All these factors
make Massachusetts a ripe area for the sector that many call clean-tech’s “low-hanging fruit:”
conservation and efficiency. A large majority of this report’s interviewees agree that the state should
continue to focus economic development efforts in this area, including the pursuit of a U.S. DOE
national lab for efficiency technologies.
Gov. Patrick agreed to lend his name to a key private-sector efficiency initiative, the Governor’s

© 2010 Clean Edge, Inc. (www.cleanedge.com).A Clean Edge report for the Massachusetts Clean Enery Center 21
Clean Energy Challenge, launched by the New England Clean Energy Council in 2009. This challenge
asks Massachusetts-based enterprises to reduce their GHG emissions by at least 10 percent over the
next three years. Participants receive free on-site energy assessments, access to a large network of
relevant in-state vendors, and significantly, reimbursement of 30 to 70 percent of project costs from
their utilities. More than 100 enterprises have joined, including the Boston Symphony Orchestra,
General Dynamics, MassMutual Financial Group, and the Lowell Spinners minor league baseball
team.
the solar opportunity
Massachusetts may not come immediately to mind as a sunny state. But many early advances
in solar PV were pioneered here, and PV manufacturer Evergreen Solar, despite its up-and-down
financial history, remains a Massachusetts clean-energy mainstay after 16 years in the business.
After efficiency, solar was the clean-energy sector cited most often by our interview respondents as
the state’s best opportunity for economic growth and job creation.
Many success metrics in solar have already been achieved. By the end of 2010, Massachusetts solar
PV installations are projected to show 18x growth over four years from 3.5 MW to 63 MW. The
number of in-state solar installers has quadrupled in 18 months. In solar manufacturing and instal-
lation combined, employment in the state doubled in 2008 and increased an additional 50 percent
in 2009, according to MassCEC. The state’s Commonwealth Solar rebate program, sold out in 2009
and renewed in 2010, offers up to $10,500 in rebates for residential PV systems and up to $5,500 for
commercial systems of 5 kW or less.
In the Nine-Point Action Plan later in this report on page 44, we offer specific policy recommenda-
tions for Massachusetts to further strengthen its solar industry and installation capacity. But it’s
clearly a strong sector already, and we expect to see even more startup companies joining a robust
roster of Massachusetts innovators that includes Evergreen, Konarka, Solectria, 1366 Technologies,
Spire Solar, and Wakonda Technologies.
leveraging Innovation: energy storage
The third key industry sector showing strong Massachusetts clean-energy leadership is advanced
energy storage. It’s a fast-growing, increasingly important niche that depends heavily on the type of
R&D breakthroughs in which Massachusetts excels. This sector spans a wide range of technologies,
from electric-vehicle batteries to utility-scale electricity storage that can help address the intermit-
tency issues of wind and solar power on the grid. Bay State companies such as A123 Systems,
Boston-Power, Evercel, General Compression, Premium Power, and others give the state a solid
cluster of storage innovation and commercialization, and MIT and other technology education lead-
ers bring considerable focus to this area.
the Keys to success: Innovation and Diversity
As we discussed in the Barriers/Weaknesses section, we don’t expect Massachusetts to be a leader in
large-scale clean-energy manufacturing or deployment. Rather, the state should play to its nation-

© 2010 Clean Edge, Inc. (www.cleanedge.com).A Clean Edge report for the Massachusetts Clean Enery Center22
leading strength in research, development, and innovation, across a range of clean-energy sectors.
Research centers such as the MassCEC’s Wind Technology Testing Center in Charlestown and the
Marine Renewable Energy Center (for both wave/tidal and offshore wind technologies) on UMass-
Dartmouth’s Fall River campus are a testament to this. So are the pockets of excellence across the
state in low-carbon and green materials, LED lighting, cellulosic biofuels, wood pellets and other
biomass sources, and many other clean-energy niches. Energy efficiency (including smart grid),
solar, and energy storage/advanced batteries deserve attention and policy support as key leadership
sectors, but not to the exclusion of innovation, breakthroughs, and successful startups in a range of
sectors. It is that diversity that will continue to attract the best students, entrepreneurs, financiers,
and policy experts from across the country and around the world – and keep Massachusetts-educated
talent seeking to stay in the state. Ultimately, Massachusetts’ greatest clean-energy leadership is as
a birthplace of ideas.
The next three sections of this report analyze the landscape of the Top 15 clean-energy states,
and where Massachusetts compares and contrasts, in three broad categories: Regulatory Incen-
tives and Drivers, Financial Incentives and Drivers, and Knowledge Capital and Workforce Capital.
Within each category are several sub-categories, with a state-by-state comparison matrix and
discussion text.

© 2010 Clean Edge, Inc. (www.cleanedge.com).A Clean Edge report for the Massachusetts Clean Enery Center 23
ReneWable PoRtfolIo stanDaRD
An RPS (also referred to as a renewable energy/electricity standard or RES) is an essential regulatory
mechanism for a state to effectively drive clean-energy policy goals. RPS mandates have become
such standard and instrumental state clean-energy policy that only one of our Top 15 states, Florida,
does not have one. However, an RPS is a relatively complex set of components that needs to be
carefully considered and thoughtfully tailored to be effective and meaningful. Below is a discussion
of RPS components and how each one relates to the overall strength of a state’s RPS mandate.
Overall, Massachusetts has a strong, comprehensive, and smart RPS. In addition to its RPS meeting
our percentage thresholds, being enforceable, having low hydroelectric limits, and no clean coal or
nuclear allowed, Massachusetts leads the other states in targeting in-state renewable energy genera-
tion. Starting in 2010, retail electric suppliers must provide a portion of their load from qualified
in-state, interconnected solar facilities. In addition, Massachusetts has a second tier requirement,
RPS Class II, that focuses on renewable projects installed prior to 1998 and waste-to-energy projects.
The RPS Class II requires utilities to purchase RECs for 3.6% and 3.5% respectively for their load.
Massachusetts could improve its standing in the RPS category, however, by providing utilities with
incentives, and raising its RPS standard even further to be among the most aggressive.
ReGUlatoRY IncentIVes anD DRIVeRs
CA MA OR CO NJ CT NY MD WA MN AZ IL FL PA TX
ReneWable PoRtfolIo stanDaRD
20% or Higher by 2020 or Earlier; or 25% by 2025 • • • • • • • • •Enforceable • • • • • • • • • • • •Incentives •Inclusion of Set-Asides • • • • • • • • •No Clean Coal or Nuclear Power • • • • • • • • • • • • •No Large Scale Hydro (30 MW or Greater) • • • • • • • • •Penalties • • • • • • • • • • • •

© 2010 Clean Edge, Inc. (www.cleanedge.com).A Clean Edge report for the Massachusetts Clean Enery Center24
RPs Goals: Percentage and Date
The first area of consideration in assessing the overall strength and effectiveness of an RPS is the
amount of clean energy it demands from utilities as a function of time. In ranking the Top 15 states,
we have qualified that an RPS should have minimum percentages and corresponding dates of at
least 20 percent by 2020 or 25 percent by 2025 to be considered a leader. In some places, targets are
increasing. Colorado recently expanded its RPS to 30 percent by 2020, making it the leading RPS in
the nation. And some executive orders, such as Gov. Arnold Schwarzenegger’s 33 percent by 2020
in California are driving additional activity, although not in the form of an official RPS.
There is also a push for “smarter” portfolio standard policies, like the one in Massachusetts which
not only covers renewable energy, but also establishes an energy efficiency goal that at least 25
percent of the state's electric load by 2020 is met with demand side resources (energy efficiency, load
management, demand response, and customer-sited generation). Oregon is another example, with
a goal of at least eight percent of retail electric supply to come from small-scale renewable-energy
projects (below 20 MW) by 2025.
Another important percentage in evaluating an RPS is the amount of total electricity generation that
is actually covered within a state. Minnesota leads the way with 100 percent of its electric supply
covered by its RPS, while Arizona’s RPS “coverage” is only about 60 percent of generation. That’s
statePeRcent sHaRe foR
ReneWables taRGet Date
California 20% 2010
Massachusetts 22.1% 2025
Oregon 25% 2025
Colorado 30% 2020
New Jersey 22.5% 2021
Connecticut 27% 2020
New York 29% 2015
Maryland 20% 2022
Washington 15% 2020
Minnesota 25% 2025
Arizona 15% 2025
Illinois 25% 2025
Florida n/a n/a
Pennsylvania 18% 2021
Texas 5,800 MW 2015
ReneWable PoRtfolIo stanDaRDs bY state
The RPS information reported in this table is based on official state legislation targets. It does not include governors' executive orders or other nonbinding renewable energy goals, such as California's 33 percent by 2020 target.

© 2010 Clean Edge, Inc. (www.cleanedge.com).A Clean Edge report for the Massachusetts Clean Enery Center 25
because Arizona’s RPS applies only to power from rural electric cooperatives and investor-owned
utilities – excluding all municipal and publicly owned utilities. Furthermore, Arizona law allows a
utility to request a waiver from any provision for "good cause.” States should be keenly aware of
crafting legislation that covers as close to 100 percent of their utility sector as possible.
enforceability and Penalties
In order to ensure genuine efforts toward achieving the percentage and time goals of an RPS,
there need to be enforceable penalties for non-compliance. While this is a very simple and logical
concept, the reality of implementation can be complicated and difficult. Most of the states we
reviewed in this report have enforceable penalties for non-compliance.
In most of the Top 15 states, penalties are issued and enforced by the public utility commissions in
the form of alternate compliance payments (ACPs). Generally, the ACP in each state ranges from
$45 to $65 per MW of shortfall. In Connecticut, the public utility commission can revoke an electric
retailer’s license for non-compliance. Arizona is an example of a state with very weak penalties in
place. No set penalty amount exists, utilities can request waivers for “good cause,” and penalties are
arbitrarily enforced by the Arizona Corporation Commission.
Inclusion of set-asides or carve-outs
States can influence levels of direct financial investment into specific renewable energy technologies
and applications through the inclusion of set-asides or carve-outs in their RPSs. In most cases, this
tool is used for solar and distributed generation assets. For example, New Jersey’s RPS has a 2.12
percent solar set-aside requirement by 2021. This mandate created a specific type of REC referred
to as a solar REC, or SREC. The SRECs have historically traded at a significantly higher value than
generic New Jersey RECs, and therefore New Jersey has seen a significant investment into solar
projects. According to NJcleanenergy.com, there have been 5,189 solar projects in the state from
2001 to January 2010 for a total of 133,205 kW, creating total SRECs worth more than $308 million.
States with set-asides or carve-outs for distributed generation systems include Arizona, Colorado,
and New York.
clean coal and nuclear
Currently, no states reviewed in this study include nuclear power in their RPS portfolios. We agree
that nuclear does not fit within the definition of clean or renewable energy. A legislative proposal
in Arizona to include nuclear in its RPS, which would have essentially meant the state had already
reached its RPS target and would need no more solar development, was quickly withdrawn after
intense opposition in February 2010.
Only Pennsylvania includes “clean coal” as part of its RPS, which includes waste coal, coal mine
methane, and integrated gasification combined cycle. While advanced “clean coal” technologies are
incrementally better than conventional coal combustion, they too do not fit within our definition
of clean or renewable energy due to the negative environmental impacts associated with extraction
of coal, the health issues associated with its handling and emissions, and the fact that it is a finite
resource with a limited supply.

© 2010 Clean Edge, Inc. (www.cleanedge.com).A Clean Edge report for the Massachusetts Clean Enery Center26
Hydro Power
Some regions, particularly the Pacific Northwest and Ontario, Canada, have very rich hydroelectric
power resources. For these regions it makes sense to consider responsibly designed and managed
hydro infrastructure as part of a clean-energy resource portfolio. Qualifying hydro power should be
certified by a third-party verification organization in order to receive clean-energy status. Hydro
power that places a strain on natural fisheries and ecosystems is not part of a sustainable future.
Oregon and Pennsylvania require that hydro power be certified as Low Impact Hydro by the in-
dependent Low Impact Hydro Institute. New York and New Jersey also require low-impact hydro
but they rely on state agencies to make that determination. Nine states in the Top 15, including
Massachusetts, simply exclude all large-scale hydro (30 MW or more) from their RPS mix.
caRbon ReDUctIon coMMItMent
Accounting for and managing carbon emissions are two of the most impactful ways for a govern-
ment to support clean-energy economic development. In the absence of a federal standard for carbon
accounting and reduction requirements, individual states are mandating overall GHG reductions
within their territories. Massachusetts' Global Warming Solutions Act, which mandates that the state
set a 10-25 percent GHG reduction from 1990 levels by 2020, is a great example. In February 2009,
the state announced that existing strategies, policies, and laws will achieve 18.6 percent reductions
from 1990 levels by 2020. State policymakers are currently going through a stakeholder process to
establish final limit targets later this year, that are expected to be between 18.6 and 25 percent.
Because GHG emissions don’t stop at political/jurisdictional borders, many states have formed re-
gional coalitions to standardize the management of carbon. The three predominant regional efforts
to manage carbon are the Western Climate Initiative (WCI), RGGI, and the Midwestern Greenhouse
Gas Reduction Accord. While these three efforts are similar, there is one key and distinct difference
that makes RGGI the superior initiative: the direct monetization of carbon. And Massachusetts’ GHG
reductions have resulted in proceeds of $79 million in allowance auctions by the end of 2009, which
the state has used to fund investments in energy efficiency.
Regulating GHGs by establishing caps or “allowances” on the carbon emissions of the private sector
with a corresponding value for the privilege or “allowance” to emit carbon is possibly the most
effective strategy/scheme for catalyzing market-based innovation for a low-carbon and clean-
energy economy. As allowances are reduced over time and the penalties or taxes for emissions that
exceed the allowances are enforced, low-carbon business solutions will become more valuable in
the marketplace.
CA MA OR CO NJ CT NY MD WA MN AZ IL FL PA TX
caRbon ReDUctIon coMMItMent
Climate Action Plan • • • • • • • • • • • • • •GHG Reduction Target Using 1990 Levels or Better by 2020 or Earlier • • • • • • • •GHG Reduction Targets Mandated by Law • • • • • • • • • • • • •Membership in Regional Climate Initiative • • • • • • • • • •

© 2010 Clean Edge, Inc. (www.cleanedge.com).A Clean Edge report for the Massachusetts Clean Enery Center 27
Massachusetts could continue to show leadership in carbon reduction strategies by legislating a
more aggressive individual GHG reduction target and by pushing for a national carbon accounting
and management standard modeled after the successful components of RGGI.
bUIlDInG coDes
It is commonly referenced that the operation of commercial buildings account for 40 percent of
carbon emissions in the U.S. Or as noted green architect Ed Masria likes to say: “It’s the architecture,
stupid.” In order to reduce emissions from buildings, they need to consume less energy. Establishing
building codes for new and existing structures that result in more efficient buildings can be a huge
driver for clean-energy technologies and solutions while contributing to GHG reduction goals.
California has instituted a program called CalGreen, the most stringent building code standards of
any state in the nation. It requires builders to install plumbing that cuts indoor water use, divert
50 percent of construction waste from landfills to recycling, use low-pollutant paints, carpets and
floorings, and in nonresidential buildings, install separate water meters for different uses. It man-
dates the inspection of energy systems by local officials to ensure that heaters, air conditioners, and
other mechanical equipment in non-residential buildings are working efficiently. And it will allow
local jurisdictions, such as San Francisco, to retain their stricter existing green building standards,
or adopt more stringent versions of the state code if they choose.
Massachusetts, along with California, Illinois, Pennsylvania, and Maryland, are the only states in the
Top 15 to have building code legislation in place which meets or exceeds 2009 IECC standards for
residential buildings and 2007 ASHRAE standards for commercial buildings.
All but five of the Top 15 states mandate that new construction and/or renovation of state-owned
buildings must be built to some level of Leadership in Energy and Environmental Design (LEED),
depending on the scope and size.
Energy rating systems have been around for a while, and are available in most states, but only a
few states have mandated statewide home energy rating system programs. Florida has had a system
in place for a while as part of its energy efficiency building code, but California has the most
successful comprehensive example, the California Home Energy Rating System. It is overseen by the
California Energy Commission and establishes a systematic process for the delivery of whole-house
home-energy ratings. These provide California homeowners and home buyers with information
about the energy efficiency of the homes they live in or homes they are considering for purchase.
CA MA OR CO NJ CT NY MD WA MN AZ IL FL PA TX
bUIlDInG coDes
Current Building Energy Codes Meet or Exceed Latest IECC and ASHRAE Standards
• • • • •
LEED Green Building Requirements for State-Owned Buildings • • • • • • • • • •Mandated Energy Performance Scoring Statewide for Residential or Commercial Buildings
•
Mandated Energy Efficiency Improvements for State-Owned Buildings • • • • • • • • • • • • •

© 2010 Clean Edge, Inc. (www.cleanedge.com).A Clean Edge report for the Massachusetts Clean Enery Center28
The ratings also provide evaluation of the cost-effectiveness of options to achieve greater energy
efficiency in those homes.
Washington has also passed legislation for a comparable mandated energy rating system and Oregon
is considering similar legislation.
A more innovative and market-based solution for driving demand for energy efficient buildings is
the concept requiring an energy performance score for buildings at the time of sale. There are a
number of organizations across the U.S. like the Earth Advantage Institute that are pioneering the
development and implementation of energy performance scoring for buildings. By scoring buildings
on their energy performance, appraisers and purchasers can incorporate the score into the overall
value/price of a building. Conservation Services Group in Westborough, Mass. is the licensee and
contact for the Earth Advantage Homes program in the six New England states and New Jersey.
UtIlItY ReGUlatIons
Regulation of the utility industry is handled at the state level and is a highly fragmented and
complicated landscape on a state-by-state comparison basis. While utility industry regulation is a
very critical topic for states to address in advancing their clean-energy goals, it is also a topic that
requires a great deal of detailed analysis and discussion.
However, there are a few key elements of utility regulation to point out. The first is the standardiza-
tion of contracts required for renewable energy production. There are three key contracts needed
for most renewable energy projects to move forward: net-metering agreements, interconnection
agreements, and power purchase agreements. By standardizing these legal contracts, a state can sig-
nificantly reduce project risk barriers associated with the legal process and high fees often required
to negotiate unique arrangements with each utility. If a utility company feels threatened by or is
opposed to a renewable energy resource of a third party investor/generator, and it is not properly
mandated by law to allow for equitable access to the transmission grid, a utility can easily bog down
a project and kill it with legal fees.
Most states do net metering and interconnection well. Only three of the Top 15 states – Washington,
Minnesota, and Texas – according to an assessment by The Network for New Energy Choices,
receive low grades for both net metering and interconnection. Interconnection appears to be more
CA MA OR CO NJ CT NY MD WA MN AZ IL FL PA TX
UtIlItY ReGUlatIons
Decoupling • • • • • • • • • • •Public Benefit Fund • • • • • • • • • •Cost Recovery Other Than Public Benefit Fund • • • • • • • • • • • • • • •Smart Meters Penetration Greater Than 5% of State’s Electric Meters • • •Standardized Power Purchase Agreement • • • • • • • • • • •Strong Interconnection Law/Policy • • • • • • • • •Strong Net-Metering Law/Policy • • • • • • • • • • •
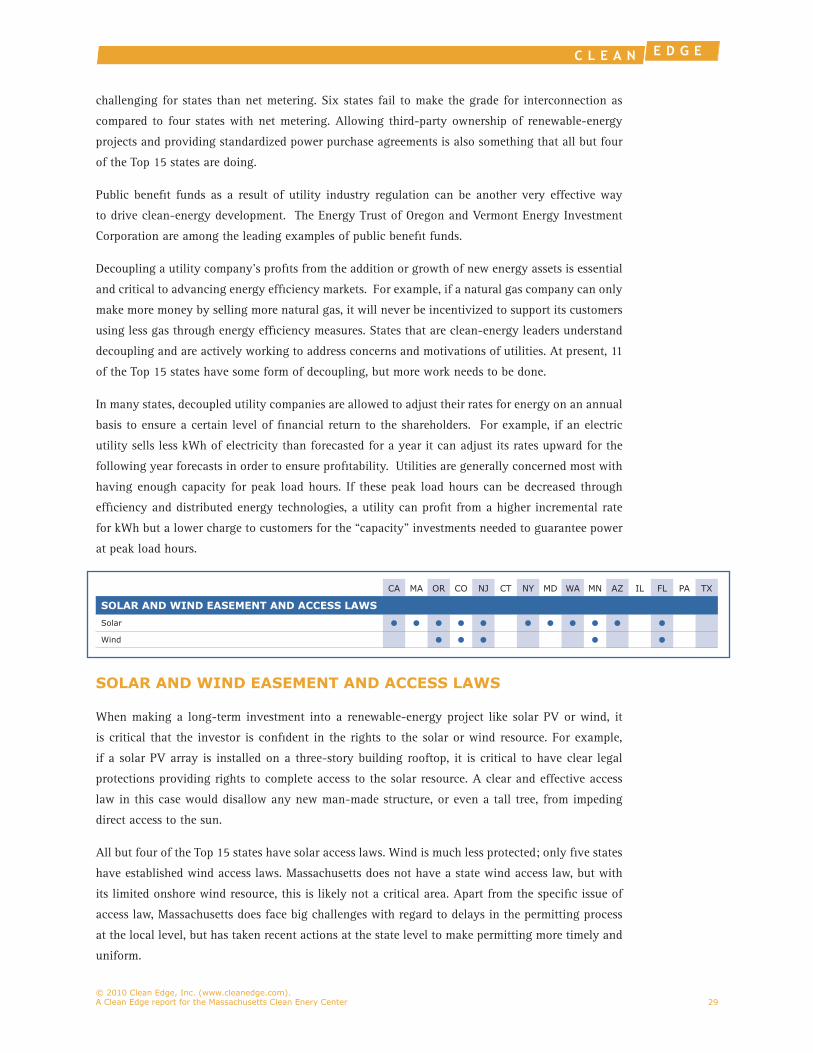
© 2010 Clean Edge, Inc. (www.cleanedge.com).A Clean Edge report for the Massachusetts Clean Enery Center 29
challenging for states than net metering. Six states fail to make the grade for interconnection as
compared to four states with net metering. Allowing third-party ownership of renewable-energy
projects and providing standardized power purchase agreements is also something that all but four
of the Top 15 states are doing.
Public benefit funds as a result of utility industry regulation can be another very effective way
to drive clean-energy development. The Energy Trust of Oregon and Vermont Energy Investment
Corporation are among the leading examples of public benefit funds.
Decoupling a utility company’s profits from the addition or growth of new energy assets is essential
and critical to advancing energy efficiency markets. For example, if a natural gas company can only
make more money by selling more natural gas, it will never be incentivized to support its customers
using less gas through energy efficiency measures. States that are clean-energy leaders understand
decoupling and are actively working to address concerns and motivations of utilities. At present, 11
of the Top 15 states have some form of decoupling, but more work needs to be done.
In many states, decoupled utility companies are allowed to adjust their rates for energy on an annual
basis to ensure a certain level of financial return to the shareholders. For example, if an electric
utility sells less kWh of electricity than forecasted for a year it can adjust its rates upward for the
following year forecasts in order to ensure profitability. Utilities are generally concerned most with
having enough capacity for peak load hours. If these peak load hours can be decreased through
efficiency and distributed energy technologies, a utility can profit from a higher incremental rate
for kWh but a lower charge to customers for the “capacity” investments needed to guarantee power
at peak load hours.
solaR anD WInD easeMent anD access laWs
When making a long-term investment into a renewable-energy project like solar PV or wind, it
is critical that the investor is confident in the rights to the solar or wind resource. For example,
if a solar PV array is installed on a three-story building rooftop, it is critical to have clear legal
protections providing rights to complete access to the solar resource. A clear and effective access
law in this case would disallow any new man-made structure, or even a tall tree, from impeding
direct access to the sun.
All but four of the Top 15 states have solar access laws. Wind is much less protected; only five states
have established wind access laws. Massachusetts does not have a state wind access law, but with
its limited onshore wind resource, this is likely not a critical area. Apart from the specific issue of
access law, Massachusetts does face big challenges with regard to delays in the permitting process
at the local level, but has taken recent actions at the state level to make permitting more timely and
uniform.
CA MA OR CO NJ CT NY MD WA MN AZ IL FL PA TX
solaR anD WInD easeMent anD access laWs
Solar • • • • • • • • • • •Wind • • • • •
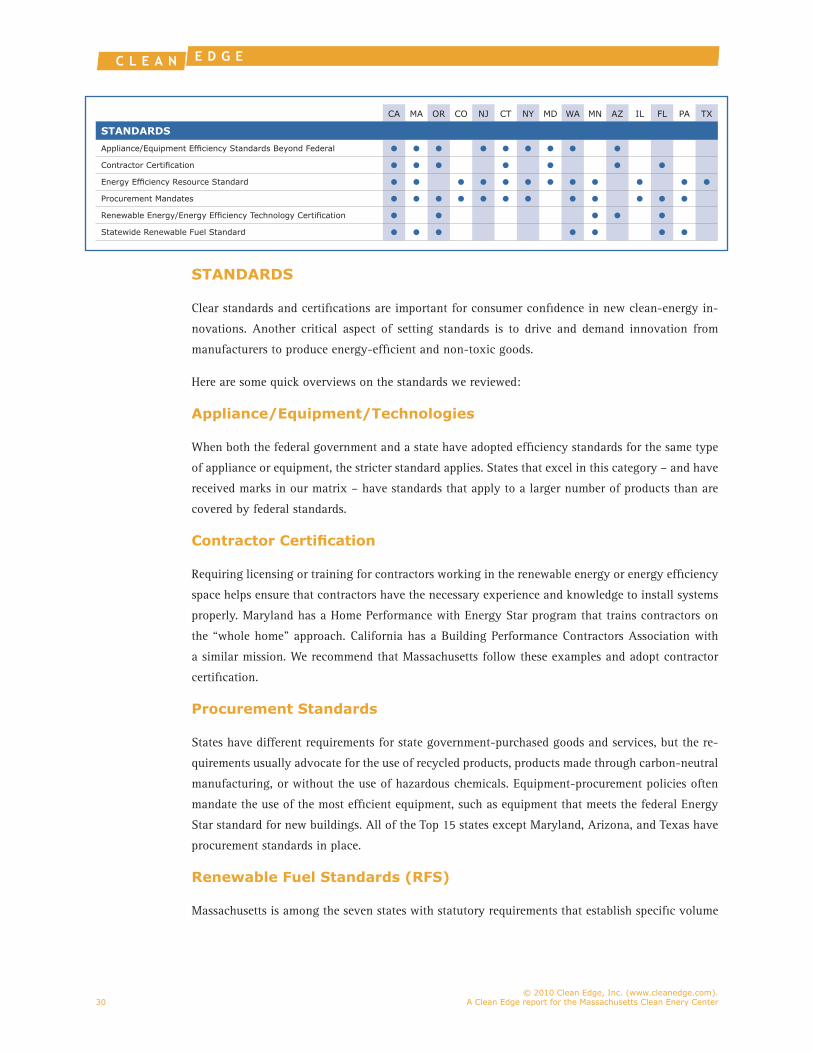
© 2010 Clean Edge, Inc. (www.cleanedge.com).A Clean Edge report for the Massachusetts Clean Enery Center30
stanDaRDs
Clear standards and certifications are important for consumer confidence in new clean-energy in-
novations. Another critical aspect of setting standards is to drive and demand innovation from
manufacturers to produce energy-efficient and non-toxic goods.
Here are some quick overviews on the standards we reviewed:
appliance/equipment/technologies
When both the federal government and a state have adopted efficiency standards for the same type
of appliance or equipment, the stricter standard applies. States that excel in this category – and have
received marks in our matrix – have standards that apply to a larger number of products than are
covered by federal standards.
Contractor Certification
Requiring licensing or training for contractors working in the renewable energy or energy efficiency
space helps ensure that contractors have the necessary experience and knowledge to install systems
properly. Maryland has a Home Performance with Energy Star program that trains contractors on
the “whole home” approach. California has a Building Performance Contractors Association with
a similar mission. We recommend that Massachusetts follow these examples and adopt contractor
certification.
Procurement standards
States have different requirements for state government-purchased goods and services, but the re-
quirements usually advocate for the use of recycled products, products made through carbon-neutral
manufacturing, or without the use of hazardous chemicals. Equipment-procurement policies often
mandate the use of the most efficient equipment, such as equipment that meets the federal Energy
Star standard for new buildings. All of the Top 15 states except Maryland, Arizona, and Texas have
procurement standards in place.
Renewable fuel standards (Rfs)
Massachusetts is among the seven states with statutory requirements that establish specific volume
CA MA OR CO NJ CT NY MD WA MN AZ IL FL PA TX
stanDaRDs
Appliance/Equipment Efficiency Standards Beyond Federal • • • • • • • • •Contractor Certification • • • • • • •Energy Efficiency Resource Standard • • • • • • • • • • • •Procurement Mandates • • • • • • • • • • • •Renewable Energy/Energy Efficiency Technology Certification • • • • •Statewide Renewable Fuel Standard • • • • • • •

© 2010 Clean Edge, Inc. (www.cleanedge.com).A Clean Edge report for the Massachusetts Clean Enery Center 31
standards for cellulosic biofuel, biomass-based diesel, advanced biofuel, and total renewable fuel
that must be used in transportation each year. Massachusetts’ Clean Energy Biofuels Act also man-
dates a minimum biofuel content for home heating oil, the first such provision in the U.S. In some
states, requirements also include criteria for both renewable fuels and the feedstocks used to produce
them, including new GHG thresholds for renewable fuels. Oregon, for example, mandates biodiesel
and ethanol in Oregon’s motor fuels and requires the Oregon Department of Agriculture to study and
monitor ethanol fuel production, use, and sales in Oregon and to implement the RFS. California’s
low carbon fuel standard requires fuel providers to ensure that the mix of fuel they sell into the
California market meets certain standards for GHG emissions. The standard becomes increasingly
stringent over time.
Energy Efficiency Resource Standard (EERS)
This is a simple, market-based mechanism to encourage more efficient generation, transmission, and
use of electricity and natural gas. An EERS consists of electric and/or gas energy savings targets for
utilities, often with flexibility to achieve the target through a market-based trading system. All EERSs
include end-user energy-saving improvements that are aided and documented by utilities or other
program operators. Sometimes distribution system efficiency improvements and combined heat and
power (CHP) systems and other high-efficiency distributed generation systems are included as well.
EERSs are typically implemented at the state level and are either included as part of a state’s RPS or
as standalone legislation. Massachusetts implemented an EERS as part of its Green Communities Act
signed in 2008, serving as one more example of its leadership in energy efficiency.

© 2010 Clean Edge, Inc. (www.cleanedge.com).A Clean Edge report for the Massachusetts Clean Enery Center32
loan/casH IncentIVes
The limitations of available commercial credit resulting from the financial meltdown that started in
the fall of 2008 present extraordinary challenges to financing clean-energy projects. While many
public incentives are helpful to augment private financing of projects, two of the most effective are
cash incentives and subsidized loans offered directly to project owners or developers. Tax credits,
for example, have recently become very difficult to leverage as many potential tax credit investors
have experienced severe losses of income – hence the loss of tax liability – making tax credits and
deductions unattractive to many. We discuss this in detail in the Commercial Tax Incentives section
on page 36.
feed-In tariffs (fIts)
FITs are cash payments, made by public agencies or utilities, directly to renewable energy project
owners for the delivery of electricity. This mechanism of cash incentives – over and above the
market-rate revenue from the amount of electricity sold – is more familiar to bankers and investors
than tax credits or incentives that require additional fees and complex counsel from lawyers and
tax accountants.
FITs have been used, to varying degrees of success, in the European Union and elsewhere. Legisla-
tion for FIT programs is now also on the rise in the United States. Numerous legislatures, governors,
and state-energy offices have begun to evaluate FIT successes and shortcomings, and are attempting
to deploy successful programs in their own states.
Currently, there are only three legislated, statewide FIT programs out of the Top 15 states included in
this report, in California, Oregon, and Washington. California’s FIT program payments are based on
a utility’s avoided cost and not on the actual cost of clean-energy projects. It applies to small-scale
clean-energy systems and investor- and publicly-owned utilities with at least 75,000 customers.
California has a cap on both project and program size, currently limiting the ability of the FIT to
drive large-scale clean-energy deployment in the state. Washington passed voluntary FIT legislation
in February 2009. The state’s HB 1086 calls for a full system of FITs for all renewable energy
technologies, and includes differentiated tariffs for both solar and wind energy. Oregon recently
fInancIal IncentIVes anD DRIVeRs
CA MA OR CO NJ CT NY MD WA MN AZ IL FL PA TX
loan/casH IncentIVes
Direct Loan Programs • • • • • • • • • • • •Grant Programs • • • • • • • • • • • • • •Loan Guarantees • • • • • • • • • • • •PACE Financing Program and/or Legislation • • • • • • • • • • •On-Bill Repayment Mandate • • • • • • •Renewable Energy Certificate Incentives • • • • • • • • • • • • •Statewide Feed-In Tariff Program or Legislation • • •

© 2010 Clean Edge, Inc. (www.cleanedge.com).A Clean Edge report for the Massachusetts Clean Enery Center 33
implemented a pilot FIT for solar PV. The initial program is very limited (25 MW) and rates have
not yet been set.
In considering a FIT, one of the most important components to take into account is the rate paid
to the developers of the renewable energy systems. Some programs base FIT payments on the cost
to develop the renewable energy generation project plus a stipulated return set by policy makers,
regulators, or program administrators. Others base FIT payments on a utility's avoided cost or on
arbitrarily set fixed-price incentives.
Spain and Germany are the most oft-cited examples of FIT programs. Germany’s FIT, one of the
most successful programs, has been primarily responsible for enabling the country, despite a limited
solar resource in its northern European climate, to lead the world in solar deployment with more
than 8,000 MW in cumulative installations. Germany has also captured a significant share of global
PV manufacturing. In Germany, utilities are required to purchase the electricity from new solar
installations at a rate significantly higher than the market rate, about 30 to 40 euro cents per kWh,
but the tariff declines over time. Germany is currently preparing to ratchet back the program, and
what it pays out for solar-generated electricity, but there are many positive lessons to glean from
the German FIT program.
Spain’s experience, however, was less positive. The country had to redesign its program after its ini-
tial FIT was set at an extremely high price per kWh, creating a boom that included inefficient solar
plant construction and speculation in solar building permits. Spain initially guaranteed high-tariff
rates, without a plan to decrease these rates, and without a cap on the amount of solar electricity that
could be plugged into the system. The government recently corrected the problem by introducing
a variable premium-price FIT design with both a price cap and a price floor. It ensures that the FIT
premium payment increases or declines as electricity prices fluctuate. In addition, there is now a
hard cap (500 MW), and Spain has introduced a computer tracking system to monitor both the speed
and timing of solar installations and connections to the grid.
Closer to home, many observers are watching Ontario’s newly-implemented FIT (with varying rates
of approximately 40 to 80 Canadian cents per kWh, depending on system size and application type).
Some observers wonder if an outcome similar to Spain’s may be in the offing.
The most notable FIT example in the U.S. is not a statewide FIT, but the solar PV program passed
by the municipal utility in Gainesville, Florida, in February 2009. (This is not included in the matrix
for Florida because it is not a state program.) It is considered the only U.S. FIT policy structured in
much the same way as many successful European FIT policies: it is based on the cost to develop the
renewable generation project plus a stipulated five to six percent return over a 20-year period. The
program has only been in place for a year so outcomes will need to be monitored.
We believe that carefully structured FITs can be a major driver for renewable-energy project
development, and for clean-tech manufacturing as well, depending on how they are structured.
Massachusetts can be an early adopter and leader in this type of program should it determine that a
FIT policy is politically and financially feasible. That can be a tall order in a time of tight budgets,
but it deserves strong consideration.

© 2010 Clean Edge, Inc. (www.cleanedge.com).A Clean Edge report for the Massachusetts Clean Enery Center34
Renewable Energy Certificates
RECs are another mechanism or incentive instrument that can provide direct cash subsidy and
support for a renewable-energy project. The buyers of RECs can include utilities, who use them to
help meet their RPS mandates. There are also voluntary investors in RECs who wish to support the
development of community-scale renewable projects. The Energy Trust of Oregon, for example,
delivers its direct financial incentives for renewable projects in the form of REC purchases. It calcu-
lates the “above-market cost” of the project and that serves as the value of retiring the RECs from
the project.
Of the Top 15 states with RPS mandates, New York is the only one that does not allow utilities to use
RECs to count towards its RPS requirements. The rest of the states with RPSs allow the use of RECs,
and some states even provide REC incentives as a tool to incentivize utilities to achieve RPS targets.
Oregon is the only state that caps the amount of unbundled RECs that utilities can use (at 20 percent)
to meet RPS obligations. Arizona, Colorado, and Washington offer REC multipliers. Multipliers are
targeted to specific renewable energy technologies and reward utilities and investors for supporting
these technologies by multiplying the value of a single REC by as much as three times.
New Jersey is an excellent example of how RECs can be used to stimulate investment into particular
technologies. New Jersey’s SREC program provides a single SREC in the customer’s account each
time their system generates one MWh of electricity. SRECs can then be sold on the SREC tracking
system, providing revenue for the first 15 years of the system's life. In January 2010, New Jersey
SREC prices on average were $533 per MWh – incredibly high when contrasted with the range in
values of a traditional REC ($5-$90 per MWh).
Massachusetts has a specific set of renewable energy technologies within its Class I resources list for
its RPS. In addition, Massachusetts has a solar carve-out requiring that a portion of its renewable
energy be provided from in-state, interconnected solar facilities, and that a certain percentage of
renewable energy be generated from existing resources. The state also has an aggressive SREC
program with the price ceiling, known as the solar alternative compliance payment, set at $600
per MWh for 2010. Almost every Top 15 state with an RPS carve-out has a complimentary REC
multiplier or REC incentive program to help boost compliance by utilities and direct investment into
this technology.
PACE & On-Bill Repayment Programs
The property-assessed clean-energy (PACE) financing program was primarily advanced in 2009 by
an initiative in Berkeley, California, called BerkeleyFIRST. PACE allows home and business owners
to avoid the steep up-front cost of solar PV or energy-efficiency improvements by paying over
time via their property tax bills. It has attracted extraordinary interest as a way for local and state
governments to deploy their energy efficiency and conservation block grant (EECBG) funding al-
locations established by the American Recovery and Reinvestment Act of 2009. PACE was featured
as a “Breakthrough Idea for 2010” in the January/February 2010 issue of Harvard Business Review.
Although administered by cities or counties, PACE programs require enabling legislation at the state
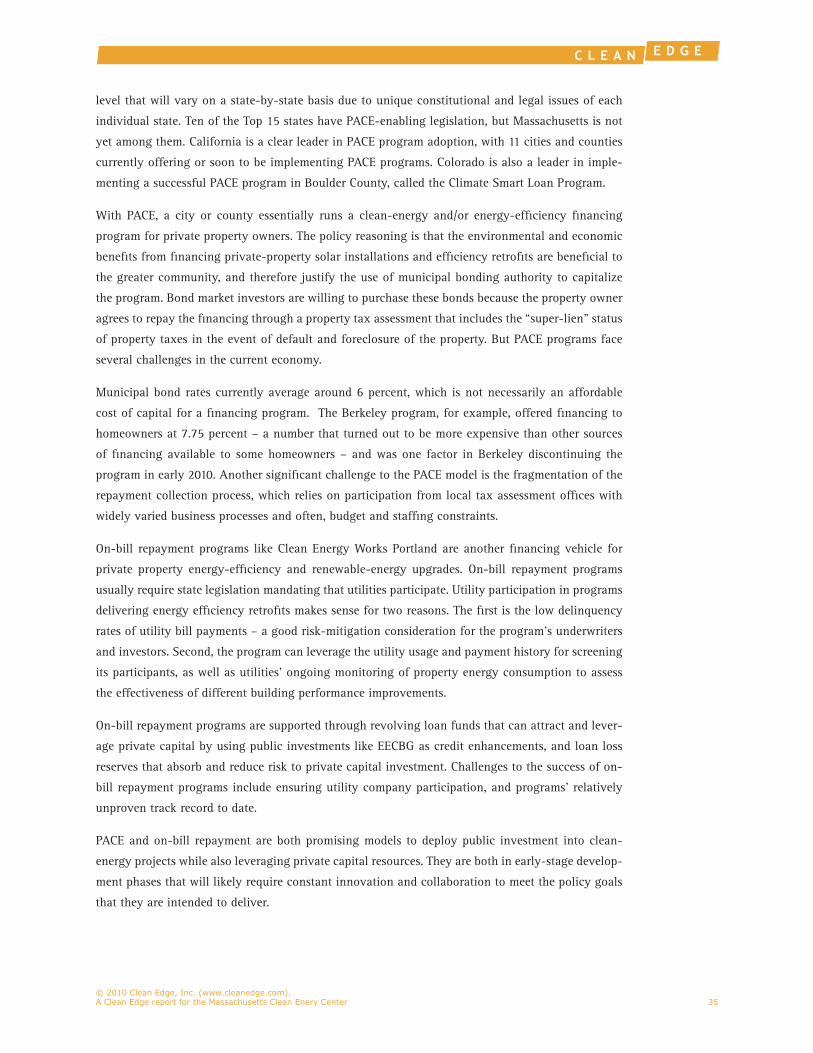
© 2010 Clean Edge, Inc. (www.cleanedge.com).A Clean Edge report for the Massachusetts Clean Enery Center 35
level that will vary on a state-by-state basis due to unique constitutional and legal issues of each
individual state. Ten of the Top 15 states have PACE-enabling legislation, but Massachusetts is not
yet among them. California is a clear leader in PACE program adoption, with 11 cities and counties
currently offering or soon to be implementing PACE programs. Colorado is also a leader in imple-
menting a successful PACE program in Boulder County, called the Climate Smart Loan Program.
With PACE, a city or county essentially runs a clean-energy and/or energy-efficiency financing
program for private property owners. The policy reasoning is that the environmental and economic
benefits from financing private-property solar installations and efficiency retrofits are beneficial to
the greater community, and therefore justify the use of municipal bonding authority to capitalize
the program. Bond market investors are willing to purchase these bonds because the property owner
agrees to repay the financing through a property tax assessment that includes the “super-lien” status
of property taxes in the event of default and foreclosure of the property. But PACE programs face
several challenges in the current economy.
Municipal bond rates currently average around 6 percent, which is not necessarily an affordable
cost of capital for a financing program. The Berkeley program, for example, offered financing to
homeowners at 7.75 percent – a number that turned out to be more expensive than other sources
of financing available to some homeowners – and was one factor in Berkeley discontinuing the
program in early 2010. Another significant challenge to the PACE model is the fragmentation of the
repayment collection process, which relies on participation from local tax assessment offices with
widely varied business processes and often, budget and staffing constraints.
On-bill repayment programs like Clean Energy Works Portland are another financing vehicle for
private property energy-efficiency and renewable-energy upgrades. On-bill repayment programs
usually require state legislation mandating that utilities participate. Utility participation in programs
delivering energy efficiency retrofits makes sense for two reasons. The first is the low delinquency
rates of utility bill payments – a good risk-mitigation consideration for the program’s underwriters
and investors. Second, the program can leverage the utility usage and payment history for screening
its participants, as well as utilities’ ongoing monitoring of property energy consumption to assess
the effectiveness of different building performance improvements.
On-bill repayment programs are supported through revolving loan funds that can attract and lever-
age private capital by using public investments like EECBG as credit enhancements, and loan loss
reserves that absorb and reduce risk to private capital investment. Challenges to the success of on-
bill repayment programs include ensuring utility company participation, and programs’ relatively
unproven track record to date.
PACE and on-bill repayment are both promising models to deploy public investment into clean-
energy projects while also leveraging private capital resources. They are both in early-stage develop-
ment phases that will likely require constant innovation and collaboration to meet the policy goals
that they are intended to deliver.
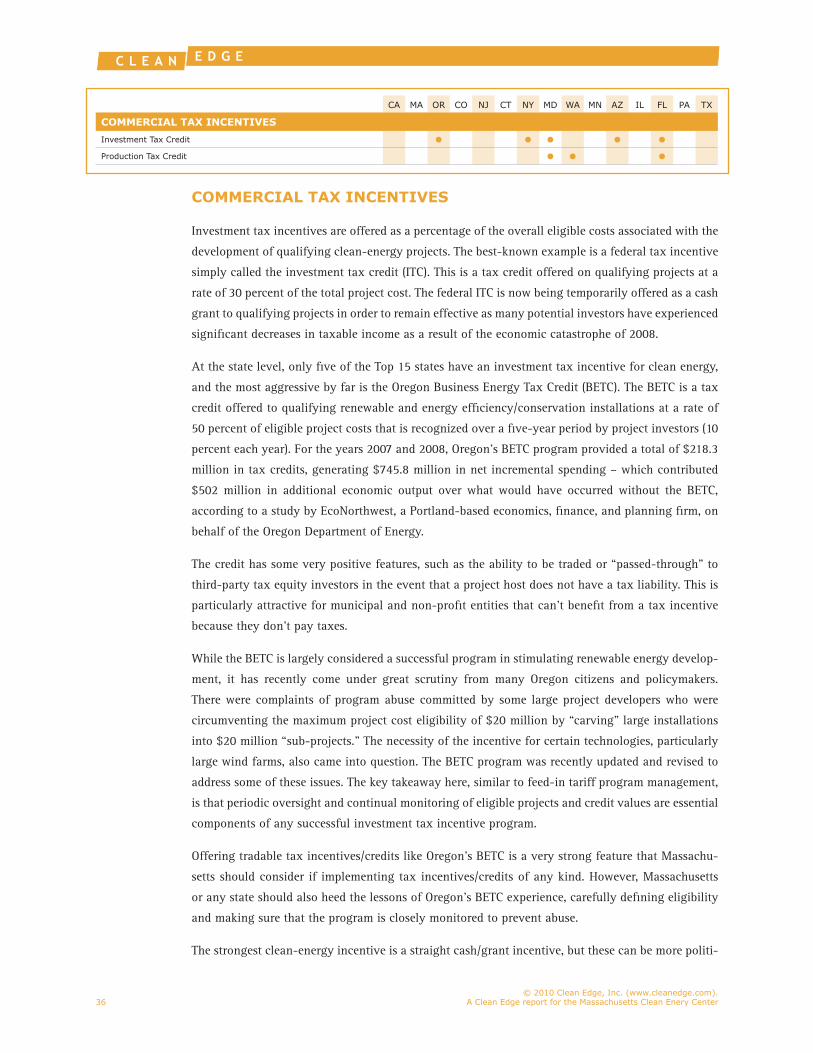
© 2010 Clean Edge, Inc. (www.cleanedge.com).A Clean Edge report for the Massachusetts Clean Enery Center36
coMMeRcIal taX IncentIVes
Investment tax incentives are offered as a percentage of the overall eligible costs associated with the
development of qualifying clean-energy projects. The best-known example is a federal tax incentive
simply called the investment tax credit (ITC). This is a tax credit offered on qualifying projects at a
rate of 30 percent of the total project cost. The federal ITC is now being temporarily offered as a cash
grant to qualifying projects in order to remain effective as many potential investors have experienced
significant decreases in taxable income as a result of the economic catastrophe of 2008.
At the state level, only five of the Top 15 states have an investment tax incentive for clean energy,
and the most aggressive by far is the Oregon Business Energy Tax Credit (BETC). The BETC is a tax
credit offered to qualifying renewable and energy efficiency/conservation installations at a rate of
50 percent of eligible project costs that is recognized over a five-year period by project investors (10
percent each year). For the years 2007 and 2008, Oregon’s BETC program provided a total of $218.3
million in tax credits, generating $745.8 million in net incremental spending – which contributed
$502 million in additional economic output over what would have occurred without the BETC,
according to a study by EcoNorthwest, a Portland-based economics, finance, and planning firm, on
behalf of the Oregon Department of Energy.
The credit has some very positive features, such as the ability to be traded or “passed-through” to
third-party tax equity investors in the event that a project host does not have a tax liability. This is
particularly attractive for municipal and non-profit entities that can’t benefit from a tax incentive
because they don’t pay taxes.
While the BETC is largely considered a successful program in stimulating renewable energy develop-
ment, it has recently come under great scrutiny from many Oregon citizens and policymakers.
There were complaints of program abuse committed by some large project developers who were
circumventing the maximum project cost eligibility of $20 million by “carving” large installations
into $20 million “sub-projects.” The necessity of the incentive for certain technologies, particularly
large wind farms, also came into question. The BETC program was recently updated and revised to
address some of these issues. The key takeaway here, similar to feed-in tariff program management,
is that periodic oversight and continual monitoring of eligible projects and credit values are essential
components of any successful investment tax incentive program.
Offering tradable tax incentives/credits like Oregon’s BETC is a very strong feature that Massachu-
setts should consider if implementing tax incentives/credits of any kind. However, Massachusetts
or any state should also heed the lessons of Oregon’s BETC experience, carefully defining eligibility
and making sure that the program is closely monitored to prevent abuse.
The strongest clean-energy incentive is a straight cash/grant incentive, but these can be more politi-
CA MA OR CO NJ CT NY MD WA MN AZ IL FL PA TX
coMMeRcIal taX IncentIVes
Investment Tax Credit • • • • •Production Tax Credit • • •

© 2010 Clean Edge, Inc. (www.cleanedge.com).A Clean Edge report for the Massachusetts Clean Enery Center 37
cally difficult to implement due to their effect on the general fund and budget of the state. Still,
they have the potential to be significantly more effective in the current economic slowdown than
tax-driven incentive programs.
InVestMent actIVItY
Of the Top 15 states, only five – Massachusetts being one – have established state clean-energy
funds. These investment vehicles are often executed in partnership with a private financial firm or as
an extension of an existing public benefit energy fund. By providing equity to projects, companies,
and other clean-energy related activities, these funds aim to accelerate development and deployment
of clean energy in the state.
state number of Deals (2007-09)Amount Invested, in $ Millions
(2007-09)
California 286 $7,084
Massachusetts 63 $1,116
Oregon 11 $546
Colorado 34 $695
New Jersey 8 $186
Connecticut 9 $641
New York 25 $856
Maryland 10 $469
Washington 26 $230
Minnesota 6 $48
Arizona 12 $125
Illinois 10 $402
Florida 8 $15
Pennsylvania 11 $178
Texas 36 $346
VentURe caPItal anD otHeR PRIVate InVestMent actIVItY bY state
This data is based on state-level private investment deals tracked by Bloomberg New Energy Finance from January 1, 2007 to December 31, 2009. Investment deals include venture capital financing rounds, private equity expansion capital, and private equity buyouts. The above table reports on the total number of deals and total amount of invested capital by state.
CA MA OR CO NJ CT NY MD WA MN AZ IL FL PA TX
InVestMent actIVItY
State Equity Fund • • • • •Venture Capital and Other Private Investment ($400M+, 2007-09) • • • • • • • •Venture Capital and Other Private Investment (30+ Deals, 2007-09) • • • •

© 2010 Clean Edge, Inc. (www.cleanedge.com).A Clean Edge report for the Massachusetts Clean Enery Center38
The Clean Energy States Alliance (CESA), established in 2002, is a nonprofit group that helps its
members best utilize public clean-energy funding. CESA is comprised of 18 state clean-energy funds
and agencies – including MassCEC’s Renewable Energy Trust. Massachusetts' membership in CESA
showcases its leading efforts in state clean-energy investment, but the state also excels in the arena
of private investment.
Data provider Bloomberg New Energy Finance (BNEF) has tracked global investment deals in the
clean-energy sector for nearly a decade. According to BNEF’s database, Massachusetts trails only
California in terms of venture capital and private investment – both in terms of total investment
and number of deals. Deal types tracked include venture capital financing rounds, private equity
expansion capital, and private equity buyouts.
From January 2007 through December 2009, eight of the Top 15 states attracted at least $400 mil-
lion in venture capital and private investments to companies headquartered in their state. California
was head and shoulders above the rest with investments exceeding $7 billion. Massachusetts, the
only other state breaking the $1 billion threshold over the last three years, has the second-largest
total with more than $1.1 billion.
Judging by the number of investment deals completed – an important measure of investment activity
given the variations in businesses’ capital intensiveness – California stands far ahead of other states
with 286 California-based company investment deals completed in the last three years, according
to the BNEF database. Massachusetts’ 63-deal total earned it another second-place ranking behind
California. Texas, with a distant third-place finish, saw 36 investment deals from 2007 through
2009.
UtIlItY IncentIVes
Given the growing popularity of other financing mechanisms available for renewable energy projects
(RECs, FITs, tax credits, etc.) it is not surprising that most utilities focus their incentives on energy
efficiency. Of the Top 15 states, only California and Oregon have more than 20 percent of their
utilities offering renewable-energy rebates, and only Oregon, Washington, Colorado, and Florida
have more than five percent offering clean-energy loans.
States that place a priority on energy efficiency will want to consider not just the incentives that
utilities offer customers, but the performance incentives that states offer to utilities for demand-
side management and other conservation and efficiency activities. In many cases, performance
CA MA OR CO NJ CT NY MD WA MN AZ IL FL PA TX
UtIlItY IncentIVes
Renewable Energy and/or Energy Efficiency Loans Offered by More Than 5% of Utilities
• • • • • • •
Renewable Energy and/or Energy Efficiency Rebates Offered by More Than 20% of Utilities
• • • • • • • • •
State Performance Incentives for Utilities • • • • • • • • • •
© 2010 Clean Edge, Inc. (www.cleanedge.com).A Clean Edge report for the Massachusetts Clean Enery Center 39
incentives are a key means of addressing utility management’s concerns about lost sales revenue
from conservation and efficiency, as they provide positive financial impact. States that are aggres-
sively pursuing energy-efficiency incentives also tend to have enacted regulatory policies such as
decoupling. Massachusetts is a clear leader here, making energy conservation part of its portfolio
standards package and provides support to utilities to help reach this goal.
ResIDentIal anD InDIVIDUal taX IncentIVes
Tax incentives can be offered to homeowners for renewable-energy installations, appliance purchas-
es, and energy-efficiency upgrades. They can take the form of income tax incentives, property tax
exemptions, or sales tax breaks. This area of policy and financial support for clean energy is highly
fragmented and contingent on each individual state’s tax structure. As a tool, these instruments can
be effective, but are also subject to consumer confusion associated with the general challenges of
completing tax forms. Residential tax incentives should be considered a supplementary, not primary,
way to advance clean-energy economic development policy.
CA MA OR CO NJ CT NY MD WA MN AZ IL FL PA TX
ResIDentIal anD InDIVIDUal taX IncentIVes
Income Tax Exemption or Reduction • • • • •Property Tax Exemption or Reduction • • • • • • • • • • • •Sales Tax Exemption or Reduction • • • • • • • • • •

© 2010 Clean Edge, Inc. (www.cleanedge.com).A Clean Edge report for the Massachusetts Clean Enery Center40
KnoWleDGe caPItal
Academic institutions are a core asset to a state’s economic development initiatives in the clean-
energy sector in at least four different ways:
n Research and development of clean-energy technologies
n Clean-energy degrees, diplomas, certificates, and programs
n Adoption of institutional policies and commitments around clean energy
n Assisting in the commercialization of clean-energy technologies through incubators and/
or sharing of business, management, and entrepreneurial expertise
Robust academic research and development programs in a state offer several attractive propositions
for private-sector clean-energy companies. Universities’ pure innovation and knowledge capital can
be capitalized and leveraged into business opportunities, justifying financial investment around
R&D clusters. And the campuses of universities and research institutions yield highly trained human
resources. States with a large concentration of academic institutions offering degrees, diplomas,
certificates, and programs in clean energy are naturally attractive to private businesses.
Nowhere is this more apparent than in Massachusetts. As we discussed in the Assets and Strengths
section on pages 13-16, universities and other academic resources are arguably the state’s No.
1 clean-energy asset, cited as a strength by virtually every expert that we interviewed. MIT and
Harvard, with their world-class research and reputations, clearly lead the pack, but there are centers
of clean-energy technical and business excellence across the Bay State at UMass-Lowell, Worcester
Polytechnic Institute, UMass-Boston, Western New England College, UMass-Amherst, Babson, Boston
University, and many other institutions. Not surprisingly, Massachusetts (along with only California
and Oregon among the Top 15 states) earned marks in all four Knowledge Capital categories that
we surveyed for this report. Successful clean-energy companies that have spun out from research
advances at MIT and other universities, such as A123 Systems and Konarka, have become key
mainstays of Massachusetts’ clean-energy economy.
As large energy users themselves, academic institutions can also be significant demand drivers and
market-opportunity creators for a state’s clean-energy companies. States with a higher concentra-
KnoWleDGe caPItal anD econoMIc/WoRKfoRceDeVeloPMent
CA MA OR CO NJ CT NY MD WA MN AZ IL FL PA TX
KnoWleDGe caPItal
At Least One Global Top-Ranked Green MBA Program • • • • • • • • • • • •Campus Climate Commitment Member (20% or More) • • • • • • • • • •Innovative Clean Energy Academic Programs (5% or More) • • • • •Top-Ranked Overall Green Universities (10% or More) • • • • • • • •

© 2010 Clean Edge, Inc. (www.cleanedge.com).A Clean Edge report for the Massachusetts Clean Enery Center 41
tion of institutions that have made carbon-reduction commitments – reducing energy consumption
and deploying clean-energy technologies – are a strong sign of a state’s clean-energy leadership. Of
the Top 15 states, only three – Florida, Pennsylvania, and Texas – failed to meet our benchmark of
at least 20 percent of the state’s higher-education institutions having joined the American College
and University Presidents’ Climate Commitment.
Another valuable academic asset for clean-energy businesses is the sharing of resources in manage-
ment, business, and entrepreneurial skills – through incubators, executive education programs, or
other vehicles. Major Danish wind company Vestas, for example, cited ties to MIT and other academic
research centers in choosing Massachusetts for its first U.S. research office east of the Mississippi
in 2009. But Texas won the plum Vestas prize – its main U.S. research center – in part because of a
(perceived) even stronger academic asset in the Lone Star Wind Alliance, a university-wind industry
consortium that includes leading universities in Texas and other western states. (Texas’s status as by
far the No. 1 market for wind energy in the U.S. clearly was another factor). Without question, MIT
holds its own as a strong business asset. Beyond its world-class engineering and R&D resources, MIT
and its Sloan School of Management deliver robust entrepreneurial training and policy expertise to
the business sector, and MIT president Susan Hockfield is one of academia’s leading voices on global
energy challenges.
The emergence of business schools’ Green MBA programs around the world also gives specific states
and regions strong skill sets to draw from when building or growing clean-energy companies. All
but three of the Top 15 states boast at least one Green MBA program listed in The Aspen Institute’s
Top 100 global rankings in 2009. Massachusetts is particularly strong with seven programs in the
Top 100: Babson, Brandeis, BU, Bentley, Boston College, UMass-Boston, and MIT. California also
hosts seven Top 100 Green MBA programs, while New York is home to five.
Massachusetts is clearly a leader in having strong academic institutions and is positioned to benefit
from this in developing a robust clean-energy economy. The state should continue to promote and
support the adoption of R&D initiatives and clean-energy degree programs from its universities. It
should also consider fostering more business-academic partnerships. This will help place students
directly after graduation while retaining businesses and lessening the transient student population
base. Providing additional incentives for academic institutions to adopt even more ambitious carbon
reduction strategies is an area where Massachusetts could place continuous emphasis in order to
help build demand for clean-energy technologies and services.

© 2010 Clean Edge, Inc. (www.cleanedge.com).A Clean Edge report for the Massachusetts Clean Enery Center42
econoMIc/WoRKfoRce DeVeloPMent
Beyond academic institutions, there are several other ways in which states can position themselves
to become leaders in clean-energy human capital, business activity, and job creation.
One obvious asset to any regional clean-energy effort is the presence of a DOE National Labora-
tory. The DOE maintains 21 National Laboratories and Technology Centers, conducting cutting-edge
energy research with more than 30,000 scientists and engineers. For our purposes, we included in
our research only DOE labs that had clear involvement in clean-energy technologies. Nine of the Top
15 states have at least one such lab, but Massachusetts is not among them.
The most prominent example of the value provided by presence of a DOE lab can be seen at
the National Renewable Energy Laboratory (NREL) in Golden, Colorado. NREL focuses entirely on
renewable energy and energy efficiency, providing expert R&D designed to advance technologies
from the lab to applied research, testing, scale-up, and demonstration. Ultimately, NREL’s Com-
mercialization & Technology Transfer Office supports efforts to bring these technologies to market,
creating new businesses and new jobs. Partly due to NREL’s proximity, the Denver metro area has
become a hotbed for budding clean-energy companies.
Other DOE labs at the forefront of clean-tech research and development include the Pacific North-
west National Laboratory in Richland, Washington, a leader in smart grid testing, and the Lawrence
Berkeley National Laboratory in Berkeley, California, the former home of U.S. Secretary of Energy
Dr. Steven Chu.
Although Massachusetts is not home to a DOE-funded laboratory, the state can still reap the benefits
of lab presence by focusing attention and resources on its many local university labs and technology
centers that nurture the work of scientists, engineers, and entrepreneurs. MIT, for example, is an
institutional partner of NREL’s new Joint Institute for Strategic Energy Analysis, established in
March 2010 to bring policy and technology expertise to help speed the transition to clean energy
around the world. We do urge, however, that Massachusetts pursue the establishment of a DOE lab
within the state, with a lab focused on energy-efficiency technologies being an obvious natural fit.
We discuss this in more detail in the Stategy and Recommendations section on page 44.
Apart from laboratory availability, technology development can be significantly aided by business
incubator programs. The Clean Energy Alliance was established by NREL and consists of incubators
across the nation that aim to provide tailored business and financial services to the clean-energy
community. Such incubators operate in six of the Top 15 states: California, Colorado, Florida, New
CA MA OR CO NJ CT NY MD WA MN AZ IL FL PA TX
econoMIc/WoRKfoRce DeVeloPMent
Clean-Energy Jobs as a Percentage of Total Jobs (0.5% or More of State Total)
• • • • • • • •
Clean-Energy Patents Registered (3% or More of U.S. Total, 2002-09) • • • • • • • •Presence of a Clean Energy Alliance Business Incubator • • • • •Presence of a Department of Energy National Lab • • • • • • • • •
© 2010 Clean Edge, Inc. (www.cleanedge.com).A Clean Edge report for the Massachusetts Clean Enery Center 43
Jersey, New York, and Texas. A leading example is the Austin Technology Incubator (ATI) in Texas.
Originally founded in 1989, ATI expanded into clean energy in 2002 and has helped grow 18
companies in solar, wind, LED lighting, and other clean technologies. Although Massachusetts lacks
a Clean Energy Alliance member, it does have some notable clean-energy incubator efforts, includ-
ing the Fraunhofer Center for Sustainable Energy Systems in Cambridge, the North Shore Cleantech
InnoVenture Center in Lynn, and the Clean Energy Fusion Center in Waltham. In Worcester, the
Institute for Energy and Sustainability is aiming to create a clean-energy incubator, partially funded
with a $150,000 grant from MassCEC.
Another key metric for leadership in clean-energy innovation and development is the number of
patent registrations recorded in each state. The Clean Energy Patent Growth Index, published quar-
terly by intellectual property law firm Heslin Rothenberg Farley & Mesiti P.C in Albany, New York,
tracks patent activity in the clean-energy sector from 2002 to the present.
Interestingly, Michigan – a state that did not make our Top 15 ranking – leads all other states with
24 percent of clean-energy patents in that time period, largely due to car manufacturers’ fuel-cell
and hybrid-electric vehicle activities. California was second with 15 percent, followed by New York
at 12 percent. Other states at or above a three percent share include Connecticut with seven percent,
Texas with five percent, Illinois with five percent, and Massachusetts, New Jersey, and Florida all
with three-percent shares of U.S.-owned clean-energy patents.
While patent registrations speak to innovation strength and can be used to help evaluate the success
of research and development investments, jobs are a more direct metric for measuring the impact
of a state’s clean-energy economic development and industry growth. To track this key metric, we
used the widely-cited Pew Charitable Trusts’ June 2009 report, The Clean Energy Economy, which
analyzed the emerging clean-energy industry in the U.S. and tracked clean-energy job growth,
business presence, and investment in the national “clean-energy economy” between 1998 and 2007.
Clean Edge also drew from this research in our October 2009 report, Clean-Tech Job Trends 2009.
One key point of analysis for the strength of a state’s (and nation’s) clean-energy economy was
clean-energy jobs as a percentage of total jobs. According to Pew, clean-energy jobs in 2007 ac-
counted for 0.49 percent of all national jobs, with 22 states exceeding that national average. Eight
of the Top 15 states had clean-energy job percentages of 0.5 percent or more. Oregon’s diverse set
of clean-energy activities gave it the overall lead with 1.02 percent of all jobs belonging to the
clean-energy economy. Massachusetts, with a 0.69 percent share for clean-energy jobs, landed in
fourth place behind Oregon, Maine, and California.
We can expect clean-energy jobs to account for a growing percentage of total jobs as the growth
of our national clean-energy economy expands. Massachusetts is already a leader in clean-energy
jobs share, but the state should focus efforts on pushing this percentage higher. If the state is serious
about cementing its position as a clean-energy hub, it needs to significantly expand the number of
clean-energy jobs in the state. And there are several efforts underway to make that happen, with
particularly encouraging emphasis on economically distressed areas of the state. MassCEC, for
example, currently oversees a $1 million state Pathways out of Poverty grant for solar and energy-
efficiency installation training in Brockton, Lowell, Pittsfield, Springfield/Holyoke, and Worcester.

© 2010 Clean Edge, Inc. (www.cleanedge.com).A Clean Edge report for the Massachusetts Clean Enery Center44
Leaders of any kind stay ahead by continu-
ally examining and improving their activities. For
leadership in a field as competitive and dynamic
as clean energy, this is an absolute imperative.
Our primary and secondary research has clearly
shown that Massachusetts is a strong clean-
energy leader among states in the U.S. In both
the Barriers/Weaknesses and Leadership Scorecard
sections of this report, however, we have detailed
some areas where Massachusetts is behind other
leading states in policy and other disciplines. This
section of the report spells out 9 action items
that we recommend the state pursue in its goal
to advance its status as a national – and global –
leader in clean-energy development, deployment,
and both private and public-sector innovation.
In some cases, the state has already taken initial
steps on these recommendations.
Establish an energy-efficiency innovation center and pursue a 1. national Department of energy laboratory.
As previously noted, energy efficiency is one of the crown jewels of Massachusetts’ clean-energy
sector assets. The Fraunhofer Center for Sustainable Energy Systems, a collaboration between
Fraunhofer and MIT for building efficiency systems and solar PV research, is a notable effort in this
area. The presence of a high-profile, multiple-stakeholder center for research devoted specifically to
a range of efficiency technologies would help attract targeted funding and cement the state’s stature
as a world hub in this sector.
The optimum scenario, a Massachusetts-based national DOE lab for efficiency technologies, would
also address one of the state’s clean-energy leadership weaknesses, the lack of such a lab. Although
the state can’t control DOE decisions, it is already taking action on this score, applying for the
DOE’s Energy Efficient Building Systems Design Energy Innovation Hub – one of three such new
hubs announced in December 2009 by Secretary of Energy Dr. Steven Chu. MIT, UMass, Fraunhofer,
and MassCEC are leading a coordinated effort to land this hub, which will focus on systems-based
approaches to efficient design, construction, and operation of commercial and residential buildings.
The hub will be the core of a $129.7 million federal Energy Regional Innovation Cluster – exactly
what Massachusetts needs.
stRateGY anD RecoMMenDatIons: a nine-Point action Plan for Massachusetts
nine-Point action Plan at-a-Glance
Establish an energy-efficiency innovation center and 1. pursue a national DOE lab
Adopt aggressive financial incentives for clean energy2.
Establish a Massachusetts “Green Bank” to accelerate 3. funding
Continue to increase commercialization of clean-energy 4. research advances
Institute on-bill repayment system for energy-efficiency 5. enhancements
Boost regulations for building efficiency6.
Streamline and hasten the local permitting process for 7. clean-energy projects
Take carbon-reduction leadership to the next level: 8. nationwide
Play to the state’s strengths9.

© 2010 Clean Edge, Inc. (www.cleanedge.com).A Clean Edge report for the Massachusetts Clean Enery Center 45
Adopt aggressive financial incentives for clean energy.2.
Massachusetts is already taking a number of key steps to finance clean energy in the state, most
notably its SREC program, which took effect in 2010, to support the solar carve-out goals of the
state RPS. This program should be closely measured and monitored to ensure that it is keeping the
state on pace to meet its goal of 400 MW of solar PV. And the state should keep other alternative
financial incentives in mind – for solar and other clean-energy technologies – including a FIT and
tax credits. As outlined in the Financial Incentives and Drivers section on page 32, a FIT – direct
government cash payments to generators of clean energy – can be a highly effective mechanism to
spur clean-tech development. A number of our interviewees recommended this step for the state,
and it should be considered for solar if the solar REC program fails to establish necessary market
momentum.
To avoid FIT program excesses that have occurred elsewhere, however, state policymakers must
carefully consider payment rates, calibrate those rates to move up and down as utility rates fluctu-
ate, ensure that rates decline over time, and place caps on project eligibility and program duration.
Other options for solar and other technologies are, production and/or investment tax credits for
clean-energy projects. These could include so-called “pass throughs,” allowing the tax credit to
pass to a third-party tax equity investor in the event that a project host (such as a municipality or
non-profit) is not a taxpaying entity – or if the project developer or owner does not currently have
earnings and the tax liabilities that come with them.
establish a Massachusetts “Green bank” to accelerate funding 3. for clean-energy and energy-efficiency startups and projects.
Clean-energy advocates in Washington, D.C. are currently pushing for the establishment of a
federal Clean Energy Deployment Administration or Green Bank. The concept is an independent,
government-sponsored enterprise that provides loan guarantees, debt instruments, and other financ-
ing tools to stimulate private-sector lending and investments in clean energy. The concept can work
on the state level as well, and we recommend that Massachusetts become the first state to do this.
Policy analysts say a Green Bank can leverage public spending by 10x to 20x – a $10 million state
outlay could attract $100 million to $200 million in private capital. This would be an excellent way
to engage the state’s large traditional financial players – investment and commercial banks, and the
state pension funds – in the clean-energy space where they have not been active to date. It could
address the issue of a shortage of seed-stage capital cited as a state weakness by several interviewees
for this report and would help keep capital within the state for local projects, companies, and job
creation. And it may already have a key supporter in Massachusetts: Congressman Ed Markey
co-authored an article with Coalition for Green Capital founder and former FCC head Reed Hundt
on the coalition’s web site in March 2010.

© 2010 Clean Edge, Inc. (www.cleanedge.com).A Clean Edge report for the Massachusetts Clean Enery Center46
continue to increase commercialization of clean-energy research 4. advances.
The gap from lab innovation to market commercialization in Massachusetts is a key clean-energy
weakness cited by several interviewees who feel that the state needs to do a better job of mining its
rich intellectual property and knowledge base to create commercial products. The state took a big
step to address this in March 2010 with the launch of the Company Catalyst Program, which brings
MassCEC funds to the Massachusetts Technology Transfer Center (MTTC) with the specific goal of
commercializing clean-energy technologies. Researchers apply for grants of up to $40,000 to help
them demonstrate the commercial viability of their projects.
MTTC has focused on helping bring in-state technology innovations to market since its founding in
2004, but the Company Catalyst Program is its first initiative that targets clean energy exclusively.
It is a great step and we recommend that the state continue to focus additional resources in this
area, and explore the possibility of a creating a fulltime clean-energy technology transfer position
or small staff to oversee this critical area statewide.
Institute an on-bill repayment system for energy-efficiency 5. enhancements.
In several leading clean-energy states, residents (and small businesses) can obviate the up-front
capital cost of weatherization and other efficiency improvements by paying off the project over
several years through a monthly charge on their utility bills. This financing mechanism is gaining
popularity at the state and city level around the U.S. as an effective mechanism enabling energy-
efficiency growth. Massachusetts is already actively exploring this possibility, with a Massachusetts
Energy Efficiency Advisory Council working group studying the issue. We recommend that the state
work with its utilities to implement such a system.
There is much enthusiasm in some quarters for PACE programs, a similar financing concept in which
residents pay off their efficiency (or clean-energy installation) project costs via their city or county
property tax bills. But from a statewide perspective, we recommend the on-bill repayment approach.
The highly fragmented nature of local property tax collection, particularly in a state with a strong
local governance model like Massachusetts, makes PACE a complex and daunting administrative
challenge.
Boost regulations for building efficiency.6.
We recommend several regulatory enhancements related to building codes that will help advance
Massachusetts’ leadership in energy efficiency. First it should mandate energy performance scoring
(EPS) – an energy-usage audit whenever a building is sold. A Massachusetts company, Conservation
Services Group, already performs this service for voluntary EPS programs in six states. Second,
Massachusetts should improve its contractor certification requirements for clean-energy and energy-
efficiency installers, such as making the North American Board of Certified Energy Practitioners’
solar PV installer certification mandatory rather than voluntary.

© 2010 Clean Edge, Inc. (www.cleanedge.com).A Clean Edge report for the Massachusetts Clean Enery Center 47
streamline and hasten the local permitting process for clean-7. energy projects.
Although state officials have worked hard to get the long-stalled Cape Wind project moving forward
and closer to final approvals, many large and small clean-energy developers continue to be frus-
trated by delays in permitting at the local level in Massachusetts. The Cape Wind experience “has
given the world the impression that Massachusetts is a NIMBY place, dictated by rich people,” said
one interviewee. That’s not a good image for a clean-energy leader. The state has made progress
here with the Oceans Act of 2008 clearing some hurdles for offshore wind. The legislature should aid
onshore wind by passing the pending Wind Energy Siting Reform Act, and the state should consider
similar streamlining efforts for biomass and other technologies.
take carbon-reduction leadership to the next level: nationwide. 8.
Massachusetts’ aggressive GHG reduction targets, its success to date, and its active participation in
RGGI give the state a powerful platform. As the debate over cap-and-trade rages on Capitol Hill,
Massachusetts officials can lead by continuing to step up and speak out about the economic payoffs
of carbon reduction. We recommend this not just to help advance carbon emissions legislation, but
to help keep it from moving backwards. In California, for example, a 2010 statewide ballot measure
and Republican candidates for governor are calling for a delay in GHG reduction implementation
until the economy improves. Massachusetts should continue to be prominent on the national stage
with the message that GHG reduction enhances, not hinders, economic growth.
Play to the state’s strengths.9.
Nationally and globally, clean energy is a highly diverse industry and no one state or region can lead
in all of its sectors. The best strategy is to pick your strengths and focus policies and resources on
those. From our research, we believe that Massachusetts’ three key areas of focus should be energy
efficiency, solar PV including thin-film, and advanced batteries/energy storage. Secondary areas,
those with great long-term potential but not as large today, are offshore wind, wave and tidal power,
solid-state lighting, and low-carbon materials.
In these areas and others, the state’s greatest assets, as noted throughout this report, are its unparal-
leled research, innovation, and knowledge-capital resources. The state should certainly seek to at-
tract and retain manufacturing where possible, but, we believe, should mainly focus on extending its
leadership as a hub of research breakthroughs and innovation excellence in clean-energy technolo-
gies and business models. Pursuing a globally influential, innovation-centric approach will continue
to create high-level scientific, technical, and business management jobs, as well as thousands of
green collar jobs in installing, operating, and maintaining these technologies. It’s an approach that
can lift all boats as Massachusetts moves forward with its own aggressive clean-energy build out
across the Bay State.
© 2010 Clean Edge, Inc. (www.cleanedge.com).A Clean Edge report for the Massachusetts Clean Enery Center48
aUtHoRs
Clean Edge, Inc., founded in 2000, is the world’s first research and publishing
firm devoted to the clean-tech sector. The company, via its publications, events,
and online services, helps companies, investors, and governments understand
and profit from clean technologies. Clean Edge, with offices in the San Francisco
Bay Area and Portland Oregon, offers unparalleled insight and intelligence on
emerging clean-tech trends, opportunities, and challenges. Among its activities,
the company publishes the annual Clean Energy Trends and Clean Tech Job Trends
reports; produces the annual Clean-Tech Investor Summit (along with IBF) held
each January in Palm Springs; maintains benchmark clean-tech stock indexes
with NASDAQ that track U.S. clean-energy (CELS), global wind (QWND) and smart
grid and grid infrastructure (QGRD) companies; and produces Clean Edge Jobs,
the premier clean-tech jobs board serving companies, recruiters, and candidates.
It also conducts custom research for a range of diverse stakeholders. For more
information visit: www.cleanedge.com.
Ron Pernick, co-founder and managing director of Clean Edge, is an ac-
complished market research, publishing, and business development entrepreneur
with more than two decades of high-tech experience. At Clean Edge, he manages
the firm’s major initiatives, including the annual Clean-Tech Investor Summit,
industry reports, stock indexes, and consulting projects. He is the co-author of the
highly acclaimed book The Clean Tech Revolution (Collins). Ron has coauthored
more than two dozen reports at Clean Edge, is widely quoted in the media, and
speaks regularly at industry events.
Clint Wilder, senior editor for Clean Edge, is an award-winning technology
and business journalist. His book The Clean Tech Revolution (with co-author Ron
Pernick), has been called “the best clean tech book” by ClimateProgress.org and has
been translated into seven languages. He writes Clean Edge research reports and
CE Views columns, and is also a blogger for the Green section of The Huffington
Post. He presents and moderates at conferences in the U.S. and abroad.
Trevor Winnie, research and marketing associate, is involved in a range of
activities at Clean Edge including working on the firm's stock index products and
supporting Clean Edge staff in the preparation of reports and consulting projects.
Aaron Berg, principal and founder of Blue Tree Strategies, and
Grant Poujade, consultant at Blue Tree Strategies, both have years of
experience in clean-energy and energy-efficiency accounting and finance. They
worked with Clean Edge on this project in a consulting capacity.
CLEAN EDGE, INC.

© 2010 Clean Edge, Inc. (www.cleanedge.com).A Clean Edge report for the Massachusetts Clean Enery Center 49
Below are our definitions and descriptions for each of the 59 categories on which we ranked the Top
15 states. The definitions and descriptions are listed in the same order in which they appeared in
the matrix section of the report.
ReGUlatoRY IncentIVes anD DRIVeRs
stanDaRDs
Appliance/Equipment Efficiency Standards Beyond Federal The United States government requires appliances and equipment to meet certain federal efficiency
standards, restricting retail sale of items that do not meet these requirements. When both the federal
government and a state have adopted efficiency standards for the same type of appliance or equip-
ment, the stricter standard applies. To earn a mark in this category, a state must have standards that
are more stringent or apply to a larger number of products than are covered by federal standards.
Contractor Certification
Contractor certification requires those working in the renewable energy or energy efficiency space
to acquire professional licensing to verify the ability to work with certain technologies and perform
certain tasks. Certification requirements are designed as consumer protection measures to ensure
that contractors have the necessary experience and knowledge to install systems properly.
Energy Efficiency Resource StandardAn energy efficiency (EERS) resource standard is a mechanism used to encourage more efficient
generation, transmission, and use of electricity and natural gas. An EERS includes end-user energy
saving improvements that are documented by utilities or other program operators. Distribution
system efficiency improvements, combined heat and power (CHP) systems, and other high-efficiency
distributed generation systems can be included as well. An EERS is typically implemented at the
state level and either included as part of a state’s RPS or as standalone legislation.
Procurement Mandates
State-level procurement mandates (usually overseen by finance departments) require all state agen-
cies and anyone under contract with a state agency to use environmentally friendly materials and
high efficiency equipment whenever possible. Requirements vary by state, but usually advocate for
the use of recycled products, products made through carbon neutral manufacturing, or without use
of hazardous chemicals.
Renewable Energy/Energy Efficiency Technology Certification
States can adopt policies that require renewable energy equipment to meet certain standards in order
to protect consumers from buying inferior equipment. These requirements benefit consumers and
protect the renewable energy industry by making it difficult for substandard products to reach the
market.
aPPenDIX: leaDeRsHIP scoRecaRD DefInItIons

© 2010 Clean Edge, Inc. (www.cleanedge.com).A Clean Edge report for the Massachusetts Clean Enery Center50
statewide Renewable fuel standard A state renewable fuel standard (RFS) establishes specific volume mandates for cellulosic biofuel,
biomass-based diesel, advanced biofuel, and total renewable fuel that must be used in transportation
fuel each year. Statutory requirements also include definitions and criteria for both renewable fuels
and the feedstocks used to produce them, including new greenhouse gas emission (GHG) thresholds
and carbon lifecycle analysis. To earn a mark in this category, states must have a statewide RFS in
place, not just an RFS that applies to state vehicle fleets.
bUIlDInG coDes
current building energy codes Meet or exceed latest Iecc and asHRae standardsThe International Energy Conservation Code (IECC) and the American Society of Heating, Refrigerat-
ing and Air Conditioning Engineers (ASHRAE) standards are two important sets of guidelines which
states can model building energy codes after. To qualify for a mark in this section, states must
have building code legislation in place which meets or exceeds 2009 IECC standards for residential
buildings and 2007 ASHRAE standards for commercial buildings, as tracked by the Building Codes
Assistance Project.
leeD Green building Requirements for state-owned buildingsBuilding energy codes adopted by many states require new construction and renovation of state-
owned buildings to adhere to certain green building standards. Some states simply require efforts be
made to exceed existing code requirements, but to earn a mark in this category a state must mandate
a specific level of LEED as the minimum standard.
Mandated energy Performance scoring statewide for Residential or commercial buildings
In order to improve the transparency of buildings’ energy use characteristics, states can implement
legislation that mandates energy audits to assign energy scores to existing residential or commercial
buildings. This mechanism empowers the buyer to be aware of a building’s energy performance and
provides valuable information for purchasing decisions. While some states have energy performance
scoring systems available, California’s Home Energy Rating System Program is the only plan in
place that requires energy performance scoring statewide – in this case, for residential buildings.
Mandated Energy Efficiency Improvements for State-Owned Build-ingsMany states have mandated state-owned buildings to undergo energy efficiency improvements
through energy efficiency retrofits, energy audits, or other energy-saving measures.
UtIlItY ReGUlatIons
DecouplingBecause utilities earn revenue from the sale of electricity, it makes no business sense for them to
reduce overall electricity consumption by promoting energy efficiency measures. To incentivize
utilities to pursue energy efficiency, some states have “decoupled” utility profits from the amount of

© 2010 Clean Edge, Inc. (www.cleanedge.com).A Clean Edge report for the Massachusetts Clean Enery Center 51
electricity sold. Methods of decoupling vary, but most commonly utilities are rewarded with a slight
upward adjustment in rates if electricity sales are lower than forecasted.
Public Benefit Fund
Public benefit funds are state-level programs typically developed to ensure continued support for
renewable energy resources, energy efficiency initiatives, and low-income energy programs. These
funds are most commonly supported through a very small surcharge on electricity consumption.
Cost Recovery Other Than Public Benefit Fund
Some states allow utilities to use mechanisms such as tariffs, riders, or surcharges – not labeled as
a public benefit charge – that help recover revenue lost through reduced energy consumption and
premium renewable energy generation costs.
smart Meter Penetration Greater than 5% of state’s electric MetersSmart meters are an enabling smart grid technology and are often the first wave of utility smart grid
projects. To track states with strong, widespread smart grid ambitions we created a threshold of five
percent smart meter penetration. To earn a mark in this category, a state must have smart meters
installed on at least five percent of all electric meters.
standardized Power Purchase agreementsPower purchase agreements (PPAs) are used as contracts for the purchasing of energy created from
power generating projects. Standardizing these PPAs allows for quicker negotiations with utilities
and lower legal fees associated with project development.
strong net-Metering law/Policy
Net metering allows electric customers with on-site energy projects to sell surplus electricity back to
the utility during times when electricity production exceeds consumption. These customers – mostly
owners of PV systems – are paid a pre-determined price for the electricity sold back to the grid.
Net metering is required by law in most U.S. states, but some of these laws only apply to investor-
owned utilities and exclude municipal utilities or electric cooperatives. States earning a mark in this
category received a grade of B or better according to the 2009 Freeing the Grid report published by
the Network for New Energy Choices.
strong Interconnection law/PolicyInterconnection standards govern the technical and procedural process by which an electric customer
connects an electric-generating system to the grid. Interconnection standards specify the technical,
contractual, metering, and rate rules that system owners and utilities must abide by. Standards for
systems interconnected at the distribution level are typically adopted by state public utility commis-
sion, while the Federal Energy Regulatory Commission (FERC) has adopted standards for systems
interconnected at the transmission level. Not all states have adopted interconnection standards, and
some states’ standards apply only to investor-owned utilities – not to municipal utilities and electric
cooperatives. States earning a mark in this category receive a grade of B or better according to the
2009 Freeing the Grid report published by the Network for New Energy Choices.

© 2010 Clean Edge, Inc. (www.cleanedge.com).A Clean Edge report for the Massachusetts Clean Enery Center52
ReneWable PoRtfolIo stanDaRDs
20% or Higher by 2020 or earlier; or 25% by 2025
A renewable portfolio standard (RPS) is a regulatory policy that requires utilities to produce a
specific portion of their electricity from renewable energy sources by a specific date. State RPS
targets vary widely, both in terms of the percent targeted and the target date. To separate stronger
RPS legislation from the pack, a threshold of 20 percent by 2020 or earlier, or 25 percent by 2025
was created. For RPS mandates with target dates in years other than 2020 or 2025, the target percent
was required to be equal to or larger than the last two digits of the target year up until 2025 (e.g.,
21 percent by 2021 and 23 percent by 2023 would both qualify).
enforceableAlthough most state RPS mandates are legally enforceable, some states have announced renewable
targets that are merely goals and not based on actual legislation. To receive a mark in this category,
and qualify for a mark in any of the other RPS categories, a state must have an RPS mandate that
is enforceable by law.
IncentivesAlthough rare, an RPS mandate can also incentivize utilities to reach a certain renewable target.
States with incentives embedded into RPS legislation receive marks in this category.
Inclusion of set-asides
The term “set-aside” refers to a provision within a state’s RPS that requires utilities to acquire a cer-
tain amount of electricity from a specific type of energy generation. Examples of set-asides include
states creating targets for one or more specific technology; states requiring a certain percentage from
customer-sited distributed generation (regardless of technology used); and states creating multiple
tier categories with different percentage requirements for each tier.
no clean coal or nuclear Power
RPS details vary by state and each allows a unique set of technologies to count towards a utility’s
renewable portfolio. Some states allow clean coal and nuclear power to qualify as renewable energy
generation, consequently weakening the overall RPS mandate. This category grants marks only to
states that explicitly exclude clean coal and nuclear power.
no large scale Hydro (30 MW or Greater)Hydropower, while a carbon-free and renewable source of energy, can cause significant environmen-
tal harm when implemented at a large scale. In an attempt to create a more sustainable RPS, some
states choose to restrict the type of hydropower that can be counted towards a utility’s renewable
portfolio. To earn a mark in this category, state RPS legislation must restrict any hydro project that
has a capacity of 30 MW or greater.
Penalties States issuing penalties to utilities that fail to meet defined RPS targets receive a mark in this
category.

© 2010 Clean Edge, Inc. (www.cleanedge.com).A Clean Edge report for the Massachusetts Clean Enery Center 53
caRbon ReDUctIon coMMItMent
climate action Plan
Cities and states committed to reducing carbon, promoting clean technology and energy efficiency,
will often outline a detailed “climate action plan” describing how clean-energy and carbon reduction
goals will be met. Those states with completed climate action plans earn marks for this category.
GHG Reduction target Using 1990 levels or better by 2020 or earlierGHG reduction targets are commonly expressed in either parts per million of carbon dioxide equiva-
lent, or parts per million of carbon dioxide equivalent concentration, as a percentage reduction
from a specified baseline or nominated year. States receiving marks in this category must have a
legislative GHG reduction goal targeting 1990 levels of GHG emissions or better by the year 2020.
GHG Reduction targets Mandated by lawGreenhouse gas (GHG) reduction targets are a popular way for states to indicate carbon reduction
goals. Several states have GHG reduction targets in-place, but many are recommendations by a com-
mission rather than actual legislation. Given that without legislation these targets are unenforceable,
states must have actual GHG law in place to receive a mark in this category.
Membership in Regional climate InitiativeRegional climate initiatives aim to develop uniform regulatory environments across multi-state
geographies. Major regional initiatives in the United States include the Midwest Greenhouse Gas
Reduction Accord (MGGRA), the Western Climate Initiative (WCI), and the Regional Greenhouse
Gas Initiative (RGGI). Some of these initiatives include member states as well as observer states.
To qualify for a mark in this category, states must have member status in a major regional climate
initiative.
solaR anD WInD easeMent anD access laWs
solar - easement and access lawsSolar and wind access laws, which may be implemented at both the state and local levels, are
designed to protect a consumer’s right to install and operate a solar or wind energy system at a
home or business. Some solar access laws also ensure a system owner’s access to sunlight. In some
states, access rights prohibit homeowners associations, neighborhood covenants or local ordinances
from restricting a homeowner’s right to use solar energy. Easements, the most common form of
solar access law, allow for the rights to existing access to a renewable resource on the part of one
property owner to be secured from an owner whose property could be developed in such a way
as to restrict that resource. An easement is usually transferred with the property title. At the local
level, communities use several policies to protect solar access, including solar access ordinances,
development guidelines requiring proper street orientation, zoning ordinances that contain building
height restrictions, and solar permits.
Wind - easement and access laws
See: Solar – Easement and Access Laws

© 2010 Clean Edge, Inc. (www.cleanedge.com).A Clean Edge report for the Massachusetts Clean Enery Center54
fInancIal IncentIVes anD DRIVeRs
coMMeRcIal taX IncentIVes
Investment tax credit
Investment tax credits (ITCs) are offered as a function of the total eligible costs of installing a
renewable energy or efficiency project. ITCs exist at the federal and state level and are available to
the owners of the project, whether a corporation, LLC, partnership, or individual. States receiving a
mark in this category had an ITC program in place.
Production tax credit
Production tax credits (PTCs) are based on the number of energy units a renewable energy system
generates. To ensure project quality, payments based on a system’s actual performance are generally
more effective than incentive payments based on a system’s rated capacity. PTCs exist at the federal
and state level and are available to the owners of the project, whether a corporation, LLC, partner-
ship, or individual. States receiving a mark in this category had a PTC program in place.
ResIDentIal anD InDIVIDUal taX IncentIVes
Income tax exemption or Reduction
Many states offer income tax incentives to reduce the expense of purchasing and installing renew-
able energy or energy efficiency systems and equipment. Eligible technologies and credit/deduction
structure varies by state, and in most cases there is a maximum limit on the dollar amount of the
credit or deduction.
Property tax exemption or ReductionSome states offer state property tax exemptions or reductions if homeowners install renewable
energy systems or implement energy efficiency upgrades. Because property taxes are collected lo-
cally, some states grant local taxing authorities the option of allowing a property tax incentive for
renewable energy systems.
sales tax exemption or Reduction
Sales tax incentives typically involve an exemption from the state sales tax (or sales and use tax) for
the purchase of a renewable energy system, an energy-efficient appliance, or other energy efficiency
measures.
InVestMent actIVItY
state equity fund
Several states have established clean-energy funds which provide equity to projects and/or com-
panies to accelerate the development of energy efficiency and clean energy. These funds are often
executed in partnership with a private financial firm or as an extension of an existing public benefit
energy fund. While several states offer direct equity financing for private businesses innovating
clean-energy technologies, some have laws that prohibit any state agency from having a direct
ownership interest in any private enterprise.

© 2010 Clean Edge, Inc. (www.cleanedge.com).A Clean Edge report for the Massachusetts Clean Enery Center 55
Venture Capital and Other Private Investment ($400M+, 2007-09)Data provider Bloomberg New Energy Finance tracks global investment deals in the clean-energy
sector including deal date, deal size, type of funding, etc. Using this database, investment deals
were tallied from January 2007 through December 2009 for recipient companies headquartered in
each of the Top 15 states. To highlight state leaders in this category, a threshold dollar amount was
created. States that accumulated a sum of at least $400 million in disclosed deal values during this
time period received marks for this category. Deal types included venture capital financing rounds,
private equity expansion capital, and private equity buyouts.
Venture Capital and Other Private Investment (30+ Deals, 2007-09)Using the same Bloomberg New Energy Finance database for investment dollar amount, deals were
tallied from January 2007 through December 2009 by companies headquartered in each of the Top
15 states. To highlight state leaders in this category, a threshold deal total was created. States that
completed at least 30 investment deals during this time period received marks for this category.
Deal types included venture capital financing rounds, private equity expansion capital, and private
equity buyouts.
UtIlItY IncentIVes
Energy Efficiency Loans Offered by More than 5% of UtilitiesIn many states, utility loan programs provide customers with financing for the completion of energy
efficiency projects or the purchase of energy efficient equipment. For a state to earn a mark in this
category, at least five percent of its utilities must offer energy efficiency loans.
Renewable energy loans offered by More than 5% of UtilitiesIn many states, utility loan programs provide customers with financing for the purchase of renewable
energy systems. These programs commonly provide funding for solar water heaters, PV systems, and
geothermal heat pumps, among other things. For a state to earn a mark in this category, at least five
percent of its utilities must offer renewable energy loans.
Energy Efficiency Rebates Offered by More than 20% of UtilitiesUtilities often offer rebates for customers that complete energy efficiency measures. For a state to
earn a mark in this category, at least 20 percent of its utilities must offer energy efficiency rebates.
Renewable energy Rebates offered by More than 20% of Utilities
Utilities sometimes offer customer rebates to promote the installation of renewable energy systems.
Rebate amounts vary widely based on technology and program administrator. For a state to qualify
for a mark in this category, at least 20 percent of its utilities must offer renewable energy rebates.
state Performance Incentives for UtilitiesThe use of performance incentives (also known as utility incentives or shareholder incentives) is
a commonly used approach by states that have any mechanisms in place beyond program cost
recovery. States with performance incentives reward utilities for successfully reaching or exceeding
clean-energy program goals.

© 2010 Clean Edge, Inc. (www.cleanedge.com).A Clean Edge report for the Massachusetts Clean Enery Center56
loan/casH IncentIVes
Direct loan Programs
Loan programs provide financing for the purchase of renewable energy or energy efficiency systems
or equipment. Some state governments offer low-interest loans for a broad range of renewable
energy and energy efficiency measures. Other states provide funds for the capitalization of a loan
fund. These programs are commonly available to the residential, commercial, industrial, transporta-
tion, public, and nonprofit sectors.
Grant Programs
States offer a variety of grant programs to encourage the use and development of renewable energy
technologies and energy efficiency measures. Most programs offer support for a broad range of
technologies, while a few programs focus on promoting one particular technology. Grants are avail-
able primarily to the commercial, industrial, utility, education, and government sectors. Most grant
programs are designed to pay down the cost of eligible systems or equipment. Others focus on
research and development, or support project commercialization.
loan Guarantees
Some states allow for funds to be used to support clean-technology projects in the form of loan
guarantees. These guarantees incentivize private financial institutions to lend to clean-technology
projects by limiting their risk of financial loss. In the event the project is unable to support its
debt service and defaults on the loan, the state government services the debt or pays the financial
institution a pre-designated amount of the loan principal.
Pace financing Program and/or legislation
Property accessed clean energy (PACE) legislation allows for the use of municipal bonding authority
to capitalize financing programs for property owners. In a PACE program, homeowners are given
a loan which finances installation of renewable energy systems or implementation of energy ef-
ficiency measures. PACE homeowners then payback this loan over a period of time through property
tax payments.
on-bill Repayment Mandate
On-bill repayment mandates require that utilities have billing systems capable of serving as a repay-
ment conduit for the financing of renewable and energy-efficiency projects. With an on-bill repay-
ment mandate, home and building owners can pay back energy-efficiency and renewable-energy
loans through payments on their regular utility bill.
Renewable Energy Certificate Incentives
Renewable energy certificates (RECs) are issued by clean power producers and certified by indepen-
dent auditing bodies. RECs represent the “environmental attributes” associated with the production
of renewable energy. RECs help state governments, corporations, and utilities fulfill requirements to
support clean technology, like those required by state RPS mandates.
statewide feed-In tariff Program or legislation A feed-in tariff is a type of production incentive that provides cash payments based on the number

© 2010 Clean Edge, Inc. (www.cleanedge.com).A Clean Edge report for the Massachusetts Clean Enery Center 57
of kilowatt-hours (kWh) a renewable energy system generates. Utilities operating under a feed-in
tariff are required to buy energy from renewable energy systems for a pre-determined price that
is subsidized by the state. In the United States, feed-in tariff programs are emerging at both at the
state and city levels. For a state to qualify for a mark in this section, a statewide feed-in tariff must
exist.
KnoWleDGe caPItal anD econoMIc/WoRKfoRce DeVeloPMent
KnoWleDGe caPItal
at least one Global top-Ranked Green Mba Program
One way in which universities are supporting state efforts to develop a clean-energy economy is
by providing focused business and management training in the clean-technology field. The Aspen
Institute, an international nonprofit group, issues a yearly ranking of the Top-100 Green MBA pro-
grams. States earning a mark in this category have at least one of these programs located in-state.
campus climate commitment Member (at least 20%)The American College & University Presidents’ Climate Commitment guides institutions in imple-
menting sustainable practices that impact a wide range of issues, such as green building, recycling
and waste management, water and energy use, food systems, procurement policies, and transporta-
tions. To date, 677 higher education institutions around the United States have joined this initiative
to make campuses “climate neutral” by establishing policies to limit greenhouse gas emissions and
reduce energy usage. States receiving marks in this category have more than 20 percent of all 2-4
year institutions in the state as members of the ACUPCC.
Innovative clean energy academic Programs (at least 5%)A number of post-secondary schools are implementing innovative clean-energy academic programs
in response to the growing opportunities available in the economy to appropriately trained gradu-
ates. Three databases tracking the nation’s clean-energy education programs include the Interstate
Renewable Energy Council, the United States Department of Energy, and the National Council for
Workforce Education. To qualify for a mark in this category, at least five percent of a state’s 2-4 year
higher education institutions had to be recognized for their clean-energy education programs by one
of the three aforementioned agencies.
top-Ranked overall Green Universities (at least 10%) To earn a mark in this category, a state must have at least 10 percent of its 2-4 year higher education
institutions recognized in one of several sets of rankings sources. Ranking sources include Top 10
Clean-Tech Colleges 2010 (Cleantech Group); 2010 Green Rating Honor Roll (Princeton Review);
Cool Schools 2009 (Sierra Club); College Sustainability Report Card 2010 (Sustainable Endowments
Institute); Top 20 Green Power Purchasers (U.S. Environmental Protection Agency).

© 2010 Clean Edge, Inc. (www.cleanedge.com).A Clean Edge report for the Massachusetts Clean Enery Center58
econoMIc/WoRKfoRce DeVeloPMent
clean-energy Jobs as a Percentage of total Jobs (0.5% or More of state total)In June 2009, The Pew Charitable Trusts published a report examining the growth of America’s
clean-energy economy from 1998 to 2007. One way in which states can be compared against each
other is by estimating clean-energy jobs as a share of the state’s overall economy. Pew reported that
nationally, clean-energy jobs accounted for 0.49 percent of all jobs in 2007. For states to earn a
mark, at least a 0.50 percent share for clean-energy jobs must have been achieved.
Clean-Energy Patents Registered (3% or More of U.S. Total, 2002-09)Heslin Rothenberg Farley & Mesiti P.C., an Albany, New York-based intellectual property law firm,
has tracked clean-energy patents since 2002 through its Clean Energy Patent Growth Index. Percent
share of patents issued by state is one of the many ways in which this index breaks down the histori-
cal dispersion of patent registrations in the United States. To qualify for a mark in this category, a
state must be home to at least three percent of all clean-energy patents issued in the U.S. from 2002
through 2009.
Presence of a clean energy alliance business Incubator
Availability of incubators providing business and financial services to startup companies is an
important economic development tool. The National Renewable Energy Laboratory (NREL), one of
DOE’s National Labs, has formed a network of incubators across the country that focuses exclusively
on the clean-energy community. This network, called the Clean Energy Alliance, consists of 11
incubators in 11 different states. Although other important incubators exist outside of this network,
affiliation with NREL gives incubators a greater ability to impact the clean-energy economy. States
earned marks in this category only if they were home to a Clean Energy Alliance incubator.
Presence of a Department of energy national lab
The U.S. Department of Energy funds and maintains 21 National Laboratories and Technology Cen-
ters around the country. Being home to a DOE lab can be a great advantage to state hoping to be a
leader in the national clean-energy economy. States housing a DOE lab that has a clear involvement
in clean-energy technologies earned a mark in this category.