a g e n d a - barossa council meetings... · review $110k, acba - salters gully master plan $10k,...
TRANSCRIPT
NOTICE OF SPECIAL COUNCIL MEETING
Notice is hereby given that a Special Meeting of Council
will be held on Thursday 26 May 2016,
in the Council Chambers, 43 – 51 Tanunda Road, Nuriootpa,
commencing at 5.30pm
Martin McCarthy
CHIEF EXECUTIVE OFFICER
THE BAROSSA COUNCIL
A G E N D A
1. THE BAROSSA COUNCIL
1.1 Welcome by Mayor Sloane - meeting declared open
1.2 Present
1.3 Leave of Absence
Nil
1.4 Apologies for Absence
Cr Boothby
2. DEBATE AGENDA
2.1 EXECUTIVE SERVICES - CHIEF EXECUTIVE OFFICER
2.1.1 Ngadjuri Nation #2 Native Title Claim – Change Of Legal
Representation and Continued Funding
2
3.1 FINANCE
3.1.1 2016/17 – 2025/26 Long Term Financial Plan and 2016/17
Annual Budget And Business Plan
9
3. CONFIDENTIAL AGENDA
Nil
4. NEXT MEETING
3.1 Tuesday 21 June 2016 commencing at 9.00am
5. CLOSURE
1

SPECIAL COUNCIL MEETING
EXECUTIVE SERVICES
CHIEF EXECUTIVE OFFICER REPORT
26 MAY 2016
2.1 DEBATE AGENDA – CHIEF EXECUTIVE OFFICER
2.1.1
NGADJURI NATION #2 NATIVE TITLE CLAIM – CHANGE OF LEGAL REPRESENTATION AND
CONTINUED FUNDING
B859
INTRODUCTION
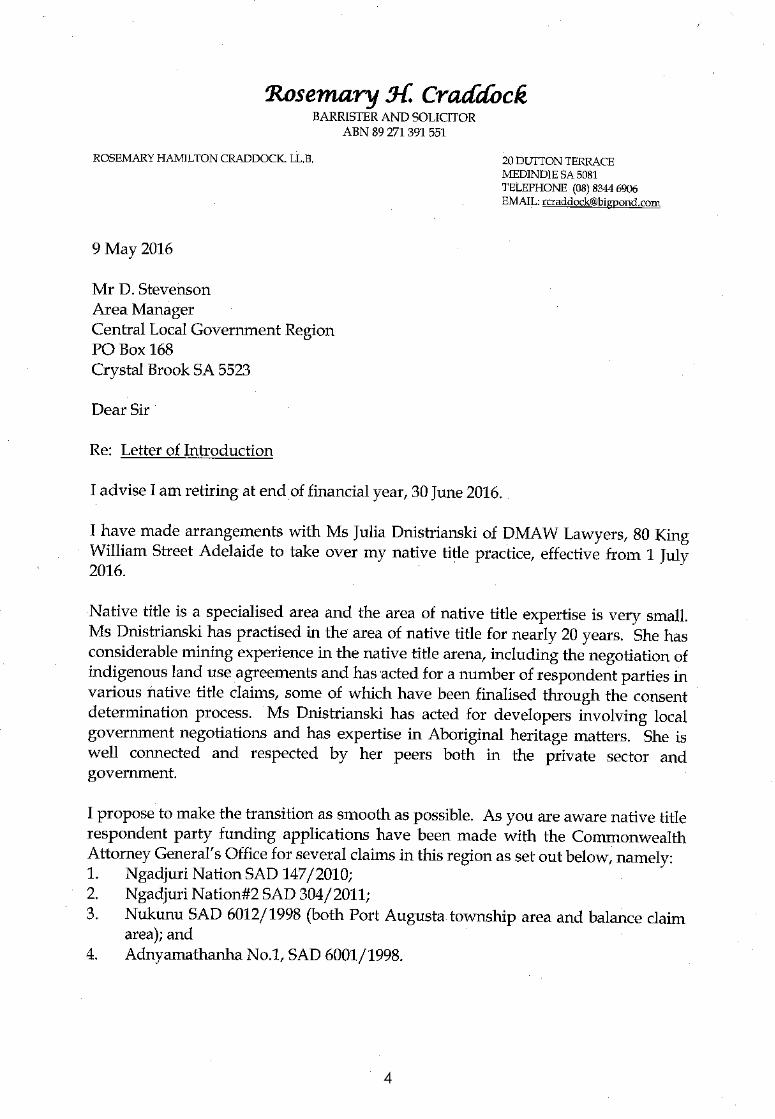
Attached is correspondence dated 9 May 2016 from Solicitor Rosemary Craddock
who, following a Council resolution on 17 July 2012 (Minute reference: 2012/174) was
briefed to represent Council in Federal Court proceedings in the Ngadjuri Nation #2
Native Title claim, but who will soon retire from her legal practice.
RECOMMENDATION
That Council:
(1) Endorses the decision of the Central Local Government Region (CLGR), at its
13 May 2016 meeting, to appoint Ms Julia Dnistrianski of DMAW Lawyers
following the retirement of Solicitor Rosemary Craddock, to represent Council
in Federal Court proceedings in the Ngadjuri Nation #2 Native Title claim; and
(2) Agrees to share on a pro-rated basis with the CLGR councils such of Ms
Dnistrianski’s costs which are not covered by the Commonwealth Attorney-
General’s grant funding for this claim.
COMMENT
On 9 May 2016, the Area Manager of the Central Local Government Region was
advised by Ms Craddock that she will be retiring at the end of the financial year 30
June 2016. She had made arrangements to transfer her Native Title practice to Ms Julia
Dnistrianski who is a specialist in the area. Ms Craddock’s correspondence and resume
of Ms Dnistrianski’s is attached for Elected Member reference.
Council’s respondent status in this claim has been partly funded by the Commonwealth
Attorney-General’s office. The current funding period runs from 1 May 2016 – 30
October 2016. Ms Craddock is in the process of submitting applications to cover the
May through June period. If Council agrees to her acting on its behalf, Ms Dnistrianski
will need to lodge funding applications from mid-June 2016, to ensure continuity of
funding from 1 July 2016.
In some instances where Ms Dnistrianski’s costs significantly exceed the grant, Council
will need to agree to share the costs with the CLGR on a pro rata basis in each
2
individual claim. These are the same arrangements as Rosemary Craddock had in
place with the CLGR.
Elected Members should note that Commonwealth Attorney-General’s grants are only
made to councils (or any respondent parties) if they have a group representative - that
is a common solicitor.
Attachment:
Correspondence dated 9 May 2016 from Rosemary Craddock and resume of Julia
Dnistrianski.
LEGISLATION/POLICY/COUNCIL STRATEGIC PLAN
Legislation – Native Title Act 1994
Council Strategic Plan – 4. Governance and Organisation 4.1 – Responsibility
FINANCIAL, RESOURCE AND RISK MANAGEMENT CONSIDERATIONS
Financial – Any financial support for the 2016/17 year is not yet budgeted. Based on
fees from Ms Craddock to date, however, the amount needed is considered
minimal as the intent is to continue to share on a pro-rated basis between the CLGR
any excess legal fees not covered by grant funding.
Resource – Nil
Risk Management – Council minimises its risk of exposure to a claim under the Native
Title Act by being represented by an expert in the field.
COMMUNITY CONSULTATION
There is no community consultation required under the Local Government Act 1999.
3
4

5
Page 1
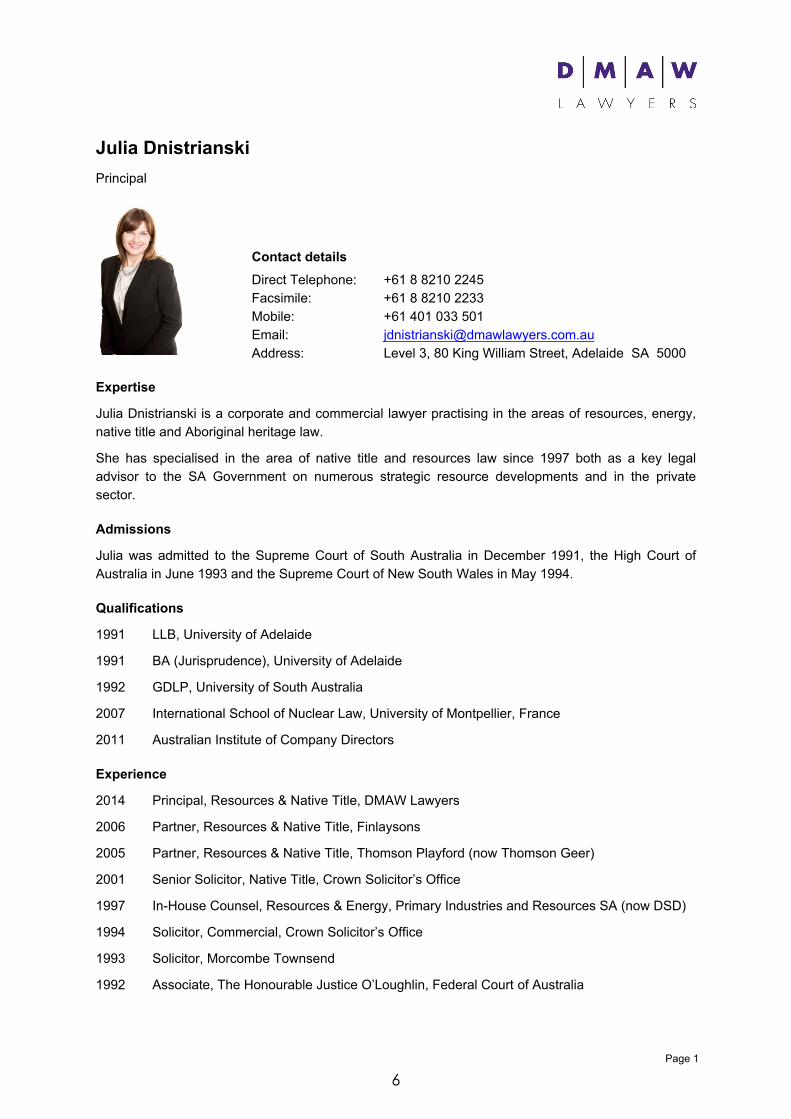
Julia DnistrianskiPrincipal
Expertise
Julia Dnistrianski is a corporate and commercial lawyer practising in the areas of resources, energy, native title and Aboriginal heritage law.
She has specialised in the area of native title and resources law since 1997 both as a key legal advisor to the SA Government on numerous strategic resource developments and in the private sector.
Admissions
Julia was admitted to the Supreme Court of South Australia in December 1991, the High Court of Australia in June 1993 and the Supreme Court of New South Wales in May 1994.
Qualifications
1991 LLB, University of Adelaide
1991 BA (Jurisprudence), University of Adelaide
1992 GDLP, University of South Australia
2007 International School of Nuclear Law, University of Montpellier, France
2011 Australian Institute of Company Directors
Experience
2014 Principal, Resources & Native Title, DMAW Lawyers
2006 Partner, Resources & Native Title, Finlaysons
2005 Partner, Resources & Native Title, Thomson Playford (now Thomson Geer)
2001 Senior Solicitor, Native Title, Crown Solicitor’s Office
1997 In-House Counsel, Resources & Energy, Primary Industries and Resources SA (now DSD)
1994 Solicitor, Commercial, Crown Solicitor’s Office
1993 Solicitor, Morcombe Townsend
1992 Associate, The Honourable Justice O’Loughlin, Federal Court of Australia
Contact detailsDirect Telephone: +61 8 8210 2245Facsimile: +61 8 8210 2233Mobile: +61 401 033 501Email: [email protected]: Level 3, 80 King William Street, Adelaide SA 5000
6

Page 2
Native Title and Aboriginal Heritage
Julia Dnistrianski is one of South Australia’s pre-eminent native title lawyers. She has been actively involved in the development of initiatives in the State to facilitate land access for resources and development activities and has been involved in numerous native title consent determinations.
Julia appeared in the High Court as junior counsel in the Yorta Yorta native title matter and was instructing solicitor in a Federal Court hearing of the Barkandji No.4 native title claim in NSW. She also represents numerous mining companies as respondent parties to native title claims in South Australia.
Relevant experience includes:
negotiation, drafting and registration of numerous indigenous land use agreements for minerals exploration as a former key member of the South Australian Government’s indigenous land use agreement (ILUA) negotiation team;
representing the South Australian Chamber of Mines & Energy in ‘Statewide’ negotiations promoted by the South Australian Government with the former Aboriginal Legal Rights Movement for conjunctive petroleum indigenous land use agreements;
negotiation of Aboriginal heritage clearance agreements and numerous minerals and petroleum production and exploration native title agreements on behalf of Areva Resources Australia Pty Ltd, Alliance Resources Ltd, Arckaringa Energy Pty Ltd, Australian Metals Group Ltd, Endeavour Discoveries Limited, Origin Energy Geothermal Pty Ltd, OZ Exploration Pty Ltd, OZ Minerals Carrapateena Pty Ltd, OZ Minerals Prominent Hill Operations Pty Ltd, PepinNini Minerals Limited, Sinosteel PepinNini Curnamona Management Pty Ltd, South Australian Chamber of Mines and Energy Pty Ltd, Straits Resources Limited, Sumitomo Metal Mining Oceania Pty Ltd, Teck Australia Pty Ltd, UXA Resources Ltd and Vale Exploration Pty Ltd;
access agreements to Aboriginal freehold land held by the Pitjantjatjara and Yankunytjatjara People for mineral exploration;
provision of native title and Aboriginal heritage advice on numerous infrastructure projects including the SEAGas Pipeline Project, OneSteel’s Project Magnet at Whyalla, the proposed SA Magnesium Project, the Olympic Dam Expansion Project and the proposed NSW SNI (Central Route) Interconnector Project;
negotiation of indigenous land use agreements (ILUAs) for development projects, including the Ceduna Keys Marina Development;
provision of native title advice and negotiation of native title compensation in relation to the Fisherman’s Bay Development; and
representing and successfully negotiating the protection of various clients mineral and energy rights and interests in native title consent determinations entered into with the relevant native title claim group.
These and related matters have involved intensive dealings with the following native title groups and their legal representatives:
Adnyamathanha People;
Antakirinja Matu-Yankunytjatjara;
Arabana People;
Barngarla;
7

Page 3
Dieri;
Far West Coast;
Kaurna Peoples;
Kokatha People;
Ngadjuri Nation;
Narungga Nation;
Wangkangurru/Yarluyandi;
Wilyakali; and
Yandruwandha/Yawarrawarrka.
Government Liaison and Project Facilitation
Julia’s extensive experience with major project work for clients in resources and native title matters gives her a critical edge. She has a thorough knowledge of the political and legal aspects of the project approval and negotiation process. Julia has a diverse and extensive network of contacts throughout government and industry which enables her to find optimal solutions for clients.
Organisations
International Nuclear Law Association
International Pacific Bar Association
Australasian Institute of Mining and Metallurgy
Australian Institute of Company Directors
Australian Institute of Energy
Australian Mining & Petroleum Law Association
Australian Petroleum Production & Exploration Association
Native Title Practitioners Panel
Petroleum Exploration Society of Australia
South Australian Chamber of Mines and Energy
Women in Resources SA
8

SPECIAL COUNCIL MEETING
CORPORATE AND COMMUNITY SERVICES
MANAGER, FINANCE REPORTS
26 MAY 2016
3.1 FINANCE – DEBATE AGENDA
3.1.1
2016/17 – 2025/26 LONG TERM FINANCIAL PLAN AND 2016/17 ANNUAL BUDGET
AND BUSINESS PLAN
B345
INTRODUCTION
Further to the recent Budget/Rating Workshops, the attached draft Annual
Budget and Business Plan 2016/17 incorporating the Long Term Financial Plan
2016/17 to 2025/26 has been prepared for public consultation.
RECOMMENDATION
That Council endorse:
(1) The draft Annual Budget and Business Plan 2016/17 incorporating the
annual review of the draft Long Term Financial Plan for the period
2016/17 to 2025/26 for the purpose of community consultation and
authorise the Chief Executive Officer to make minor changes to the
document, in consultation with the Mayor prior to its release.
(2) The consultation period being from 1 June 2016 to 22 June 2016 and that
an allowance of one hour be made at the Council Meeting 21 June
2016 for verbal submissions in response to public consultation.
COMMENT
The Annual Budget and Business Plan (AB&BP) 2016/17 incorporates the Long
Term Financial Plan (LTFP) 2016/17 to 2025/26 in the one document but under
separate sections. The financial information has been prepared in
accordance with the Council Budget and Rating workshops held in the last few
months. All strategic parameters and indexation as discussed have been used
in the calculation of the financial reports and statements.
The draft budget incorporates the base budget, corporate and other new
initiatives as discussed and presented at the Council workshop held on 17 May
2016 along with items discussed for inclusion and or removal as follows:
Capital budget items:
Added – ACBA - Moculta Road Foot Bridge $20k (funded from general bridge
allocation), Lyndoch Council/Library Meeting Room Refurbishment $32k,
Nuriootpa Centennial Park Authority (NCPA) - Funding for being oval
improvement, community pavilion upgrades and soccer pitch fencing $150k,
Talunga Park - Playground Fencing $15k, Air Conditioning Installation at Barossa
Regional Gallery $140k (funded from general building allocation budget), Verti-
9

Drainer & Belt Spreader - Oval Maintenance $90k, Curdnatta Park - Kitchen
Upgrade $28k, Stockwell oval – re-establish second oval $431k (grant/other
funding requirement $230k – project will not proceed without grant funding)
and Williamstown Cemetery Fencing $10k.
Operating budget items: (Unless otherwise shown all are one-off entries for
16/17) as follows:
Added –Mt Pleasant Hall - Ramp for Disabled access $8k, Volunteer
Coordinator – Internal $70k*, World Heritage Bid $15k, Community Plan Service
Review $110k, ACBA - Salters Gully Master Plan $10k, ACBA – Signage $20k,
Oval Maintenance staff resource $65k*, Mt Pleasant Hall 4 items -- Island Bench
to Kitchen $3k, Kitchen Bench Space $2k, Commercial Fridge $3k, - History
Room Display Cases $5k and Williamstown Cemetery History Project $10k.
* The Volunteer Coordinator is a three year program and the Oval
Maintenance staff resource is an ongoing expense.
Redefining Community Committees - Reserve Funds have been used to fund
various NI requests taken from Councils 16-17 general allocation of $100k.
Other items were further assessed and then reduced/removed by the
Corporate Management Team as follows:
Capital – Footpaths increased expenditure of $282k, Stockwell Foot Bridge $50k
(funded from general bridge allocation), Warren Reservoir – continuation of old
Bridge upgrade $70k.
Operating – a further comprehensive review was undertaken to the base
budget with an increase to selected budget lines along with a reduction to
various other income and expenditure lines, finding overall savings of
approximately $269k. A review of depreciation calculations resulted in a
reduction for CWMS depreciation charge of $92k for the 16-17 budget year.
To ensure alignment to the long term financial plan requirements of a total
general rate revenue increase of 2.5% (plus growth, calculated as 30 April 2016
at 1.25%), as presented to Council at the workshop on 17 May 2016.
A delay has been made for the purchase of selected plant and equipment
expenditure in the selected years in the plan to remain in a net positive cash
position. A full analysis of life cycle costs on major plant and equipment will be
carried out with a view to reallocate the program over a longer life cycle and
thus generating overall budget savings.
The changes including the savings made will allow Council to deliver the
services and capital expenditure program without additional borrowings and
has positioned the operating budget for a surplus. The surplus in 2016-17 is
mainly as a result of the extra RTR funding of $757k.
The changes to the base budget and its impacts on the long term financial
plan, subject to working within the current estimates, will return a operating
budget surplus and returns future years discretionary funds, an estimated
reduction in general rate increases from 2.5% in 2016/17 increasing to 3% in
10
2017/18 scaling back to 2.5% for the remainder of the plan, whilst meeting long
term asset plans and service levels as they currently stand as set by Council.
Other operating income and expenditure indexation for future years in the LTFP
has been maintained at low levels to reflect the expected cost of services.
The LTFP is incorporated with the AB&BP process to ensure the two Plans align,
as the AB&BP represents the first year in the LTFP. Preparing the two Plans
concurrently enables the community to be involved in the short and long term
planning of Council’s Budget.
The public consultation period will commence from 1 June 2016 and closes on
22 June 2016. Verbal submissions will be considered at the Council meeting on
21 June 2016. Public submissions will be considered by Council at a special
meeting to be held following the consultation period.
The adoption of the Budget is due to be held in the last week in June (date to
be confirmed).
Attachment
Attachment 1: Annual Budget and Business Plan 2016-17
LEGISLATION/POLICY/COUNCIL STRATEGIC PLAN
Legislation
Local Government Act
Local Government (Financial Management) Regulations 2011 - Reg 9(1)(b)
Policy
Annual Budget/Business Plan Policy
Council Strategic Plan
4.1 – Responsibility
FINANCIAL, RESOURCE AND RISK MANAGEMENT CONSIDERATIONS
Financial
The adoption of the Budget is required between 1 June and 31 August 2016. In
order to meet this time line, the Budget process, including the adoption of the
draft document for public consultation purposes, is required to be underway in
May.
COMMUNITY CONSULTATION
Detailed in the body of the Report.
11

Annual Budget and Business Plan 2016-17 | The Barossa Council | Page 1 of 45
The Barossa Council Annual Budget and Business Plan
For Consultation 2016-17
Incorporating the annual review of the
Long Term Financial Plan - 2016-17 to 2025-26
12

Annual Budget and Business Plan 2016-17 | The Barossa Council | Page 2 of 45
Version Control: Version Status Date Version 1.0 Draft for Council adoption for Public Consultation 26 May 2016
Questions? Members of the community who have questions regarding the Annual Budget and Business Plan, or who seek further information regarding the finances of Council, are encouraged to contact Council office during business hours, via the website, or via email.
Principal Office and Library:
Phone: 08 8563 8444 43-51 Tanunda Road,
Nuriootpa Website: www.barossa.sa.gov.au
Email: [email protected]
All photographs by permission of the South Australian Tourism Commission. All rights reserved.
13

Annual Budget and Business Plan 2016-17 | The Barossa Council | Page 3 of 45
Contents From the Mayor 4
Our Council 5
Overview 8
Annual Business Plan
Strategic Directions 9
Joint Ventures and Associated Entities
13
Service Provision for 2016-17 14
Operating Investment in Support of Service Provision for 2016-17
15
Capital Investment in Support of Service Provision for 2016-17
16
Funding Our Activities
22
Implications for Our Rates
23
Measuring Our Performance
27
Non-Financial measures
29
Annual Budget
Budgeted Financial Statements 2016-17 30
Long Term Financial Plan 2016-17 to 2025-26
Introduction and Assumptions Financial Sustainability Appendix: A1 - Key Performance Indicators and Financial Parameters A2 - Long Term Plan Financial Statements 2016-17 to 2025-26 A3 - Capital Expenditure
36
38
40
41
45
14

Annual Budget and Business Plan 2016-17 | The Barossa Council | Page 4 of 45
From the Mayor After extensive budget discussions in conjunction with Elected Members and Council Officers, Council is pleased to present its Annual Budget and Business Plan 2016-17. There remain multiple challenges within the budget environment including growing cost of services and reduced levels of support from State and Federal Governments. Council believes we have again produced a balanced budget which increases rates in accordance with the Long Term Financial Plan as we strive to maintain our current levels of service across many areas, whilst also commencing further investment into core services. The 2016-17 financial year will reap benefits from a period of budget consolidation and investment in core services through the approval of many new initiatives. Significant changes and highlights in this year's budget include: � Addressing the growing costs of delivering services
including staffing, utilities, insurance, materials and legislative compliance.
� Investment in key infrastructure and services: � In addition to $600k for accelerated footpath
funding in 2015-16 a further $282k will be provided for in 2016-17;
� Second and final year of additional Commonwealth Roads to Recovery payments of $757k in 2016-17 will be allocated to upgrading various roads to sealed standard;
� Continuation of oval and recreational park upgrades and long term maintenance support;
� Additional investment in community facilities at the Nuriootpa Centennial Park of $150k;
� $1.54m for resealing of the existing sealed road network;
� $1.37m for resheeting of the existing rural road network;
� $165k for Regional Gallery improvements supported by community and committee contributions;
� $100k for playground replacement and upgrades;
� $32k for upgrades to the community meeting room in Lyndoch;
� $433k to address stormwater priority issues in Tanunda, Mt Pleasant and Springton;
� $100k to address footbridge and safety issues at Stockwell and Angaston.
Funding for existing services remains in accordance with adopted plans in addition to some new service spending in the following areas: � Extension to funding for a further year for the World
Agrarian Landscape Heritage Bid. � New funding for three years of approximately $71k
per annum to improve our volunteer management and support.
The draft Annual Budget and Business Plan incorporating the annual review of the Long Term Financial Plan is available on Council's website, libraries and at the front desk of the Nuriootpa office. On behalf of the Elected Members of The Barossa Council, I am pleased to endorse this plan to the Community for comment.
Mayor Bob Sloane
15

Annual Budget and Business Plan 2016-17 | The Barossa Council | Page 5 of 45
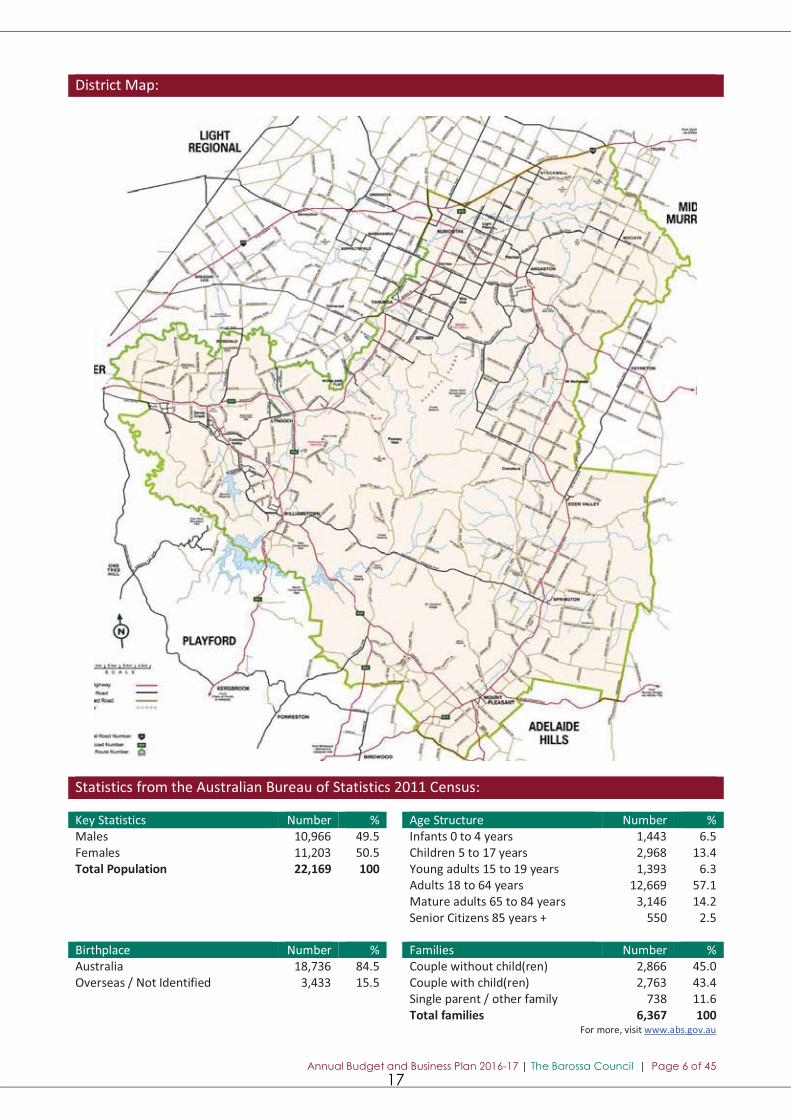
Our Council The Barossa Council was originally formed in 1996 after the amalgamation of the District Councils of Barossa, Tanunda and Angaston. The majority of the District Council of Mount Pleasant was later amalgamated in 1997. The Council covers an area of approximately 894 square kilometres, is located approximately 80 kilometres north east of Adelaide, adjacent to the town of Gawler, and is home to a population of over 24,000. Prior to European settlement, the Barossa region was inhabited by the Peramangk and Ngadjuri people. Colonel William Light first visited the area in 1837, naming the Barossa Range from which the region derives its name. The settlement of the Barossa region began in 1840, with Lutheran settlers originating from the British Isles, Prussia and Silesia to escape the religious persecution, through the sponsorship of George Fife Angas and aid of Pastor August Kavel. These settlers quickly established the early townships of the region, such as Lyndoch, Rowland Flat, Tanunda, Nuriootpa, Angaston, Stockwell, Eden Valley, Mt Pleasant, Williamstown and Springton. Early farmers of the Barossa established vineyards in the 1840s and 1850s to supplement their primary activities of wool and livestock production and crop farming. In the late 1880s and 1890s there were substantial increases in the production of wine in the region which resulted in the establishment and subsequent expansion of a number of cellars. The driving forces behind this growth were the outbreak of phylloxera in other States and the development of an export market that provided some protection from the recession experienced in the rest of Australia during that time. The wine industry has continued to grow from these early beginnings and is the major source of income for the region. The cultural landscape of the present day Barossa is reflective of the substantial influence of the early British and German settlers. Vineyards and paddocks dominate the landscape but historical towns, churches, wineries and stone ruins contribute substantially to the charm and character. The natural vegetation of the Barossa has been retained in many areas and underpins the visual appearance and biological diversity of the area.
The Barossa is recognised as Australia's premier wine region. The wine experience, combined with the region's distinctive history, has made it a significant tourist attraction. The establishment of major festivals and high quality accommodation and restaurants has complemented these attractions. The Barossa experience is a diverse one. In addition to our premier wine and food attractions there are unique nature trails, parks and historical points of interest. The rich pastoral lands of the historic towns of Mount Pleasant and Williamstown produce fine wool, dairy products and prime lamb and beef. Forestry is also a major industry, and together with three reservoirs and national parks, provides recreational opportunities. The tourism industry continues to grow and has become a major focus for the continued development of the region.
Principal Office and Library:
43-51 Tanunda Road, Nuriootpa Postal Address:
PO Box 867, Nuriootpa SA 5355 Branch Office/Libraries:
29 Barossa Valley Way, Lyndoch 130-132 Melrose Street, Mount Pleasant
Washington Street, Angaston Library only 66-68 Murray Street, Tanunda Website: www.barossa.sa.gov.au Email: [email protected]
Localities in The Barossa Council: Altona, Angaston, Barossa Goldfields, Bethany, Cockatoo Valley, Concordia, Craneford, Cromer, Dorrien, Eden Valley, Flaxman Valley, Kalbeeba, Krondorf, Light Pass, Lyndoch, Moculta, Mount Crawford, Mount McKenzie, Mount Pleasant, Nuriootpa, Penrice, Pewsey Vale, Rosedale, Rowland Flat, Sandy Creek, Springton, Stockwell, Tanunda, Taunton, Vine Vale, Williamstown and Wilton. Major Industries: Wine making, grapes, grain and spirit distillation; tourism; beef, wool and fat lamb production; cement manufacturing, dried fruit processing and packaging; forestry; water storage; mineral extraction industries; plastic injection moulding and plant manufacturing.
Distance of Principal Office from Adelaide CBD
80km
Area of Council 893.5km2
Number of Rateable Assessments 12478 Number of Non Rateable Assessments 527
16
Annual Budget and Business Plan 2016-17 | The Barossa Council | Page 6 of 45
District Map: Major Industries:
Statistics from the Australian Bureau of Statistics 2011 Census: Key Statistics Number % Age Structure Number % Males 10,966 49.5 Infants 0 to 4 years 1,443 6.5 Females 11,203 50.5 Children 5 to 17 years 2,968 13.4 Total Population 22,169 100 Young adults 15 to 19 years 1,393 6.3 Adults 18 to 64 years 12,669 57.1 Mature adults 65 to 84 years 3,146 14.2 Senior Citizens 85 years + 550 2.5 Birthplace Number % Families Number % Australia 18,736 84.5 Couple without child(ren) 2,866 45.0 Overseas / Not Identified 3,433 15.5 Couple with child(ren) 2,763 43.4 Single parent / other family 738 11.6 Total families 6,367 100
For more, visit www.abs.gov.au
17

Annual Budget and Business Plan 2016-17 | The Barossa Council | Page 7 of 45
Cor
pora
te a
nd C
omm
unity
Se
rvic
es
Cou
ncil
Ma
yor a
nd E
lect
ed M
emb
ers
Dev
elop
men
t and
Envi
ronm
enta
l Se
rvic
esW
orks
and
Eng
inee
ring
Serv
ices
Dire
ctor
Exec
utiv
e Se
rvic
esC
hief
Exe
cutiv
e O
ffice
r
Com
mitt
ee S
truc
ture
Inde
pend
ent A
udit
Com
mitt
ee
Fina
ncia
l Se
rvic
es
Tour
ism a
nd
Visi
tor
Info
rmat
ion
Serv
ices
Know
ledg
e M
anag
emen
t
Com
mun
ity
Dev
elop
men
t an
d Fa
cilit
ies
Man
agem
ent
Libr
ary,
C
usto
mer
an
d He
ritag
e
Soci
al a
nd
Cul
tura
l Se
rvic
es
Plan
ning
Se
rvic
es
Build
ing
and
Heal
th
Serv
ices
Nat
ural
Re
sour
ces
Prog
ram
s
Com
mun
ity
Safe
ty
Serv
ices
Ass
et
Man
agem
ent
Engi
neer
ing
Serv
ices
Ope
ratio
nal
Serv
ices
Org
anisa
tiona
l D
evel
opm
ent a
nd R
isk
Stra
tegi
c Pr
ojec
ts
Publ
ic C
omm
unic
atio
ns
and
Com
mun
ity
Enga
gem
ent
Elec
ted
Mem
ber
Supp
ort
Org
anis
atio
nal S
truc
ture
:
18
Annual Budget and Business Plan 2016-17 | The Barossa Council | Page 8 of 45
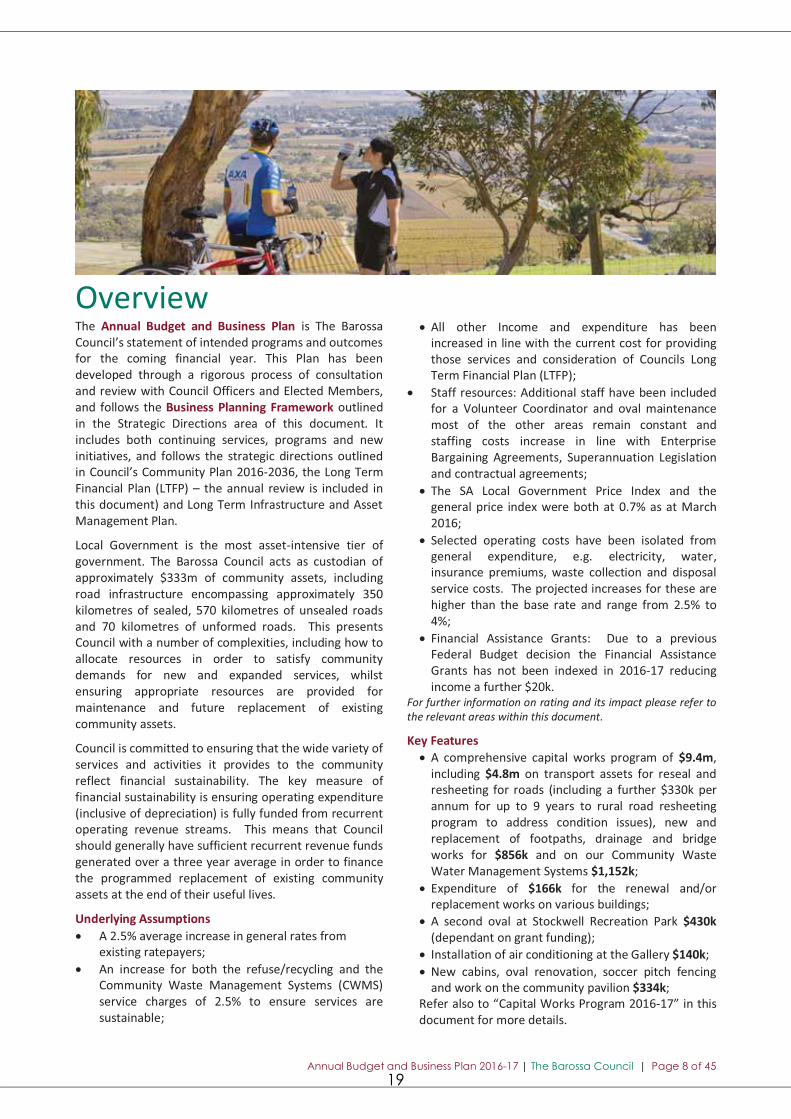
Overview The Annual Budget and Business Plan is The Barossa Council’s statement of intended programs and outcomes for the coming financial year. This Plan has been developed through a rigorous process of consultation and review with Council Officers and Elected Members, and follows the Business Planning Framework outlined in the Strategic Directions area of this document. It includes both continuing services, programs and new initiatives, and follows the strategic directions outlined in Council’s Community Plan 2016-2036, the Long Term Financial Plan (LTFP) – the annual review is included in this document) and Long Term Infrastructure and Asset Management Plan.
Local Government is the most asset-intensive tier of government. The Barossa Council acts as custodian of approximately $333m of community assets, including road infrastructure encompassing approximately 350 kilometres of sealed, 570 kilometres of unsealed roads and 70 kilometres of unformed roads. This presents Council with a number of complexities, including how to allocate resources in order to satisfy community demands for new and expanded services, whilst ensuring appropriate resources are provided for maintenance and future replacement of existing community assets.
Council is committed to ensuring that the wide variety of services and activities it provides to the community reflect financial sustainability. The key measure of financial sustainability is ensuring operating expenditure (inclusive of depreciation) is fully funded from recurrent operating revenue streams. This means that Council should generally have sufficient recurrent revenue funds generated over a three year average in order to finance the programmed replacement of existing community assets at the end of their useful lives.
Underlying Assumptions � A 2.5% average increase in general rates from
existing ratepayers; � An increase for both the refuse/recycling and the
Community Waste Management Systems (CWMS) service charges of 2.5% to ensure services are sustainable;
� All other Income and expenditure has been increased in line with the current cost for providing those services and consideration of Councils Long Term Financial Plan (LTFP);
� Staff resources: Additional staff have been included for a Volunteer Coordinator and oval maintenance most of the other areas remain constant and staffing costs increase in line with Enterprise Bargaining Agreements, Superannuation Legislation and contractual agreements;
� The SA Local Government Price Index and the general price index were both at 0.7% as at March 2016;
� Selected operating costs have been isolated from general expenditure, e.g. electricity, water, insurance premiums, waste collection and disposal service costs. The projected increases for these are higher than the base rate and range from 2.5% to 4%;
� Financial Assistance Grants: Due to a previous Federal Budget decision the Financial Assistance Grants has not been indexed in 2016-17 reducing income a further $20k.
For further information on rating and its impact please refer to the relevant areas within this document.
Key Features � A comprehensive capital works program of $9.4m,
including $4.8m on transport assets for reseal and resheeting for roads (including a further $330k per annum for up to 9 years to rural road resheeting program to address condition issues), new and replacement of footpaths, drainage and bridge works for $856k and on our Community Waste Water Management Systems $1,152k;
� Expenditure of $166k for the renewal and/or replacement works on various buildings;
� A second oval at Stockwell Recreation Park $430k (dependant on grant funding);
� Installation of air conditioning at the Gallery $140k; � New cabins, oval renovation, soccer pitch fencing
and work on the community pavilion $334k; Refer also to “Capital Works Program 2016-17” in this document for more details.
19
Annual Budget and Business Plan 2016-17 | The Barossa Council | Page 9 of 45
Annual Business Plan
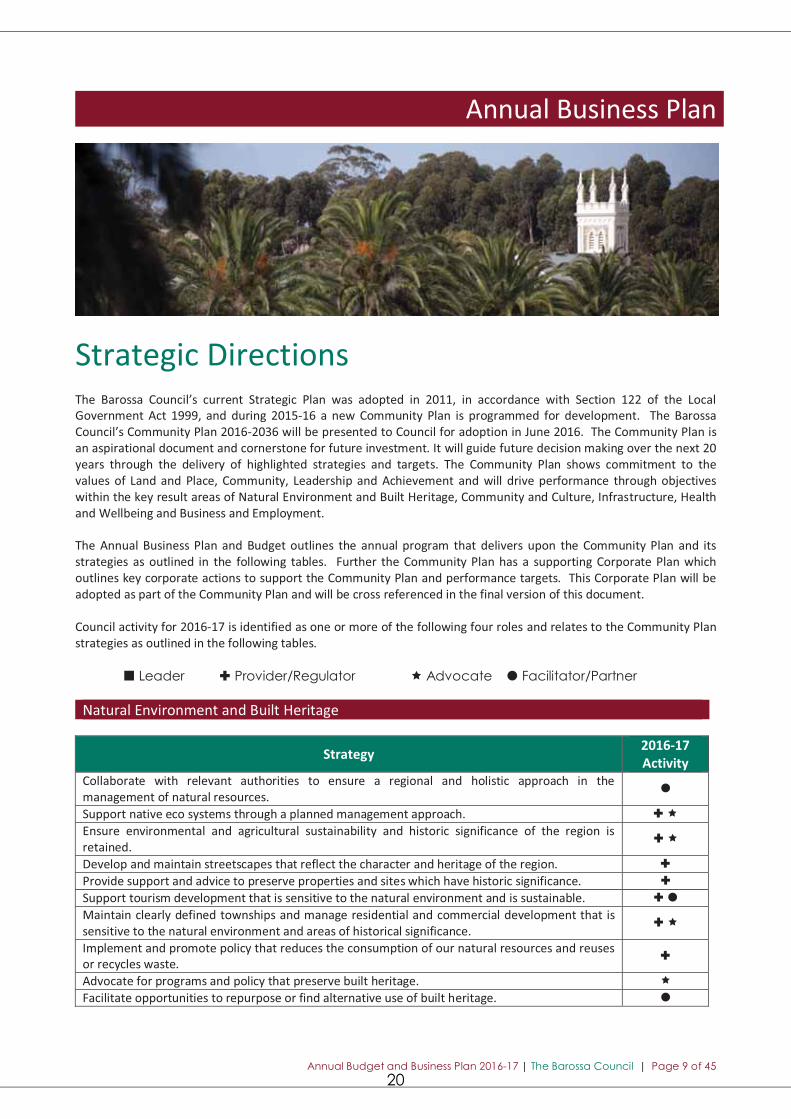
Strategic Directions The Barossa Council’s current Strategic Plan was adopted in 2011, in accordance with Section 122 of the Local Government Act 1999, and during 2015-16 a new Community Plan is programmed for development. The Barossa Council’s Community Plan 2016-2036 will be presented to Council for adoption in June 2016. The Community Plan is an aspirational document and cornerstone for future investment. It will guide future decision making over the next 20 years through the delivery of highlighted strategies and targets. The Community Plan shows commitment to the values of Land and Place, Community, Leadership and Achievement and will drive performance through objectives within the key result areas of Natural Environment and Built Heritage, Community and Culture, Infrastructure, Health and Wellbeing and Business and Employment. The Annual Business Plan and Budget outlines the annual program that delivers upon the Community Plan and its strategies as outlined in the following tables. Further the Community Plan has a supporting Corporate Plan which outlines key corporate actions to support the Community Plan and performance targets. This Corporate Plan will be adopted as part of the Community Plan and will be cross referenced in the final version of this document. Council activity for 2016-17 is identified as one or more of the following four roles and relates to the Community Plan strategies as outlined in the following tables.
� Leader � Provider/Regulator � Advocate � Facilitator/Partner
Natural Environment and Built Heritage
Strategy 2016-17 Activity
Collaborate with relevant authorities to ensure a regional and holistic approach in the management of natural resources.
�
Support native eco systems through a planned management approach. � � Ensure environmental and agricultural sustainability and historic significance of the region is retained.
� �
Develop and maintain streetscapes that reflect the character and heritage of the region. � Provide support and advice to preserve properties and sites which have historic significance. � Support tourism development that is sensitive to the natural environment and is sustainable. � � Maintain clearly defined townships and manage residential and commercial development that is sensitive to the natural environment and areas of historical significance.
� �
Implement and promote policy that reduces the consumption of our natural resources and reuses or recycles waste.
�
Advocate for programs and policy that preserve built heritage. � Facilitate opportunities to repurpose or find alternative use of built heritage. �
20

Annual Budget and Business Plan 2016-17 | The Barossa Council | Page 10 of 45
Community and Culture
Strategy 2016-17 Activity
Initiate and support activities which encourage participation and pride in the Barossa Council area. � � � � Support the development of activities that celebrate the history and culture of the Barossa and its people.
� �
Contribute to creating strong and sustainable community networks. � Encourage and support volunteering in the community. � � Engage with, and support, young people to actively participate in the community and develop the leaders of the future.
�
Support a vibrant and growing arts, cultural, heritage and events sector. � � Embrace place-making principles when developing community infrastructure and regulate planning and development in public spaces.
� �
Provide opportunities for the community to participate in local decision-making. � � Create places where people want to live and plan for the future in a coordinated, appropriate and proactive manner.
� �
Promote our Aboriginal heritage and ongoing connections to the region. � Encourage a learning community. � � Contribute to a safer community. � �
Infrastructure
Strategy 2016-17 Activity
Develop and implement sound asset management which delivers sustainable services. � Collaborate with private and public utilities providers to ensure infrastructure is adequate to support the community both now and into the future.
� �
Advocate for telecommunication infrastructure to meet personal and commercial needs of residents and businesses.
� �
Participate in networks to improve efficient asset management and maintenance. � Advocate for and seek out funding opportunities that support the development of community, health and other facilities and infrastructure from both State and Federal Government.
�
Invest in, and advocate for, community facilities that support cultural and community participation.
� � �
Ensure infrastructure meets the needs of people with disabilities and provides for all abilities access.
� �
Support opportunities to increase community transport and access to services and facilities. � �
Health and Wellbeing
Strategy 2016-17 Activity
Advocate to State and Federal health bodies, for sustained access to allied and primary health care services and facilities.
� �
Create opportunities for people of all ages and abilities to participate in the community. � � Work with emergency services to prepare for disaster management and recovery. � � Support sporting, recreational and community clubs and organisations to grow and be sustainable.
� �
Advocate for and encourage services and resources that ensure equity and support for disadvantaged, disabled and at risk members of the community.
� � �
Ensure that community members can participate in cultural, recreational, sporting and learning opportunities.
� � �
Ensure food safety, hygiene and appropriate waste management standards are maintained. � Promote a healthy community through a planned approach to public health. � � Design our future developments and facilities to support active lifestyles and community health and wellbeing.
� �
21
Annual Budget and Business Plan 2016-17 | The Barossa Council | Page 11 of 45
Business and Employment
Strategy 2016-17 Activity
Work closely with State Government, Federal Government and stakeholders to support economic growth and development.
� � �
Support industry accreditation and reward programs. � Help build the capacity of the tourism sector and encourage the development of tourist services and infrastructure.
� �
Attract investment for new and innovative industries, such as creative industries and cultural tourism.
�
Support education and training programs that directly respond to work-force gaps and innovation. � Participate in main-street programs that strengthen the retail and hospitality sector. � Collaborate with industry leaders to ensure informed decision making and Council representation in relation to economic growth, planning and development.
�
Ensure advice and support for small business is available. � � Advocate for transport infrastructure and services that support local industry. � Drive support of economic development through a coordinated local economic development strategy and enabling land use policy.
� �
Facilitate business growth by supporting local industry and their capacity to compete for Government contracts.
� �
Plan for, identify and protect land for business opportunities. � �
Support economic development through events. � �
22
Annual Budget and Business Plan 2016-17 | The Barossa Council | Page 12 of 45
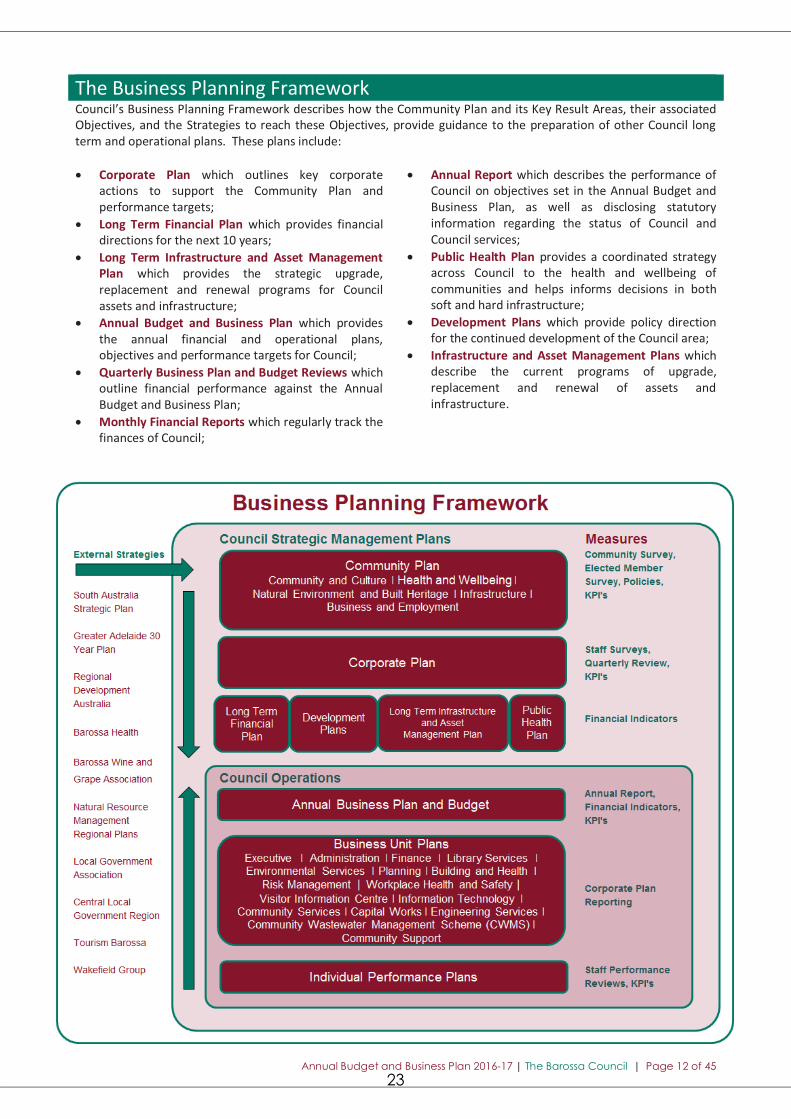
The Business Planning Framework Council’s Business Planning Framework describes how the Community Plan and its Key Result Areas, their associated Objectives, and the Strategies to reach these Objectives, provide guidance to the preparation of other Council long term and operational plans. These plans include: � Corporate Plan which outlines key corporate
actions to support the Community Plan and performance targets;
� Long Term Financial Plan which provides financial directions for the next 10 years;
� Long Term Infrastructure and Asset Management Plan which provides the strategic upgrade, replacement and renewal programs for Council assets and infrastructure;
� Annual Budget and Business Plan which provides the annual financial and operational plans, objectives and performance targets for Council;
� Quarterly Business Plan and Budget Reviews which outline financial performance against the Annual Budget and Business Plan;
� Monthly Financial Reports which regularly track the finances of Council;
� Annual Report which describes the performance of Council on objectives set in the Annual Budget and Business Plan, as well as disclosing statutory information regarding the status of Council and Council services;
� Public Health Plan provides a coordinated strategy across Council to the health and wellbeing of communities and helps informs decisions in both soft and hard infrastructure;
� Development Plans which provide policy direction for the continued development of the Council area;
� Infrastructure and Asset Management Plans which describe the current programs of upgrade, replacement and renewal of assets and infrastructure.
23

Annual Budget and Business Plan 2016-17 | The Barossa Council | Page 13 of 45
Joint Ventures and Associated Entities Nuriootpa Centennial Park Authority Established as a subsidiary of Council pursuant to Section 42 of the Local Government Act 1999, the Nuriootpa Centennial Park Authority (NCPA) manages and maintains the Nuriootpa Caravan Park and adjacent sporting and leisure facilities on behalf of Council.
To this end, and in accordance with the Authority’s Charter, operating surpluses of the Caravan Park activities are utilised to maintain the Nuriootpa Recreation Park facilities (including tennis courts, 3 ovals and associated buildings and infrastructure), as well as the picturesque Coulthard Reserve located adjacent to the Caravan Park. Operating surpluses from the Caravan Park activities are also utilised to provide important funding for the programmed upgrade and replacement of the facility assets managed by the Authority.
The 2 ovals, a soccer pitch and eight tennis courts are extensively used by local sporting clubs. The four-star rated Caravan Park facilities include on-site cabins and
Central Local Government Association Established in 1998, this organisation is formed under Section 43 of the Local Government Act 1999 and operates as a regional subsidiary of councils included in the membership. An amount of $10,379 is included for the subscription. Gawler River Floodplain Management Authority Established in 2002, this organisation is responsible for the construction, operation and maintenance of flood mitigation infrastructure in the Gawler River catchment. An amount of $11,296 is included for the operational & maintenance subscription. Council has a share in the Net Assets $1,638,938 as at 30 June 2015. An adjustment for the movement from last year’s balance is not as yet reflected in the Financial Statements in this document.
vans, a camp kitchen, and various other standard amenities.
The projected 2016-17 Income Statement for the Authority is included within Council’s financial statements, contained within this document. The Authority’s ten year business case is under review, to be finalised during the budget consultation period.
24

Annual Budget and Business Plan 2016-17 | The Barossa Council | Page 14 of 45
Service Provision for 2016-17 The following outlines the proposed service provision provided by The Barossa Council for 2016-17: Executive Services Australia Day Awards, Business Excellence and Organisational Development, Citizenship Ceremonies, Economic Development, Executive Support and Management, Advocacy, Governance, Human Resources, Media Communications, Public Engagement and Consultation, Risk Management, Strategic Projects, Work Health and Safety, Elected Member Support, Grant Writing, Organisational Performance Reporting. Development and Environmental Services Building Assessment, Licensing, Development Control, Dog and Cat Management, Safer Communities, Public Health, Fire Prevention and Safety, Safe Food Practices, Heritage Advice, Immunisation, Natural Resource Management, Parking and Traffic Controls, Strategic Land Use and Development Planning, Waste Management, Advocacy. Corporate and Community Services Corporate Services Community Committees Support, Community Land Leasing and Licencing Management, Strategic and Operational Financial Management, Rating Services, Internal Financial Control, Taxation Management, Payroll, Creditor and Debtor Management, General Administration, Advocacy, Governance, Knowledge Management and Technology, Strategic and Operational Management of Community Buildings and Recreational Facilities (excluding ovals), Tourism and Visitor Information Services, Community Development. Community Services Customer Service, Arts and Culture Programs, Volunteer Support, Community Development, Community Program Support, Community Transport, Home and Community Care, Barossa Leisure Options, Advocacy, Library and Heritage Services, Youth Services, Facilities (Buildings) Management, Event Support. Works and Engineering Services Building Asset Construction and Maintenance, Bridge Construction and Maintenance, Cemetery Management, Unmade Public Road Management, Road Closure Management and Approvals, Community Wastewater Management System Construction, Operation and Maintenance, Treated Water Reuse Distribution System Construction, Operation and Maintenance, Open Space Construction, Operation and Maintenance, Footpath and Bike Path Construction and Maintenance, Infrastructure Planning and Development, Asset Management, Advocacy, Recreational Oval Management, Public Lighting, Public Conveniences, Road Design, Construction and Maintenance, Traffic Planning and Management, Road Safety Control, Event Support, Roadside Vegetation Management and Control, Tree Management, Stormwater Drainage and Construction, Engineering Development Assessment.
25

Annual Budget and Business Plan 2016-17 | The Barossa Council | Page 15 of 45
Administration26.1%
Business Undertakings11.2%
Community Amenities2.6%
Community Support4.6%Cultural Services
2.0%Economic Development
2.6%
Environment8.0%
Health Services0.9%
Library Services2.9%
Public Order and Safety0.3%
Recreation12.6%
Regulatory Services5.5%
Transport15.5%
Waste Management5.2%
Quarter 3 Revised Budget 2015-16 Forecast to 31 March 2016 Operating Expenditure ($M)
34.8
Administration25.6%
Business Undertakings11.5%
Community Amenities2.8%
Community Support4.5%Cultural Services
2.3%Economic Development
2.5%
Environment7.3%
Health Services0.8%
Library Services2.8%
Public Order and Safety0.6%
Recreation13.5%
Regulatory Services5.4%
Transport15.3%
Waste Management5.1%
2016-17 Budget Proposed Operating Expenditure ($M)
35.5
Operating Expenditure in Support Of Service Provision for 2016-17 The following graphs show operating expenditure proposed for the 2016-17 year and for the third Budget Update 2015-16 by the following functions in support of the provision of the services outlined: (Full Cost Attribution has not yet been applied to this version. This is an allocation of internal services to external services and does not affect the overall net result. It will be included in the final version of this plan for adoption after Public Consultation.) Functions Administration, Business Undertakings, Community Amenities, Community Support, Cultural Services, Economic Development, Environment, Health Services, Library Services, Public Order and Safety, Recreation, Regulatory Services, Transport, Waste Management.
26

Annual Budget and Business Plan 2016-17 | The Barossa Council | Page 16 of 45
Divisions:Executive Services ESDevelopment and Environmental Services DESCorporate and Community Services CCSWorks and Engineering WES
Project Description Dept Original Budget $'000
Building Assets 136 Lyndoch Library Meeting Room Refurbishment CCS 32 Nuriootpa Office Air-conditioning WES 35 Building Renewal and Replacement WES 69
Transport 3,387 Renewal and Replacement of Existing Footpaths WES 430 Road Resealing Works (refer Anticipated Road Resealing Program) WES 1,137 Carrara Hill Intersection Resealing Works (part Roads to Recovery (R2R) funded) WES 399 Road Resheeting Works (refer Anticipated Road Resheeting Program) WES 1,371 Road Shoulder works WES 50
Bridges, Floodways and Major Culverts 253 Bridge Renewal Work WES 253
Community Wastewater Management Systems (CWMS) 209 Vehicle Replacements WES 77 Operation Emergency IP and Manhole Repairs/Replacement WES 60 Nuriootpa Waste Water Treatment Plant - Replacement Pump/Generator WES 72
Recreation Assets 30 Playground Equipment Renewal WES 30
Plant and Equipment 1,188 Plant, Machinery and Vehicles WES 755 Office Vehicles WES 366 Community Transport Vehicles CCS 27 Minor Plant WES 40
Library 78 Materials - Books - Public Library Scheme CCS 66 Materials - Books - Local Purchase CCS 12
Total Asset Renewal and Replacement Budget 5,281
Capital Works Program 2016-17
Expenditure
Renewal and Replacement Programs
(Excluding Nuriootpa Centennial Park Authority)
Capital Investment in Support of Service Provision for 2016-17
27
Annual Budget and Business Plan 2016-17 | The Barossa Council | Page 17 of 45
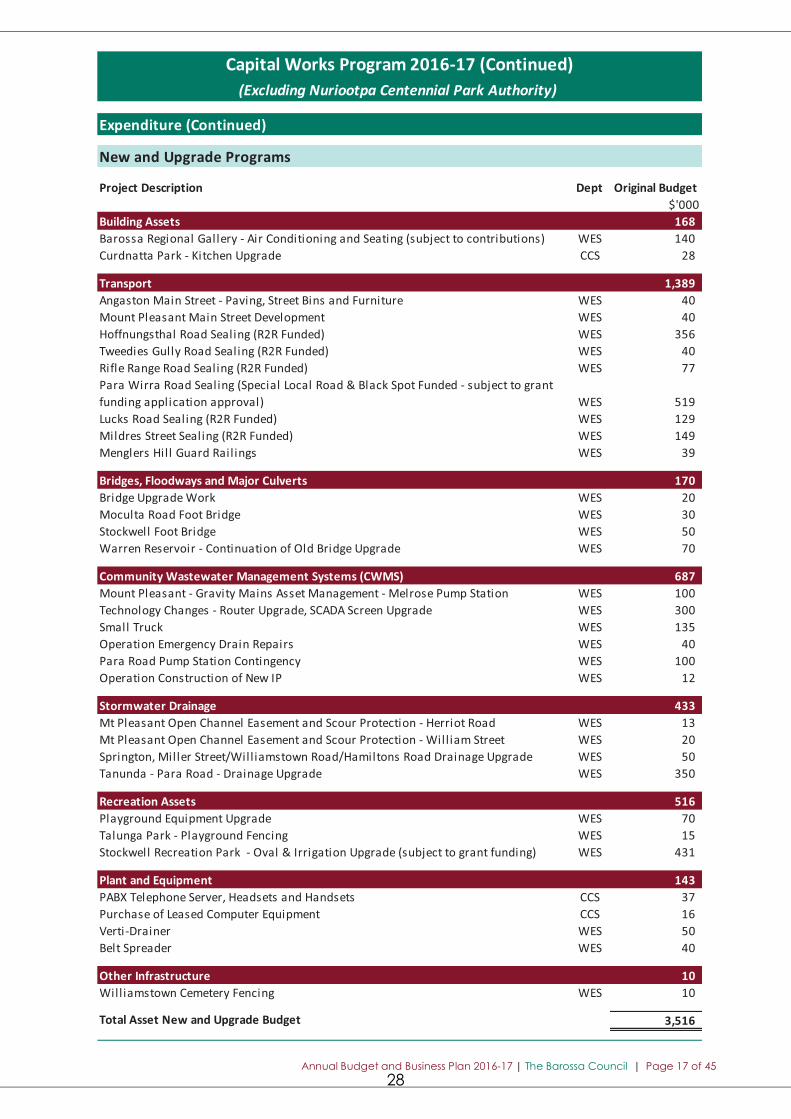
Project Description Dept Original Budget $'000
Building Assets 168 Barossa Regional Gallery - Air Conditioning and Seating (subject to contributions) WES 140 Curdnatta Park - Kitchen Upgrade CCS 28
Transport 1,389 Angaston Main Street - Paving, Street Bins and Furniture WES 40 Mount Pleasant Main Street Development WES 40 Hoffnungsthal Road Sealing (R2R Funded) WES 356 Tweedies Gully Road Sealing (R2R Funded) WES 40 Rifle Range Road Sealing (R2R Funded) WES 77 Para Wirra Road Sealing (Special Local Road & Black Spot Funded - subject to grant funding application approval) WES 519 Lucks Road Sealing (R2R Funded) WES 129 Mildres Street Sealing (R2R Funded) WES 149 Menglers Hill Guard Railings WES 39
Bridges, Floodways and Major Culverts 170 Bridge Upgrade Work WES 20 Moculta Road Foot Bridge WES 30 Stockwell Foot Bridge WES 50 Warren Reservoir - Continuation of Old Bridge Upgrade WES 70
Community Wastewater Management Systems (CWMS) 687 Mount Pleasant - Gravity Mains Asset Management - Melrose Pump Station WES 100 Technology Changes - Router Upgrade, SCADA Screen Upgrade WES 300 Small Truck WES 135 Operation Emergency Drain Repairs WES 40 Para Road Pump Station Contingency WES 100 Operation Construction of New IP WES 12
Stormwater Drainage 433 Mt Pleasant Open Channel Easement and Scour Protection - Herriot Road WES 13 Mt Pleasant Open Channel Easement and Scour Protection - Will iam Street WES 20 Springton, Miller Street/Will iamstown Road/Hamiltons Road Drainage Upgrade WES 50 Tanunda - Para Road - Drainage Upgrade WES 350
Recreation Assets 516 Playground Equipment Upgrade WES 70 Talunga Park - Playground Fencing WES 15 Stockwell Recreation Park - Oval & Irrigation Upgrade (subject to grant funding) WES 431
Plant and Equipment 143 PABX Telephone Server, Headsets and Handsets CCS 37 Purchase of Leased Computer Equipment CCS 16 Verti-Drainer WES 50 Belt Spreader WES 40
Other Infrastructure 10 Williamstown Cemetery Fencing WES 10
Total Asset New and Upgrade Budget 3,516
Capital Works Program 2016-17 (Continued)
Expenditure (Continued)
New and Upgrade Programs
(Excluding Nuriootpa Centennial Park Authority)
28

Annual Budget and Business Plan 2016-17 | The Barossa Council | Page 18 of 45
Project Description Dept Original Budget $'000
Building Assets 2 Lyndoch Library Meeting Room Refurbishment CCS 2
Transport 334 Carrara Hill Intersection Resealing Works (part Roads to Recovery (R2R) funded) WES 334
Community Wastewater Management Systems (CWMS) 38 Vehicle Replacements - Proceeds on trade-in WES 38
Plant and Equipment 387 Plant, Machinery and Vehicles - Proceeds on trade-in WES 190 Office Vehicles - Proceeds on trade-in WES 183 Community Transport Vehicles - Proceeds on trade-in CCS 14
Library 66 Materials - Books - Public Library Scheme (Operating) CCS 66
Total Asset Renewal and Replacement Budget 827
Project Description Dept Original Budget $'000
Building Assets 70 Barossa Regional Gallery - Air Conditioning and Seating (subject to contributions) WES 70
Transport 1,196 Hoffnungsthal Road Sealing (R2R Funded) WES 356 Tweedies Gully Road Sealing (R2R Funded) WES 40 Rifle Range Road Sealing (R2R Funded) WES 77 Para Wirra Road Sealing (Special Local Road & Black Spot Funded - subject to grant funding application approval) WES 445 Lucks Road Sealing (R2R Funded) WES 129 Mildres Street Sealing (R2R Funded) WES 149
Recreation Assets 230 Stockwell Recreation Park - Oval & Irrigation Upgrade (subject to grant funding) WES 230
Total Asset New and Upgrade Budget 1,496
Renewal and Replacement Programs
Grants, Contributions and Asset Sales 2016-17(Excluding Nuriootpa Centennial Park Authority)
Grants, Contributions and Asset Sales
Grants, Contributions and Asset Sales
New and Upgrade Programs
29

Annual Budget and Business Plan 2016-17 | The Barossa Council | Page 19 of 45
Road District SectionHoffnungsthal Road Lyndoch Surface Change Sealed to Barossa Helicopters + 15mTweedies Gully Road Lyndoch Hoffnungsthal Road to Lavender Farm entranceRifle Range Road Krondorf Nicolai Road to Lily Farm RoadPara Wirra Road Williamstown Surface change to Humbug Scrub RoadLucks Road Kalbeeba Balmoral Road to Calton RoadMildres Street Springton Williamstown Road to Johannes Street
Road District SectionStockwell Road Stockwell Duck Ponds Road to Start of 80km zoneStockwell Road Stockwell Start of 80km zone to surface changeStockwell Road Stockwell Carrara Hill Road Intersection UpgradeVine Vale Road Vine Vale Light Pass Road from surface change to Stockwell Road Penrice Road Penrice Penrice Quarry Products IntersectionResearch Road Light Pass 270m South of surface change to Kalimna RoadSeppeltsfield Road Nuriootpa Barossa Valley Way to North Para Bridge Light Pass Road Vine Vale Magnolia Road IntersectionSt Hallett Road Tanunda Adjacent St Hallett's WineryMoculta Road Moculta Lindsay Park Road to 480m E of Lindsay ParkMoculta Road Moculta 480m E of Lindsay Pk Rd to 730m E of Lindsay Pk RdMoculta Road Moculta 730m E of Lindsay Pk Road to Truro RoadFilsell Road Lyndoch Jollytown Road to 470m from Frederick StreetFilsell Road Lyndoch 110m from Jollytown Road to Frederick StreetFilsell Road Lyndoch Frederick Street to Francis StreetSprington Road Williamstown Mount Crawford Road to segment limitSprington Road Williamstown Segment limit to Glen Gillian RoadSprington Road Williamstown Glen Gillian Road to Wilson RoadPara Road Tanunda Murray Street to Braunack AvenuePara Road Tanunda Braunack Avenue to Hoffmann AvenueHoffmann Avenue Tanunda Para Road to Doering StreetHeggies Range Road Flaxman Valley Tanunda Creek Road to Seven Steps RoadSeven Steps Road Flaxman Valley Seiboths Road to L.Pumpas RoadWilliam Street Springton Miller Street to Jutland Road
Remaining funds of $40,245 to be held as contingency
Capital Road Program 2016-17Disclaimer: The following road listings are yet to be confirmed and are only an indicative program - they aresubject to final approval of Council; alterations and additions to this list may occur.
Anticipated Sealed Road Upgrade Program for 2016-17
Anticipated Reseal Road Program for 2016-17
30

Annual Budget and Business Plan 2016-17 | The Barossa Council | Page 20 of 45
Road District SectionMugge Road Concordia Track SectionWinton Road Rosedale Dalgety Road to McCallum RoadDalgety Road Rosedale Dahlenburg Road to Winton RoadDahlenburg Road Rosedale Rosedale Road to Dalgety RoadBergen Road Concordia Concordia Road to HouseSpringbett Road Concordia Concordia Road to Kalbeeba RoadLucas Road Mount Pleasant Burns Road to EndMunro Road Mount Pleasant Ken Hicks Road to Randell Road Lamb Tail Corner Road Angaston Lindsay Park Road to Hutton Vale RoadLittle Kaiserstuhl Road Krondorf Rifle Range Road to EndBartsch Road Stockwell Jaegers Road to EndBartsch Road Stockwell Fallands Road to Jaegers RoadJaegers Road Stockwell Duckponds Road to Bartsch RoadLovers Lane Angaston Yalumba Terrace to Eden Valley RoadGolden Gate Mines Road Angaston Rocky Road to Karra Yerta RoadRocky Road Angaston Eden Valley Road to Golden Gate Mines RoadStone Chimney Creek Road Flaxman Valley Tanunda Creek Road to Flaxmans Valley RoadMaders Road Flaxman Valley Flaxmans Valley Road to Mirooloo RoadHilsenitz Road Flaxman Valley C Rogers Road to Seven Steps RoadW Pumpas Road Flaxman Valley Heggies Boundary Road to Eden Valley RoadBurkes Hill Road Eden Valley Hearls Road to Eden Valley RoadBartschs Road Eden Valley Cranes Range Road to Basil Roeslers RoadMartins Road Taunton Vigars Road to Craneford RoadCemetery Road Eden Valley Craneford Road to Eden Valley RoadTapscott Road Mount Pleasant Burns Road to Fromm RoadHillview Road Mount Pleasant Tungkillo Road to Randell RoadRoss Smith Road Mount Pleasant Tungkillo Road to Hillview RoadKen Hicks Road Mount Pleasant Zaltrons Road to Seagers RoadGriggs Road Mount Pleasant G Hicks Road to Torrens Valley RoadH Muellers Road Mount Pleasant Cromer Road to Whites Boundary RoadElder Road Mount Pleasant Cromer Road to EndHannaford Road Cromer Peek Road to EndPeek Road Cromer Cromer Road to Blackwood RoadRunning Postman Road Cromer Cromer Road to Blackwood RoadSteingarten Road Rowland Flat Barossa Valley Way to End
Remaining funds of $20,468 to be held as contingency
Anticipated Sheeted Road Program for 2016-17
Capital Road Program 2016-17 (Continued)Disclaimer: The following road listings are yet to be confirmed and are only an indicative program - they aresubject to final approval of Council; alterations and additions to this list may occur.
31
Annual Budget and Business Plan 2016-17 | The Barossa Council | Page 21 of 45
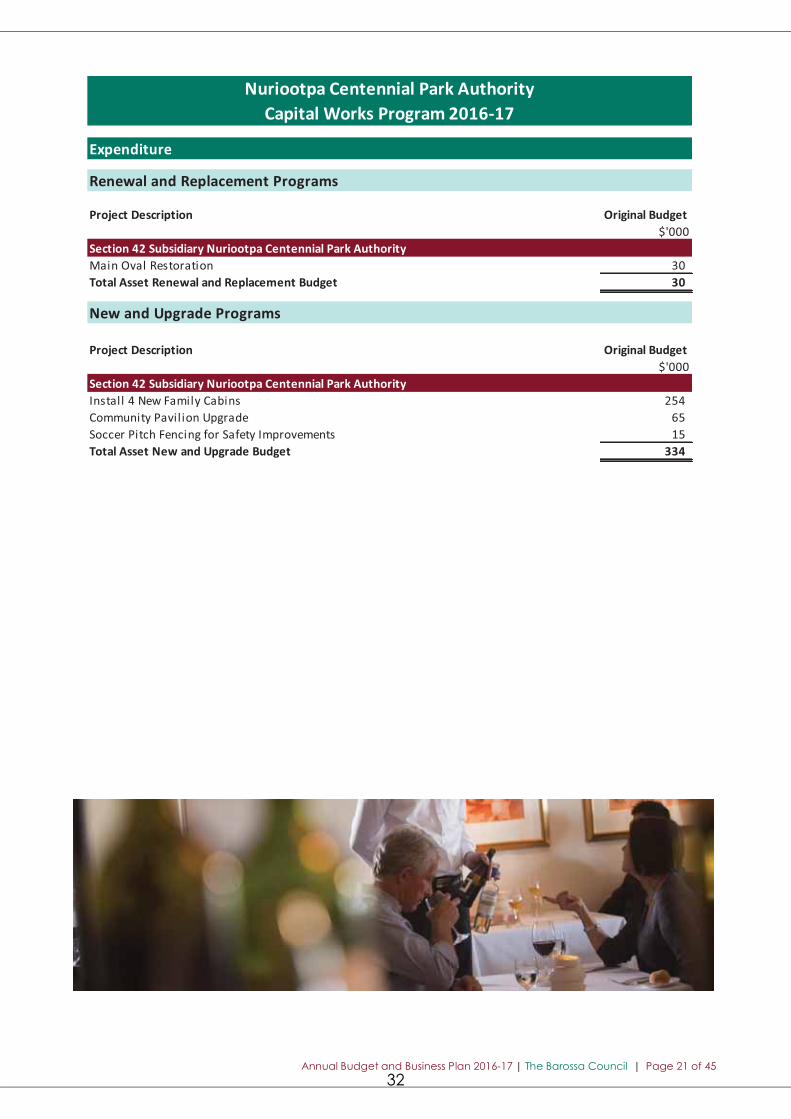
Project Description Original Budget $'000
Section 42 Subsidiary Nuriootpa Centennial Park AuthorityMain Oval Restoration 30 Total Asset Renewal and Replacement Budget 30
Project Description Original Budget $'000
Section 42 Subsidiary Nuriootpa Centennial Park AuthorityInstall 4 New Family Cabins 254 Community Pavil ion Upgrade 65 Soccer Pitch Fencing for Safety Improvements 15 Total Asset New and Upgrade Budget 334
New and Upgrade Programs
Nuriootpa Centennial Park Authority
Expenditure
Renewal and Replacement Programs
Capital Works Program 2016-17
32
Annual Budget and Business Plan 2016-17 | The Barossa Council | Page 22 of 45
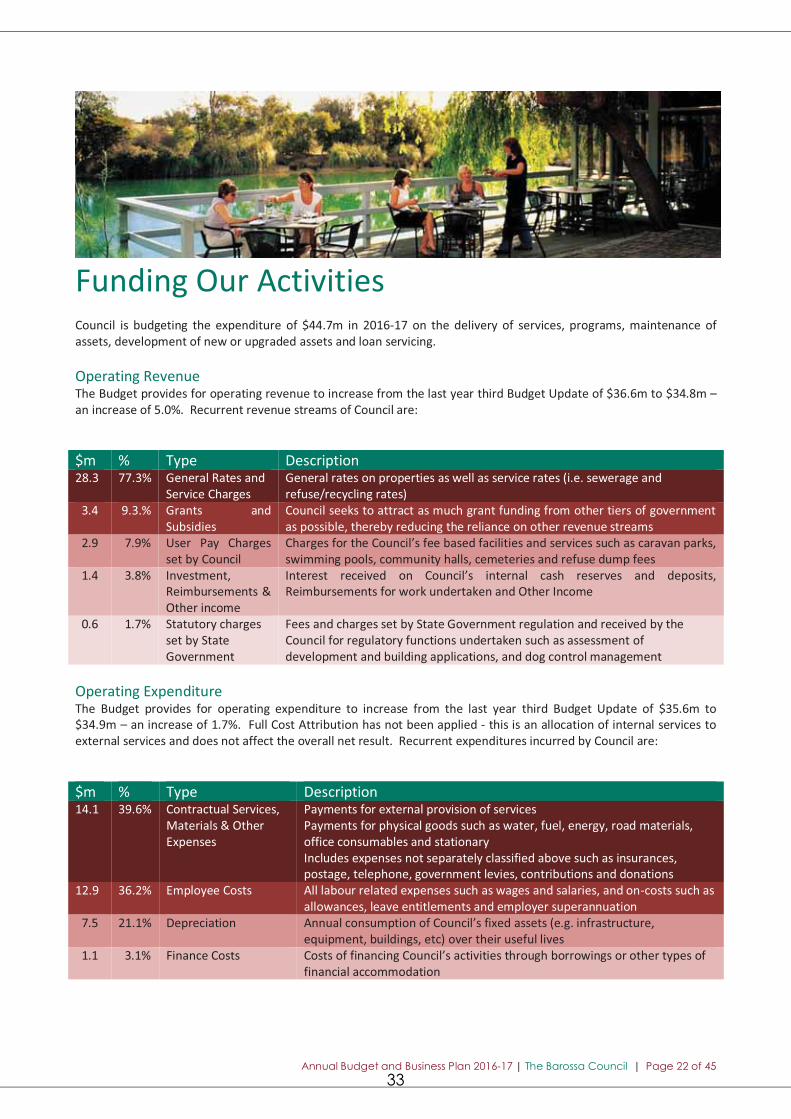
Funding Our Activities Council is budgeting the expenditure of $44.7m in 2016-17 on the delivery of services, programs, maintenance of assets, development of new or upgraded assets and loan servicing. Operating Revenue The Budget provides for operating revenue to increase from the last year third Budget Update of $36.6m to $34.8m – an increase of 5.0%. Recurrent revenue streams of Council are: $m % Type Description 28.3 77.3% General Rates and
Service Charges General rates on properties as well as service rates (i.e. sewerage and refuse/recycling rates)
3.4 9.3.% Grants and Subsidies
Council seeks to attract as much grant funding from other tiers of government as possible, thereby reducing the reliance on other revenue streams
2.9 7.9% User Pay Charges set by Council
Charges for the Council’s fee based facilities and services such as caravan parks, swimming pools, community halls, cemeteries and refuse dump fees
1.4 3.8% Investment, Reimbursements & Other income
Interest received on Council’s internal cash reserves and deposits, Reimbursements for work undertaken and Other Income
0.6 1.7% Statutory charges set by State Government
Fees and charges set by State Government regulation and received by the Council for regulatory functions undertaken such as assessment of development and building applications, and dog control management
Operating Expenditure The Budget provides for operating expenditure to increase from the last year third Budget Update of $35.6m to $34.9m – an increase of 1.7%. Full Cost Attribution has not been applied - this is an allocation of internal services to external services and does not affect the overall net result. Recurrent expenditures incurred by Council are: $m % Type Description 14.1 39.6% Contractual Services,
Materials & Other Expenses
Payments for external provision of services Payments for physical goods such as water, fuel, energy, road materials, office consumables and stationary Includes expenses not separately classified above such as insurances, postage, telephone, government levies, contributions and donations
12.9 36.2% Employee Costs All labour related expenses such as wages and salaries, and on-costs such as allowances, leave entitlements and employer superannuation
7.5 21.1% Depreciation Annual consumption of Council’s fixed assets (e.g. infrastructure, equipment, buildings, etc) over their useful lives
1.1 3.1% Finance Costs Costs of financing Council’s activities through borrowings or other types of financial accommodation
33

Annual Budget and Business Plan 2016-17 | The Barossa Council | Page 23 of 45
Implications for Our Rates Council plans to raise a net sum of $23.9m from rates in 2016-17 (including growth, but excluding service charges, separate rates and the State Government’s NRM levy).
Council recognises that ratepayers wish increases to their rates to be as low as possible; however it is necessary to ensure that current services are properly funded and can continue to be delivered without significantly impacting standards or passing on a financial burden to future ratepayers or cutting services utilised by the community. Current assets and infrastructure owned by Council deteriorate over time through wear and tear and must be replaced or renewed at appropriate intervals in order to prolong their lives and continue to deliver services to the community.
The proposed increase in rate revenue will provide the necessary funding to meet the programmed upgrade, renewal and replacement plans in place as outlined in the Long Term Infrastructure and Asset Management Plan, ensuring that existing services to the community will be maintained.
Council is aware of the impact on ratepayers and is committed to providing and developing options to ease the rate burden through increasing its own efficiency and by providing those under hardship with appropriate alternatives to suit their circumstances. Rating Policy Section 147 of the Local Government Act 1999 provides Council with the power to rate all land within The Barossa Council, except for land specifically exempted, such as Crown land and land occupied by Council.
Council is mindful of its responsibility to continually review its rating policy to ensure it is fair and equitable on its residents. The current rating policy is available for inspection at all Council branches and can be
downloaded from Council’s website at www.barossa.sa.gov.au. Land Valuation Method Council uses the capital value determined by the State Valuation Office as the basis for valuing land and calculating rates.
Council considers that this method provides the fairest method of distributing the rate burden across all ratepayers on the following basis: � The equity principle of taxation requires that
ratepayers of similar wealth pay similar taxes and ratepayers of greater wealth pay more taxes than ratepayers of lesser wealth;
� Property value is a relatively good indicator of market value of a property, providing the fairest method of calculating rates.
The total property rateable valuations provided by the State Valuation Office as at 30 April 2016 was $4,763,687,771 - a 3.06 % increase over last year. Land Use Total Valuation
Movement Residential 3.47% Commercial 4.20% Industry - Light 13.38% Industry - Other 0.39% Primary Production 1.34% Vacant Land 10.46% Other 5.62%
34
Annual Budget and Business Plan 2016-17 | The Barossa Council | Page 24 of 45
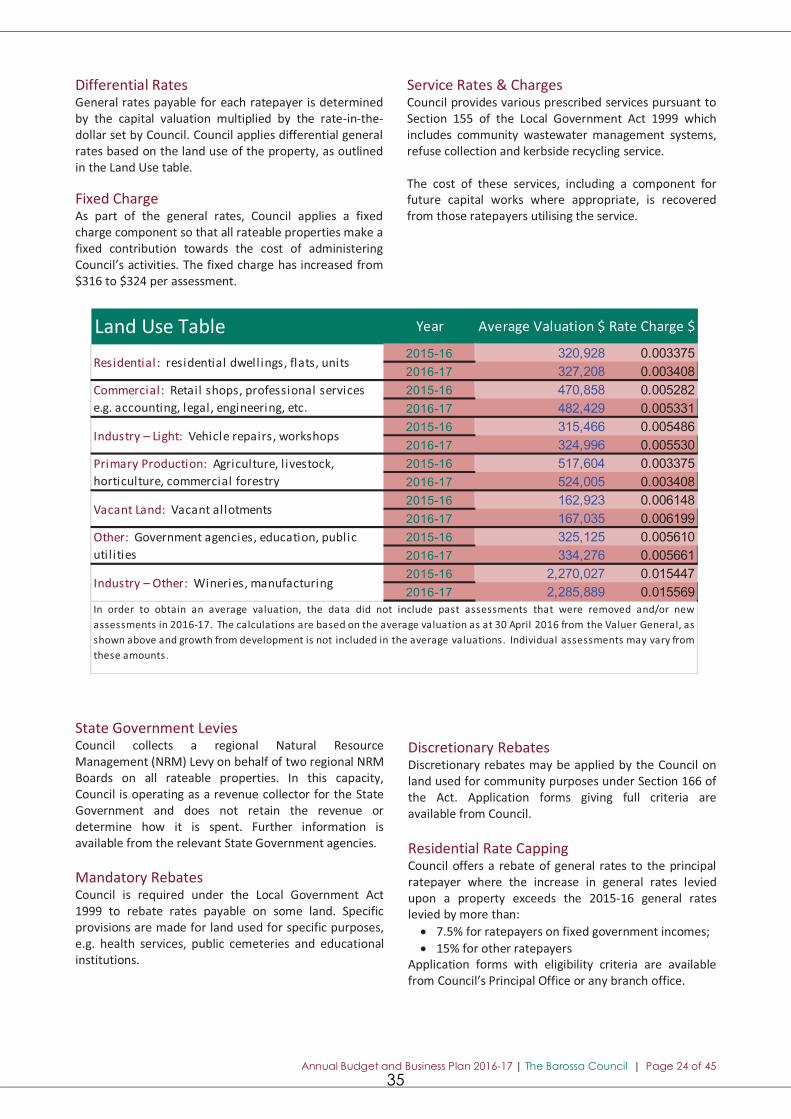
Land Use Table Year Average Valuation $ Rate Charge $
2015-16 320,928 0.003375 2016-17 327,208 0.003408 2015-16 470,858 0.005282 2016-17 482,429 0.005331 2015-16 315,466 0.005486 2016-17 324,996 0.005530 2015-16 517,604 0.003375 2016-17 524,005 0.003408 2015-16 162,923 0.006148 2016-17 167,035 0.006199 2015-16 325,125 0.005610 2016-17 334,276 0.005661 2015-16 2,270,027 0.015447 2016-17 2,285,889 0.015569
Industry – Other: Wineries, manufacturing
Residential : residential dwellings, flats, units
Commercial: Retail shops, professional services e.g. accounting, legal, engineering, etc.
Industry – Light: Vehicle repairs, workshops
Primary Production: Agriculture, l ivestock, horticulture, commercial forestry
Vacant Land: Vacant allotments
Other: Government agencies, education, public util ities
In order to obtain an average valuation, the data did not include past assessments that were removed and/or newassessments in 2016-17. The calculations are based on the average valuation as at 30 April 2016 from the Valuer General, asshown above and growth from development is not included in the average valuations. Individual assessments may vary fromthese amounts.
Differential Rates General rates payable for each ratepayer is determined by the capital valuation multiplied by the rate-in-the-dollar set by Council. Council applies differential general rates based on the land use of the property, as outlined in the Land Use table.
Fixed Charge As part of the general rates, Council applies a fixed charge component so that all rateable properties make a fixed contribution towards the cost of administering Council’s activities. The fixed charge has increased from $316 to $324 per assessment.
Service Rates & Charges Council provides various prescribed services pursuant to Section 155 of the Local Government Act 1999 which includes community wastewater management systems, refuse collection and kerbside recycling service. The cost of these services, including a component for future capital works where appropriate, is recovered from those ratepayers utilising the service.
State Government Levies Council collects a regional Natural Resource Management (NRM) Levy on behalf of two regional NRM Boards on all rateable properties. In this capacity, Council is operating as a revenue collector for the State Government and does not retain the revenue or determine how it is spent. Further information is available from the relevant State Government agencies. Mandatory Rebates Council is required under the Local Government Act 1999 to rebate rates payable on some land. Specific provisions are made for land used for specific purposes, e.g. health services, public cemeteries and educational institutions.
Discretionary Rebates Discretionary rebates may be applied by the Council on land used for community purposes under Section 166 of the Act. Application forms giving full criteria are available from Council. Residential Rate Capping Council offers a rebate of general rates to the principal ratepayer where the increase in general rates levied upon a property exceeds the 2015-16 general rates levied by more than: � 7.5% for ratepayers on fixed government incomes; � 15% for other ratepayers
Application forms with eligibility criteria are available from Council’s Principal Office or any branch office.
35

Annual Budget and Business Plan 2016-17 | The Barossa Council | Page 25 of 45
Concessions and Postponement In order to support ratepayers who are in receipt of fixed incomes, a number of concessions are available for eligible pensioners and self-funded retirees. These concessions are administered by the Department for Communities and Social Inclusion (DCSI) who determine eligibility and pay the concession. Concessions are only available on the principal place of residence. Once again in 2016-17 the general rate concession previously applied to the rates will be paid by the State Government directly to eligible pensioners. Any sewerage concession will be paid to Council by DCSI and will be shown as a deduction from the rates. In addition and in accordance with the Local Government Act 1999, persons who hold a Seniors Card may apply to postpone payment for any amount in excess of $500 ($125 per quarter), less any concession entitlement for their principal place of residence. Council encourages ratepayers who are experiencing difficulties in paying rates to contact Council on (08) 8563 8444 to discuss support that may be available to alleviate any financial hardship. Such enquiries are treated confidentially by Council. Paying Your Rates Council provides for quarterly payment of rates in September, December, March and June each year. Payments can be made via Council’s website (www.barossa.sa.gov.au), B-Pay, Australia Post Billpay, by mail, allocated payment or by cash/cheque/EFTPOS over the counter at the Nuriootpa or branch offices. Expected Impact on Ratepayers Consistent with Council’s adopted Long Term Financial Plan 2015-16 to 2024-25, the 2016-17 Annual Budget and Business Plan reflects an overall increase of 2.5% for general rate revenue with a further 1.25% from new property growth being required to fund the recurrent services, activities and major works program
incorporated within the plan. For more information on the rate revenue increases please refer to the Long Term Financial Plan section in this document. The table on the next page incorporates the proposed overall rating and its impact using average valuations as shown in the Land Use Table (refer previous page); rate changes for individual assessments will likely vary from these amounts. Understanding the Numbers The Residential CWMS Service charge will increase from $306 to $314. The Non-Residential CWMS service rate for each of the townships has been held at $0.001197. Many Springton properties are charged a capital contribution of $245 for a 15 year period. An annual service charge of $55 is applied to vacant allotments in Springton and an annual service charge of $100 is applied for all other vacant allotments where CWMS is available but not connected. The CWMS rate service charges will raise $2.53m, plus other related revenue will bring the total for CWMS income to $2.8m for 2016-17. The operating expenditure for the same period is expected at $2.54m generating a surplus of $0.26m. This surplus is used towards capital expenditure to ensure the services are maintained and grow with service demands into the short to medium term. Total capital expenditure for CWMS is $0.9m. CWMS charges are shown in the following chart. The Refuse collection service rate has been increased by 2.50 % on 2015-16 charges from $113.40 to $116.20 for a 140 litre bin and from $154.50 to $158.40 for a 240 litre bin. The Recycling collection service rate has also increased from $54.50 to $55.90 – 240 litre bin. The two service rates are shown together in the following chart under Refuse/Recycling.
36

Annual Budget and Business Plan 2016-17 | The Barossa Council | Page 26 of 45
Land Use Code Year Total Rates % Average Total Increase
Residential 2015-16 1873.002016-17 1925.20 2.79%
Commercial 2015-16 3421.202016-17 3529.20 3.16%
Industry - Light 2015-16 2478.702016-17 2566.10 3.53%
Primary Production 2015-16 2230.802016-17 2281.90 2.29%
Vacant Land 2015-16 1417.702016-17 1459.40 2.94%
Other 2015-16 2307.902016-17 2388.40 3.49%
Industry - Other 2015-16 35435.602016-17 35968.90 1.50%
Percentage increase in Rates & Charges for Land Use Categories based on Average Valuation
Year General Rates Fixed Charge CWMS
Refuse/ Recycling Total
2015-16 $1,083.10 $316.00 $306.00 $167.90 $1,873.00
2016-17 $1,115.10 $324.00 $314.00 $172.10 $1,925.20
2015-16 $2,487.10 $316.00 $563.60 $54.50 $3,421.20
2016-17 $2,571.80 $324.00 $577.50 $55.90 $3,529.20
2015-16 $1,730.60 $316.00 $377.60 $54.50 $2,478.70
2016-17 $1,797.20 $324.00 $389.00 $55.90 $2,566.10
2015-16 $1,746.90 $316.00 $167.90 $2,230.80
2016-17 $1,785.80 $324.00 $172.10 $2,281.90
2015-16 $1,001.70 $316.00 $100.00 $1,417.70
2016-17 $1,035.40 $324.00 $100.00 $1,459.40
2015-16 $1,824.00 $316.00 $167.90 $2,307.90
2016-17 $1,892.30 $324.00 $172.10 $2,388.40
2015-16 $35,065.10 $316.00 $54.50 $35,435.60
2016-17 $35,589.00 $324.00 $55.90 $35,968.90
Other: Government agencies, education, public util ities
Industry – Other: Wineries, manufacturing
Residential : Residential dwellings, flats, units
Commercial: Retail shops, professional services e.g. accounting, legal, engineering,
Industry – Light: Vehicle repairs, workshops
Primary Production: Agriculture, l ivestock, horticulture, commercial forestry
Vacant Land: Vacant allotments
Rates for Land Use Categories based on Average Valuation (see table on page 24)
Note: Rates have been calculated using information from the Land Use table on Page 24.
37

Annual Budget and Business Plan 2016-17 | The Barossa Council | Page 27 of 45
Measuring Our Performance Measuring and monitoring performance is important to ensure our objectives are achieved and services are delivered to our community. Council monitors financial performance through its Business Planning Framework (refer also to the section on “Strategic Directions”). This includes: � Monthly Financial Reports which regularly track
Council finances; � Quarterly Budget Reviews which outline financial
performance against the Annual Budget and Business Plan;
� Audited Financial Statements which are included in the Annual Report as required under the Local Government Act 1999;
� the Annual Report which describes the performance of Council on objectives set in the Annual Budget and Business Plan;
� Council’s Community Plan 2016-2036 will be presented to Council for adoption in June 2016, which lays out the long term objectives and strategies Council is striving to achieve.
To provide advice and recommendations on financial and governance matters, Council has appointed an Audit Committee which includes independent members with qualifications and experience in related disciplines.
Key Performance Indicators Council has a number of financial Key Performance Indicators (KPI’s) which measure the impact of the annual budget on Council’s financial position. Each of these indicators, together with associated comments, is outlined below: Legend: Target
Not Met Target At Risk
Target Met
Forecast is the third Budget Update (Q3) for the year, adopted by Council at the May 2016 meeting and material financial information received since that time has been included. The Key Performance Indicator: Asset Consumption Ratio is no longer showing within this report. The Local Government (Financial Management) Regulations 1999 no longer require the inclusion of this KPI with the budget estimates.
Key Performance Indicator 1: Operating Result ($’000) Council has set the following target - To achieve an operating break-even position, or better, over any five year period. Individual periods are shown; refer to the long term financial plan section in this document for a rolling 3 year period. Year 2013-14 Actual 2014-15 Actual 2015-16 Forecast Q3 2016-17 Budget Result 76 277 (121) 1,026 Status
38

Annual Budget and Business Plan 2016-17 | The Barossa Council | Page 28 of 45
Key Performance Indicator 2: Operating Surplus/(Deficit) Ratio Expresses the projected Operating Surplus/(Deficit) result as a percentage of general rate revenue. Council has set the following target - To achieve an operating surplus ratio of between -2% to 10, over a rolling 3 year period. Year 2013-14 Actual 2014-15 Actual 2015-16 Forecast Q3 2016-17 Budget Result 0.6% 0.5% 0.2% 1.1% Status
Key Performance Indicator 3: Net Financial Liabilities ($’000) Council has set the following target - Council's level of net financial liabilities is no greater than its annual operating revenue and not less than zero. Year 2013-14 Actual 2014-15 Actual 2015-16 Forecast Q3 2016-17 Budget Result 13,986 13,542 15,846 14,794 Status
Key Performance Indicator 4: Net Financial Liabilities Ratio Expresses the projected Net Financial Liabilities as a percentage of total operating revenue for each year. It is Council policy (and industry best practice) that this ratio shall not exceed 100%. Council has set the following target - Net financial liabilities ratio is greater than zero but less than 100% of total operating revenue. Year 2013-14 Actual 2014-15 Actual 2015-16 Forecast Q3 2016-17 Budget Result 43% 40% 46% 40% Status
Key Performance Indicator 5: Interest Cover Ratio Expresses the net interest expense (i.e. interest expense less investment income) as a percentage of total operating revenue. Council has set the following target - Net interest is greater than 0% and less than 8% of operating revenue. Year 2013-14 Actual 2014-15 Actual 2015-16 Forecast Q3 2016-17 Budget Result 3.0% 2.6% 2.6% 2.4% Status
Key Performance Indicator 6: Asset Sustainability Ratio Expresses the rate by which assets are wearing out and being replaced by comparing capital outlays on renewal/replacement of existing assets (net of any proceeds from the sale of replaced assets) to the annual depreciation expense allocated against such assets. Council has set the following target - Capital outlays on renewing/replacing assets net of proceeds from sale of replaced assets is greater than 80% but less than 110% of Infrastructure Asset Management Plans over a rolling 3 year period. Year 2013-14 Actual 2014-15 Actual 2015-16 Forecast Q3 2016-17 Budget Result 84% 78% 86% 101% Status
39

Annual Budget and Business Plan 2016-17 | The Barossa Council | Page 29 of 45
Non - Financial Measures Council is reviewing its Key Performance Indicators to improve the measurement of performance. This is part of Council’s Strategic Plan, as well as continuous improvement initiatives related to Council’s Business Planning Framework. Non-financial indicators measuring the performance of Council in relation to the Annual Business Plan can be found below.
They provide information with regards to Council’s capacity to effectively deliver services to our community, and the targets Council intends to meet. Council’s performance against these indicators is then reported in the Annual Report.
Indicator Purpose Target
People Employee Retention Rate (annual trend) Measure of organisational capacity Target 90%
Finance Management & Regulatory Financial reporting meeting scheduled timetable
Measure that information is presented at a strategic level, succinct and easy to follow and available to all stakeholders within deadlines
Target 100%
Internal control Measure number of self-assessments being completed for selected control areas.
Target 95%
Assets Percentage of Capital Renewal Program scheduled works on track
Measures Capital Works Program, Capital New Initiatives, and other scheduled capital programs against projected completion times
Actual to be consistent with Annual Budget projections at least 90% achieved.
Service Delivery Percentage of customer requests responded to in accordance with the customer request service level targets
Measures all requests through Council’s customer request system, and all complaints lodged with Council’s regulatory systems
Target 85%
40
Annual Budget and Business Plan 2016-17 | The Barossa Council | Page 30 of 45
Annual Budget
Budgeted Financial Statements 2016-17 The following pages contain Council’s budgeted financial statements, including the Nuriootpa Centennial Park Authority, in a format consistent with the requirements of Regulation 5B of the Local Government (Financial Management) Regulations, comprising for the year ending 30 June 2016: � Statement of Comprehensive Income � Statement of Financial Position � Statement of Changes in Equity � Statement of Cash Flows � Uniform Presentation of Finances Please note: the format of the following Financial Statements is based on the 2015 Model Financial Statements.
41
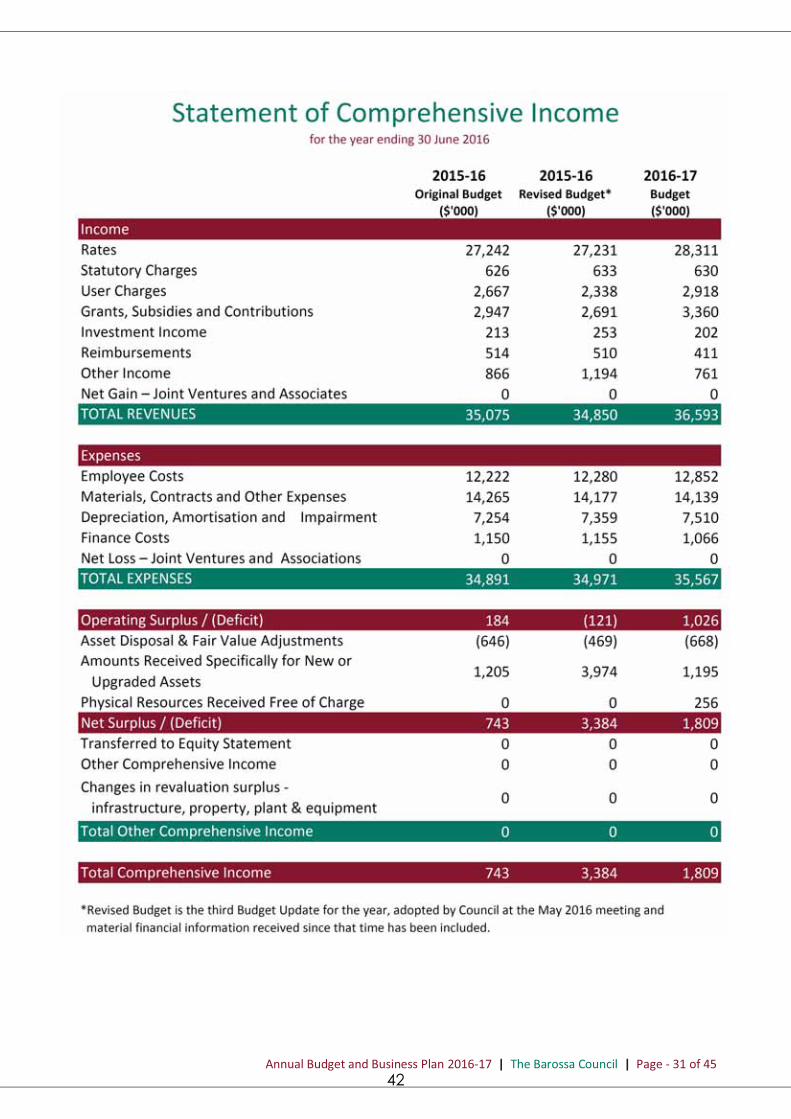
Annual Budget and Business Plan 2016-17 | The Barossa Council | Page - 31 of 45 42

Annual Budget and Business Plan 2016-17 | The Barossa Council | Page - 32 of 45
43

Annual Budget and Business Plan 2016-17 | The Barossa Council | Page - 33 of 45
44

Annual Budget and Business Plan 2016-17 | The Barossa Council | Page - 34 of 45
45

Annual Budget and Business Plan 2016-17 | The Barossa Council | Page - 35 of 45 46
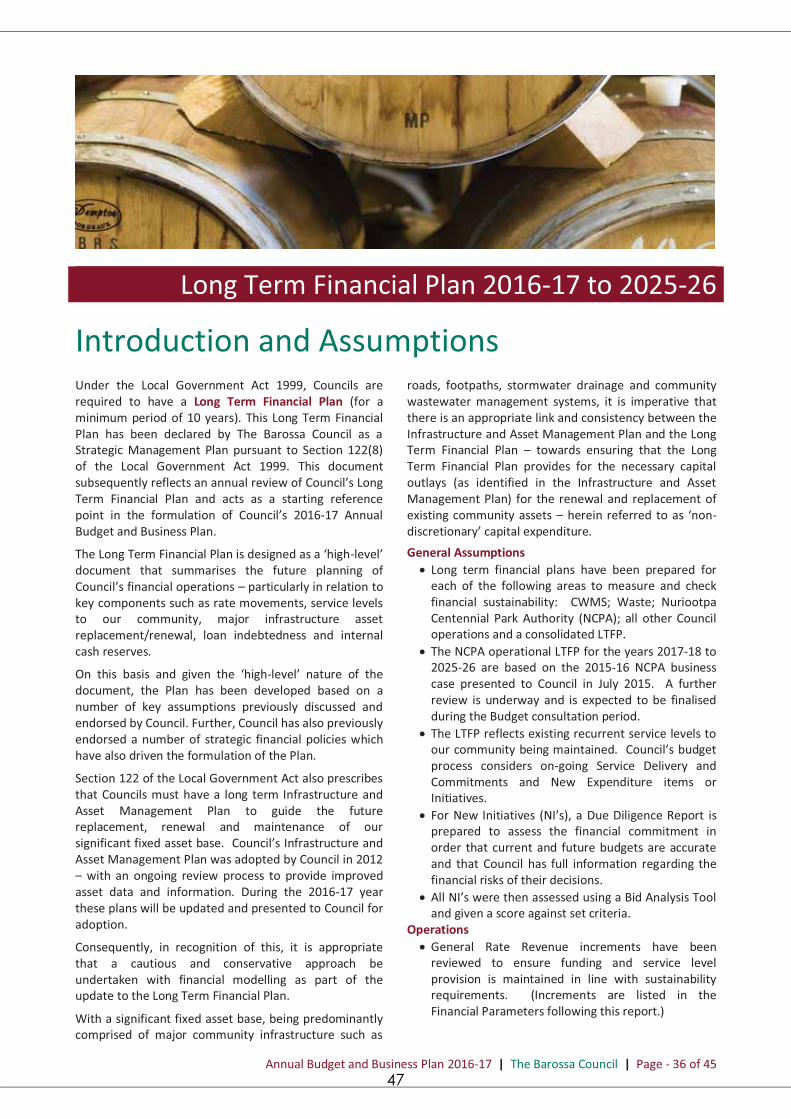
Annual Budget and Business Plan 2016-17 | The Barossa Council | Page - 36 of 45
Long Term Financial Plan 2016-17 to 2025-26
Introduction and Assumptions Under the Local Government Act 1999, Councils are required to have a Long Term Financial Plan (for a minimum period of 10 years). This Long Term Financial Plan has been declared by The Barossa Council as a Strategic Management Plan pursuant to Section 122(8) of the Local Government Act 1999. This document subsequently reflects an annual review of Council’s Long Term Financial Plan and acts as a starting reference point in the formulation of Council’s 2016-17 Annual Budget and Business Plan.
The Long Term Financial Plan is designed as a ‘high-level’ document that summarises the future planning of Council’s financial operations – particularly in relation to key components such as rate movements, service levels to our community, major infrastructure asset replacement/renewal, loan indebtedness and internal cash reserves.
On this basis and given the ‘high-level’ nature of the document, the Plan has been developed based on a number of key assumptions previously discussed and endorsed by Council. Further, Council has also previously endorsed a number of strategic financial policies which have also driven the formulation of the Plan.
Section 122 of the Local Government Act also prescribes that Councils must have a long term Infrastructure and Asset Management Plan to guide the future replacement, renewal and maintenance of our significant fixed asset base. Council’s Infrastructure and Asset Management Plan was adopted by Council in 2012 – with an ongoing review process to provide improved asset data and information. During the 2016-17 year these plans will be updated and presented to Council for adoption.
Consequently, in recognition of this, it is appropriate that a cautious and conservative approach be undertaken with financial modelling as part of the update to the Long Term Financial Plan.
With a significant fixed asset base, being predominantly comprised of major community infrastructure such as
roads, footpaths, stormwater drainage and community wastewater management systems, it is imperative that there is an appropriate link and consistency between the Infrastructure and Asset Management Plan and the Long Term Financial Plan – towards ensuring that the Long Term Financial Plan provides for the necessary capital outlays (as identified in the Infrastructure and Asset Management Plan) for the renewal and replacement of existing community assets – herein referred to as ‘non-discretionary’ capital expenditure.
General Assumptions � Long term financial plans have been prepared for
each of the following areas to measure and check financial sustainability: CWMS; Waste; Nuriootpa Centennial Park Authority (NCPA); all other Council operations and a consolidated LTFP.
� The NCPA operational LTFP for the years 2017-18 to 2025-26 are based on the 2015-16 NCPA business case presented to Council in July 2015. A further review is underway and is expected to be finalised during the Budget consultation period.
� The LTFP reflects existing recurrent service levels to our community being maintained. Council’s budget process considers on-going Service Delivery and Commitments and New Expenditure items or Initiatives.
� For New Initiatives (NI’s), a Due Diligence Report is prepared to assess the financial commitment in order that current and future budgets are accurate and that Council has full information regarding the financial risks of their decisions.
� All NI’s were then assessed using a Bid Analysis Tool and given a score against set criteria.
Operations � General Rate Revenue increments have been
reviewed to ensure funding and service level provision is maintained in line with sustainability requirements. (Increments are listed in the Financial Parameters following this report.)
47
Annual Budget and Business Plan 2016-17 | The Barossa Council | Page - 37 of 45
� Operating Cost – Employee, Contractors & Materials have been increased at an index rate plus half of the rates growth of 1.0% for 2016-17 and range indices of 2% to 2.5% for the forward years in the plan.
� Selected costs have been isolated from general expenditure, eg. energy use for electricity, water costs, insurance premiums, and waste collection and disposal service costs; projected increases for these are at or higher than the base rate.
� Depreciation has been calculated on existing asset classes, structures, valuation and condition rating; asset componentisation has been included as appropriate to selected asset types. A review of useful lives of transport and stormwater assets and components is included within this review.
� Rubble raising cost at $354k in 2016-17 with any remaining stock to be used in the years following.
� The external Committees operational budgets previously shown as “Section 41 Committees” are funded by other service areas within the 2016-17 budget and throughout the LTFP.
� Roads to Recovery grant funding of $328k per year is confirmed for a selected period but has been included for the life of the LTFP. In 2016-17 an additional $757k has been added to the capital expenditure program and income as a one-off item.
� Staff levels will remain constant with only minor changes included and overall increases projected to be in line with Enterprise Bargaining Agreements.
� Full Cost Attribution - an allocation of internal services to external services has been estimated in the LTFP. This allocation does not affect the overall net result.
Capital � Asset Renewal and/or Replacement expenditure is
provided for on various buildings, for the reseal and resheeting works on Council roads and other infrastructure.
� Discretional Capital expenditure has been included at $350k per year from 2017-18 to 2023-24, $400k per year for the remaining years.
� Capital Grants in this review only include estimation for funding allocation for library books and road programs as listed with grant funding submissions.
� Council has identified land assets considered surplus both for the needs of the community and its operations, with only a few properties remaining in this program.
� A reduction in expenditure for purchase of plant and equipment in selected years of the plan until a full review of plant utilisation is undertaken.
Loan Principal & Interest Repayment � The loan from Council to NCPA for $650k included in
the LTFP continues to be repaid during 2016-17 at $65k per year. Other external loans are then included for NCPA to purchase cabins and other assets, these loans repayments start by NCPA from 2018-19.
� An internal loan of $7.8m is required to ensure Council’s general operations meet financial sustainability indicators. The loan is transferred from the CWMS operations reserve with repayments made within the 10 year plan.
� There is a scheduled balloon payment for $3m on an existing loan in the year 2024-25 at which time Council will assess its loan requirements and re-finance as needed. This finance position is reflected in the reducing Net Financial Liabilities Ratio.
� Council’s net loan balance outstanding (as at 30 June 2016) is $16.3m.
Key Performance Indicators � Council has established targets for the Key
Performance Indicators (KPI’s) as recorded within the LTFP document, as follows: � KPI - No. 1 Achieve an operating breakeven
position, or better, over any five year period � KPI - No. 2 Achieve an operating surplus ratio of
between -2% to 10% � KPI - No. 4 Net financial liabilities ratio is greater
than zero but less than 100% of total operating revenue.
� KPI - No. 6 Capital outlays on renewing/replacing assets net of proceeds from sale of replaced assets is greater than 80% but less than 110% of Infrastructure Asset Management Plans over a rolling 3 year period.
Financial Sustainability Performance Report � KPI - No. 1 - It is noted that cumulative years 2016-
17 to 2020-21 are within a surplus position. � KPI No. 2 - Operating surplus ratios have been
amended and are now measured against total operating revenue. Council’s expected forecast results are within the target range of -2 to 10%.
� KPI - No. 6 - the KPI target is being met in this review of the LTFP. As further reviews of planned expenditure from the Infrastructure and Asset Management Plan are undertaken, then a full assessment and measurement of the KPI will be done.
� All other KPI’s are within the target ranges. � Council has reviewed its financial parameters for the
LTFP including the indexation used for forward projections on income and expenditure. A full list is contained in the following tables.
� In line with Council Policy a regular review of Council’s treasury management will be required to ensure a positive cash position is maintained.
� This analysis indicates that Council is currently financially sustainable for the forecast period covered by the LTFP. Noting that unless significant additional operating revenue is generated, or expenses and service levels are reduced, the Council does not have the capacity to financially undertake major additional discretionary proposed projects or services over the 10 year period, (other than the discretionary amount included within the plan).
48
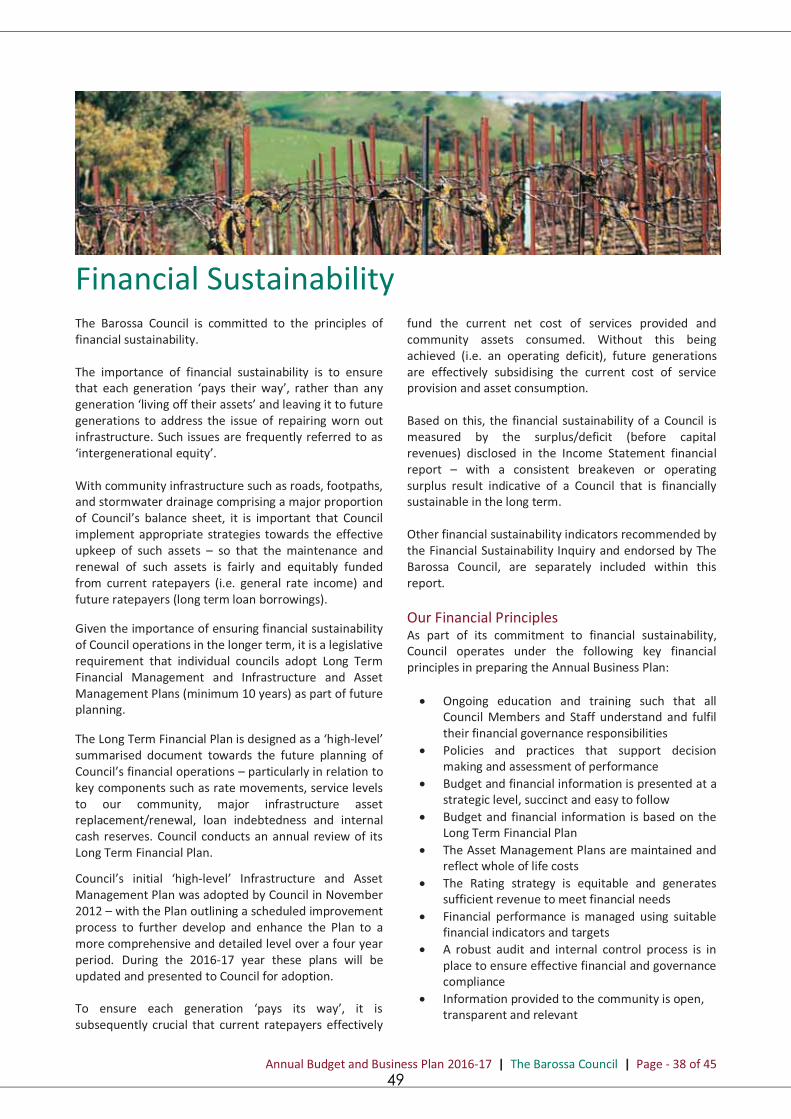
Annual Budget and Business Plan 2016-17 | The Barossa Council | Page - 38 of 45
Financial Sustainability The Barossa Council is committed to the principles of financial sustainability. The importance of financial sustainability is to ensure that each generation ‘pays their way’, rather than any generation ‘living off their assets’ and leaving it to future generations to address the issue of repairing worn out infrastructure. Such issues are frequently referred to as ‘intergenerational equity’. With community infrastructure such as roads, footpaths, and stormwater drainage comprising a major proportion of Council’s balance sheet, it is important that Council implement appropriate strategies towards the effective upkeep of such assets – so that the maintenance and renewal of such assets is fairly and equitably funded from current ratepayers (i.e. general rate income) and future ratepayers (long term loan borrowings). Given the importance of ensuring financial sustainability of Council operations in the longer term, it is a legislative requirement that individual councils adopt Long Term Financial Management and Infrastructure and Asset Management Plans (minimum 10 years) as part of future planning. The Long Term Financial Plan is designed as a ‘high-level’ summarised document towards the future planning of Council’s financial operations – particularly in relation to key components such as rate movements, service levels to our community, major infrastructure asset replacement/renewal, loan indebtedness and internal cash reserves. Council conducts an annual review of its Long Term Financial Plan.
Council’s initial ‘high-level’ Infrastructure and Asset Management Plan was adopted by Council in November 2012 – with the Plan outlining a scheduled improvement process to further develop and enhance the Plan to a more comprehensive and detailed level over a four year period. During the 2016-17 year these plans will be updated and presented to Council for adoption. To ensure each generation ‘pays its way’, it is subsequently crucial that current ratepayers effectively
fund the current net cost of services provided and community assets consumed. Without this being achieved (i.e. an operating deficit), future generations are effectively subsidising the current cost of service provision and asset consumption. Based on this, the financial sustainability of a Council is measured by the surplus/deficit (before capital revenues) disclosed in the Income Statement financial report – with a consistent breakeven or operating surplus result indicative of a Council that is financially sustainable in the long term. Other financial sustainability indicators recommended by the Financial Sustainability Inquiry and endorsed by The Barossa Council, are separately included within this report. Our Financial Principles As part of its commitment to financial sustainability, Council operates under the following key financial principles in preparing the Annual Business Plan: � Ongoing education and training such that all
Council Members and Staff understand and fulfil their financial governance responsibilities
� Policies and practices that support decision making and assessment of performance
� Budget and financial information is presented at a strategic level, succinct and easy to follow
� Budget and financial information is based on the Long Term Financial Plan
� The Asset Management Plans are maintained and reflect whole of life costs
� The Rating strategy is equitable and generates sufficient revenue to meet financial needs
� Financial performance is managed using suitable financial indicators and targets
� A robust audit and internal control process is in place to ensure effective financial and governance compliance
� Information provided to the community is open, transparent and relevant
49

Annual Budget and Business Plan 2016-17 | The Barossa Council | Page - 39 of 45
Appendix
Key Performance Indicators and Financial Parameters
A1
Long Term Plan Financial Statements 2016-17 to 2025-26
A2
Capital Expenditure A3
50

Annual Budget and Business Plan 2016-17 | The Barossa Council | Page - 40 of 45
2016-17 2017-18 2018-19 2019-20 2020-21 2021-22 2022-23 2023-24 2024-25 2025-26OB = Original Budget; LTFP = Long Term Financial Plan OB LTFP LTFP LTFP LTFP LTFP LTFP LTFP LTFP LTFP
$'000 or % $'000 or % $'000 or % $'000 or % $'000 or % $'000 or % $'000 or % $'000 or % $'000 or % $'000 or %Key Performance Indicators (KPI's) - SummaryKPI 1 - Operating Surplus cumulative forward 5 year period* 1,026 1,439 1,932 2,436 3,056KPI 2 - Operating Surplus Ratio - rolling 3 year 1.1% 1.2% 1.7% 1.2% 1.4% 1.4% 1.5% 1.7% 2.1% 2.2%KPI 4 - Net Financial Liabilities ratio 40.4% 35.0% 28.4% 24.2% 19.2% 13.3% 5.8% 0.0% -3.7% -9.7%KPI 6 - Asset Sustainability Ratio - Rolling 3 year 101.1% 96.6% 97.9% 99.7% 103.9% 109.2% 110.9% 115.3% 114.6% 116.3%
General - Rate Revenue Increase Net (excl growth) 2.5% 3.0% 2.5% 2.5% 2.5% 2.5% 2.5% 2.5% 2.5% 2.5%Natural growth - Development 1.3% 1.0% 1.0% 1.0% 1.0% 1.0% 1.0% 1.0% 1.0% 1.0%CWMS - Rate Revenue Increase (excl growth) 2.5% 2.5% 2.5% 2.5% 2.5% 2.5% 2.5% 2.5% 2.5% 2.5%Waste Services- Rate Revenue Increase (excl growth) 2.5% 2.5% 3.5% 4.0% 4.0% 4.0% 4.5% 3.5% 2.3% 1.8%
Operating Grants 2.0% 2.0% 2.0% 2.0% 2.0% 2.0% 2.0% 2.0% 2.0% 2.0%Statutory Charges 2.0% 2.0% 2.0% 2.0% 2.0% 2.0% 2.0% 2.0% 2.0% 2.0%User Charges 2.0% 2.0% 2.0% 2.0% 2.0% 2.0% 2.0% 2.0% 2.0% 2.0%Investment Income 2.0% 2.0% 2.0% 2.0% 2.0% 2.0% 2.0% 2.0% 2.0% 2.0%Reimbursements 2.0% 2.0% 2.0% 2.0% 2.0% 2.0% 2.0% 2.0% 2.0% 2.0%Other Revenue 2.0% 2.0% 2.0% 2.0% 2.0% 2.0% 2.0% 2.0% 2.0% 2.0%
Service Cost Natural Growth** 1.0% 1.0% 1.0% 1.0% 1.0% 1.0% 1.0% 1.0% 1.0% 1.0%Employee Costs 2.0% 2.0% 2.0% 2.0% 2.0% 2.0% 2.0% 2.0% 2.0% 2.0%Contracts, Materials & Other 2.5%/2% 2.5%/2% 2.5%/2% 2.5%/2% 2.5% 2.5% 2.5% 2.5% 2.5% 2.5%Power Costs - Non CWMS operations 2.5% 2.5% 2.5% 2.5% 2.5% 2.5% 2.5% 2.5% 2.5% 2.5%Water Costs 2.5% 2.5% 2.5% 2.5% 2.5% 2.5% 2.5% 2.5% 2.5% 2.5%Insurance 4.0% 4.0% 4.0% 4.0% 4.0% 4.0% 4.0% 4.0% 4.0% 4.0%
Land Assets 3.0% 3.0% 3.0% 3.0% 3.0% 3.0% 3.0% 3.0% 3.0% 3.0%Building Assets 2.3% 2.3% 2.3% 2.3% 2.3% 2.3% 2.3% 2.3% 2.3% 2.3%Recreation Assets 2.5% 2.5% 2.5% 2.5% 2.5% 2.5% 2.5% 2.5% 2.5% 2.5%Infrastructure Assets 2.5% 2.5% 2.5% 2.5% 2.5% 2.5% 2.5% 2.5% 2.5% 2.5%CWMS 3.0% 3.0% 3.0% 3.0% 3.0% 3.0% 3.0% 3.0% 3.0% 3.0%Stormwater Assets 2.5% 2.5% 2.5% 2.5% 2.5% 2.5% 2.5% 2.5% 2.5% 2.5%** All amounts in KPI 1 are in $'000** Index added to Employee Costs and Contracts, Materials & Other
OPERATING EXPENDITURE
Asset Revaluation Increments
OPERATING REVENUE
A1 Consolidated Results: Key Performance Indicators and Financial
Financial parameters - IndexationRATE REVENUE INCREASES
51

Annual Budget and Business Plan 2016-17 | The Barossa Council | Page - 41 of 45
2016-17 2017-18 2018-19 2019-20 2020-21 2021-22 2022-23 2023-24 2024-25 2025-26OB LTFP LTFP LTFP LTFP LTFP LTFP LTFP LTFP LTFP
$'000 $'000 $'000 $'000 $'000 $'000 $'000 $'000 $'000 $'000
Rates 28,311 29,418 30,467 31,563 32,699 33,876 35,108 36,361 37,627 38,924 Statutory Charges 630 643 656 669 682 696 710 724 739 753 User Charges 2,918 2,872 2,949 3,028 3,093 3,159 3,227 3,296 3,367 3,439 Grants, subsidies and contributions 3,360 2,629 2,675 2,722 2,770 2,819 2,868 2,919 2,971 3,024 Investment Income 202 110 101 103 83 75 95 156 206 176 Reimbursements 411 419 428 436 445 454 463 472 481 491 Other Income 761 778 794 810 826 842 859 876 894 912 Net Gain - Joint Venture - - - - - - - - - -
36,593 36,869 38,070 39,331 40,598 41,921 43,330 44,804 46,285 47,719
Employee Costs 12,852 13,178 13,571 13,974 14,390 14,819 15,260 15,714 16,182 16,663 Materials, Contracts & Other expenses 14,139 14,464 14,968 15,574 16,049 16,731 17,189 17,661 18,150 19,002 Depreciation, Amortisation & Impairment 7,510 7,889 8,245 8,614 8,999 9,403 9,782 10,185 10,612 11,040 Finance Costs 1,066 925 793 665 540 421 346 300 157 34 Net Gain - Joint Venture - - - - - - - - - -
35,567 36,456 37,577 38,827 39,978 41,374 42,577 43,860 45,101 46,739
1,026 413 493 504 620 547 753 944 1,184 980
Asset disposal & fair value adjustments (668) (554) (594) (639) (661) (698) (737) (771) (812) (843)Amounts specifically for new or upgraded assets 1,195 200 200 100 50 50 50 50 50 50Physical Resources received free of charge 256 1,774 1,823 1,874 1,931 1,987 2,043 2,097 2,156 2,218Operating result from discontinued operations
1,809 1,833 1,922 1,839 1,940 1,886 2,109 2,320 2,578 2,405 Transfer to Equity Statement
Other Comprehensive Income - - - - - - - - - - Changes in revaluation surplus - infrastructure, - - - - - - - - - -
property,plant & equipment
- - - - - - - - - -
1,809 1,833 1,922 1,839 1,940 1,886 2,109 2,320 2,578 2,405
EXPENSES
Total Other Comprehensive Income
TOTAL COMPREHENSIVE INCOME
A2-1 Consolidated Results: Budgeted Statement of Comprehensive
TOTAL EXPENSES
OPERATING SURPLUS / (DEFICIT)
NET SURPLUS / (DEFICIT)
REVENUES
TOTAL INCOME
52

Annual Budget and Business Plan 2016-17 | The Barossa Council | Page - 42 of 45
2016-17 2017-18 2018-19 2019-20 2020-21 2021-22 2022-23 2023-24 2024-25 2025-26OB LTFP LTFP LTFP LTFP LTFP LTFP LTFP LTFP LTFP
$'000 $'000 $'000 $'000 $'000 $'000 $'000 $'000 $'000 $'000
Current AssetsCash and cash equivalents 2,887 2,603 2,659 2,034 1,898 2,620 5,043 6,900 6,162 8,838 Trade & other receivables 2,406 2,406 2,406 2,406 2,406 2,406 2,406 2,406 2,406 2,406 Other financial assets 7 7 7 7 7 7 7 7 7 7 Inventories 58 58 58 58 58 58 58 58 58 58
5,358 5,074 5,130 4,505 4,369 5,091 7,514 9,371 8,633 11,309 Non-Current Assets held for Sale - - - - - - - - - -
5,358 5,074 5,130 4,505 4,369 5,091 7,514 9,371 8,633 11,309
Non-Current Assets
Financial Assets 726 726 726 726 726 726 726 726 726 726 Equity accounted investments in Council businesses 1,689 1,689 1,689 1,689 1,689 1,689 1,689 1,689 1,689 1,689 Infrastructure, Property, Plant & Equipment 344,631 352,876 361,228 370,446 379,593 388,412 396,791 406,154 416,062 425,571 Other Non-Current Assets - - - - - - - - - -
347,046 355,291 363,643 372,861 382,008 390,827 399,206 408,569 418,477 427,986
352,404 360,365 368,773 377,366 386,377 395,918 406,720 417,940 427,110 439,295
Current LiabilitiesTrade & Other Payables 3,251 3,052 3,056 3,063 3,071 3,056 3,046 3,036 3,098 3,153 Borrowings 2,046 1,817 1,720 1,623 1,195 668 703 3,244 306 38 Provisions 2,382 2,387 2,391 2,396 2,401 2,406 2,411 2,416 2,422 2,427
7,679 7,256 7,167 7,082 6,667 6,130 6,160 8,696 5,826 5,618
Non-Current LiabilitiesTrade & Other Payables - - - - - - - - - - Borrowings (External) 12,344 10,592 8,662 6,804 5,373 4,425 3,747 568 255 216 Provisions 795 795 795 795 795 795 795 795 795 795
13,139 11,387 9,457 7,599 6,168 5,220 4,542 1,363 1,050 1,011
20,818 18,643 16,624 14,681 12,835 11,350 10,702 10,059 6,876 6,629
331,586 341,722 352,149 362,685 373,542 384,568 396,018 407,881 420,234 432,666
Accumulated Surplus 70,317 71,395 72,416 73,958 75,737 76,510 77,239 79,032 81,380 83,033 Asset Revaluation Reserve 254,232 262,535 271,040 279,737 288,655 297,794 307,135 316,678 326,454 336,479 Other Reserves 7,037 7,792 8,693 8,990 9,150 10,264 11,644 12,171 12,400 13,154
331,586 341,722 352,149 362,685 373,542 384,568 396,018 407,881 420,234 432,666
TOTAL LIABILITIES
TOTAL EQUITY
LIABILITIES
EQUITY
Total Current Liabilities
Total Non-Current Liabilities
NET ASSETS
TOTAL ASSETS
Total Current Assets
Total Non-Current Assets
A2-2 Consolidated Results: Budgeted Statement of Financial Position
ASSETS
53

Annual Budget and Business Plan 2016-17 | The Barossa Council | Page - 43 of 45
2016-17 2017-18 2018-19 2019-20 2020-21 2021-22 2022-23 2023-24 2024-25 2025-26OB LTFP LTFP LTFP LTFP LTFP LTFP LTFP LTFP LTFP
$ '000 $ '000 $ '000 $ '000 $ '000 $ '000 $ '000 $ '000 $ '000 $ '000
Receipts:Operating receipts 36,392 36,759 37,968 39,227 40,514 41,846 43,235 44,648 46,079 47,544Investment receipts 202 110 101 103 83 75 95 156 206 176Payments:LandFill rehabilitation expense (204) (204)Operating payments to suppliers & employees (26,986) (27,638) (28,534) (29,543) (30,434) (31,545) (32,444) (33,370) (34,327) (35,660)Finance payments (1,066) (925) (793) (665) (540) (421) (346) (300) (157) (34)
8,338 8,102 8,742 9,122 9,623 9,955 10,540 11,134 11,801 12,026
Receipts:Amounts specifically for new or upgraded assets 1,195 200 200 100 50 50 50 50 50 50Sale of replaced assets 425 283 450 567 499 635 741 655 685 693Sale of Surplus assets 173 0 0 0 0 0 0 0 0 0Net Return of Investmnent securities 0 0 0 0 0 0 0 0 0 0Repayment of loans by community groups 0 0 0 0 0 0 0 0 0 0Payments:Expenditure on renewal/replacement of assets (5,311) (4,709) (5,658) (6,202) (5,996) (7,213) (7,167) (7,378) (7,611) (7,872)Expenditure on new/upgraded assets (3,850) (2,179) (1,651) (2,257) (2,454) (1,230) (1,098) (1,966) (2,484) (1,980)Net Purchases of Investmnent securities 0 0 0 0 0 0 0 0 0 0Loans made to community groups 0 0 0 0 0 0 0 0 0 0
(7,368) (6,405) (6,659) (7,792) (7,901) (7,758) (7,474) (8,639) (9,360) (9,109)
Receipts:Proceeds from borrowings 0 0 0 0 0 0 0 0 0 0Proceeds from internal borrowings (NCPA) 0 0 0 0 0 0 0 0 0 0Proceeds from internal borrowings (CWMS) 1,340 1,000 1,000 900 370 425 50 0 1,270 0Payments:Repayment of borrowings (1,932) (1,981) (2,027) (1,955) (1,858) (1,475) (643) (638) (3,179) (241)Repayment of Finance Lease 0 0 0 0 0 0 0 0 0 0Repayment of internal borrowings (CWMS) (1,340) (1,000) (1,000) (900) (370) (425) (50) 0 (1,270) 0Repayment of internal borrowings (NCPA) 0 0 0 0 0 0 0 0 0 0
(1,932) (1,981) (2,027) (1,955) (1,858) (1,475) (643) (638) (3,179) (241)
(962) (284) 56 (625) (136) 722 2,423 1,857 (738) 2,676
Cash at beginning of period 3,849 2,887 2,603 2,659 2,034 1,898 2,620 5,043 6,900 6,162
2,887 2,603 2,659 2,034 1,898 2,620 5,043 6,900 6,162 8,838 CASH AT END OF PERIOD
Net Increase/(Decrease) in Cash held
A2-3 Consolidated Results: Budgeted Statement of Cash Flows
CASH FLOWS FROM OPERATING ACTIVITIES
Net cash provided by (or used in) Operating Activities
Net cash provided by (or used in) Investment Activities
Net cash provided by (or used in) Financing Activities
CASH FLOW FROM INVESTING ACTIVITIES
CASH FLOWS FROM FINANCING ACTIVITIES
54

Annual Budget and Business Plan 2016-17 | The Barossa Council | Page - 44 of 45
2016-17 2017-18 2018-19 2019-20 2020-21 2021-22 2022-23 2023-24 2024-25 2025-26OB LTFP LTFP LTFP LTFP LTFP LTFP LTFP LTFP LTFP
$ '000 $ '000 $ '000 $ '000 $ '000 $ '000 $ '000 $ '000 $ '000 $ '000
Operating Revenues 36,593 36,869 38,070 39,331 40,598 41,921 43,330 44,804 46,285 47,719less Operating Expenses (35,567) (36,456) (37,577) (38,827) (39,978) (41,374) (42,577) (43,860) (45,101) (46,739)
1,026 413 493 504 620 547 753 944 1,184 980
less Net outlays on existing Assets
Capital expenditure on renewal and replacement of existing assets 5,311 4,709 5,658 6,202 5,996 7,213 7,167 7,378 7,611 7,872
less Depreciation, Amortisation and Impairment (7,510) (7,889) (8,245) (8,614) (8,999) (9,403) (9,782) (10,185) (10,612) (11,040)
less Proceeds from Sale of Replaced Assets (425) (283) (450) (567) (499) (635) (741) (655) (685) (693)(2,624) (3,463) (3,037) (2,979) (3,502) (2,825) (3,356) (3,462) (3,686) (3,861)
less Net outlays on New and Upgraded Assets
Capital expenditure on New and Upgraded Assets 3,850 2,179 1,651 2,257 2,454 1,230 1,098 1,966 2,484 1,980
less Amounts received specifically for New and Upgraded Assets (1,195) (200) (200) (100) (50) (50) (50) (50) (50) (50)
less Proceeds from Sale of Surplus Assets (173) 0 0 0 0 0 0 0 0 02,482 1,979 1,451 2,157 2,404 1,180 1,048 1,916 2,434 1,930
1,168 1,897 2,079 1,326 1,718 2,192 3,061 2,490 2,436 2,911
A2-4 Consolidated Results: Budgeted Uniform Presentation of Finances
Operating Surplus / (Deficit)
Net Lending / (Borrowing) for Financial Year
55

Annual Budget and Business Plan 2016-17 | The Barossa Council | Page - 45 of 45
2016-17 2017-18 2018-19 2019-20 2020-21 2021-22 2022-23 2023-24 2024-25 2025-26OB LTFP LTFP LTFP LTFP LTFP LTFP LTFP LTFP LTFP
$' 000 $' 000 $' 000 $' 000 $' 000 $' 000 $' 000 $' 000 $' 000 $' 000Renewal/Replacement Capital summary: Non-DiscretionaryLand 0 0 0 0 0 0 0 0 0 0Buildings 166 256 229 233 236 539 579 690 700 711Recreation 30 30 30 30 30 30 30 30 30 30Transport - Roads & Footpaths 3,387 3,260 3,422 3,593 3,771 3,959 4,156 4,363 4,580 4,808Stormwater, Bridges & Floodplain 253 300 17 392 0 300 300 300 300 300CWMS 209 80 80 85 87 40 51 111 51 51Equipment - Plant & Vehicles 1,266 783 1,880 1,869 1,872 2,345 2,051 1,884 1,950 1,972Other Assets 0 0 0 0 0 0 0 0 0 0
5,311 4,709 5,658 6,202 5,996 7,213 7,167 7,378 7,611 7,872
New/Upgrade Capital summary: DiscretionaryLand 0 0 0 0 0 0 0 0 0 0Buildings (Inc. Discretionary spend $350k/$400k per year) 503 660 350 350 350 350 350 350 400 400Recreation 516 70 70 70 70 70 70 70 70 70Transport - Roads & Footpaths 1,389 196 204 215 221 228 236 243 252 260Stormwater, Bridges & Floodplain 603 641 615 660 701 320 330 250 250 250CWMS 943 874 685 1,246 1,410 575 436 1,387 1,863 1,370Equipment - Plant & Vehicles 143 0 0 0 0 0 0 0 0 0Other 10 0 0 0 0 0 0 0 0 0
4,107 2,441 1,924 2,541 2,752 1,543 1,422 2,300 2,835 2,350
9,418 7,150 7,582 8,743 8,748 8,756 8,589 9,678 10,446 10,222 Note: includes internal allocations & donated assetsTotal Capital Expenditure
A3 Consolidated Results: Budgeted Capital Expenditure
56