a. general information a1. address...
TRANSCRIPT

A. GENERAL INFORMATION
A1. Address Information
Name of College or University College of Charleston Mailing Address, City/State/Zip 66 George Street, Charleston,
SC 29424
Street Address (if different), City/State/Zip
Main phone (843) 953-5507 WWW Home Page Address http://www.cofc.edu
Admissions Phone Number (843) 953-5670
Admission toll-free number
Admissions Office Mailing Address, City/State/Zip Admissions, 66 George St., Charleston, SC
29424
Admissions Fax number: (843) 953-6322
Admissions E-mail Address: [email protected] Is there a separate URL application site on the Internet? If so, pleasespecify:
A2. Source of institutional control (check one only)
X Public
Private (nonprofit)
Proprietary
A3. Classify your undergraduate institution:
X Coeducational college Men's college
Women's college
A4. Academic year calendar
X Semester 4-1-4
Quarter Continuous (describe):
Trimester Differs by program (describe):
X
Other (describe): 3 week May
interim
session
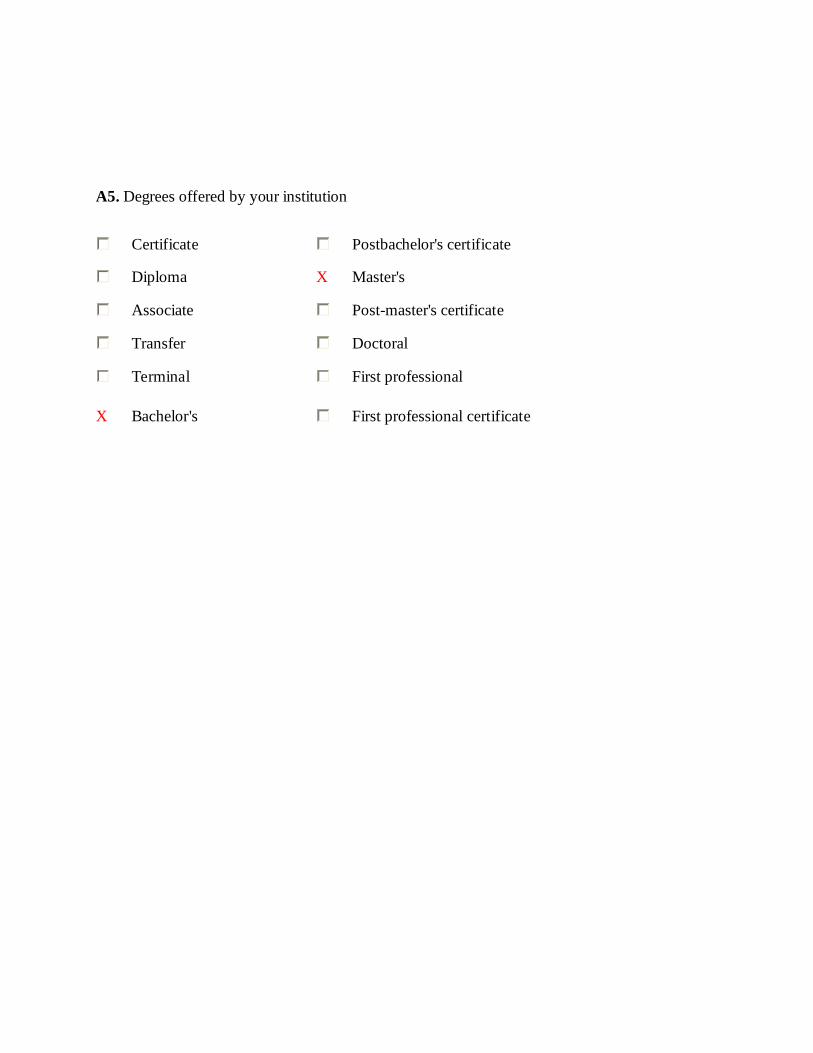
A5. Degrees offered by your institution
Certificate Postbachelor's certificate
Diploma X Master's
Associate Post-master's certificate
Transfer Doctoral
Terminal First professional
X Bachelor's First professional certificate

B. ENROLLMENT AND PERSISTENCE
B1. Institutional Enrollment—Men and WomenProvide numbers of students for each of
the following categories as of the institution’s official fall reporting date or as of October 15,
2000.
FULL-TIME PART-TIME
Men Women Men Women
Undergraduates
Degree-seeking, first-
time freshmen 651 1339 3 8
Other first-year, degree-
seeking 323 393 25 28
All other degree-seeking 2171 3690 261 377
Total degree-seeking 3145 5422 289 413
All other
undergraduates enrolled
in credit courses 43 78 156 204
Total undergraduates 3188 5500 445 617
First-professional
First-time, first-
professional students
All other first-
professionals
Total first-professional
Graduate
Degree-seeking, first-time
24 64 8 31
All other degree-seeking
26 100 57 166
All other graduates enrolled in credit
courses 2 5 132 764
Total graduate 52 169 197 961
Total all undergraduates:9,750________
Total all graduate and professional students: ____1,379_________

GRAND TOTAL ALL STUDENTS: __11,129__________
B2. Enrollment by Racial/Ethnic Category. Provide numbers of undergraduate students for
each of the following categories as of the institution’s official fall reporting date or as of October 15, 2000.
Degree-seeking
First-time First
year
Degree-seeking
Undergraduates Total
Undergraduates
Nonresident aliens 79 163 242
Black, non-Hispanic 221 500 721
American Indian or Alaskan
Native 9 12 21
Asian or Pacific Islander 39 86 125
Hispanic 35 83 118
White, non-Hispanic 2367 5593 7960
Race/ethnicity unknown 20 62 82
Total 2770 6499 9269
Persistence
B3. Number of degrees awarded by your institution from July 1, 1999, to June 30, 2000.
Certificate/diploma _____
Associate degrees _____
Bachelor’s degrees _1,830
Postbachelor’s certificates _____
Master’s degrees _141
Post-master’s certificates _____
Doctoral degrees _____
First professional degrees _____
First professional certificates _____

Graduation Rates
The items in this section correspond to data elements formerly collected by IPEDS or currently collected by the IPEDS Web-based Data Collection System’s Graduation Rate Survey (GRS).For
complete instructions and definitions of data elements, see the IPEDS GRS instructions and
glossary on the 1999 paper-based survey or the 2000 Web-based survey.
For Bachelor’s or Equivalent Programs
Report for the cohort of full-time first-time bachelor’s (or equivalent) degree-seeking undergraduate students who entered in fall 1994. Include in the cohort those who entered your
institution during the summer term preceding fall 1994.
B4. Initial 1994 cohort of first-time, full-time bachelor’s (or equivalent) degree-seeking
undergraduate students; total all students: _____1,616_____________
B5. Of the initial 1994 cohort, how many did not persist and did not graduate for the following reasons: deceased, permanently disabled, armed forces, foreign aid service of the federal
government, or official church missions; total allowable exclusions:
__________0____________
B6. Final 1994 cohort, after adjusting for allowable exclusions: ____1,616___________
(Subtract question B5 from question B4)
B7. Of the initial 1994 cohort, how many completed the program in four years or less (by August 31, 1998): ___517________
B8. Of the initial 1994 cohort, how many completed the program in more than four years but in
five years or less (after August 31, 1998 and by August 31, 1999): ______279___________
B9. Of the initial 1994 cohort, how many completed the program in more than five years but in
six years or less (after August 31, 1999 and by August 31, 2000): ______57________
B10. Total graduating within six years (sum of questions B7, B8, and B9): _____853_________
B11. Six-year graduation rate for 1994 cohort (question B10 divided by question B6):
___52.8_________ %
For Two-Year Institutions:
B12. Initial 1997 cohort, total of first-time, full-time degree/certificate-seeking students:
__________________

B13. Of the initial 1997 cohort, how many did not persist and did not graduate for the
following reasons: deceased, permanently disabled, armed forces, foreign aid service of the federal government, or official church missions; total allowable exclusions:
___________________
B14. Final 1997 cohort, after adjusting for allowable exclusions___________________
(Subtract question B13 from question B12)
B15. Completers of programs of less than two years duration (total): ___________________
B16. Completers of programs of less than two years within 150 percent of normal time:
____________
B17. Completers of programs of at least two but less than four years (total): _______________
B18. Completers of programs of at least two but less than four-years within 150 percent of
normal time: ____________
B19. Total transfers-out (within three years) to other institutions: _________________
B20. Total transfers to two-year institutions: __________________
B21. Total transfers to four-year institutions: __________________
Retention Rates
Report for the cohort of all full-time, first-time bachelor’s (or equivalent) degree-seeking
undergraduate students who entered in fall 1999 (or the preceding summer term). The initial
cohort may be adjusted for students who departed for the following reasons: deceased,
permanently disabled, armed forces, foreign aid service of the federal government or official church missions. No other adjustments to the initial cohort should be made.
B22. For the cohort of all full-time bachelor’s (or equivalent) degree-seeking undergraduate
students who entered your institution as freshmen in fall 1999 (or the preceding summer
term), what percentage was enrolled at your institution as of the date your institution
calculates its official enrollment in fall 2000? ____79.1_____ %

C. FIRST-TIME, FIRST-YEAR (FRESHMAN) ADMISSION
Applications
C1. First-time, first-year (freshman) students: Provide the number of degree-seeking, first-time, first-year students who applied, were admitted, and enrolled (full- or part-time) in fall
2000. Include early decision, early action, and students who began studies during summer in
this cohort. Applicants should include only those students who fulfilled the requirements for
consideration for admission (i.e., who completed actionable applications) and who have been notified of one of the following actions: admission, nonadmission, placement on waiting list,
or application withdrawn (by applicant or institution). Admitted applicants should include
wait-listed students who were subsequently offered admission.
Total first-time, first-year (freshman) men who applied ___2809___
Total first-time, first-year (freshman) women who applied ___5148___
Total first-time, first-year (freshman) men who were admitted ___1777___
Total first-time, first-year (freshman) women who were admitted ___3546___
Total full-time, first-time, first-year (freshman) men who enrolled ____651___
Total part-time, first-time, first-year (freshman) men who enrolled ______3___
Total full-time, first-time, first-year (freshman) women who enrolled ___1339___
Total part-time, first-time, first-year (freshman) women who enrolled ______8___
C2. Freshman wait-listed students (students who met admission requirements but whose
final admission was contingent on space availability)
Do you have a policy of placing students on a waiting list? Yes No
If yes, please answer the questions below for fall 2000 admissions:

Number of qualified applicants placed on waiting list _____
Number accepting a place on the waiting list _____
Number of wait-listed students admitted _____
Admission Requirements
C3. High school completion requirement
Check the appropriate box to identify your high school completion requirement for degree-seeking entering students:
High school diploma is required and GED is accepted
High school diploma is required and GED is not accepted
High school diploma or equivalent is not required
C4. Does your institution require or recommend a general college-preparatory program for
degree-seeking students?
Require
Recommend
Neither require nor recommend

C5. Distribution of high school units required and/or recommended. Specify the distribution
of academic high school course units required and/or recommended of all or most degree-seeking students using Carnegie units (one unit equals one year of study or its equivalent). If
you use a different system for calculating units, please convert.
Units Required Units
Recommended
Total academic units 20
English 4
Mathematics 3 4
Science 3
Of these, units that must be
lab 3
Foreign language 2 3
Social studies 3
History 2
Academic electives 4
Other (specify)
Basis for Selection
C6. Do you have an open admission policy, under which virtually all secondary school graduates
or students with GED equivalency diplomas are admitted without regard to academic record,
test scores, or other qualifications? If so, check which applies:
Open admission policy as described above for all students ___
Open admission policy as described above for most students, but
selective admission for out-of-state students ___
selective admission to some programs ___
other (explain)
_______________________________________________________

C7. Relative importance of each of the following academic and nonacademic factors in your
first-time, first-year, degree-seeking (freshman) admission decisions.
Very Important
Important Considered Not
Considered
Academic
Secondary school record
Class rank
Recommendation(s)
Standardized test scores
Essay
Nonacademic
Interview
Extracurricular activities
Talent/ability
Character/personal qualities
Alumni/ae relation
Geographical residence
State residency
Religious
affiliation/commitment
Minority status
Volunteer work
Work experience
SAT and ACT Policies
C8. Entrance exams
A. Does your institution make use of SAT I, SAT II, or ACT scores in admission decisions for
first-time, first-year, degree-seeking applicants? Yes No
If yes, place check marks in the appropriate boxes below to reflect your institution’s policies for use in admission.

ADMISSION
Require Recommend Require for Some
Consider If Submitted
Not Used
SAT I
ACT
SAT I or ACT (no preference)
SAT I or ACT--SAT I preferred
SAT I or ACT--ACT preferred
SAT I and SAT II
SAT I and SAT II or ACT
SAT II
In addition, does your institution use applicants' test scores for placement or counseling?
Placement Yes No
Counseling Yes No
B. Does your institution use the SAT I or II or the ACT for placement only? If so, please mark
the appropriate boxes below:
PLACEMENT
Require Recommend Require for
some SAT I
SAT II
ACT
SAT I or ACT
C. Latest date by which SAT I or ACT scores must be received for fall-term admission_June
1st_
Latest date by which SAT II scores must be received for fall-term admission_N/A_____
D. If necessary, use this space to clarify your test policies (e.g., if tests are recommended for
some students, or if tests are not required of some students): _____________________________________________________________________

Freshman Profile
Provide percentages for ALL enrolled, degree-seeking, full-time and part-time, first-time,
first-year (freshman) students enrolled in fall 2000, including students who began studies during summer, international students/nonresident aliens, and students admitted under special
arrangements.
C9. Percent and number of first-time, first-year (freshman) students enrolled in fall 2000
who submitted national standardized (SAT/ACT) test scores. Include information for
ALL enrolled, degree-seeking, first-time, first-year (freshman) students who submitted test scores. Do not include partial test scores (e.g., mathematics scores but not verbal for a
category of students) or combine other standardized test results (such as TOEFL) in this item.
SAT scores should be recentered scores. The 25th percentile is the score that 25 percent
scored at or below; the 75th percentile score is the one that 25 percent scored at or above.
Percent submitting SAT scores _88.9% Number submitting SAT scores _1651_
Percent submitting ACT scores _31.1% Number submitting ACT scores
_ 575_
25th
Percentile
75th
Percentile
SAT I Verbal 540 630
SAT I Math 530 620
ACT Composite
22 26
ACT English
ACT Math
Percent of first-time, first-year (freshman) students with scores in each range:
SAT I
Verbal
SAT I
Math
700-800 5.9 3.3
600-699 34.0 31.3
500-599 53.5 56.5
400-499 6.3 8.6
300-399 0.3 0.2
200-299 0 0.1

ACT
Composite ACT English ACT Math
30-36 5.2
24-29 47.5
18-23 45.2
12-17 2.1
6-11 0
Below 6 0
C10. Percent of all degree-seeking, first-time, first-year (freshman) students who had
high school class rank within each of the following ranges (report information for those
students from whom you collected high school rank information).
Percent in top tenth of high school graduating class __ 27.0%
Percent in top quarter of high school graduating class 61.8%
Percent in top half of high school graduating class___ 91.1%
Percent in bottom half of high school graduating class 8.9%
Percent in bottom quarter of high school graduating class 0.8%
Percent of total first-time, first-year (freshman) students who submitted high school class
rank: __83.6%_____
C11. Percentage of all enrolled, degree-seeking, first-time, first-year (freshman) students
who had high school grade-point averages within each of the following ranges (using 4.0
scale). Report information only for those students from whom you collected high school
GPA.
Percent who had GPA of 3.0 and higher _87.4%____
Percent who had GPA between 2.0 and 2.99 _12.5%____
Percent who had GPA between 1.0 and 1.99 __0.1%___
Percent who had GPA below 1.0 ___0__

C12. Average high school GPA of all degree-seeking, first-time, first-year (freshman)
students who submitted GPA: _3.46____
Percent of total first-time, first-year (freshman) students who submitted high school GPA: _80.7%
Admission Policies
C13. Application fee
Does your institution have an application fee? Yes No
Amount of application fee: __$35.00________
Can it be waived for applicants with financial need? Yes No
C14. Application closing date
Does your institution have an application closing date? Yes No
Application closing date (fall): __June 1st________
Priority date: _April 1st_________
C15. Are first-time, first-year students accepted for terms other than the fall?
Yes No
C16. Notification to applicants of admission decision sent (fill in one only)
On a rolling basis beginning (date): __________
By (date): __________
Other: __________

C17. Reply policy for admitted applicants (fill in one only)
Must reply by (date): __________
No set date: __________
Must reply by May 1 or within _2__ weeks if notified thereafter
Other: __________
C18. Deferred admission: Does your institution allow students to postpone enrollment after
admission?
Yes No
If yes, maximum period of postponement: _1 semester______
C19. Early admission of high school students: Does your institution allow high school students to enroll as full-time, first-time, first-year (freshman) students one year or more
before high school graduation? Yes No
C20. Common application: Will you accept the Common Application distributed by the
National Association of Secondary School Principals if submitted? Yes No
If “yes,” are supplemental forms required? Yes No
Is your college a member of the Common Application Group? Yes No

Early Decision and Early Action Plans
C21. Early decision: Does your institution offer an early decision plan (an admission plan that
permits students to apply and be notified of an admission decision well in advance of the
regular notification date and that asks students to commit to attending if accepted) for first-
time, first-year (freshman) applicants for fall enrollment? Yes No
If “yes,” please complete the following:
First or only early decision plan closing date __________
First or only early decision plan notification date __________
Other early decision plan closing date __________
Other early decision plan notification date __________
For the Fall 2000 entering class:
Number of early decision applications received by your institution __________
Number of applicants admitted under early decision plan __________
Please provide significant details about your early decision plan: ___________________________________________
___________________________________________________________________________
_____________________
C22. Early action: Do you have a nonbinding early action plan whereby students are notified of
an admission decision well in advance of the regular notification date but do not have to commit to attending your college?
Yes No
If “yes,” please complete the following:
Early action closing date __________
Early action notification date __________

D. TRANSFER ADMISSION
Fall Applicants
D1. Does your institution enroll transfer students? Yes No
(If no, please skip to Section E)
If yes, may transfer students earn advanced standing credit by transferring credits earned
from course work completed at other colleges/universities? Yes No
D2. Provide the number of students who applied, were admitted, and enrolled as degree-seeking
transfer students in fall 2000.
Applicants Admitted
Applicants
Enrolled
Applicants
Men 664 441 227
Women 972 671 354
Total 1636 1112 581
Application for Admission
D3. Indicate terms for which transfers may enroll:
Fall Winter Spring Summer
D4. Must a transfer applicant have a minimum number of credits completed or else must
apply as an entering freshman?
Yes No

If yes, what is the minimum number of credits and the unit of measure? 30 hours
D5. Indicate all items required of transfer students to apply for admission:
Required
of All
Recommended
of All
Recommended
of Some
Required
of Some
Not
required
High school
transcript
< 30
hours
College
transcript(s) X
Essay or
personal
statement
X
Interview X
Standardized
test scores
< 30
hours
Statement of
good standing
from prior
institution(s)
X
D6. If a minimum high school grade point average is required of transfer applicants, specify
(on a 4.0 scale): N/A
D7. If a minimum college grade point average is required of transfer applicants, specify
(on a 4.0 scale): 2.5 for in-state, 2.8 for out-of-state
D8. List any other application requirements specific to transfer applicants:
GPA must be from all colleges attended
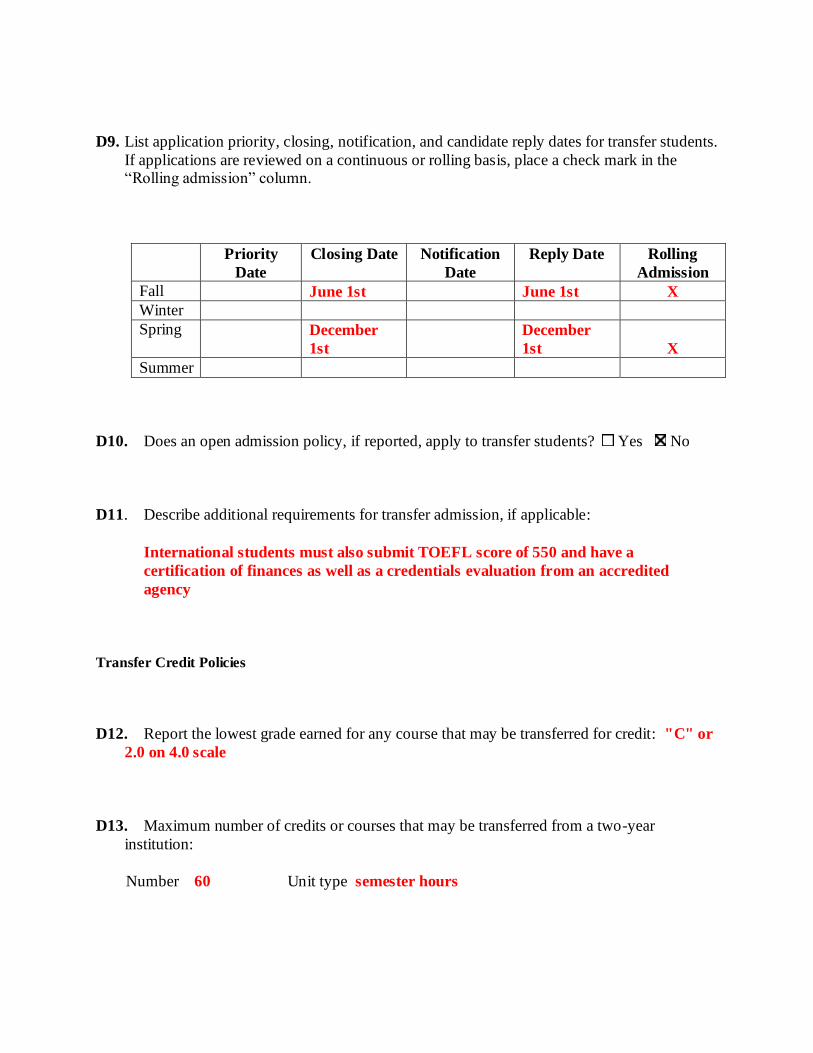
D9. List application priority, closing, notification, and candidate reply dates for transfer students.
If applications are reviewed on a continuous or rolling basis, place a check mark in the “Rolling admission” column.
Priority
Date
Closing Date Notification
Date
Reply Date Rolling
Admission
Fall June 1st June 1st X
Winter
Spring December
1st
December
1st X
Summer
D10. Does an open admission policy, if reported, apply to transfer students? Yes No
D11. Describe additional requirements for transfer admission, if applicable:
International students must also submit TOEFL score of 550 and have a
certification of finances as well as a credentials evaluation from an accredited
agency
Transfer Credit Policies
D12. Report the lowest grade earned for any course that may be transferred for credit: "C" or
2.0 on 4.0 scale
D13. Maximum number of credits or courses that may be transferred from a two-year
institution:
Number 60 Unit type semester hours

D14. Maximum number of credits or courses that may be transferred from a four-year
institution:
Number 92 Unit type semester hours
D15. Minimum number of credits that transfers must complete at your institution to earn an
associate degree: ____________
D16. Minimum number of credits that transfers must complete at your institution to earn a
bachelor’s degree: 30 semester hours
D17. Describe other transfer credit policies:
Pass/fail grades may be granted credit if the home institution will certify in writing
that the "pass" grade is equivalent to a grade of "C" or "2.0 on a 4.0 scale"

E. ACADEMIC OFFERINGS AND POLICIES
E1. Special study options: Identify those programs available at your institution. Refer to the
glossary for definitions.
Accelerated program Honors program
Cooperative (work-study)
program
Independent study
Cross-registration Internships Distance learning Liberal arts/career
combination
Double major Student-designed major
Dual enrollment Study abroad English as a Second Language
(ESL)
Teacher certification
program
Exchange student program
(domestic)
Weekend college
External degree program
Other (specify): Semester at Sea
E2. Has been removed from the CDS.
E3. Areas in which all or most students are required to complete some course work prior to
graduation:
Arts/fine arts Humanities
Computer literacy Mathematics
English (including
composition)
Philosophy
Foreign languages Sciences (biological or
physical)
History Social science
Other (describe):

Library Collections
Report the number of holdings. Refer to the 1998 IPEDS Academic Libraries Survey, Part D, for
corresponding equivalents.
Because IPEDS is not collecting data in Fall 2000, the College has supplied data for 2000
below, in place of the 1998 Libraries Survey data.
E4. Books, serial backfiles, electronic documents, and government documents (titles) that are
accessible through the library’s catalog 375,440
(sum of lines 27 and 29, column 2)
E5. Current serial subscriptions (paper, microform, electronic): 3,194 (sum of lines 30 and 31, column 2)
E6. Microforms (units) : 748,781 (line 28, column 2)
E7. Audiovisual materials (units): 4,901 (line 32, column 2)

F. STUDENT LIFE
F1. Percentages of first-time, first-year (freshman) students and all degree-seeking
undergraduates enrolled in fall 2000 who fit the following categories:
First-time, first-year
(freshman) students Undergraduates
Percent who are from out of state (exclude
international/nonresident aliens)
41.9% 36.9%
Percent of men who join
fraternities 13.7% 15.1%
Percent of women who join
sororities 16.1% 18.7%
Percent who live in college-
owned, -operated, or -affiliated housing
70.9% 21.8%
Percent who live off campus or
commute 29.1% 78.2%
Percent of students age 25 and
older 0.1% 8.4%
Average age of full-time
students 18.2 20.5
Average age of all students
(full- and part-time) 18.2 21.0
F2. Activities offered Identify those programs available at your institution.
Choral groups Marching band Student government
Concert band Music ensembles Student newspaper
Dance Musical theater Student-run film society
Drama/theater Opera Symphony orchestra Jazz band Pep band Television station
Literary magazine Radio station Yearbook

F3. ROTC (program offered in cooperation with Reserve Officers’ Training Corps)
Army ROTC is offered:
On campus
At cooperating institution (name): ______________________________________________________
Naval ROTC is offered:
On campus
At cooperating institution (name): ______________________________________________________
Air Force ROTC is offered:
On campus
At cooperating institution (name): Charleston Southern University
F4. Housing: Check all types of college-owned, -operated, or -affiliated housing available for undergraduates at your institution.
Coed dorms Special housing for disabled students Men’s dorms Special housing for international students
Women’s dorms Fraternity/sorority housing
Apartments for married
students
Cooperative housing
Apartments for single
students
Other housing options (specify): Restored old Charleston houses used as residence
halls, some with kitchen facilities in suites. International student houses.

G. ANNUAL EXPENSES
Provide 2001-2002 academic year costs for the following categories that are applicable to
your institution.
G1. Undergraduate full-time tuition, required fees, room and board
List the typical tuition, required fees, and room and board for a full-time undergraduate student
for the FULL 2001-2002 academic year. A full academic year refers to the period of time generally extending from September to June; usually equated to two semesters or trimesters,
three quarters, orthe period covered by a four-one-four plan. Room and board is defined as
double occupancy and 19 meals per week or the maximum meal plan. Required fees include only
charges that all full-time students must pay that are not included in tuition (e.g., registration, health, or activity fees.) Do not include optional fees (e.g., parking, laboratory use).
First-year Undergraduates
Private Institutions:
Public Institutions
In-district: 3,780 3,780
In-state (out-of-
district): 3,780 3,780
Out-of-state: 8,540 8,540
Nonresident Aliens:
8,540 8,540
Required Fees: 0 0
Room and Board: (on-campus)
4,570 4,570
Room Only:
(on-campus) 2,950 2,950
Board Only:
(on-campus meal plan)
1,620 1,620
Comprehensive tuition/room/board fee (if your college cannot provide
separatetuition/room/board/fees):
Other:

G2. Number of credits per term a student can take for the statedfull-time tuition: 12
minimum 21maximum
G3. Do tuition and fees vary by year of study (e.g., sophomore, junior,senior)? Yes No X
G4. If tuition and fees vary by undergraduate instructional program,describe briefly:
G5. Provide the estimated expenses for a typical full-time undergraduatestudent:
Residents
Commuters
(living at home)
Commuters
(not living at home)
Books and
supplies: 842 842 842
Room only: 7,634
Board only:
Transportation: 977 1,923 1,923
Other expenses:
2,944 2,944 2,944
G6. Undergraduate per-credit-hour charges:
Private Inststutions:
Public Inststutions: In-district: 157
In-state (out-of-district): 157
Out-of-state: 356
Nonresident Aliens: 356

I. INSTRUCTIONAL FACULTY AND CLASS SIZE
I-1. Please report number of instructional faculty members in each category for Fall 2000.
The following definition of instructional faculty is used by the American Association of University
Professors (AAUP) in its annual Faculty Compensation Survey. Instructional Faculty is defined as those
members of the instructional-research staff whose major regular assignment is instruction, including those
with released time for research. Institutions are asked to EXCLUDE:
(a) instructional faculty in preclinical and clinical medicine
(b) administrative officers with titles such as dean of students, librarian, registrar, coach, and the like,
even though they may devote part of their time to classroom instruction and may have faculty status,
(c) undergraduate or graduate students who assist in the instruction of courses, but have titles such as
teaching assistant, teaching fellow, and the like
(d) faculty on leave without pay, and
(e) replacement faculty for faculty on sabbatical leave.
Full-time: faculty employed on a full-time basis
Part-time: faculty teaching less than two semesters, three quarters, two trimesters, or two four-month
sessions. Also includes adjuncts and part-time instructors.
Minority faculty: includes faculty who designate themselves as black, non-Hispanic; American Indian or
Alaskan native; Asian or Pacific Islander; or Hispanic.
Doctorate: includes such degrees as Doctor of Education, Doctor of Juridical Science, Doctor of Public
Health, and Doctor of Philosophy degree in any field such as agronomy, food technology, education,
engineering, public administration, ophthalmology, or radiology.
First-professional: includes the fields of dentistry (DDS or DMD), medicine (MD), optometry (OD),
osteopathic medicine (DO), pharmacy (DPharm or BPharm), podiatric medicine (DPM), veterinary
medicine (DVM), chiropractic (DC or DCM), law (JD) and theological professions (MDiv, MHL).
Terminal degree: the highest degree in a field: example, M. Arch (architecture) and MFA (master of fine
arts).

Full-time Part-time Total
a.) Total number of instructional faculty 512 241 753
b.) Total number who are members of
minority groups 68 26 94
c.) Total number who are women 216 135 351
d.) Total number who are men 296 106 402
e.) Total number who are nonresident
aliens (international) 26 3 29
f.) Total number with doctorate, first
professional, or other terminal degree 391 94 485
g.) Total number whose highest degree is
a master’s but not a terminal master’s 114 121 235
h.) Total number whose highest degree is
a bachelor’s 7 26 33
i.) Total number whose highest degree is
unknown or other (Note: Items f,
g, h, and i must sum up to item a.)
0 0 0
I-2. Student to Faculty Ratio
Report the Fall 2000 ratio of full-time equivalent students (full-time plus 1/3 part time) to full-time
equivalent instructional faculty (full time plus 1/3 part time). In the ratio calculations, exclude both
faculty and students in stand-alone graduate or professional programs such as medicine, law, veterinary,
dentistry, social work, business, or public health in which faculty teach virtually only graduate level
students. Do not count undergraduate or graduate student teaching assistants as faculty.
Fall 2000 Student to Faculty ratio: 18 to 1.
I-3. Undergraduate Class Size
In the table below, please use the following definitions to report information about the size of classes and
class sections offered in the Fall 2000 term.
Class Sections: A class section is an organized course offered for credit, identified by discipline and
number, meeting at a stated time or times in a classroom or similar setting, and not a subsection such as a
laboratory or discussion session. Undergraduate class sections are defined as any sections in which at
least one degree-seeking undergraduate student is enrolled for credit. Exclude distance learning classes
and noncredit classes and individual instruction such as dissertation or thesis research, music instruction,
or one-to-one readings. Exclude students in independent study, co-operative programs, internships,
foreign language taped tutor sessions, practicums, and all students in one-on-one classes. Each class
section should be counted only once and should not be duplicated because of course catalog cross-listings.
Class Subsections: A class subsection includes any subsection of a course, such as laboratory, recitation,
and discussion subsections that are supplementary in nature and are scheduled to meet separately from the
lecture portion of the course. Undergraduate subsections are defined as any subsections of courses in
which degree-seeking undergraduate students enrolled for credit. As above, exclude noncredit classes and
individual instruction such as dissertation or thesis research, music instruction, or one-to-one readings.
Each class subsection should be counted only once and should not be duplicated because of cross-listings.
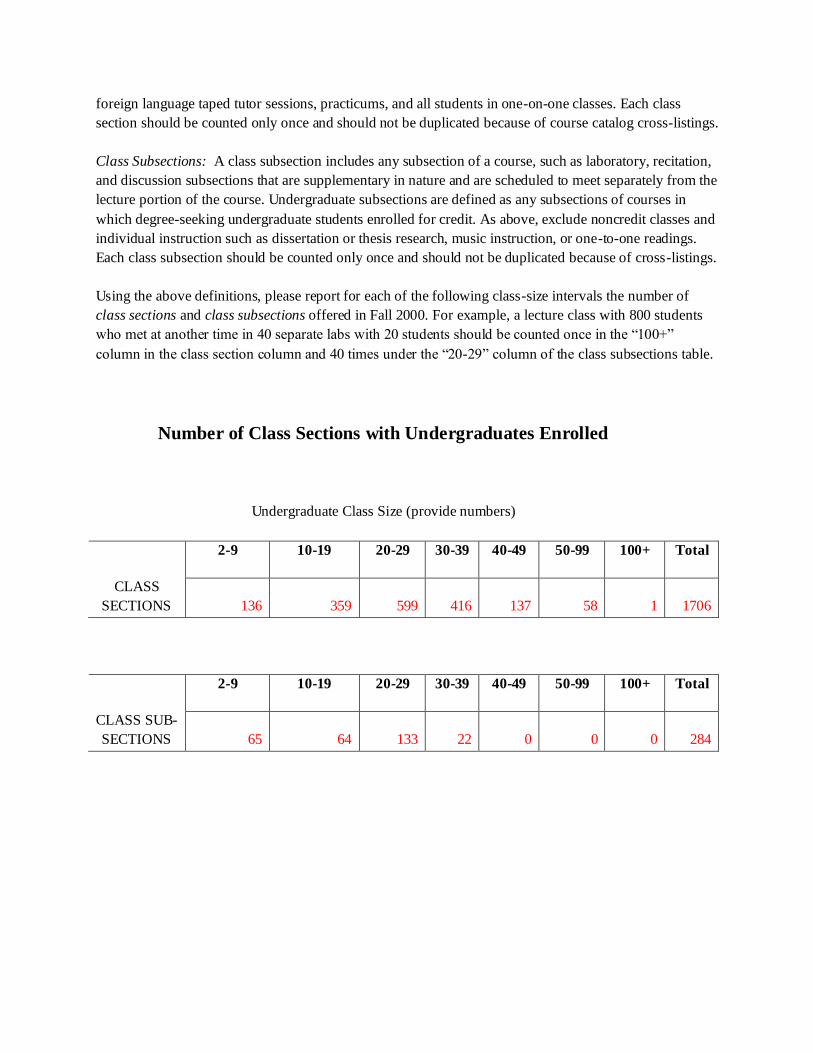
Using the above definitions, please report for each of the following class-size intervals the number of
class sections and class subsections offered in Fall 2000. For example, a lecture class with 800 students
who met at another time in 40 separate labs with 20 students should be counted once in the “100+”
column in the class section column and 40 times under the “20-29” column of the class subsections table.
Number of Class Sections with Undergraduates Enrolled
Undergraduate Class Size (provide numbers)
2-9 10-19 20-29 30-39 40-49 50-99 100+ Total
CLASS
SECTIONS 136 359 599 416 137 58 1 1706
2-9 10-19 20-29 30-39 40-49 50-99 100+ Total
CLASS SUB-
SECTIONS 65 64 133 22 0 0 0 284

J. DEGREES CONFERRED
Degrees conferred between July 1, 1999 and June 30, 2000
Reference: IPEDS Completions, Part A
For each of the following discipline areas, provide the percentage of diplomas/certificates, associate, and bachelor’s
degrees awarded.
Category Diploma/
certificates Associate Bachelor’s CIP categories to
include here
Agriculture 1 and 2
Architecture 4
Area and ethnic studies 5
Biological/life sciences 9.6% 26
Business/marketing 16.6% 8 and 52
Communications/communication
technologies
13.7% 9 and 10
Computer and information
sciences
2.2% 11
Education 11.0% 13
Engineering/engineering
technologies
14 and 15
English 3.2% 23
Foreign languages and literature 3.4% 16
Health professions and related sciences
0.1%
51
Home economics and vocational
home economics
19 and 20
Interdisciplinary studies 1.2% 30
Law/legal studies 22

Liberal arts/general studies 24
Library science 25
Mathematics 1.0% 27
Military science and technologies 28 and 29
Natural resources/environmental
science
3
Parks and recreation 31
Personal and miscellaneous
services
12
Philosophy, religion, theology 1.0% 38 and 39
Physical sciences 4.3% 40 and 41
Protective services/public
administration
43 and 44
Psychology 8.5% 42
Social sciences and history 15.8% 45
Trade and industry 46, 47, 48, and 49
Visual and performing arts 8.4% 50
Other
TOTAL 100% 100% 100%