a. general motors paint appearance/performance … · page 1 a. general motors paint...
TRANSCRIPT
Page 1
A. GENERAL MOTORS PAINT APPEARANCE/PERFORMANCE TEST AND RESISTANCE SPOT WELDABILITY TESTS - 2013
1.0 Introduction and Discussion An EPS Producer sought to gain approval from General Motors to supply EPS for select automotive applications. This producer coordinated several laboratory tests of EPS samples in the areas of paint appearance and performance, plus spot weldability. The accredited testing laboratory ACT of Hillsdale, Michigan performed the paint-related tests during 2013. ACT prepared the samples and conducted the tests in accordance with appropriate GM standards. The welding research and testing firm Applied Engineering and Integration, Inc. (AET Integration) performed the resistance spot welding tests and analyses in accordance with GM Welding Specification GWS-5A. The pages that follow provide the actual test reports from ACT and AET Integration. From the results of these tests, EPS received approval from GM as a replacement of acid pickled for an end use product application.
273 Industrial Dr. Hillsdale, MI 49242 Phone: (517) 439-1485 Fax: (517) 439-1652
Page 2
ACT reports are for the exclusive use of the client to whom they are addressed, and shall not be reproduced except in full, without written authorization from ACT. The tests done on the requested and/or specified number of samples may or may not constitute a representative sampling.
www.acttespanels.com
GM Paint Appearance Study
Test Substrate: Customer Supplied Hot Rolled Steel
Pretreatment: Henkel Tectalis Ecoat: BASF U32AD800 Primer: BASF U28AW110 Base Coat: BASF E54KW401 Clear Coat: BASF E10CG081
ACT Quote Number: QC19940_020113 ACT Project Number: SO219433A
Material Received: 12/18/12 Test Date: 03/06/13
Prepared By: KWW Date Prepared: 03/06/13 Logbook: KWW-3, p. 52
APPROVED BY:
Kevin Wendt Technical Manager
Signed for and on behalf of ACT Test Panels LLC
273 Industrial Dr. Hillsdale, MI 49242 Phone: (517) 439-1485 Fax: (517) 439-1652
LABORATORY TEST REPORT ACT PROJECT SO219433A
Page 3 ACT reports are for the exclusive use of the client to whom they are addressed, and shall not be reproduced except in full, without written authorization from ACT. The tests done on the requested and/or specified number of samples may or may not constitute a representative sampling.
www.acttestpanels.com
Pretreatment Application: Henkel Applied Tectalis. Ecoat Application: ACT Test Panels LLC applied BASF Ecoat per manufacturers
requirements.
Paint Application: ACT Test Panels LLC applied BASF Primer and BC/CC per manufacturers requirements.
Evaluation #1: BYK Wavescan
Test Method: ACT WIL-0151 (07/28/08)
Number of Samples: One customer HRS topcoated flat panel. One customer HRS topcoated pie plate. One ACT CRS topcoated flat panel (control).
Number of Readings: Three longitudinal and three transverse per sample; average rating reported for each direction.
Instrument: BYK Gardner Wave-scan Dual Model 4840 (LEQP 0002)
Ratings: du,Wa, Wb, Wc, Wd, We, SW, LW, Rating (R)
Rating Description: du = < 0.1 mm wavelength Wa = 0.1-0.3 mm wavelength Wb = 0.3-1 mm wavelength Wc = 1-3 mm wavelength Wd = 3-10 mm wavelength We = 10-30 mm wavelength SW = 0.3-1.2 mm wavelength LW = 1.2-12 mm wavelength Rating (R) = Orange peel based on ACT Orange Peel Standards
Evaluation #2: Surface Roughness using Profilometer
Test Method: ANSI ASME B46.1 (2002) Section 4
Number of Samples: One customer HRS Ecoated flat panel. One customer HRS Ecoated pie plate. One ACT CRS Ecoated flat panel (control).
Number of Readings: Three longitudinal and three transverse per sample; average Ra reported for each direction.
Instrument (Skidded): Taylor Hobson Model Surtronic 3+
273 Industrial Dr. Hillsdale, MI 49242 Phone: (517) 439-1485 Fax: (517) 439-1652
LABORATORY TEST REPORT ACT PROJECT SO219433A
Page 4 ACT reports are for the exclusive use of the client to whom they are addressed, and shall not be reproduced except in full, without written authorization from ACT. The tests done on the requested and/or specified number of samples may or may not constitute a representative sampling.
www.acttestpanels.com
Stylus Radius: 10 microns
Filter: Gaussian
Cut-off Length (Lc): 0.80 millimeters
Evaluation Length (Ln): 25.4 millimeters
Ra: Roughness Average in micro inches (µin)
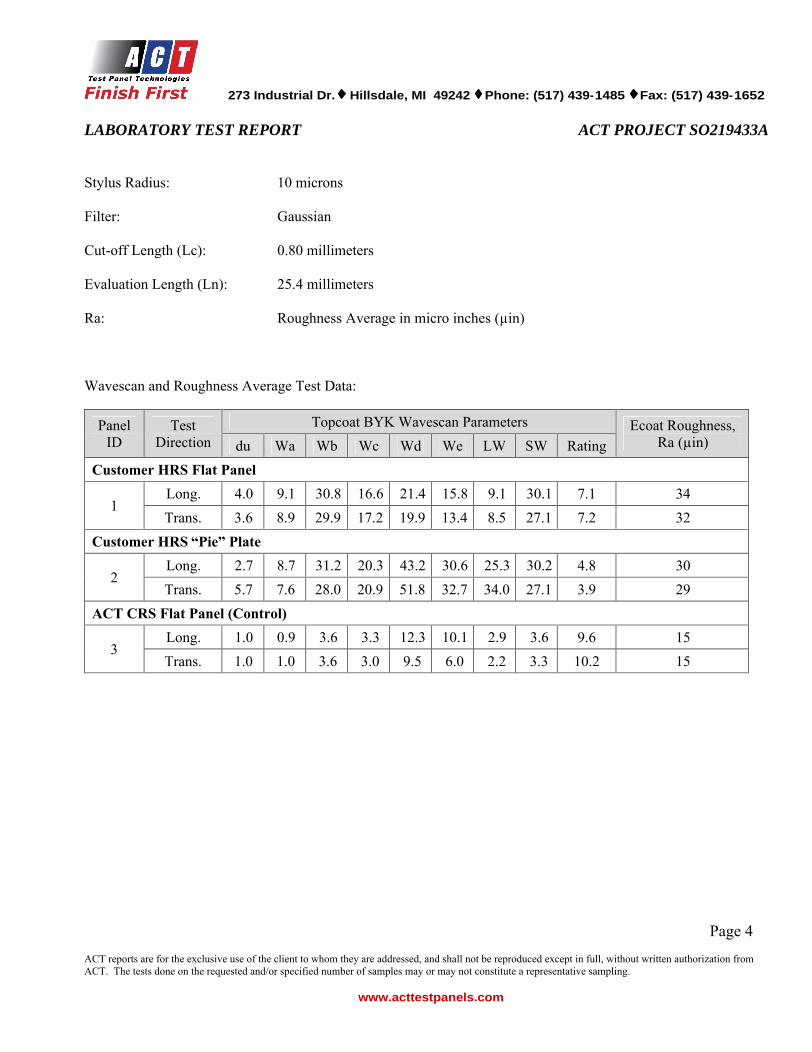
Wavescan and Roughness Average Test Data:
Panel ID
Test Direction
Topcoat BYK Wavescan Parameters Ecoat Roughness, Ra (µin) du Wa Wb Wc Wd We LW SW Rating
Customer HRS Flat Panel
1 Long. 4.0 9.1 30.8 16.6 21.4 15.8 9.1 30.1 7.1 34 Trans. 3.6 8.9 29.9 17.2 19.9 13.4 8.5 27.1 7.2 32
Customer HRS Pie Plate
2 Long. 2.7 8.7 31.2 20.3 43.2 30.6 25.3 30.2 4.8 30 Trans. 5.7 7.6 28.0 20.9 51.8 32.7 34.0 27.1 3.9 29
ACT CRS Flat Panel (Control)
3 Long. 1.0 0.9 3.6 3.3 12.3 10.1 2.9 3.6 9.6 15 Trans. 1.0 1.0 3.6 3.0 9.5 6.0 2.2 3.3 10.2 15

273 Industrial Dr. Hillsdale, MI 49242 Phone: (517) 439-1485 Fax: (517) 439-1652
Page 5
ACT reports are for the exclusive use of the client to whom they are addressed, and shall not be reproduced except in full, without written authorization from ACT. The tests done on the requested and/or specified number of samples may or may not constitute a representative sampling.
www.acttestservices.com
GM Paint Performance Testing
Test Substrate: Customer Supplied Hot Rolled Steel
Pretreatment: Henkel Tectalis Ecoat: BASF U32AD800 Primer: BASF U28AW110 Base Coat: BASF E54KW401 Clear Coat: BASF E10CG081
ACT Quote Number: QC19940_020113 ACT Project Number: SO219433B
Material Received: 12/18/12
Prepared By: MDC Date Prepared: 04/16/13
Logbook: MDC-15, pp. 28-29
APPROVED BY:
Kevin Wendt Technical Manager
Signed for and on behalf of ACT Test Services
273 Industrial Dr. Hillsdale, MI 49242 Phone: (517) 439-1485 Fax: (517) 439-1652
LABORATORY TEST REPORT ACT PROJECT SO219433B
Page 6 ACT reports are for the exclusive use of the client to whom they are addressed, and shall not be reproduced except in full, without written authorization from ACT. The tests done on the requested and/or specified number of samples may or may not constitute a representative sampling.
www.acttestservices.com
Pretreatment Application: Henkel Applied Tectalis. Ecoat Application: ACT Test Panels LLC applied BASF Ecoat per manufacturers
requirements.
Paint Application: ACT Test Panels LLC applied BASF Primer and BC/CC per manufacturers requirements.
ID Matrix: #1 = Flat Hot Rolled Steel #2 = Pie Plate Hot Rolled Steel
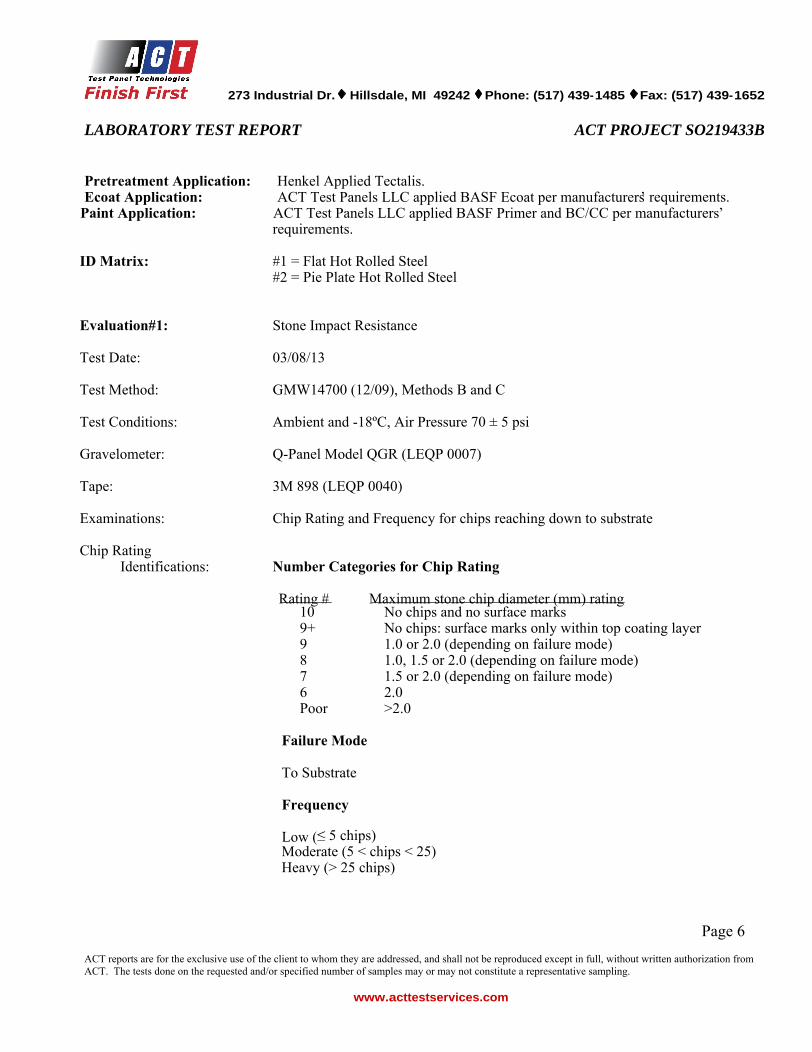
Evaluation#1: Stone Impact Resistance
Test Date: 03/08/13
Test Method: GMW14700 (12/09), Methods B and C
Test Conditions: Ambient and -18ºC, Air Pressure 70 ± 5 psi
Gravelometer: Q-Panel Model QGR (LEQP 0007)
Tape: 3M 898 (LEQP 0040)
Examinations: Chip Rating and Frequency for chips reaching down to substrate
Chip Rating Identifications: Number Categories for Chip Rating
Rating # Maximum stone chip diameter (mm) rating
10 No chips and no surface marks 9+ No chips: surface marks only within top coating layer 9 1.0 or 2.0 (depending on failure mode) 8 1.0, 1.5 or 2.0 (depending on failure mode) 7 1.5 or 2.0 (depending on failure mode) 6 2.0 Poor >2.0
Failure Mode
To Substrate
Frequency
Low ( 5 chips) Moderate (5 < chips < 25) Heavy (> 25 chips)
273 Industrial Dr. Hillsdale, MI 49242 Phone: (517) 439-1485 Fax: (517) 439-1652
LABORATORY TEST REPORT ACT PROJECT SO219433B
Page 7 ACT reports are for the exclusive use of the client to whom they are addressed, and shall not be reproduced except in full, without written authorization from ACT. The tests done on the requested and/or specified number of samples may or may not constitute a representative sampling.
www.acttestservices.com
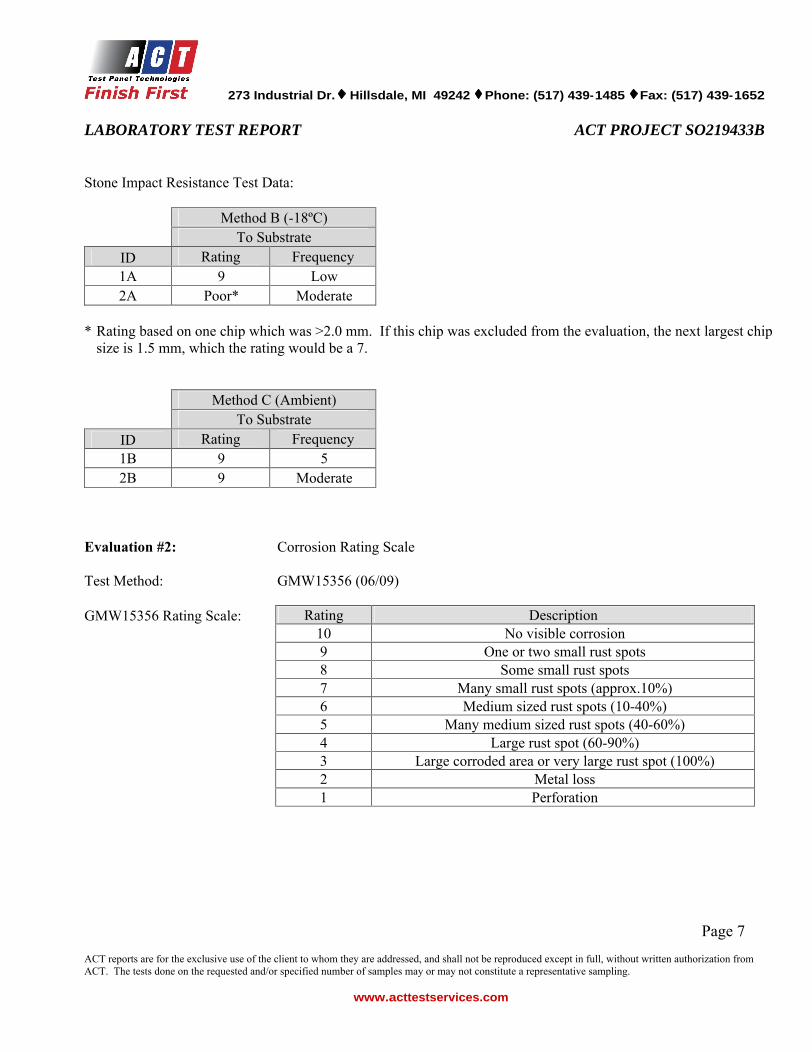
Stone Impact Resistance Test Data:
Method B (-18ºC) To Substrate
ID Rating Frequency 1A 9 Low 2A Poor* Moderate
* Rating based on one chip which was >2.0 mm. If this chip was excluded from the evaluation, the next largest chip size is 1.5 mm, which the rating would be a 7.
Method C (Ambient) To Substrate
ID Rating Frequency 1B 9 5 2B 9 Moderate
Evaluation #2: Corrosion Rating Scale
Test Method: GMW15356 (06/09)
GMW15356 Rating Scale: Rating Description
10 No visible corrosion
9 One or two small rust spots
8 Some small rust spots
7 Many small rust spots (approx.10%)
6 Medium sized rust spots (10-40%)
5 Many medium sized rust spots (40-60%)
4 Large rust spot (60-90%)
3 Large corroded area or very large rust spot (100%)
2 Metal loss
1 Perforation

273 Industrial Dr. Hillsdale, MI 49242 Phone: (517) 439-1485 Fax: (517) 439-1652
LABORATORY TEST REPORT ACT PROJECT SO219433B
Page 8 ACT reports are for the exclusive use of the client to whom they are addressed, and shall not be reproduced except in full, without written authorization from ACT. The tests done on the requested and/or specified number of samples may or may not constitute a representative sampling.
www.acttestservices.com
Evaluation #3: Corrosion/Undercutting Scribe Creepback
Test Method: GMW15282 (10/12)
Scribing Tool: Straight shank, tungsten carbide tip lathe cutting tool with tip angle of 60 ± 15° (Industry code E).
Tape: 3M 898 (LEQP 0040)
Digital Caliper: Mitutoyo Digimatic Model CD-6" (LEQP 0015)
Scribe Creepback: A measurement of the distance between the unaffected paint film, in millimeters, on each side of the scribed line.
Average (CAverage): The mean of 8 measurements of Scribe Creepback at points 15 millimeters apart centered on the scribed line, discounting the areas less than 10 millimeters from each end of the scribed line.
Max Left (CLeft Max): A measurement of the maximum distance between the unaffected paint film, in millimeters, on the left side of the scribed line.
Max Right (CRight Max): A measurement of the maximum distance between the unaffected paint film, in millimeters, on the right side of the scribed line.
Total Max (CMax): CLeft Max + CRight Max
mm: Millimeter
273 Industrial Dr. Hillsdale, MI 49242 Phone: (517) 439-1485 Fax: (517) 439-1652
LABORATORY TEST REPORT ACT PROJECT SO219433B
Page 9 ACT reports are for the exclusive use of the client to whom they are addressed, and shall not be reproduced except in full, without written authorization from ACT. The tests done on the requested and/or specified number of samples may or may not constitute a representative sampling.
www.acttestservices.com
Evaluation #4: Cyclic Corrosion Test
Test Start Date: 03/07/13 Test End Date: 04/16/13
Test Method: GMW14872, EXT, All, 4sp, Method 1/2/3, Exposure C (03/10)
Exposure Chamber: Thermotron Model SM-27-8200 (LEQP 0033)
Exposure: 28 Cycles (28 ± 3 Cycle Requirement)
One Cycle: 8.0 hours at 25 ± 3°C/45 ± 10% RH (Apply 4 salt mist applications, one at the beginning of the ambient stage and the others at approximately 1.5 hours apart.) 1.0 hour ramp to 49 ± 2°C/~100% RH 7.0 hours at 49 ± 2°C/~100% RH 3.0 hour ramp to 60 ± 2°C/ 30% RH 5.0 hours at 60 ± 2°C/ 30% RH (Note: On weekends and holidays, leave in the ambient condition of 25 ± 2°C/45 ± 5% RH)
Humidity: Steam generated with water fog assist
Sodium Chloride: Morton Culinox 999 Food grade
Salt Solution: 0.9% Sodium Chloride 0.1% Calcium Chloride (CaCl2·2H2O) 0.075% Sodium Bicarbonate 98.925% Deionized Water
Salt Mist Application: Garden Hand Sprayer (LEQP 0153)
pH Meter: Orion Model 710A with glass electrode and ATC probe (LEQP 0030)
Conductivity Meter: Oakton Model CON11 (LEQP 0018)
Balance: Sartorius Model ED623S (LEQP 0042)
Corrosion Coupons: ACT Test Panels 25.4 mm x 50.8 mm x 3.18 mm SAE 1008 Steel
Evaluations: Corrosion Rating per Evaluation #2. Scribe Creepback per Evaluation #3. Coupon Weight Loss in grams (g).

273 Industrial Dr. Hillsdale, MI 49242 Phone: (517) 439-1485 Fax: (517) 439-1652
LABORATORY TEST REPORT ACT PROJECT SO219433B
Page 10 ACT reports are for the exclusive use of the client to whom they are addressed, and shall not be reproduced except in full, without written authorization from ACT. The tests done on the requested and/or specified number of samples may or may not constitute a representative sampling.
www.acttestservices.com
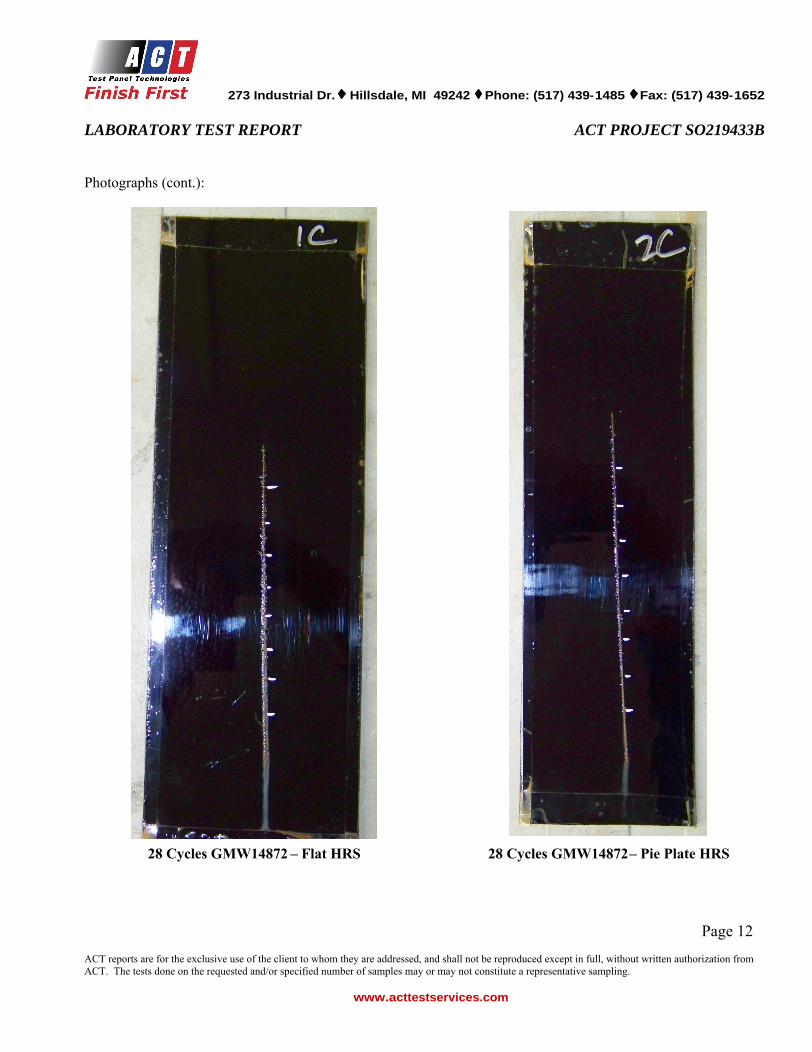
Cyclic Corrosion Test Data: 28 Cycles
Scribe Creepback (mm)
ID GMW15356
Rating Max Left (CLeft
Max)
Max Right (CRight
Max)
Total Max (CMax)
Average (CAverage)
1C 10 1.5 1.4 2.9 1.7 2C 10 1.3 1.1 2.4 1.3
GMW14872 Coupon Weight Loss: 3.18 mm Thick CRS Coupons
ID Cycles Initial Weight (g) Final Weight (g) Weight Loss (g) Ave. Weight Loss (g) 932T L 28 29.813 26.262 3.551 3.749 933T R 29.765 25.818 3.947
273 Industrial Dr. Hillsdale, MI 49242 Phone: (517) 439-1485 Fax: (517) 439-1652
LABORATORY TEST REPORT ACT PROJECT SO219433B
Page 11 ACT reports are for the exclusive use of the client to whom they are addressed, and shall not be reproduced except in full, without written authorization from ACT. The tests done on the requested and/or specified number of samples may or may not constitute a representative sampling.
www.acttestservices.com
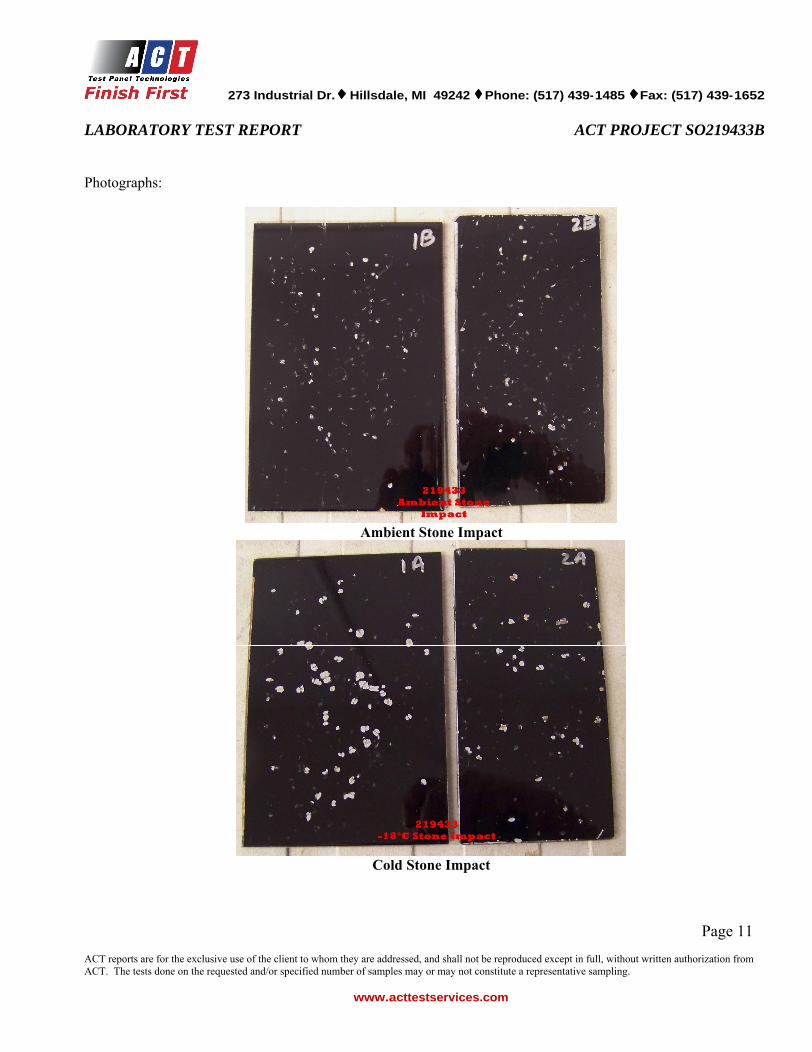
Photographs:
Ambient Stone Impact
Cold Stone Impact
273 Industrial Dr. Hillsdale, MI 49242 Phone: (517) 439-1485 Fax: (517) 439-1652
LABORATORY TEST REPORT ACT PROJECT SO219433B
Page 12 ACT reports are for the exclusive use of the client to whom they are addressed, and shall not be reproduced except in full, without written authorization from ACT. The tests done on the requested and/or specified number of samples may or may not constitute a representative sampling.
www.acttestservices.com
Photographs (cont.):
28 Cycles GMW14872
Flat HRS 28 Cycles GMW14872
Pie Plate HRS
TEST REPORT
AET-13-0822A
Resistance Spot Weld Evaluation of 2.7 mm 050 HSLA Uncoated Steel Using General Motors Welding Specification GWS-5A
Submitted to: Steel Technologies, LLC
Prepared by:
AET Integration, Inc Wixom, MI 48393
August, 2013 248-420-9451
Page 13

50388 Dennis Court, Wixom, MI 48393
Table of Contents 1. Objective ........................................................................................................................2 2. Test Procedure ..............................................................................................................2 3. Test Results and Analysis ...........................................................................................4 4. Conclusion ....................................................................................................................4 Appendix A: Tables
Table 1: Weld Schedule Table 2: Weldability Test Data Table 3: Shear Tension Test Data Table 4: Cross Tension Test Data Table 5: Cap Life Test Data
B: Figures
Figure 1: Weld Lobe Figure 2: Microhardness Traverse Figure 3: Pattern for Microhardness Traverse Figure 4: Metallurgical Photos of Minimum Button Size Curve Points Figure 5: Metallurgical Photos of Expulsion Curve Points Figure 6: Button Size vs. Weld Number Figure 7: Electrode Imprints
Page 14
50388 Dennis Court, Wixom, MI 48393
1. Objective Evaluate 2.7 mm 050 HSLA uncoated steel provided by Steel Technologies, LLC using General Motors (GM) weld qualification specification GWS-5A dated April 2011.
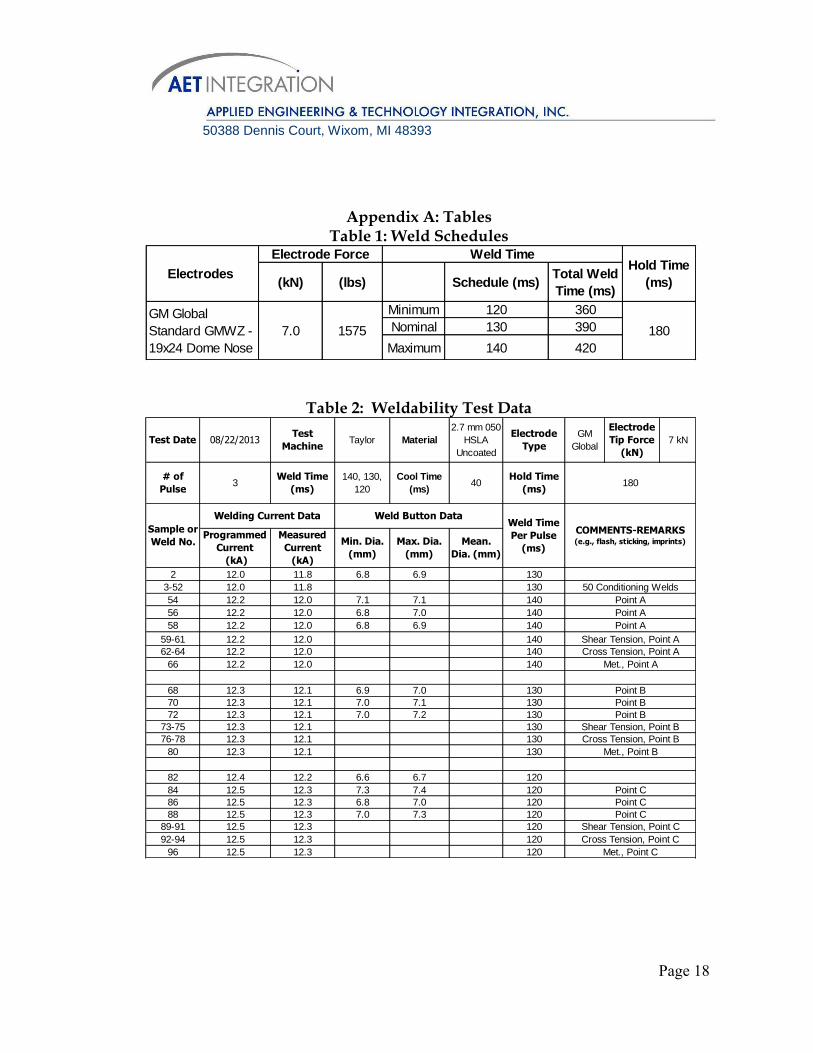
2. Test Procedure 2.1 General Description Both the weldability and cap life evaluation procedure outlined by GWS-5A were conducted. Welding schedules are shown in Table 1 and were selected using the associated file for GWS-1A welding specifications. Minimum button size for this material was 7.0 mm per GMW 14057. GM Global Standard GMWZ – 19x24 mm electrodes were used. Electrode caps were dressed to the dimensions specified in the associated Cap Dress file for GWS-1A. Equipment used for testing is shown below.
2.2 Weldability procedure The weldability procedure consists of the following 6 components:
Weld lobe generation
Electrode life test
Shear tension test
Cross tension test
Metallurgical examination
Microhardness test
Resistance Spot Welder WSI Pedestal
Weld Control Miyachi ISA-500 AR MFDC
Weld Checker Miyachi MM-370A
Force Gauge Sensor Development Weld Probe
Tensile Test Machine MTS 810 Material Test System
Microscope Nikon SMZ800
Microhardness Tester Leco LM100AT
Page 15

50388 Dennis Court, Wixom, MI 48393
Electrode caps were installed and aligned. The squeeze time was adjusted to ensure consistent electrode force before welding. Before welding was started, the electrode alignment was verified with carbon paper imprints. Welding begins by finding the current required to produce the minimum nugget diameter at the nominal weld time. Using this setup, 50 conditioning spot welds were produced. The process appeared stable at this point. After electrode conditioning, coupons were welded and peel tested in 100A increments to determine the current that produced point A of the weld lobe diagram (minimum button size at maximum weld time). Three coupons were produced and peel tested using the determined weld current. The weld lobe was generated by establishing the minimum button diameter curve and the expulsion curve. The minimum button diameter curve is composed of points A, B and C. These locations represent the current necessary to produce the minimum button diameter at each of the three different weld times. The three weld times in this case were the maximum weld time (three pulse, 140 ms per pulse), nominal weld time (three pulse, 130 ms per pulse), and minimum weld time (three pulse, 120 ms per pulse). The expulsion curve was established by increasing weld current in 200A increments until expulsion was observed on the second spot weld of the test coupon. The expulsion procedure was also conducted for each of the three weld times resulting in point D, E and F on the weld lobe. For each point of the weld lobe, three shear tension samples and three cross tension samples were produced. One sample was produced at each point for metallurgical examination and microhardness testing. Shear tension and cross tension tests were performed and the peak loads were recorded using an MTS load frame. An additional coupon was produced at point G of the weld lobe diagram for metallurgical examination and microhardness testing. Microhardness traverses were made using a Vickers scale diamond indenter with a 500g load. 2.3 Cap Life Test Procedure Weld parameters for point G were used in the cap life test. Welding speed was 30 welds per minute. The cap life test procedure was repeated for groups of 50 welds until 500 acceptable welds were obtained or until the button size dropped below the minimum button size requirement. Each group of 50
Page 16
50388 Dennis Court, Wixom, MI 48393
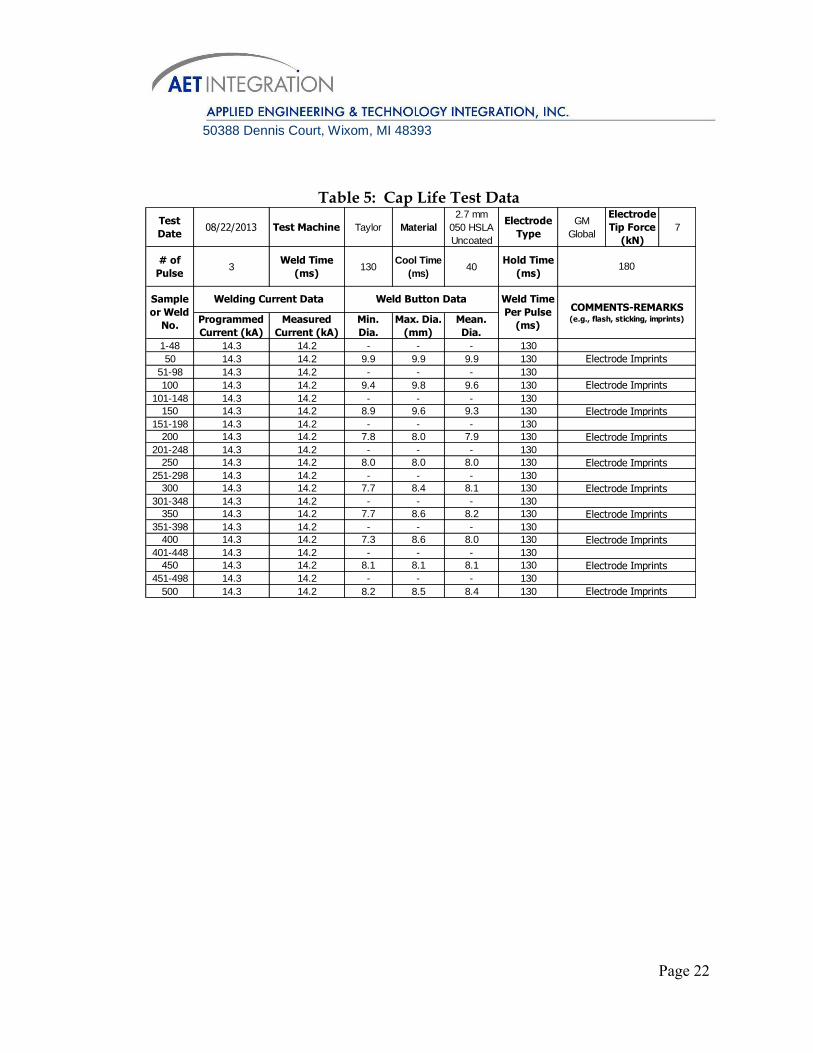
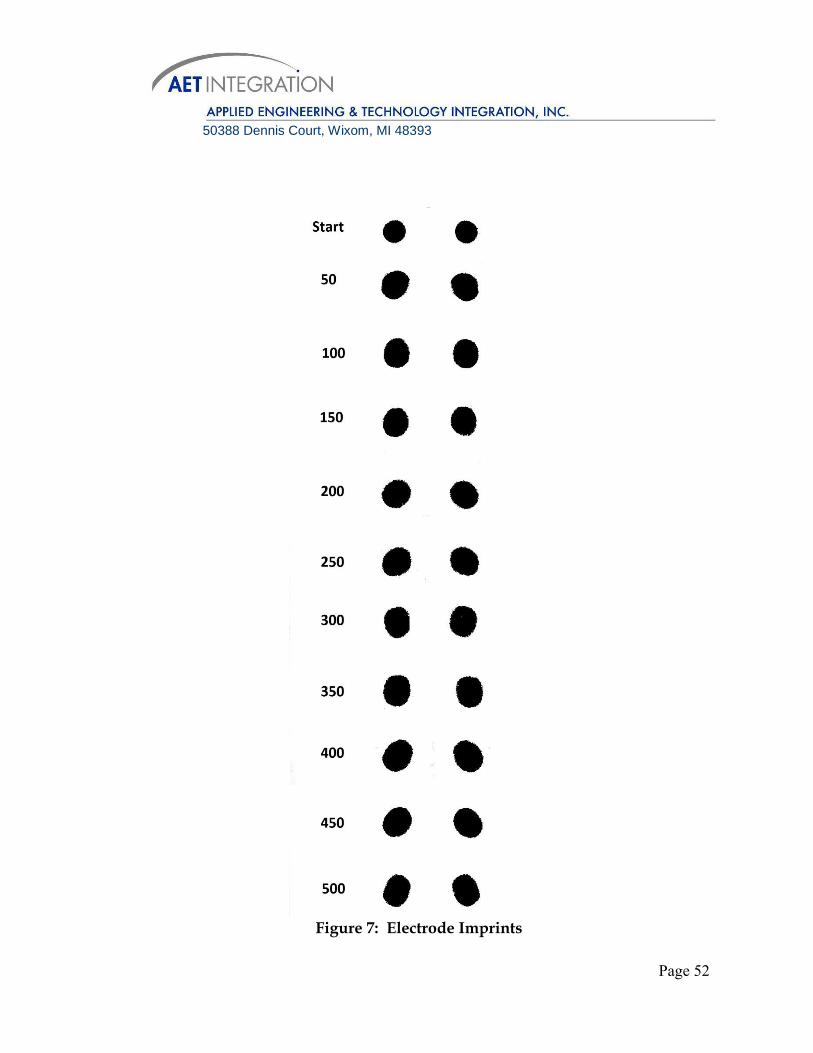
welds consisted of 48 welds on endurance test panels and two welds on a peel test sample. The second weld of the peel test sample was examined for button size and weld characteristics. Cap imprints were taken every 50 welds.
3. Test Results and Analysis
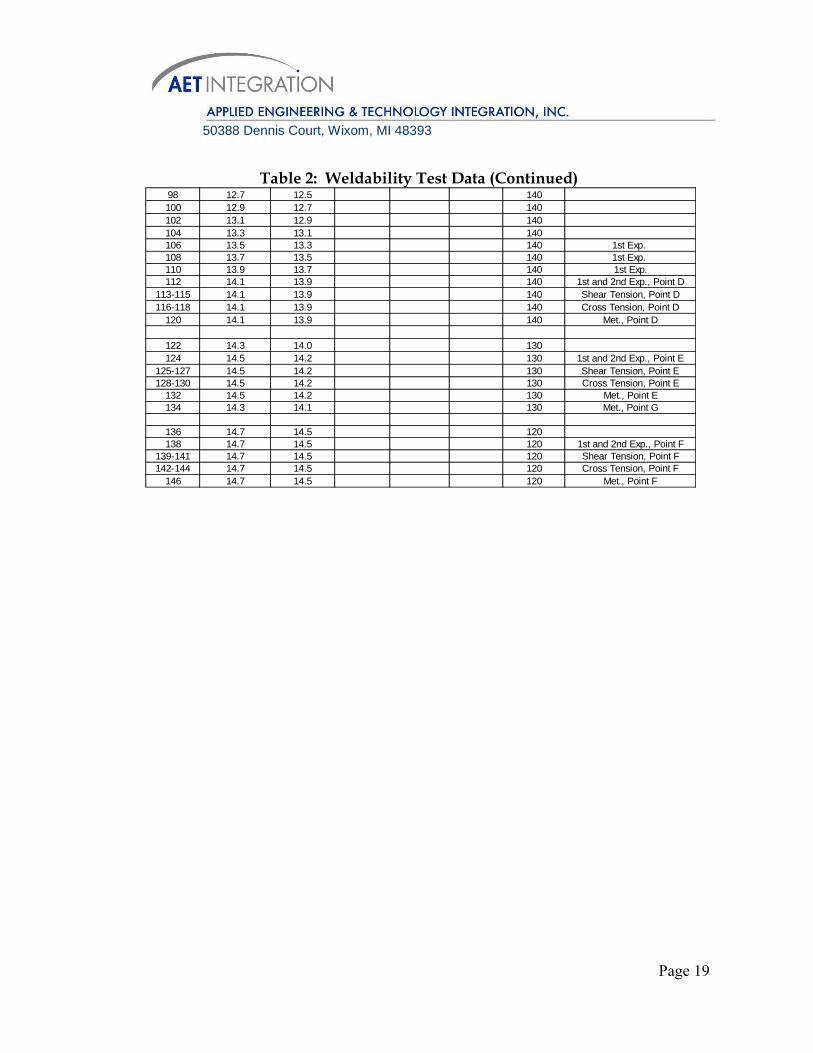
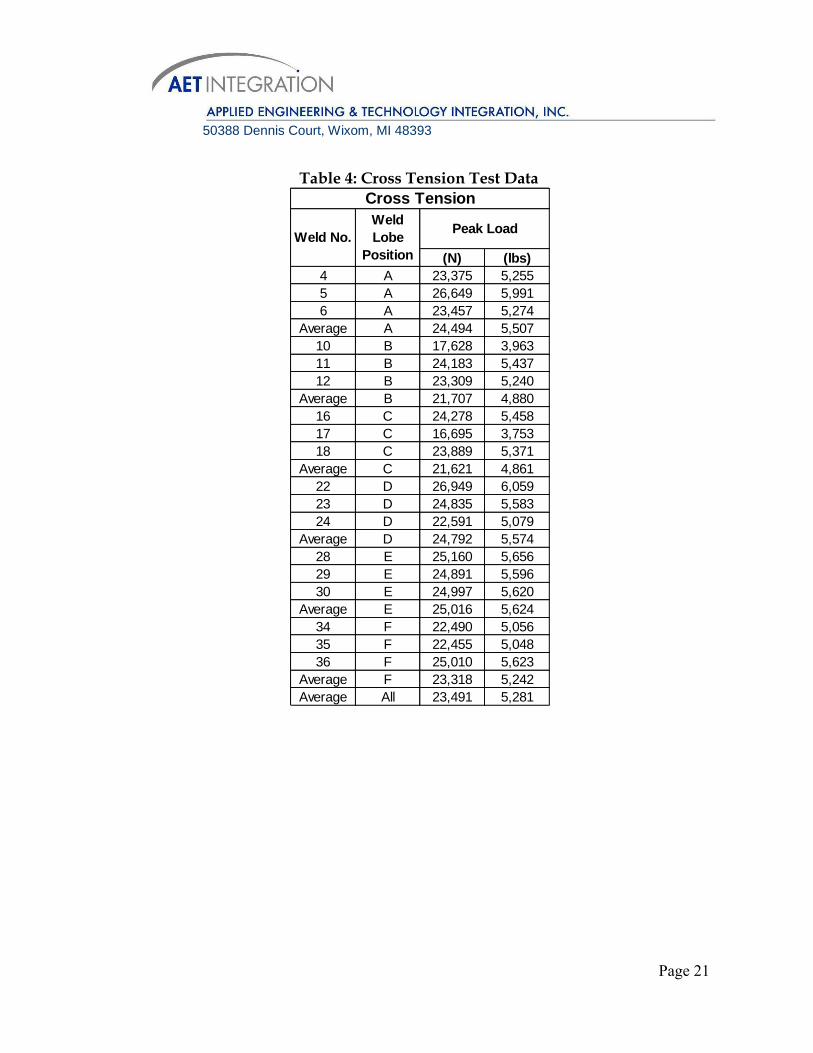
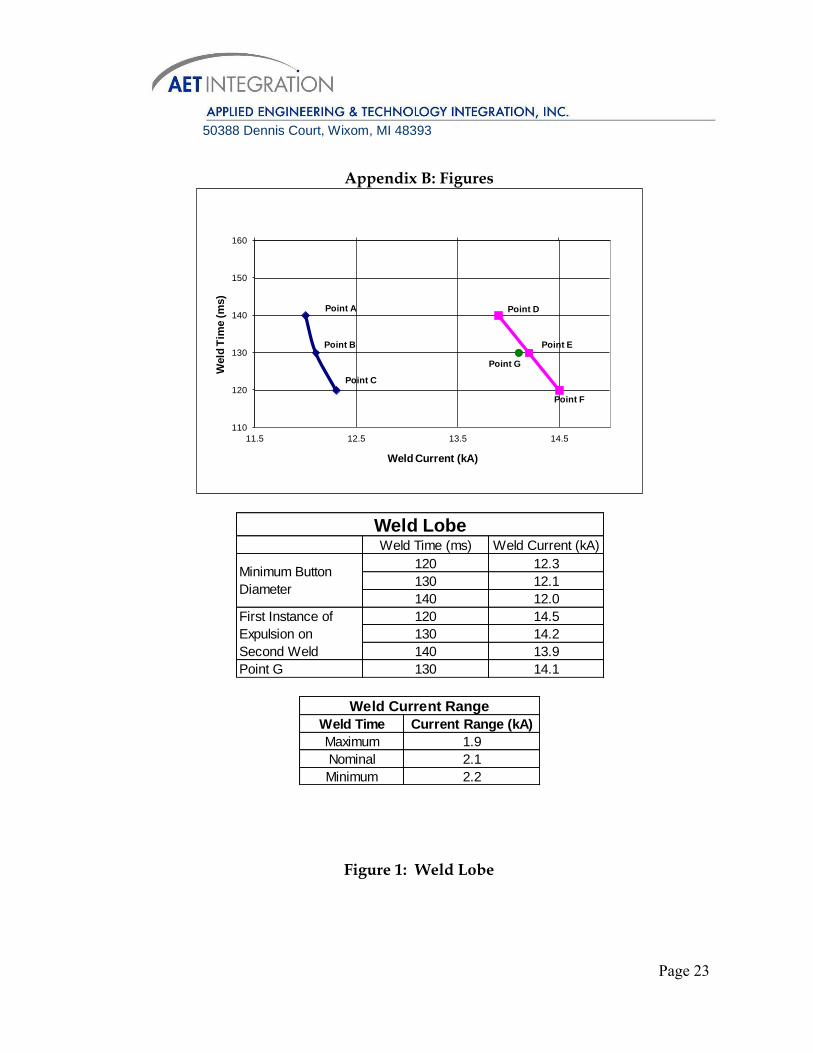
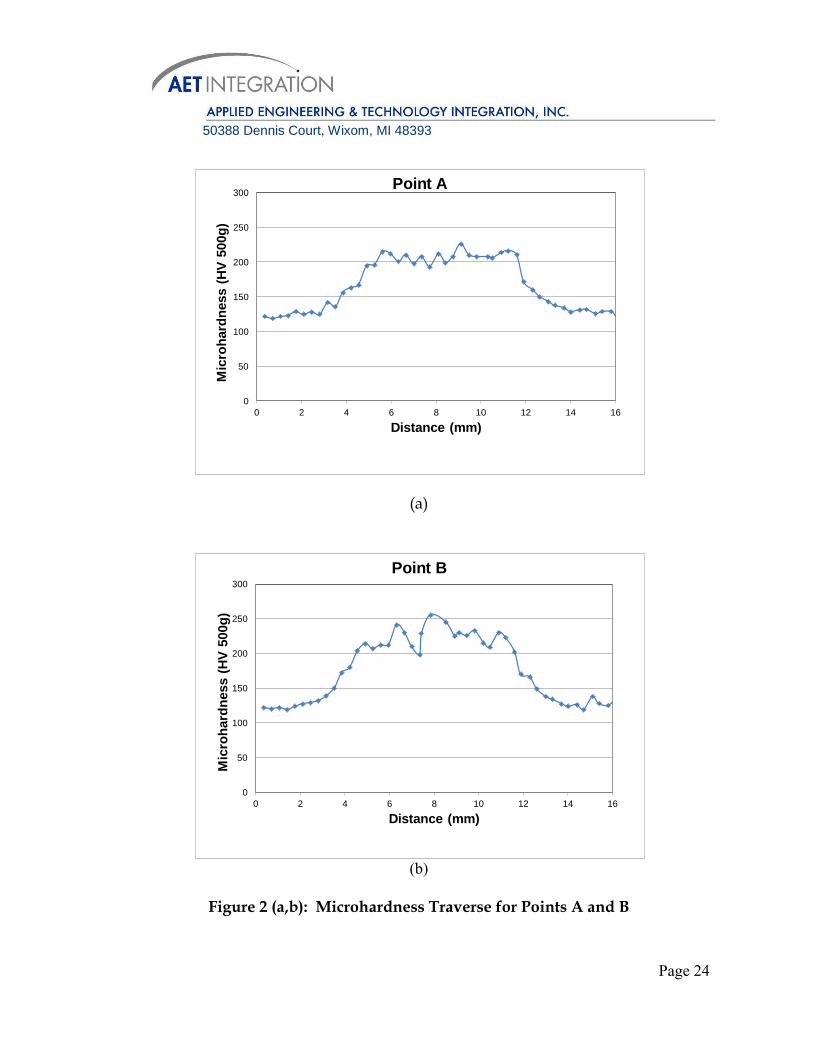
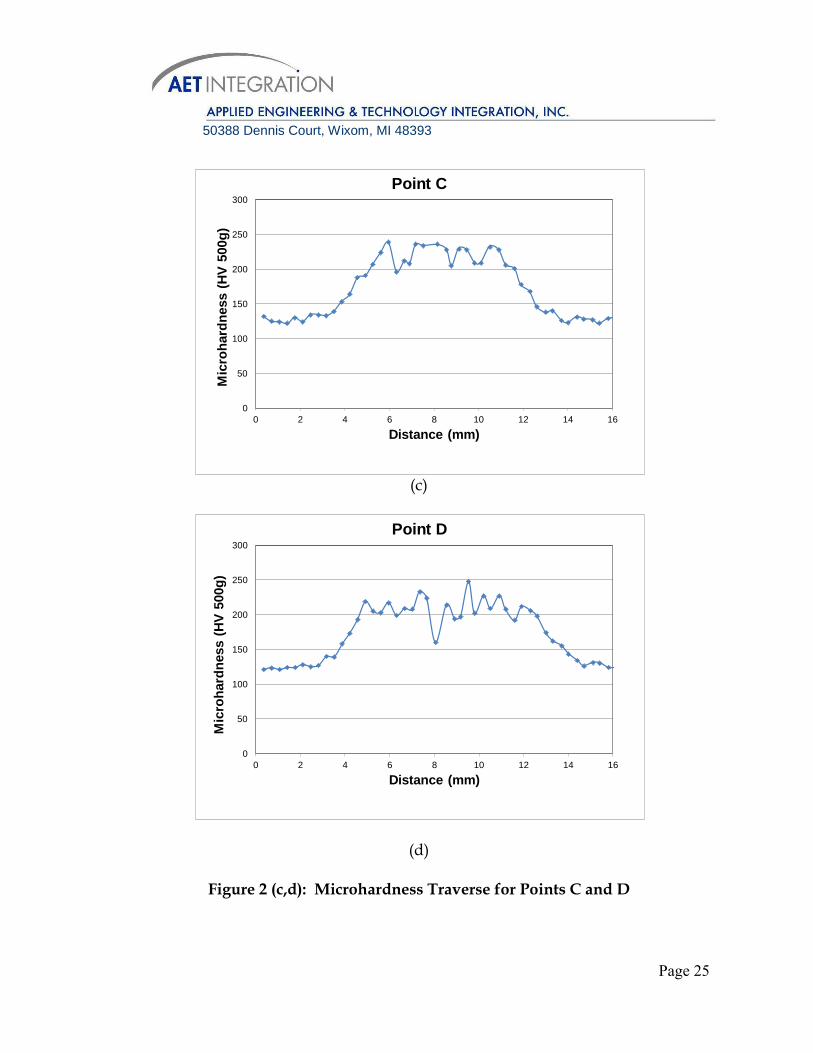
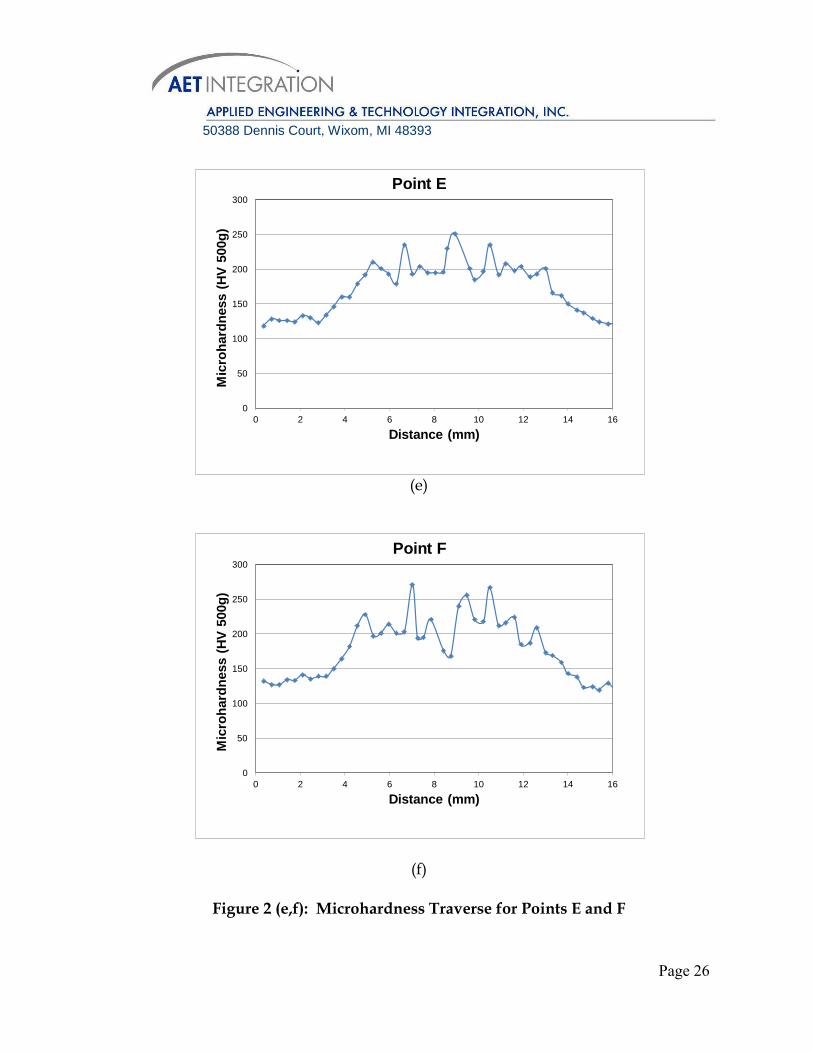
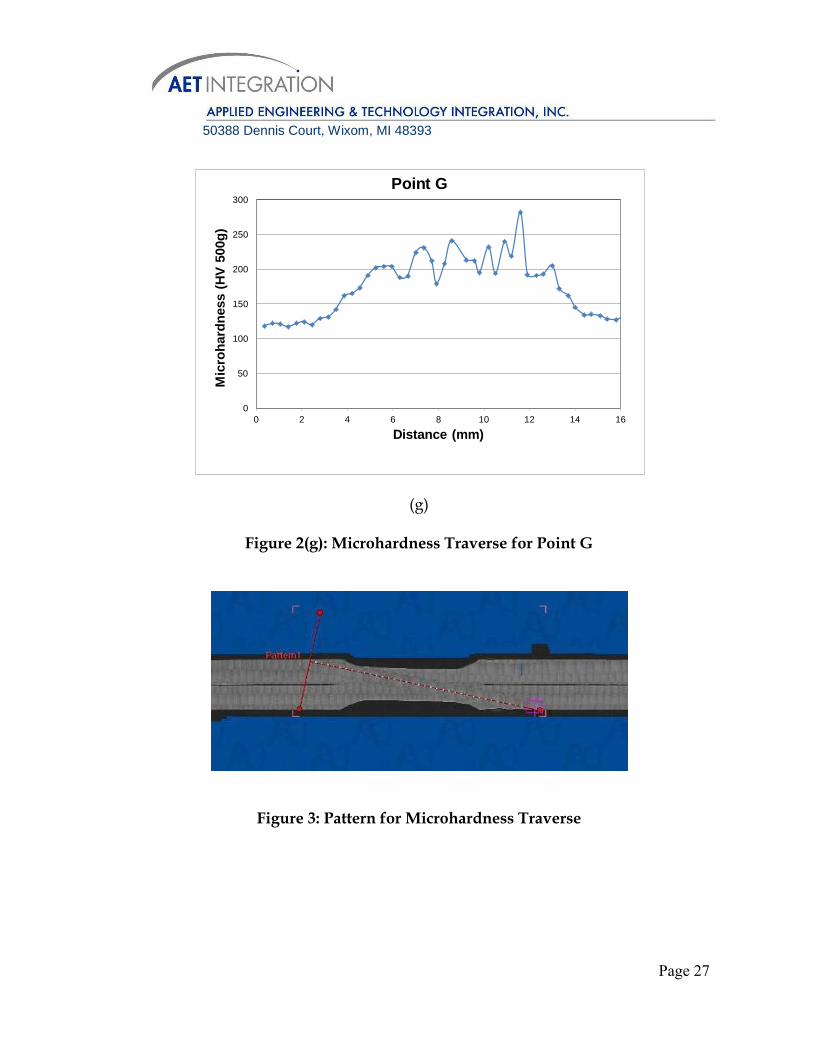
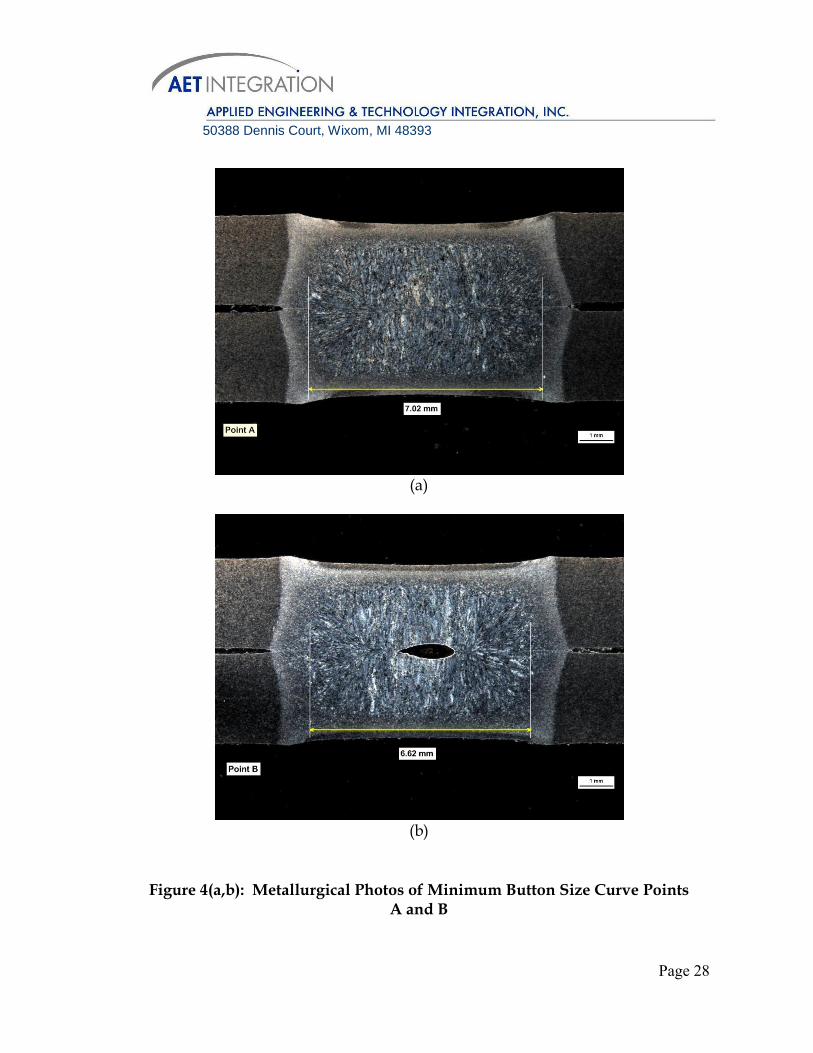
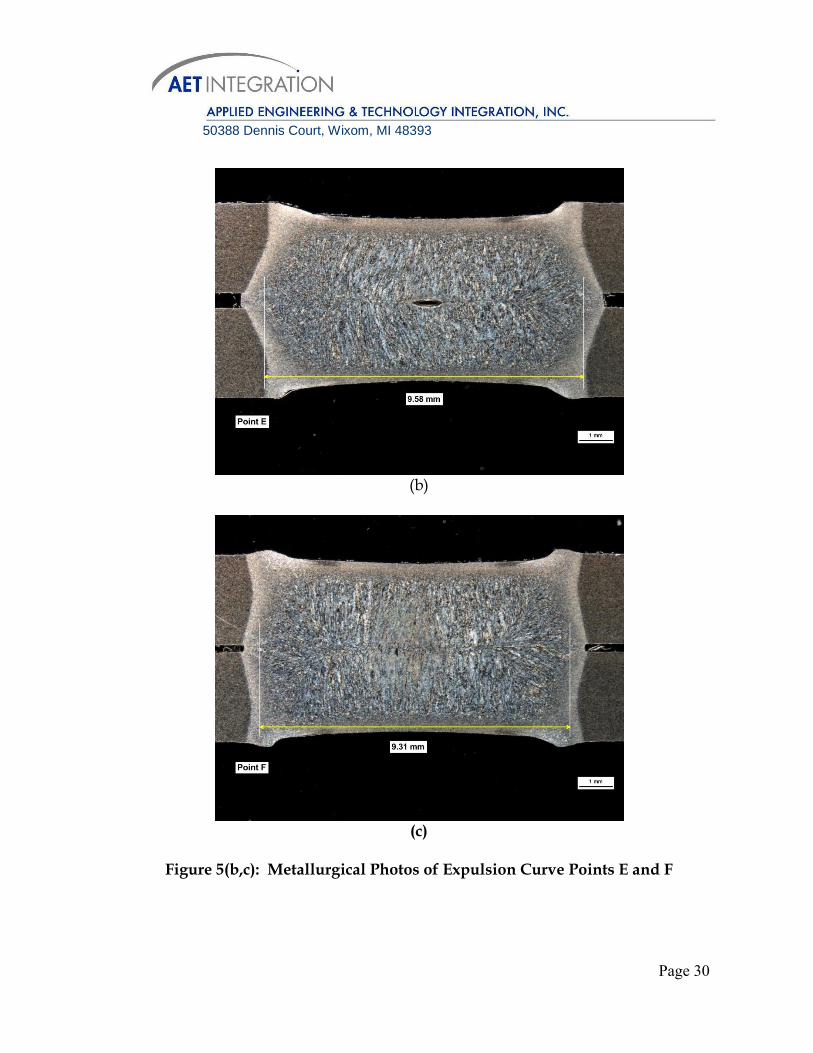
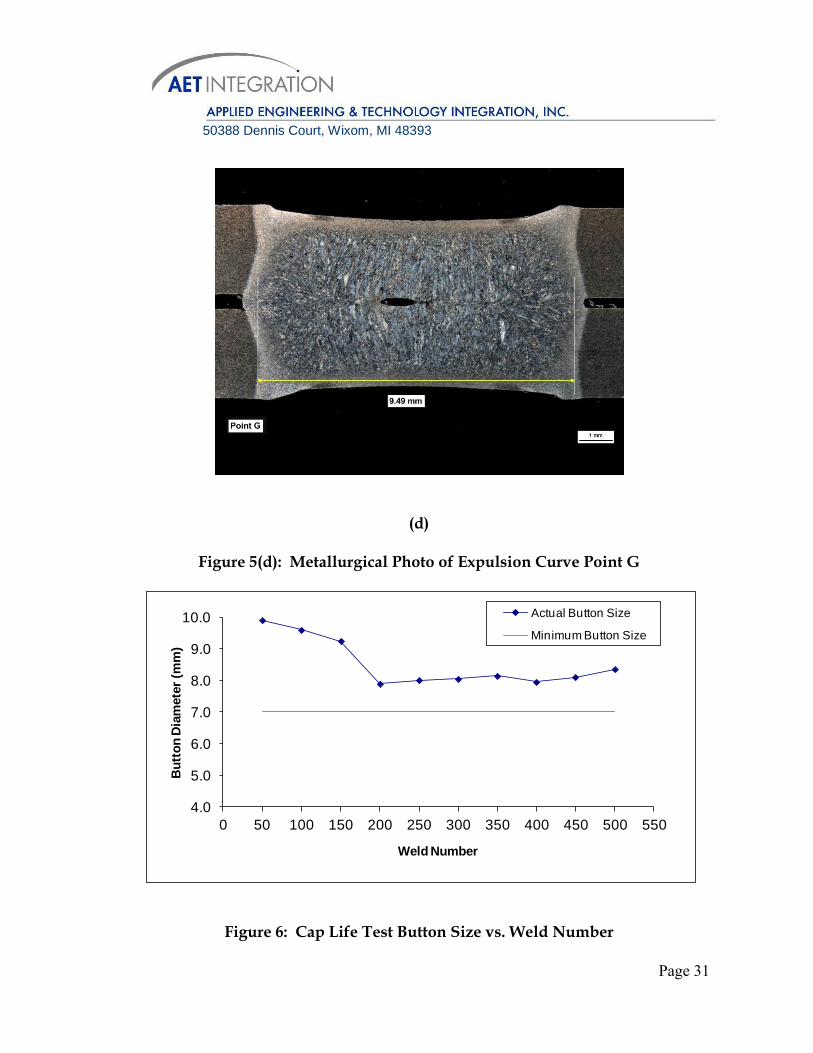
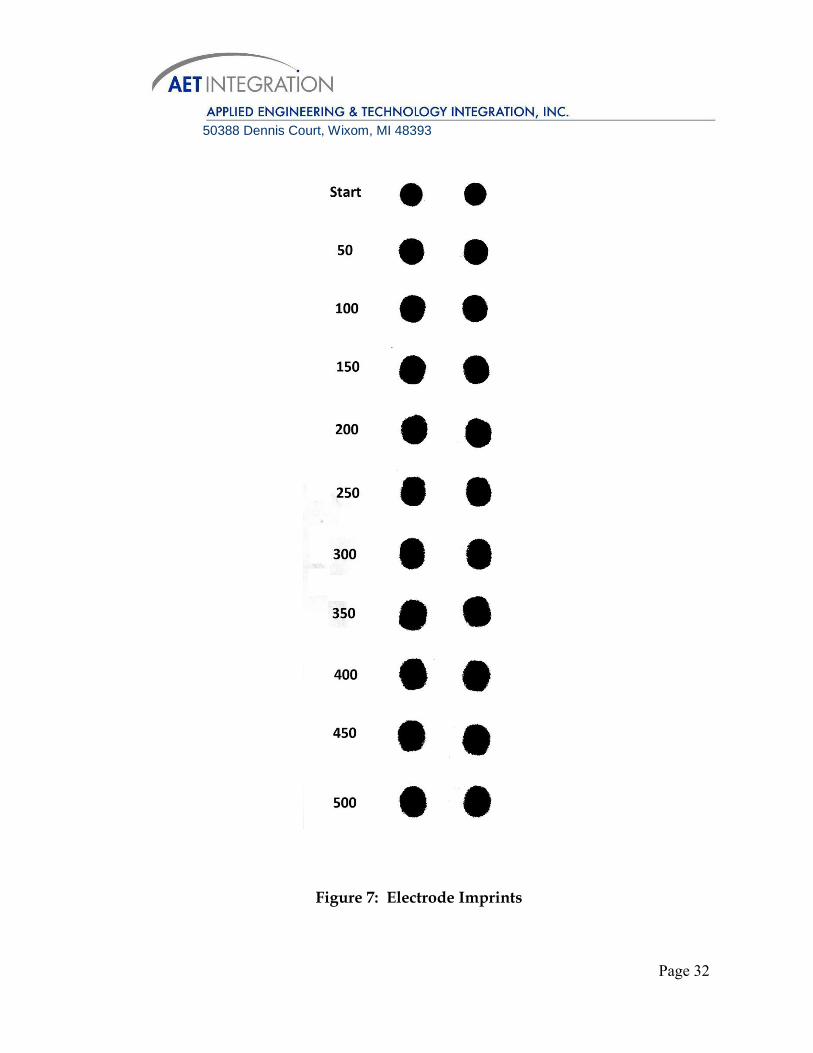
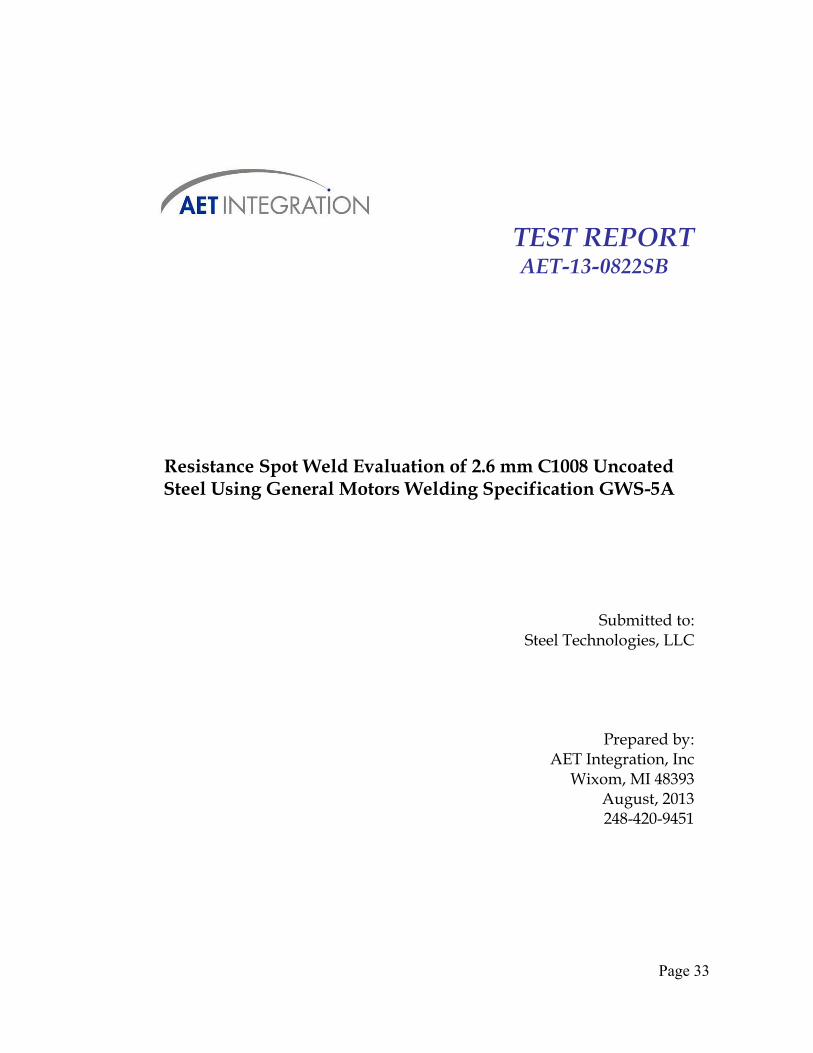
Detailed weldability test data is listed in Table 2 of Appendix A. Shear tension test results are summarized in Table 3 of Appendix A. The average peak tensile load was 29.49 kN (6,630 lbs). Cross tension test results are summarized in Table 4 of Appendix A. The average peak cross tension load was 23.49 kN (5,281 lbs). The weld lobe is shown in Figure 1 of Appendix B. The current ranges at all three weld times exceeded the 1.0 kA requirement in GWS-5A. Microhardness traverse results are shown in Figure 2 of Appendix B. The indent pattern is shown in Figure 3. Microhardness tests did not indicate brittle weld structures. Macro photos of metallurgical specimens are shown in Figure 4 and Figure 5 of Appendix B. Specimens at expulsion points did not exhibit thinning over 30%. As shown in Table 5, 500 acceptable welds were obtained for the cap life evaluation without the button size dropping below 7.0 mm. Figure 6 shows the button size variation throughout the test. Figure 7 shows the electrode imprints.
4. Conclusion The 2.7 mm 050 HSLA uncoated steel evaluated by this test appears to meet the weldability requirements specified in GM welding specification GWS-5A.
Page 17
50388 Dennis Court, Wixom, MI 48393
Appendix A: Tables Table 1: Weld Schedules
Table 2: Weldability Test Data
(kN) (lbs) Schedule (ms)Total Weld
Time (ms)
Minimum 120 360
Nominal 130 390
Maximum 140 420
Electrodes Hold Time
(ms)
GM Global
Standard GMWZ -
19x24 Dome Nose
7.0 1575
Electrode Force Weld Time
180
Test Date 08/22/2013Test
MachineTaylor Material
2.7 mm 050
HSLA
Uncoated
Electrode
Type
GM
Global
Electrode
Tip Force
(kN)
7 kN
# of
Pulse3
Weld Time
(ms)
140, 130,
120
Cool Time
(ms)40
Hold Time
(ms)
2 12.0 11.8 6.8 6.9 130
3-52 12.0 11.8 130
54 12.2 12.0 7.1 7.1 140
56 12.2 12.0 6.8 7.0 140
58 12.2 12.0 6.8 6.9 140
59-61 12.2 12.0 140
62-64 12.2 12.0 140
66 12.2 12.0 140
68 12.3 12.1 6.9 7.0 130
70 12.3 12.1 7.0 7.1 130
72 12.3 12.1 7.0 7.2 130
73-75 12.3 12.1 130
76-78 12.3 12.1 130
80 12.3 12.1 130
82 12.4 12.2 6.6 6.7 120
84 12.5 12.3 7.3 7.4 120
86 12.5 12.3 6.8 7.0 120
88 12.5 12.3 7.0 7.3 120
89-91 12.5 12.3 120
92-94 12.5 12.3 120
96 12.5 12.3 120
180
Point A
Met., Point A
Point A
COMMENTS-REMARKS (e.g., flash, sticking, imprints)
50 Conditioning Welds
Point A
Met., Point C
Point B
Cross Tension, Point C
Point C
Shear Tension, Point C
Sample or
Weld No. Mean.
Dia. (mm)
Max. Dia.
(mm)
Weld Button DataWelding Current DataWeld Time
Per Pulse
(ms)
Programmed
Current
(kA)
Measured
Current
(kA)
Min. Dia.
(mm)
Point C
Met., Point B
Shear Tension, Point B
Cross Tension, Point B
Cross Tension, Point A
Point B
Shear Tension, Point A
Point B
Point C
Page 18
50388 Dennis Court, Wixom, MI 48393
Table 2: Weldability Test Data (Continued)
98 12.7 12.5 140
100 12.9 12.7 140
102 13.1 12.9 140
104 13.3 13.1 140
106 13.5 13.3 140
108 13.7 13.5 140
110 13.9 13.7 140
112 14.1 13.9 140
113-115 14.1 13.9 140
116-118 14.1 13.9 140
120 14.1 13.9 140
122 14.3 14.0 130
124 14.5 14.2 130
125-127 14.5 14.2 130
128-130 14.5 14.2 130
132 14.5 14.2 130
134 14.3 14.1 130
136 14.7 14.5 120
138 14.7 14.5 120
139-141 14.7 14.5 120
142-144 14.7 14.5 120
146 14.7 14.5 120
1st Exp.
1st Exp.
Shear Tension, Point E
Met., Point E
Cross Tension, Point E
Cross Tension, Point D
Met., Point D
Met., Point G
Shear Tension, Point F
Cross Tension, Point F
1st and 2nd Exp., Point F
Met., Point F
1st and 2nd Exp., Point D
Shear Tension, Point D
1st Exp.
1st and 2nd Exp., Point E
Page 19

50388 Dennis Court, Wixom, MI 48393
Table 3. Shear Tension Test Data
(N) (lbs)
1 A 28,004 6,296
2 A 29,822 6,705
3 A 27,853 6,262
Average A 28,560 6,421
7 B 26,579 5,975
8 B 28,072 6,311
9 B 27,306 6,139
Average B 27,319 6,142
13 C 25,294 5,687
14 C 25,045 5,631
15 C 27,780 6,246
Average C 26,040 5,854
19 D 31,641 7,114
20 D 32,154 7,229
21 D 32,684 7,348
Average D 32,160 7,230
25 E 32,416 7,288
26 E 31,591 7,102
27 E 31,618 7,108
Average E 31,875 7,166
31 F 29,531 6,639
32 F 32,282 7,258
33 F 31,167 7,007
Average F 30,993 6,968
Average All 29,491 6,630
Shear Tension
Weld No.
Weld
Lobe
Position
Peak Load
Page 20
50388 Dennis Court, Wixom, MI 48393
Table 4: Cross Tension Test Data
(N) (lbs)
4 A 23,375 5,255
5 A 26,649 5,991
6 A 23,457 5,274
Average A 24,494 5,507
10 B 17,628 3,963
11 B 24,183 5,437
12 B 23,309 5,240
Average B 21,707 4,880
16 C 24,278 5,458
17 C 16,695 3,753
18 C 23,889 5,371
Average C 21,621 4,861
22 D 26,949 6,059
23 D 24,835 5,583
24 D 22,591 5,079
Average D 24,792 5,574
28 E 25,160 5,656
29 E 24,891 5,596
30 E 24,997 5,620
Average E 25,016 5,624
34 F 22,490 5,056
35 F 22,455 5,048
36 F 25,010 5,623
Average F 23,318 5,242
Average All 23,491 5,281
Cross Tension
Weld No.
Weld
Lobe
Position
Peak Load
Page 21
50388 Dennis Court, Wixom, MI 48393
Table 5: Cap Life Test Data
Test
Date 08/22/2013 Test Machine Taylor Material
2.7 mm
050 HSLA
Uncoated
Electrode
Type
GM
Global
Electrode
Tip Force
(kN)
7
# of
Pulse3
Weld Time
(ms)130
Cool Time
(ms)40
Hold Time
(ms)
1-48 14.3 14.2 - - - 130
50 14.3 14.2 9.9 9.9 9.9 130
51-98 14.3 14.2 - - - 130
100 14.3 14.2 9.4 9.8 9.6 130
101-148 14.3 14.2 - - - 130
150 14.3 14.2 8.9 9.6 9.3 130
151-198 14.3 14.2 - - - 130
200 14.3 14.2 7.8 8.0 7.9 130
201-248 14.3 14.2 - - - 130
250 14.3 14.2 8.0 8.0 8.0 130
251-298 14.3 14.2 - - - 130
300 14.3 14.2 7.7 8.4 8.1 130
301-348 14.3 14.2 - - - 130
350 14.3 14.2 7.7 8.6 8.2 130
351-398 14.3 14.2 - - - 130
400 14.3 14.2 7.3 8.6 8.0 130
401-448 14.3 14.2 - - - 130
450 14.3 14.2 8.1 8.1 8.1 130
451-498 14.3 14.2 - - - 130
500 14.3 14.2 8.2 8.5 8.4 130
Electrode Imprints
Electrode Imprints
Electrode Imprints
180
Sample
or Weld
No.
Welding Current Data Weld Button Data Weld Time
Per Pulse
(ms)
COMMENTS-REMARKS (e.g., flash, sticking, imprints)Programmed
Current (kA)
Max. Dia.
(mm)
Mean.
Dia.
Measured
Current (kA)
Min.
Dia.
Electrode Imprints
Electrode Imprints
Electrode Imprints
Electrode Imprints
Electrode Imprints
Electrode Imprints
Electrode Imprints
Page 22
50388 Dennis Court, Wixom, MI 48393
Appendix B: Figures
Figure 1: Weld Lobe
Point C
Point B
Point A
Point F
Point E
Point D
Point G
110
120
130
140
150
160
11.5 12.5 13.5 14.5
Weld
Tim
e (
ms)
Weld Current (kA)
Weld Time (ms) Weld Current (kA)
120 12.3
130 12.1
140 12.0
120 14.5
130 14.2
140 13.9
Point G 130 14.1
Minimum Button
Diameter
First Instance of
Expulsion on
Second Weld
Weld Lobe
Weld Time Current Range (kA)
Maximum 1.9
Nominal 2.1
Minimum 2.2
Weld Current Range
Page 23
50388 Dennis Court, Wixom, MI 48393
(a)
(b)
Figure 2 (a,b): Microhardness Traverse for Points A and B
0
50
100
150
200
250
300
0 2 4 6 8 10 12 14 16
Mic
roh
ard
ness (
HV
500g
)
Distance (mm)
Point A
0
50
100
150
200
250
300
0 2 4 6 8 10 12 14 16
Mic
roh
ard
ness (
HV
500g
)
Distance (mm)
Point B
Page 24
50388 Dennis Court, Wixom, MI 48393
(c)
(d)
Figure 2 (c,d): Microhardness Traverse for Points C and D
0
50
100
150
200
250
300
0 2 4 6 8 10 12 14 16
Mic
roh
ard
ness (
HV
500g
)
Distance (mm)
Point C
0
50
100
150
200
250
300
0 2 4 6 8 10 12 14 16
Mic
roh
ard
ness (
HV
500g
)
Distance (mm)
Point D
Page 25
50388 Dennis Court, Wixom, MI 48393
(e)
(f)
Figure 2 (e,f): Microhardness Traverse for Points E and F
0
50
100
150
200
250
300
0 2 4 6 8 10 12 14 16
Mic
roh
ard
ness (
HV
500g
)
Distance (mm)
Point E
0
50
100
150
200
250
300
0 2 4 6 8 10 12 14 16
Mic
roh
ard
ness (
HV
500g
)
Distance (mm)
Point F
Page 26
50388 Dennis Court, Wixom, MI 48393
(g)
Figure 2(g): Microhardness Traverse for Point G
Figure 3: Pattern for Microhardness Traverse
0
50
100
150
200
250
300
0 2 4 6 8 10 12 14 16
Mic
roh
ard
ness (
HV
500g
)
Distance (mm)
Point G
Page 27
50388 Dennis Court, Wixom, MI 48393
(a)
(b)
Figure 4(a,b): Metallurgical Photos of Minimum Button Size Curve Points A and B
Page 28
50388 Dennis Court, Wixom, MI 48393
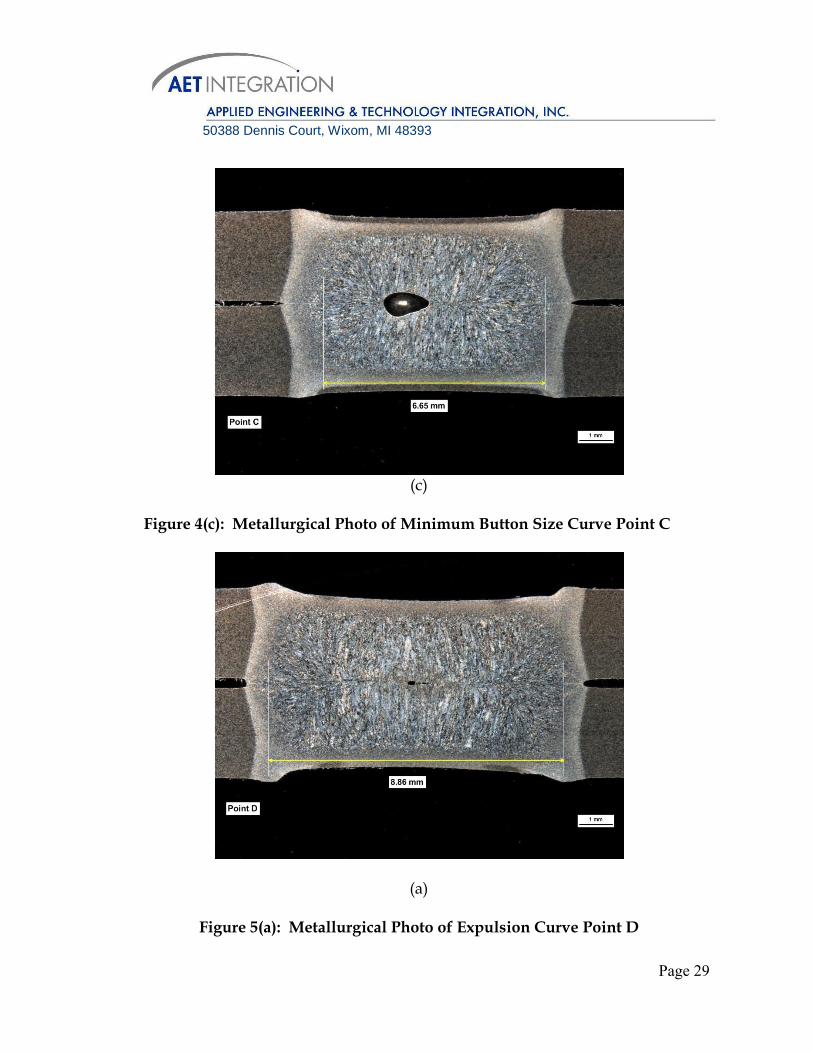
(c)
Figure 4(c): Metallurgical Photo of Minimum Button Size Curve Point C
(a)
Figure 5(a): Metallurgical Photo of Expulsion Curve Point D
Page 29
50388 Dennis Court, Wixom, MI 48393
(b)
(c)
Figure 5(b,c): Metallurgical Photos of Expulsion Curve Points E and F
Page 30
50388 Dennis Court, Wixom, MI 48393
(d)
Figure 5(d): Metallurgical Photo of Expulsion Curve Point G
Figure 6: Cap Life Test Button Size vs. Weld Number
4.0
5.0
6.0
7.0
8.0
9.0
10.0
0 50 100 150 200 250 300 350 400 450 500 550
Bu
tto
n D
iam
ete
r (m
m)
Weld Number
Actual Button Size
Minimum Button Size
Page 31
50388 Dennis Court, Wixom, MI 48393
Figure 7: Electrode Imprints
Page 32
TEST REPORT
AET-13-0822SB
Resistance Spot Weld Evaluation of 2.6 mm C1008 Uncoated Steel Using General Motors Welding Specification GWS-5A
Submitted to: Steel Technologies, LLC
Prepared by:
AET Integration, Inc Wixom, MI 48393
August, 2013 248-420-9451
Page 33
50388 Dennis Court, Wixom, MI 48393
Table of Contents 1. Objective ........................................................................................................................2 2. Test Procedure ..............................................................................................................2 3. Test Results and Analysis ...........................................................................................4 4. Conclusion ....................................................................................................................4 Appendix A: Tables
Table 1: Weld Schedule Table 2: Weldability Test Data Table 3: Shear Tension Test Data Table 4: Cross Tension Test Data Table 5: Cap Life Test Data
B: Figures
Figure 1: Weld Lobe Figure 2: Microhardness Traverse Figure 3: Pattern for Microhardness Traverse Figure 4: Metallurgical Photos of Minimum Button Size Curve Points Figure 5: Metallurgical Photos of Expulsion Curve Points Figure 6: Button Size vs. Weld Number Figure 7: Electrode Imprints
Page 34
50388 Dennis Court, Wixom, MI 48393
1. Project Objective Evaluate 2.6 mm C1008 uncoated steel provided by Steel Technologies, LLC using General Motors (GM) weld qualification specification GWS-5A dated April 2011.
2. Test Procedure 2.1 General Description Both the weldability and cap life evaluation procedure outlined by GWS-5A were conducted. Welding schedules are shown in Table 1 and were selected using the associated file for GWS-1A welding specifications. Minimum button size for this material was 7.0 mm per GMW 14057. GM Global Standard GMWZ – 19x24 mm electrodes were used. Electrode caps were dressed to the dimensions specified in the associated Cap Dress file for GWS-1A. Equipment used for testing is shown below.
2.2 Weldability procedure The weldability procedure consists of the following 6 components:
Weld lobe generation
Electrode life test
Shear tension test
Cross tension test
Metallurgical examination
Microhardness test
Resistance Spot Welder WSI Pedestal
Weld Control Miyachi ISA-500 AR MFDC
Weld Checker Miyachi MM-370A
Force Gauge Sensor Development Weld Probe
Tensile Test Machine MTS 810 Material Test System
Microscope Nikon SMZ800
Microhardness Tester Leco LM100AT
Page 35
50388 Dennis Court, Wixom, MI 48393
Electrode caps were installed and aligned. The squeeze time was adjusted to ensure consistent electrode force before welding. Before welding was started, the electrode alignment was verified with carbon paper imprints. Welding begins by finding the current required to produce the minimum nugget diameter at the nominal weld time. Using this setup, 50 conditioning spot welds were produced. The process appeared stable at this point. After electrode conditioning, coupons were welded and peel tested in 100A increments to determine the current that produced point A of the weld lobe diagram (minimum button size at maximum weld time). Three coupons were produced and peel tested using the determined weld current. The weld lobe was generated by establishing the minimum button diameter curve and the expulsion curve. The minimum button diameter curve is composed of points A, B and C. These locations represent the current necessary to produce the minimum button diameter at each of the three different weld times. The three weld times in this case were the maximum weld time (three pulse, 140 ms per pulse), nominal weld time (three pulse, 130 ms per pulse), and minimum weld time (three pulse, 120 ms per pulse). The expulsion curve was established by increasing weld current in 200A increments until expulsion was observed on the second spot weld of the test coupon. The expulsion procedure was also conducted for each of the three weld times resulting in point D, E and F on the weld lobe. For each point of the weld lobe, three shear tension samples and three cross tension samples were produced. One sample was produced for each point for metallurgical examination and microhardness testing. Shear tension and cross tension tests were performed and the peak loads were recorded using an MTS load frame. An additional coupon was produced at point G of the weld lobe diagram for metallurgical examination and microhardness testing. Microhardness traverses were made using a Vickers scale diamond indenter with a 500g load. 2.3 Cap Life Test Procedure Weld parameters for point G were used in the cap life test. Welding speed was 30 welds per minute. The cap life test procedure is repeated for groups of 50 welds until 500 acceptable welds are obtained or until the button size drops below the minimum button size requirement. Each group of 50 welds
Page 36
50388 Dennis Court, Wixom, MI 48393
consisted of 48 welds on endurance test panels and two welds on a peel test sample. The second weld of the peel test sample was examined for button size and weld characteristics. Cap imprints were taken every 50 welds.
3. Test Results and Analysis
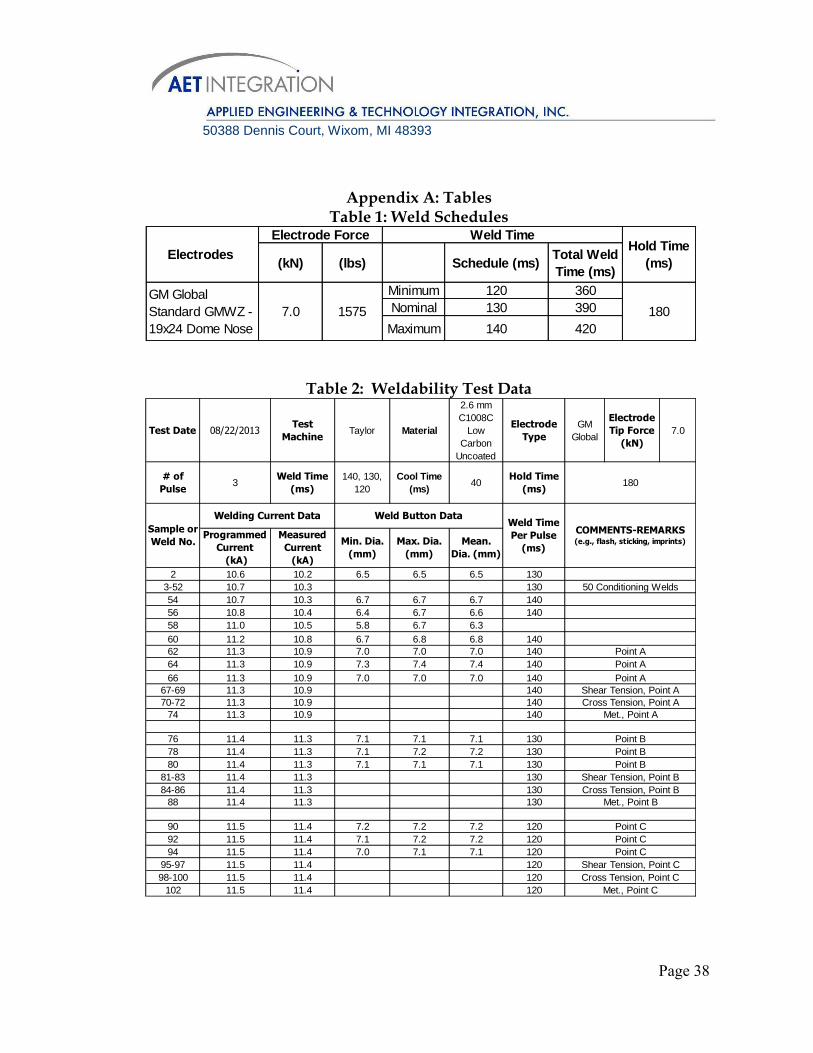
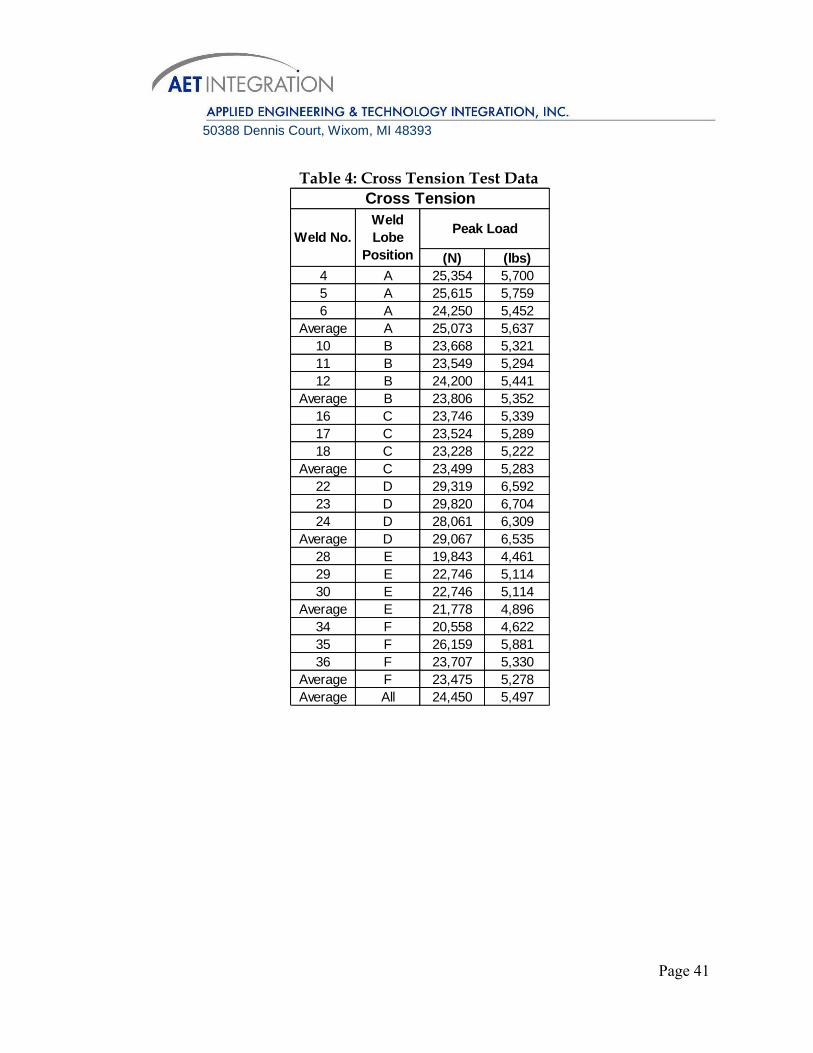
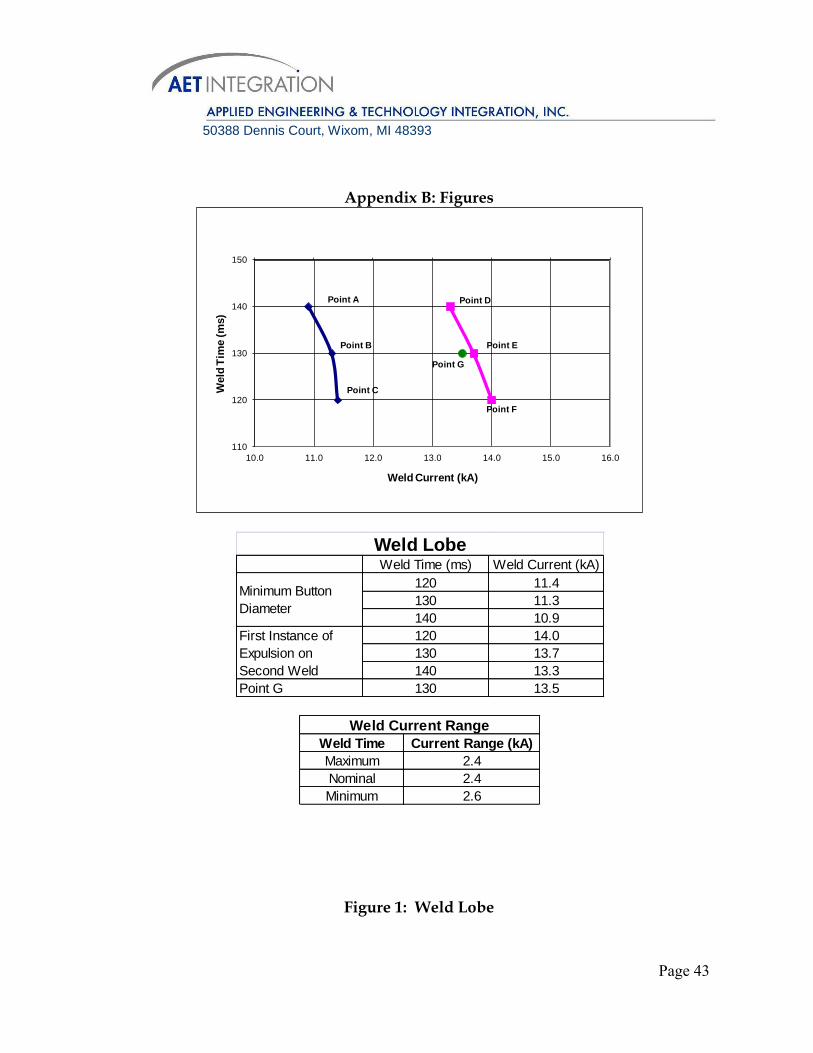
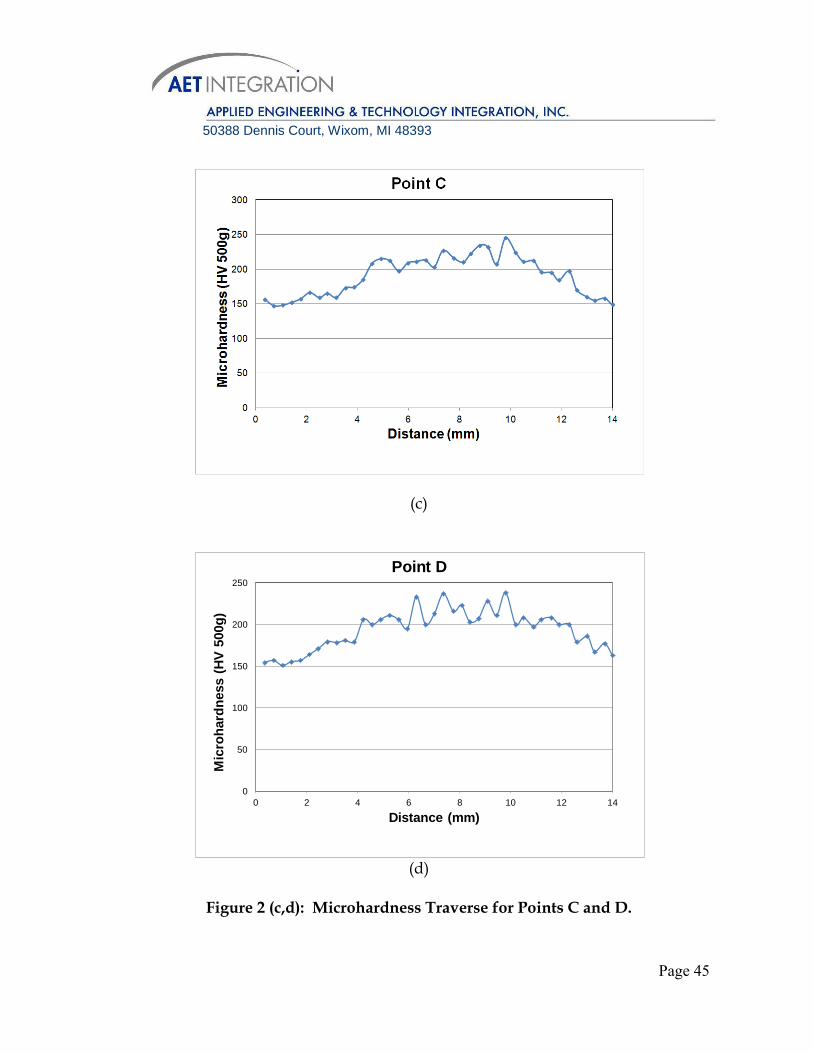
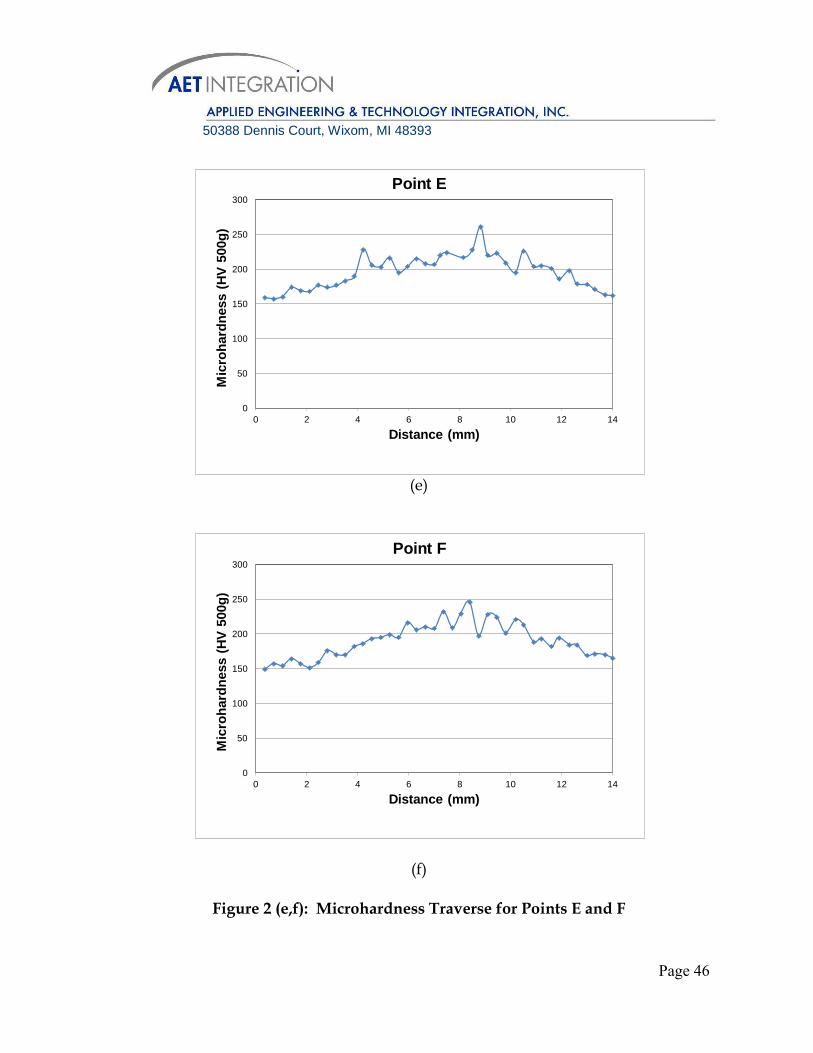
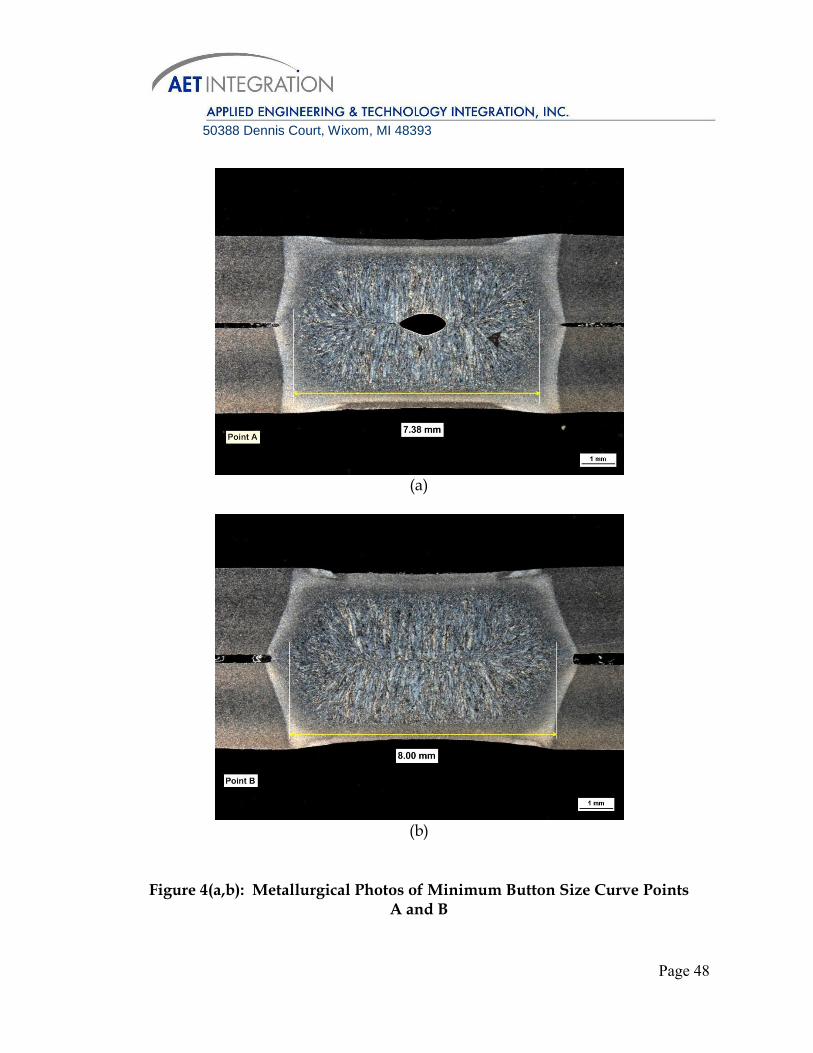
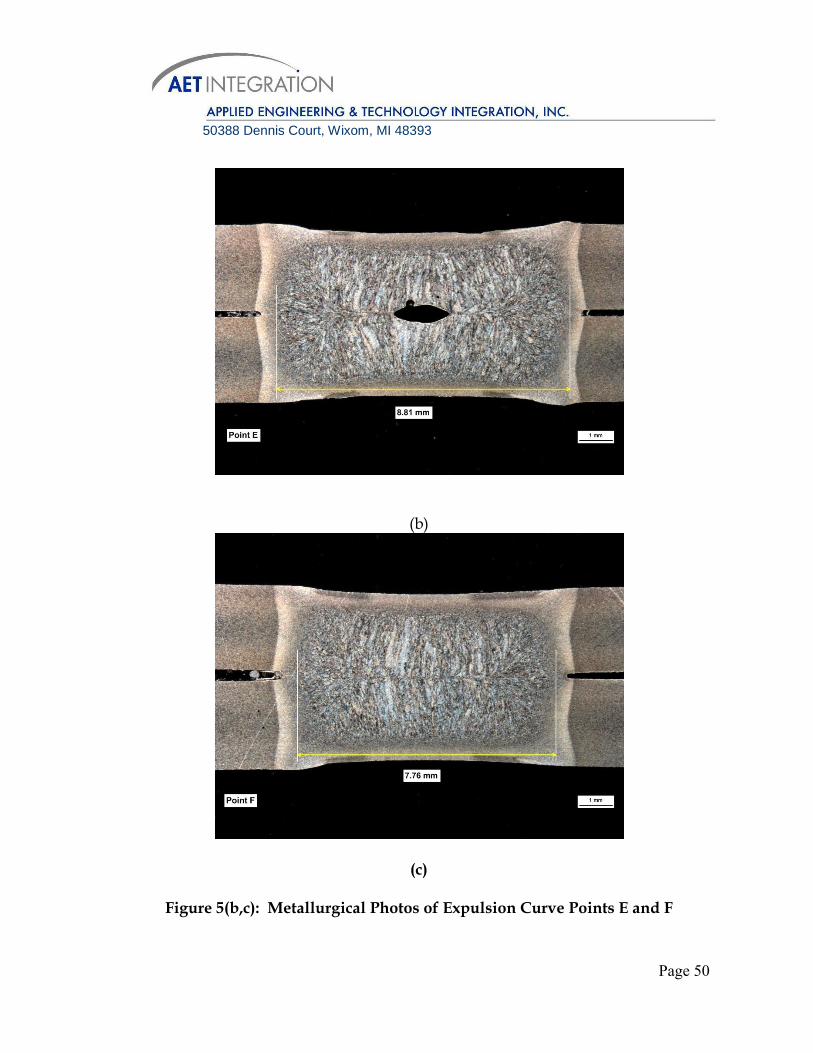
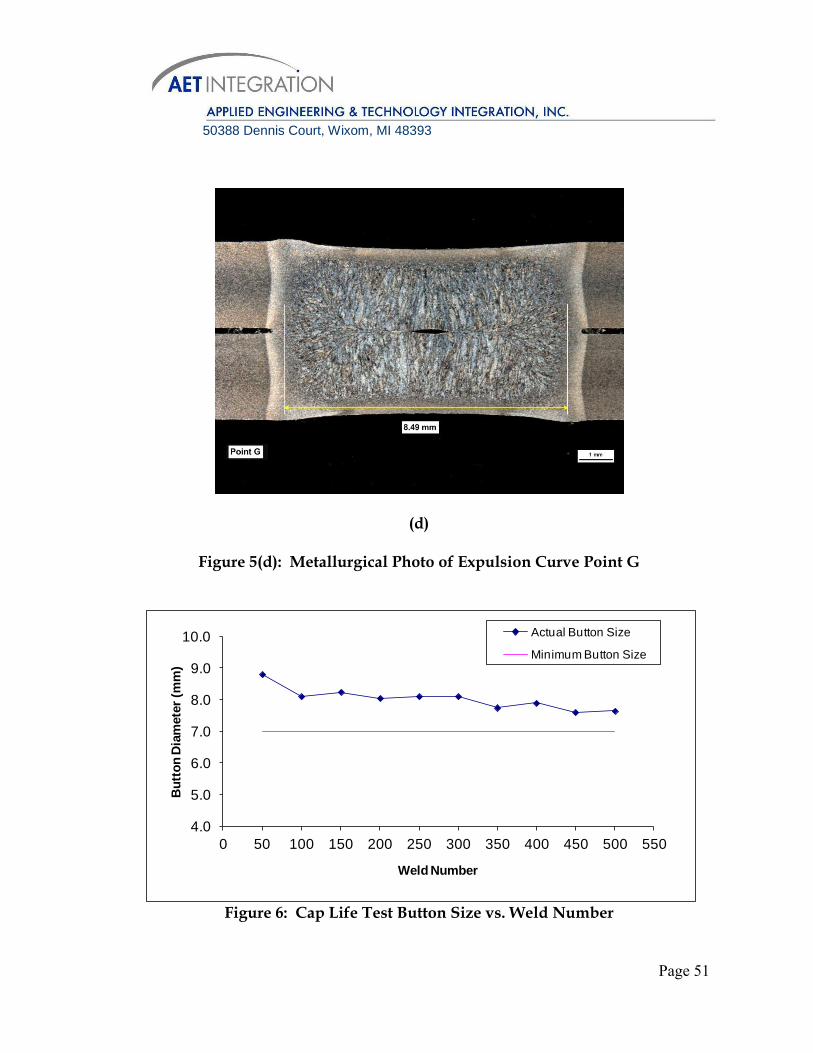
Detailed test data of the weldability test is listed in Table 2 of Appendix A. Shear tension test results are summarized in Table 3 of Appendix A. The average peak tensile load was 26.32 kN (5,917 lbs). Cross tension test results are summarized in Table 4 of Appendix A. The average peak cross tension load was 24.45 kN (5,497 lbs). The weld lobe is shown in Figure 1 of Appendix B. The current ranges at all three weld times exceeded the 1.0 kA requirement in GWS-5A. Microhardness traverse results are shown in Figure 2 of Appendix B. The indent pattern is shown in Figure 3. Microhardness tests did not indicate brittle weld structures. Macro photos of metallurgical specimens are shown in Figure 4 and Figure 5 of Appendix B. Samples at expulsion points did not exhibit thinning over 30%. As shown in Table 5, 500 acceptable welds were obtained for the cap life evaluation without the button size dropping below 7.0mm. Figure 6 shows the button size variation throughout the test. Figure 7 shows the electrode imprints.
4. Conclusion The 2.6 mm C1008 steel evaluated by this test appears to meet the weldability requirements specified in GM welding specification GWS-5A.
Page 37
50388 Dennis Court, Wixom, MI 48393
Appendix A: Tables
Table 1: Weld Schedules
Table 2: Weldability Test Data
(kN) (lbs) Schedule (ms)Total Weld
Time (ms)
Minimum 120 360
Nominal 130 390
Maximum 140 420
Electrodes Hold Time
(ms)
GM Global
Standard GMWZ -
19x24 Dome Nose
7.0 1575
Electrode Force Weld Time
180
Test Date 08/22/2013Test
MachineTaylor Material
2.6 mm
C1008C
Low
Carbon
Uncoated
Electrode
Type
GM
Global
Electrode
Tip Force
(kN)
7.0
# of
Pulse3
Weld Time
(ms)
140, 130,
120
Cool Time
(ms)40
Hold Time
(ms)
2 10.6 10.2 6.5 6.5 6.5 130
3-52 10.7 10.3 130
54 10.7 10.3 6.7 6.7 6.7 140
56 10.8 10.4 6.4 6.7 6.6 140
58 11.0 10.5 5.8 6.7 6.3
60 11.2 10.8 6.7 6.8 6.8 140
62 11.3 10.9 7.0 7.0 7.0 140
64 11.3 10.9 7.3 7.4 7.4 140
66 11.3 10.9 7.0 7.0 7.0 140
67-69 11.3 10.9 140
70-72 11.3 10.9 140
74 11.3 10.9 140
76 11.4 11.3 7.1 7.1 7.1 130
78 11.4 11.3 7.1 7.2 7.2 130
80 11.4 11.3 7.1 7.1 7.1 130
81-83 11.4 11.3 130
84-86 11.4 11.3 130
88 11.4 11.3 130
90 11.5 11.4 7.2 7.2 7.2 120
92 11.5 11.4 7.1 7.2 7.2 120
94 11.5 11.4 7.0 7.1 7.1 120
95-97 11.5 11.4 120
98-100 11.5 11.4 120
102 11.5 11.4 120
Met., Point B
Shear Tension, Point C
Weld Time
Per Pulse
(ms)
Programmed
Current
(kA)
Measured
Current
(kA)
Min. Dia.
(mm)
Cross Tension, Point B
Point B
Point B
Point A
Cross Tension, Point A
Shear Tension, Point A
Point A
Point B
Shear Tension, Point B
Sample or
Weld No. Mean.
Dia. (mm)
Max. Dia.
(mm)
Weld Button DataWelding Current Data
Point C
Met., Point A
Met., Point C
Point C
Point C
Cross Tension, Point C
180
Point A
COMMENTS-REMARKS (e.g., flash, sticking, imprints)
50 Conditioning Welds
Page 38
50388 Dennis Court, Wixom, MI 48393
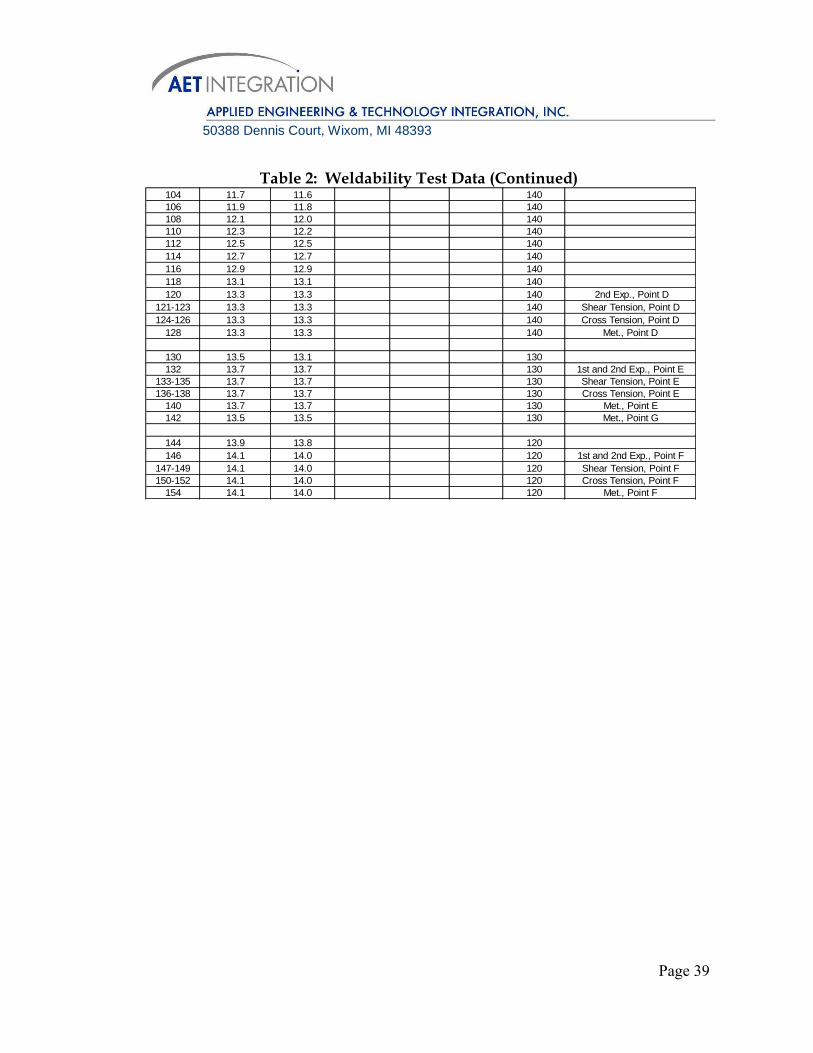
Table 2: Weldability Test Data (Continued)
104 11.7 11.6 140
106 11.9 11.8 140
108 12.1 12.0 140
110 12.3 12.2 140
112 12.5 12.5 140
114 12.7 12.7 140
116 12.9 12.9 140
118 13.1 13.1 140
120 13.3 13.3 140
121-123 13.3 13.3 140
124-126 13.3 13.3 140
128 13.3 13.3 140
130 13.5 13.1 130
132 13.7 13.7 130
133-135 13.7 13.7 130
136-138 13.7 13.7 130
140 13.7 13.7 130
142 13.5 13.5 130
144 13.9 13.8 120
146 14.1 14.0 120
147-149 14.1 14.0 120
150-152 14.1 14.0 120
154 14.1 14.0 120
Met., Point E
Cross Tension, Point D
Met., Point D
Shear Tension, Point F
1st and 2nd Exp., Point F
1st and 2nd Exp., Point E
Met., Point G
Cross Tension, Point E
Cross Tension, Point F
Met., Point F
Shear Tension, Point E
2nd Exp., Point D
Shear Tension, Point D
Page 39

50388 Dennis Court, Wixom, MI 48393
Table 3. Shear Tension Test Data
(N) (lbs)
1 A 24,887 5,595
2 A 25,706 5,779
3 A 25,549 5,744
Average A 25,381 5,706
7 B 24,549 5,519
8 B 24,107 5,420
9 B 24,108 5,420
Average B 24,255 5,453
13 C 22,515 5,062
14 C 24,356 5,476
15 C 25,484 5,729
Average C 24,118 5,422
19 D 27,357 6,150
20 D 25,662 5,769
21 D 29,587 6,652
Average D 27,535 6,190
25 E 30,884 6,943
26 E 25,601 5,756
27 E 28,353 6,374
Average E 28,279 6,358
31 F 23,791 5,349
32 F 30,106 6,768
33 F 31,171 7,008
Average F 28,356 6,375
Average All 26,321 5,917
Shear Tension
Weld No.
Weld
Lobe
Position
Peak Load
Page 40
50388 Dennis Court, Wixom, MI 48393
Table 4: Cross Tension Test Data
(N) (lbs)
4 A 25,354 5,700
5 A 25,615 5,759
6 A 24,250 5,452
Average A 25,073 5,637
10 B 23,668 5,321
11 B 23,549 5,294
12 B 24,200 5,441
Average B 23,806 5,352
16 C 23,746 5,339
17 C 23,524 5,289
18 C 23,228 5,222
Average C 23,499 5,283
22 D 29,319 6,592
23 D 29,820 6,704
24 D 28,061 6,309
Average D 29,067 6,535
28 E 19,843 4,461
29 E 22,746 5,114
30 E 22,746 5,114
Average E 21,778 4,896
34 F 20,558 4,622
35 F 26,159 5,881
36 F 23,707 5,330
Average F 23,475 5,278
Average All 24,450 5,497
Cross Tension
Weld No.
Weld
Lobe
Position
Peak Load
Page 41

50388 Dennis Court, Wixom, MI 48393
Table 5: Cap Life Test Data
Test
Date 08/22/2013 Test Machine Taylor Material
2.6 mm
C1008C
Low
Carbon
Uncoated
Steel
Electrode
Type
GM
Global
Electrode
Tip Force
(kN)
7.0
# of
Pulse3
Weld Time
(ms)130
Cool Time
(ms)40
Hold Time
(ms)
1-48 13.5 13.2 - - - 130
50 13.5 13.2 8.4 9.2 8.8 130
51-98 13.5 13.2 - - - 130
100 13.5 13.2 8.0 8.2 8.1 130
101-148 13.5 13.2 - - - 130
150 13.5 13.2 8.0 8.5 8.3 130
151-198 13.5 13.2 - - - 130
200 13.5 13.2 7.9 8.2 8.1 130
201-248 13.5 13.2 - - - 130
250 13.5 13.2 7.9 8.3 8.1 130
251-298 13.5 13.2 - - - 130
300 13.5 13.2 7.9 8.3 8.1 130
301-348 13.5 13.2 - - - 130
350 13.5 13.2 7.3 8.2 7.8 130
351-398 13.5 13.2 - - - 130
400 13.5 13.2 7.6 8.2 7.9 130
401-448 13.5 13.2 - - - 130
450 13.5 13.2 7.2 8.0 7.6 130
451-498 13.5 13.2 - - - 130
500 13.5 13.2 7.2 8.1 7.7 130 Electrode Imprints
Electrode Imprints
Electrode Imprints
Electrode Imprints
Electrode Imprints
Electrode Imprints
Electrode Imprints
180
Sample
or Weld
No.
Welding Current Data Weld Button Data Weld Time
Per Pulse
(ms)
COMMENTS-REMARKS (e.g., flash, sticking, imprints)Programmed
Current (kA)
Max. Dia.
(mm)
Mean.
Dia.
Measured
Current (kA)
Min.
Dia.
Electrode Imprints
Electrode Imprints
Electrode Imprints
Page 42
50388 Dennis Court, Wixom, MI 48393
Appendix B: Figures
Figure 1: Weld Lobe
Point C
Point B
Point A
Point F
Point E
Point D
Point G
110
120
130
140
150
10.0 11.0 12.0 13.0 14.0 15.0 16.0
Weld
Tim
e (
ms)
Weld Current (kA)
Weld Time (ms) Weld Current (kA)
120 11.4
130 11.3
140 10.9
120 14.0
130 13.7
140 13.3
Point G 130 13.5
Minimum Button
Diameter
First Instance of
Expulsion on
Second Weld
Weld Lobe
Weld Time Current Range (kA)
Maximum 2.4
Nominal 2.4
Minimum 2.6
Weld Current Range
Page 43

50388 Dennis Court, Wixom, MI 48393
(a)
(b)
Figure 2 (a,b): Microhardness Traverse for Points A and B
0
50
100
150
200
250
300
0 2 4 6 8 10 12 14
Mic
roh
ard
ness (
HV
500g
)
Distance (mm)
Point A
0
50
100
150
200
250
300
0 2 4 6 8 10 12 14
Mic
roh
ard
ness (
HV
500g
)
Distance (mm)
Point B
Page 44
50388 Dennis Court, Wixom, MI 48393
(c)
(d)
Figure 2 (c,d): Microhardness Traverse for Points C and D.
0
50
100
150
200
250
0 2 4 6 8 10 12 14
Mic
roh
ard
ness (
HV
500g
)
Distance (mm)
Point D
Page 45
50388 Dennis Court, Wixom, MI 48393
(e)
(f)
Figure 2 (e,f): Microhardness Traverse for Points E and F
0
50
100
150
200
250
300
0 2 4 6 8 10 12 14
Mic
roh
ard
ness (
HV
500g
)
Distance (mm)
Point E
0
50
100
150
200
250
300
0 2 4 6 8 10 12 14
Mic
roh
ard
ness (
HV
500g
)
Distance (mm)
Point F
Page 46

50388 Dennis Court, Wixom, MI 48393
(g)
Figure 2(g): Microhardness Traverse for Point G
Figure 3: Pattern for Microhardness Traverse
0
50
100
150
200
250
300
0 2 4 6 8 10 12 14
Mic
roh
ard
ness (
HV
500g
)
Distance (mm)
Point G
Page 47
50388 Dennis Court, Wixom, MI 48393
(a)
(b)
Figure 4(a,b): Metallurgical Photos of Minimum Button Size Curve Points A and B
Page 48

50388 Dennis Court, Wixom, MI 48393
(c) Figure 4(c): Metallurgical Photo of Minimum Button Size Curve Point C
(a)
Figure 5(a): Metallurgical Photo of Expulsion Curve Point D
Page 49
50388 Dennis Court, Wixom, MI 48393
(b)
(c)
Figure 5(b,c): Metallurgical Photos of Expulsion Curve Points E and F
Page 50
50388 Dennis Court, Wixom, MI 48393
(d)
Figure 5(d): Metallurgical Photo of Expulsion Curve Point G
Figure 6: Cap Life Test Button Size vs. Weld Number
4.0
5.0
6.0
7.0
8.0
9.0
10.0
0 50 100 150 200 250 300 350 400 450 500 550
Bu
tto
n D
iam
ete
r (m
m)
Weld Number
Actual Button Size
Minimum Button Size
Page 51
50388 Dennis Court, Wixom, MI 48393
Figure 7: Electrode Imprints
Page 52