a general test for distortions in performance measures
TRANSCRIPT

A General Test for Distortions in Performance Measures
Pascal Courty and Gerald Marschke1
January 2006
Abstract: An important lesson from the incentive literature is that performance measures are often distorted, eliciting dysfunctional and unintended responses, also known as gaming responses. The existence of these responses, however, is difficult to demonstrate in practice because this behavior is typically hidden from the researcher. We present a simple model showing that one can test for the existence of distortions by estimating how the association between a performance measure and the true goal of the organization changes after the measure is introduced: the measure is distorted if the association decreases. Using data from a public sector organization, we find evidence consistent with the existence of distortions. We draw implications for the selection of performance measures.
JEL H72, J33, L14
Keywords: Performance Incentive, Performance Measurement, Distortion, Gaming, Multitasking, Government Organization.
1 Pascal Courty, Department of Economics, European University Institute, Villa San Paolo, Via Della Piazzuola 43, 50133, Firenze, Italy. Email: [email protected]; Gerald Marschke, Department of Economics and Department of Public Administration and Policy, BA-110, University at Albany, State University of New York, Albany, NY 12222, [email protected]. We thank seminar participants at IZA, Bristol, Tinbergen Institute, Turin, and at the 2003 NBER Summer Institute Productivity/Organizational Economics/Industrial Organization Joint Meeting, and Robert Gibbons, James Heckman, Carolyn Heinrich, and Jeff Smith for insightful comments. The usual disclaimer applies.

1
1 Introduction
A central focus of the economics of the firm is the motivation of workers within
organizations. The problem of identifying performance measures that impel workers to take
appropriate actions is at the heart of the problem of incentive provision. In the real world, explicit
performance measures are frequently distorted, eliciting dysfunctional and unintended responses,
also known as gaming responses, which prove costly to organizations (see Holmstrom and
Milgrom, 1991 and Baker, 1992, for example). Understanding when a performance measure is
distorted, the extent of gaming responses and their nature, is essential to rule out poor incentive
designs that could put the organization at risk and also more generally to improve the effectiveness
of measurement systems. Gaming behavior, however, is difficult to identify because it is typically
hidden from the researcher and in many cases, at least for some time, from the organization as well.
Despite this difficulty, a growing literature has documented the existence of distortions in
several organizational contexts. For examples of distorted measures and the damage they cause in
the private sector, see the specific references to performance pay and employee misconduct in
Baker et al (1994). For an example from the public sector, see Jacob and Levitt (2003).
Prendergast (1999) reviews the empirical evidence of distortion in performance measures.
Following the seminal work of Healy (1985), this literature has circumvented the identification
challenges by focusing on gaming responses where distortions can be unambiguously identified
from the specifics of the contract (e.g. manipulating accounting figures). The main shortcoming of
this approach is that by its very case-study nature, it can be applied only to a narrow set of gaming
responses and it requires detailed information on the contracts and on agent behavior that is often
difficult to observe. There is no general method to address the question of whether a performance
measure is distorted.
We develop a new approach to identify whether a measure generates distortions. Our starting
assumption is that different performance measures generate different sub optimal responses.
Although performance measures share in common the feature that they attempt to communicate the

2
true organizational goal, they are imperfect proxies and the sources of their imperfections likely
differ. The strategies that optimally game a given measure may have little impact elsewhere. We
propose to test for distortions by assessing how the performance outcomes change after the relative
weight placed by the incentive system on a performance measure changes.2 A natural application
of the model, which matches our case study, occurs when a new performance measure is
introduced.
We extend Baker’s 2002 model to derive a simple test of distortions that only requires
estimating how the association between a performance measure and the principal’s objective (value
of the organization) changes after a change in the incentive weights. The two statistics of
association we use are the Pearson’s correlation coefficient and the slope coefficient from a
regression of organizational value on the performance measure. We consider these statistics
because they have been commonly used in the literature, as we shortly argue, to evaluate
performance measures. The term association in this paper will be used as shorthand for correlation
and regression coefficient. We show that a measure is distorted if this association—either
measured as a correlation or by regression—decreases after the relative weight placed on the
performance measure increases. The intuition for this test is that after a measure receives more
emphasis, the agent takes measure-specific actions that maximize the measure but that do not
maximize the true goal. Not only will these actions decrease the covariance between the measure
and organizational value, but they also increase the variability of the measure. These two channels
imply a reduction in the association between the measure and the true goal.3
We test this hypothesis in the incentive system of a federal training organization created
under the Job Training Partnership Act (JTPA), which, between 1982 and 2000, provided job
training to the economically disadvantaged. There are several reasons for choosing this case study.
2 We call the performance measure the rule used to collect and aggregate the data generated by the agent’s actions and the performance outcome the value generated when that rule is applied to specific data. 3 Others have also argued that performance outcomes should change after a measure is activated. For example, Meyer and Gupta (1994) argued that the worthiness of a performance measure degrades after it is activated. The concept of

3
To start, JTPA used incentive-backed performance measurement, rewarding successful training
agency managers with small budgetary increases. In addition, JTPA was the object of a large-scale
experimental study that produced unusually precise and complete information on performance
outcomes and organizational value. Another important reason for using this case study is that in
the late 1980’s the Department of Labor introduced new set of performance measures, designed to
better reflect JTPA’s stated objective to raise the earnings ability and lower the welfare dependency
of the poor. For these new measures, we can observe performance outcomes as well as
organizational impacts, before and after each measure’s introduction. We find that the association
between the new performance measures and the objective of the organization decreased after the
introduction of these measures.
This paper contributes to two literatures. First, and as mentioned earlier, it contributes to the
empirical literature that identifies the existence of distortions. A substantial fraction of the
literature focuses on responses where the agent uses its discretion over the timing and reporting of
performance outcomes to meet performance thresholds (Healy, 1985; Asch, 1990; Oyer, 1998;
Jacob and Levitt, 2002; Oettinger, 2002; Burgess et al., 2002; and Courty and Marschke, 2004). In
contrast, our approach offers a more general test that captures a wide class of distortive responses
and that only requires computing changes in simple statistical measures of association before and
after a change in relative incentive weights. The main advantages of our approach are that it is
general and it relies on data that are often easy to collect.
This paper also contributes to the literature on the implementation of performance
measurement. An important pre-occupation of the literature is the selection of performance
measures (e.g., Gibbs et al, 2004). Researchers in this literature, and practitioners as well, evaluate
the usefulness of performance measures based on how associated they are with the objective of the
organization. Ittner and Larcker (1998), Banker, Potter, and Srinivasan (2000), and van Praag and
degradation, however, does not suggest clear statistical predictions for how the measure and organizational value should change.

4
Cools (2001), for example, use regression methods to evaluate alternative performance measures
for managerial compensation plans in the private sector. Much of the recent policy and public
administration literature is also concerned with performance measurement, as interest in
performance measurement and accountability in the public sector has waxed in recent years (e.g.
Heckman, Heinrich, and Smith, 2002). Researchers in these literatures test the validity of
performance measures by correlating them with “true” measures of the organization’s objective.
Measures that appear the most correlated with the objective are deemed most likely to be
successful. These methods, however, lack a theoretical justification. By showing that a validation
method based on correlation or regression analysis prior to the measure’s introduction is flawed
because it fails to capture the distortion margins that are not yet revealed, our model contributes to
the practice of performance measurement validation and selection. Although one has to be cautious
in using correlations or the results from regression analysis to select performance measures, one
can use the change in association to test for the existence of distortions after a measure is
introduced.
This paper is organized as follows. Section 2 presents a simple framework to test for
distortions. Section 3 presents some preliminary evidence consistent with this framework and tests
our predictions in the JTPA organization. Section 4 concludes.
2 Model
We adopt the multi-tasking principal agent paradigm (Holmstrom and Milgrom, 1991; Baker,
1992; Feltham and Xie, 1994; and Banker and Datar, 2001) and build upon our previous work
(Courty and Marschke, 2003a).4 In contrast to most of the principal agent literature, which
concentrates on how the principal designs the incentive contract, we focus on the agent’s effort
decision because our goal is to investigate how the agent responds to different sets of performance
4 The theoretical literature on the design of incentives is reviewed in Gibbons (1997) and Prendergast (1999). More recently, Dixit (2002) reviews the incentive literature but focusing on those issues that are specific to the public sector.

5
measures and to derive conditions under which one can identify the existence of measurement
distortion from these differences. Although our framework is fairly general, it does raise issues,
many of which can be addressed satisfactorily without distracting from the main argument. Other
aspects of the model will be more easily discussed after we have exposed our main result.
The empirical tests we derive presume that the researcher has multiple observations of agent
performance, or performance outcomes, under different contracts. In addition, we assume that the
performance outcomes have been generated in different production environments; that is, the
marginal productivity of effort varies across observations. These assumptions hold in many
environments where performance measurement has been used. To illustrate, consider an
environment where performance is measured on a monthly basis (as for some salespersons who
earn commissions based on sales volumes) and the marginal productivity of effort varies seasonally
(perhaps due to fluctuations in consumer demand). Alternatively, consider an application to
managerial compensation in which the researcher observes accounting performance in a sample of
firms that use the same accounting measures. In this case it would be natural to treat each firm as a
different production environment. As a final illustration, consider an agent who must complete a
fixed number of heterogeneous projects. The researcher observes the agent’s performance for each
project. Since this corresponds to the interpretation that matches our case study, as we argue
shortly, we will present the model in this context, but one should keep in mind that the model
applies more broadly, encompassing all of the examples described above, as well as others.
The agent exerts effort on a set of projects α∈A, which is assumed, for now, exogenously
given. The index α captures the difference in production environments. The agent privately
observes each project’s type α after signing the contract but before making her effort decisions. In
the context of our JTPA case study, for example, a project will be a group of enrollees that share
the same demographic characteristics (e.g., race, gender, and educational level---we provide

6
evidence below that the marginal productivity of different training activities vary across
demographic groups).
We propose a fairly general structure for the production environment that is designed to
capture several of the problems associated with performance measurement that have received
attention in the literature. We assume that the agent’s actions on each project influences two
performance measures and a measure representing the value of the organization. Following the
literature (e.g. Holmstrom and Milgrom, 1991, and Baker, 1992) we assume linear production
technologies. The performance outcome for project α on measure i=1,2 is
pi,α(e,g)=v0,αe0+(vi,α+ηi,α)ei+wi,αgi,
where (e,g)=(e0,e1,e2,g1,g2) are the agent’s productive efforts and gaming efforts (which the
researcher does not necessarily observe). The agent makes choices (e,g) for each project type α.
The decisions (e,g) correspond to the concept of state contingent action in Holmstrom and Milgrom
(1991, p.30) and Baker (1992, p.601). We define gaming as an effort that is costly but does not
enter—or, enters negatively—the principal’s objective function. We assume that vi,α≥0, vi,α+ηi,α≥0,
wi,α≥0 and Eηi,α= Eη3i,α=0. Our specification ignores additive performance measurement noise.
This assumption is not restrictive for the analysis, which focuses on distortion rather than on the
optimal weighting of performance measures.5
We assume that the costs of e and g are the same across all projects and are respectively
½ei2 and ½gi
2, for i=0,1,2. We explain later that our results generalize to the case where the cost
functions depend on the projects’ types. The value produced by the agent—or what the principal
cares about in our case study—on project α is,6
Vα(e,g)=v0,αe0+v1,αe1+v2,αe2-(ξ1,αg1+ξ2,αg2).
5 In the standard principal agent model, measurement noise plays a role in the determination of the optimal contract, but it does not directly influence the agent’s investment decisions. 6 If the organization were a firm, V would be market value (Baker 1992). For non-market organizations, we mean for V to represent the contribution of the agent to the “social value” created by the organization.

7
with ξ1,α, ξ2,α≥0. e0 captures the dimension of effort that is common to both performance measures
and to the organizational objective. In addition, both performance measures imperfectly capture
different dimensions of effort (e1 and e2) and both have a gaming dimension (g1 and g2).
We say that a performance measure is distorted if it either imperfectly captures the marginal
productivity of effort, i.e. ηi,α≠0 for some α, or if the agent can take gaming actions that increase
the performance measure but not the objective, i.e. wi,α>0 for some α.7 The idea of random
marginal productivity is that the agent may have incentives to exert good effort, but not in the
correct quantities--e.g., if she were a teacher being evaluated by the results of standardized tests,
she might spend too much time on tested skills (p. 733, Baker, 2002). Examples of gaming actions
in the same context include a teacher providing her students with, or filling in, the answers to the
test (Jacob and Levitt, 2002). In the context of our application to job training, Courty and
Marschke (2004) present evidence of random marginal productivity in the form of distorted
training investments, and of gaming in the form of accounting manipulations that sometimes waste
resources and/or that have a negative impact on the objective (ξ1,α, ξ2,α>0). We will revisit this
work as well as other works in the next section. Although we introduce these dual channels of
distortion for the sake of generality, our test will not be able to empirically distinguish the two.
For generality, we consider the possibility that ξ1,α, ξ2,α>0 but our main prediction also holds if
ξ1,α=ξ2,α=0.
Finally, and to simplify, we assume that the marginal productivities vi,α, ηi,α, wi,α, and ξi,α are
orthogonal to one another. Although simplistic, this assumption is made for tractability and should
be interpreted as a first order approximation of a more complex specification. Note that distortions
are measure specific. The distortive actions that increase performance measure one leave
7 This concept of distortion is different from the concept of congruence or alignment sometimes used in the theory literature to mean pα=Vα for all α. In our framework, a non-distorted measure is still not aligned because it communicates only one of the two measure specific effort dimensions (e1,e2).

8
performance measure two unchanged and vice versa. This is reasonable as long as the two
performance measures are unlikely to share the same weaknesses.8
The principal receives only two signals of performance. The performance outcome for
measure i is the sum of performance outcomes over all projects
Pi=∑α pi,α(eα,gα).
(We use the terminology performance outcome to refer to both the project level outcomes pi,α
and the aggregated outcome Pi and the context should clarify which concept we have in mind.)
Assume for now that the weights on performance measure one and two are β1 and β2,
respectively. The agent chooses productive and gaming efforts (eα,gα) to maximize
∑iβiPi-½∑α(e0,α2+∑i(ei,α
2+gi,α2)).
To simplify the exposition, let (eα(β1,β2), gα(β1,β2)) denote the agent’s optimal efforts for project α
when the performance weights are β1 and β2 respectively, and similarly denote pi,α(β1,β2) and
Vα(,β1,β2) the performance outcomes and realized value. The agent’s effort response is
e0,α(β1,β2)= (β1+β2)v0,α,
ei,α(β1,β2)= βi(vi,α+ηi,α), for i=1,2, (1)
gi,α(β1,β2)= βiwi,α, for i=1,2.
The agent’s choice (eα(β1,β2),gα(β1,β2)) generates the performance outcome for project α and
measure i
2,2
2,,
2,02121, )()(),( ααααα βηβββββ wvvp iiiii ++++= (2)
The value generated for project α is,
( )∑ −+++= i iiiiii wvvvV ααααααα ξηβββββ ,,,,,2,02121 )()(),( (2’)
The realized performance outcome and value depend on the agent’s efforts, which in turn depend
on which measure is activated and on the performance weights.
8 We could have assumed that both measures also share a common dimension of distortion (either through a common random marginal productivity of effort (v0,α +η0,α)e0,α or through common gaming investment w0,αg0,α) but since this

9
The central assumption of the model is that different measures are likely to display different
distortionary weaknesses. As we will see, conditional on this assumption it is possible to identify
the existence of (measure specific) distortions. The current model makes several simplifying
assumptions about the cost and production technologies. Some of these assumptions are standard
while others were made for ease of exposition. For example, we have ignored the possibility that
the agent could select projects. We will return to this assumption as well as other aspects of the
model after exposing the main result.
2-1 Change in the Relative Weight of a Performance Measure
Organizations often change the weights on the performance measures they use, and sometimes
change the set of performance measures, replacing outdated ones, or augmenting old measures
with new ones as they become available. Assume that the principal changes the weights on
performance measure one and two from (β1,β2) to (β1’,β2’). We have in mind that the principal
could either introduce performance measure two in the second stage (β2’>β2=0) or just increase the
weight on performance measure two (β2’>β2>0). For now, we assume that the agent (myopically)
maximizes the performance award in each measurement regime. This assumption is valid if the
agent’s early actions do not influence the decision to change the performance weights, an
assumption that holds in our case study, as we argue below.
Assume that the researcher can only observe Vα(β1,β2) and p2,α(β1,β2) for α∈A before and
after the change in performance weights and can compute population statistics (e.g. EVα(β1,β2) and
Cov(Vα(β1,β2),p2,α(β1,β2)). We ask the following question: Is it possible to establish whether
common effect can be picked up in our test only under strong functional form assumptions, we ignore it to keep the exposition simple.
10
performance measure two is distorted—that is, whether η2,α>0 or w2,α>0—based on simple
statistics involving Vα(β1,β2) and p2,α(β1,β2)?9
Expressions (2) suggests a prediction on how the mean of a performance measure should
change after its weight increases. If overall incentive weights do not decrease, β1’+β2’≥β1+β2, the
mean performance outcome on measure two should increase when β2 increases.
),(')(')''()','( 21,22,22
2,2,22
2,02121,2 βββηβββββ αααααα pEEwvEEvpE >++++= .
Similarly, the variance of measure two should also increase,
),(')(')''()','( 21,22,2
22
2,2,2
22
2,0
22121,2 βββηβββββ αααααα pVarVarwvVarVarvpVar >++++= .
An increase in the mean or variance is consistent with distortion but it is also consistent with an
increase in measure specific productive effort (e2, in this case). Stated formally, one would also
expect the mean and the variance of measure two to increase even if 0,2,2 == ααη w . This implies
that the evidence of a performance outcome increase or an increase in the variance of the outcome
is not sufficient to conclude that distortion takes place.
The covariance between p2,α and Vα can provide a more conclusive test.
),(
))(,)(()()),(),,((2,2,2,2
22
,2,2,22
,2,222
2,0
2212121,2
ααα
αααααααα
ξβ
ηηβββββββ
wwCov
vvvCovVarvVpCov
−
++++=
The first term is clearly positive. As shown below, the second term is positive and the third one is
negative.
0)()())(,)(( ,2,2,22,2,2,2,2,2,2,2
2,2,2 ≥+++=++ αααααααααααα ηηηηη vvEvVarvvvvCov
0)]()[(),( ,2,22
,2,2,22,2,2,2 ≤+−−=− αααααααα ξξ EwwEwwEEwwCov .
Since the covariance decreases only if wi,α≠0 and ξi,α ≠0 for some α, finding that the covariance
decreases would constitute evidence of gaming. This test of distortion, however, can identify only
gaming responses—it cannot identify distortions due to random marginal productivity—and can be
9 Note that it could be possible in principle to identify the existence of distortions using information at the project level. We prefer to use population statistics to identify distortions because this is likely to generate more robust tests based on

11
used only in environments where gaming effort can reduce the organization’s value, i.e. when
0,2 >αξE . To derive more general predictions, one has to isolate distortive responses from the
responses that have to do with measure specific productive effort. The following proposition uses
the fact that Var(p2,α) and Cov(p2,α,Vα) respond differently to a change in the relative weight.
Proposition 1: (i) Measure two is distorted if and only if Cov(p2,α,Vα)/Var(p2,α) decreases
after an increase in β2/β1. (ii) If measure two is not distorted, then Corr(p2,α,Vα) increases when
β2/β1 increases. (The proof is presented in the Appendix)
Claim (i) has a nice interpretation since Cov(p2,α,Vα)/Var(p2,α) corresponds to the regression
coefficient of Vα on p2,α. The intuition for this result is that if Cov(p2,α,Vα)/Var(p2,α) decreases it
has to be that Var(p2,α) increases more (in proportional terms) than Cov(p2,α,Vα) and this implies
that some distortions have to have taken place. Claim (ii) implies that evidence of a change in
correlation is not always as conclusive. Whether the correlation between measure two and the
organization’s objective increases or decreases depends on the relative impact of gaming and
measure specific productive effort. Here it is worth considering two benchmark cases. Consider
first the case where there are no distortion margins (wi,α=η2,α=0 for all α). In this case, the
correlation increases because the agent exerts more measure specific productive effort. This
increases the predictive power of the measure: the correlation between Vα and p2,,α increases.
Consider next the case where there is no measure specific effort (v2,α=η2,α=0 for all α) and assume
ξ1,α=ξ2,α=0 to rule out the possibility that a decrease in the correlation is due to a decrease in the
covariance. A sufficient condition for the correlation between measure two and value to decrease
when β2/β1 increases is
)( ,1,1,12
12,2 αααα ηβ
β +> vvVarwVar .10 (3)
aggregated information, and also because it relates to the previous literature on the use of association measures to validate performance measures. 10 A proof is presented in the appendix.

12
The intuition is that the increase in β2/β1 increases the noisiness of measure two and therefore
decreases its predictive power.
Clearly, ξ2,α>0 introduces a force that moves the measure and organizational value in
opposite directions therefore reducing the covariance between the two. Even in the absence of that
force (ξ2,α=0), however, Proposition 1 still holds. In addition, Proposition 1 holds for any increase
in β2/β1. In particular, it follows when a performance measure is introduced. This suggests a
strategy for identifying distortions that does not necessitate the exact knowledge of the incentive
weights, which are often difficult to obtain. The researcher only needs to know when a
performance measure is activated.
2-2 Discussion
Agent’s private information
An implicit assumption of the model is that the index α captures both the agent’s private
information on the production environment and also the unit of observation to compute population
statistics. This assumes that the researcher and the agent observe the same set of projects. (The
agent is still better informed since she observes vi,α, ηi,α, and wi,α while the researcher does not.)
In practice, however, the agent will be able to condition her effort decisions on a richer
information set than what the researcher observes. In the context of our application to a job
training program, for example, we use the demographic characteristic of trainees to define the
project population Α. There are good reasons to believe that the marginal productivity of effort
varies across demographic groups as we argue next. But it is also likely that the agent observes
additional information on enrollees within a given demographic group. Assume the researcher
does not observe α but observes a coarser information partition, with representative element γ⊂Α.
The researcher observes E[pi,α(β1,β2)|γ] and E[Vα(β1,β2)|γ] where E[.|γ] is the expectation
conditional on information γ. Taking conditional expectation in expression (2)

13
]|[]|)[(]|[)(]|),([ 2,2
2,,
2,02121, γβγηβγββγββ ααααα wEvEvEpE iiiii ++++=
and similarly for expression (2’). Obviously, E[pi,α(β1,β2)|γ] varies less than pi,α(β1,β2). Still, as
long as distortion incentives vary within the coarser information set (Var E[η2i,α|γ] ≠0 and/or Var
E[w2i,α|γ]≠0) the proof of Proposition 1 follows under additional, minor assumptions and it is
possible to identify distortions although one is more likely to wrongly reject the hypothesis that
there are no distortions.11 To illustrate, consider the extreme case where the distributions of ηi,α
and wi,α are independent of γ.12 The researcher observes multiple observations on performance
outcomes but the production environment does not vary across observations. A correlation
measure, for example, is degenerated (equal to 1) before and after the change in the weight
independently of the existence of distortions.
Unobserved heterogeneity: Marginal cost
Our specification considers only one source of unobserved heterogeneity: variations in
privately observed marginal productivities of effort. There could also be heterogeneity in costs
that could be privately observed by the agent. One can show that Proposition 1 generalizes to
unobserved heterogeneity in the marginal costs. Assume for example that the cost of effort e0,α is
½c0,αe0,α2 and the other costs functions are similarly defined with random marginal costs ce,i,α and
cg,i,α. The expression for pi,α and Vα in (2) and (2’) can be written as
2,2
2,,
2,02121,
~)~~(~)(),( ααααα βηβββββ wvvp iiiii ++++=
( )∑ −+++=i iiiiii wvvvV ααααααα ξηβββββ ,,,,,
2,02121
~~)~~(~~)(),(
where
α
αα
,0
,0,0
~c
vv = , α
αα
,,
,,
~ie
ii c
vv = , α
αα
ηη,,
,,
~ie
ii c
= , α
αα
,,
,,
~ig
ii c
ww = , α
αα
ξξ,,
,,
~ig
ii c
=
Proposition 1 follows.
11 Sufficient conditions for the proposition to hold are E[E(ηi,α|γ)E(η2
i,α|γ)] =0 (instead of Eη3i,α=0 before) and
0))|(),|(( 2,2,2 ≥γγ αα wEwECov (we had before w2,α≥0 imply 0),( 2
,2,2 ≥αα wwCov .

14
Unobserved heterogeneity: Project selection
Another source of unobserved heterogeneity emerges if the agent can select the projects on
which she exerts effort. Our assumption that the set of projects Α was exogenously given
previously ruled this kind of unobserved heterogeneity out. To illustrate the possibility of
endogenous project selection, assume there is an additional additive term on the production
technologies, ui,α, that is both measure and project dependent,
pi,α(e,g)=ui,α+v0,αe0+(vi,α+ηi,α)ei+wi,αgi
Vα(e,g)= u0,α+v0,αe0+v1,αe1+v2,αe2-(ξ1,αg1+ξ2,αg2)
and assume that the agent can disregard some projects (e=g=0). If the weight on measure i
increases, the agent will not select projects with large negative ui,α. As a result, the performance
outcome should increase. In addition, the set of projects observed by the researcher will change.
Whether project selection changes the predictions stated in Proposition 1 depends on the joint
distribution of the random coefficients ui,α, vi,α, ηi,α, wi,α, and ξi,α. Consider first the benchmark
case where ui,α, vi,α, ηi,α, wi,α, and ξi,α are jointly independent. Then proposition 1 still holds even
if the agent selects projects. Although the additive fixed effect influences the set of projects
observed by the researcher, Proposition 1’s predictions do not change because the selection rule is
independent of the marginal productivities. The intuition is that even after having selected the
most attractive projects, the agent still has an incentive to take advantage of the distortion margins
that these projects offer. If such margins exist, the agent effort and gaming choices should be
revealed in our test of distortion.
Under the independence assumption, selection and effort choices are independent issues that
can be addressed separately. It should be recognized, however, that our test of distortion does not
shed any light on the possibility that the change in the relative weights may increase the amount of
inefficiencies that are due to perverse selection incentives. We acknowledge that such changes in
12 In this extreme example, γ is a random variable independent of α.

15
the selection rule may have important welfare impacts but this is not the focus of this paper. In the
context of our case study, the selection issue has already received much attention in the literature
(for example, the cream skimming literature is summarized in Heckman, Heinrich, and Smith,
2002).
If the projects fixed effects ui,α are correlated with the marginal productivity of effort
(v0,α,v1,α,v2,α,ξ2α) then Proposition 1 may not hold anymore. There is no a priori reason, however,
why ui,α should vary in systematic ways with vi,α, ηi,α, wi,α, and ξiα. In our application, for
example, results from Heckman, Smith and Clements (1997) and Heckman, Heinrich, and Smith
(2002) suggest no relation between the level of human capital (ui,α) and human capital impact
(v0,α,v1,α,v2,α).13 As a final comment, note that even in the case where the random coefficients are
not jointly independent, Proposition 1 still holds for the subset of projects that are selected under
both regimes (β1,β2) and (β1’,β2’).
Efficiency loss due to distortions
Define the efficiency loss due to distortions as the difference in the organizational value when
ηi,α=wi,α=0 and when ηi,α≠0, wi,α ≠0, holding the incentive weights constant and assuming that the
agent chooses the optimal effort responses (eα,gα) according to (1). Consider the simple case where
gaming does not enter organizational value negatively, that is ξ1,α= ξ2,α=0 and assume that measure
one is not distorted. The expected loss due to the distortions in measure two is
( )2,2
2,2
222
1ααηβ EwE +− .
To estimate the efficiency loss of distortions, one needs to know the second moments of η2,α and
w2,α. Inspection of the expressions of Ep2,α(β1,β2) and EVα(β1,β2) reveals that the cost of
distortions can be expressed as
13 Only for individuals within the lower 20th percentile of earnings levels did they find that higher earnings levels imply higher earnings impacts. But this suggests a positive correlation between ui,α and v0,α, v1,α,v2,α, which imply that our test would underestimate distortions.

16
( ) ( ) ( )( ))0,(),()0,(),(21
21
1211,221,222,2
2,2
22 βββββββηβ αααααα EVEVEpEpEwE −−−−=+− .
The usefulness of this result is limited to the extent that it rests on many functional form
assumptions.
2-3 Summary
The model makes several predictions on how the first and second moments of a performance
outcome should change after the performance weights change. These predictions rest on different
scenarios on the changes in the weights and address different types of distortions. To recap, if the
relative weight on measure two increases then:
(a) Measure two is distorted (i) if and only if Cov(p2,α,Vα)/Var(p2,α) decreases, and (ii) if
the correlation between the performance outcome and organizational value
decreases.
If the relative weight on measure two increases and the sum of the weights does not decrease then:
(b) The variance in performance outcome should increase.
(c) The average performance outcome should increase.
(d) The covariance between the performance outcome and organizational value could
increase or decrease and the latter occurs only if gaming enters negatively
organizational value ( 0,2 >αξE ).
Predictions (b-c) should hold if the assumptions of the model are valid. In particular, finding
evidence consistent with these predictions would provide support to the hypothesis that the agent
responds to the incentive system. Prediction (a) offers a new way to test for the existence of
distortions. Finding evidence that the correlation (or covariance divided by the variance of the
measure) decreases is consistent with the hypothesis that the agent responds to incentives and with
the hypothesis that some of these responses are distortive. Prediction (d) also suggests a test of
distortions but it holds only for gaming actions that enter negatively organizational value (it

17
excludes gaming actions that do not enter organizational value and distortions due to random
marginal product). Finally, prediction (b-d) require information on absolute and relative weights
while prediction (a) requires information on relative weights only. In particular, prediction (a)
always holds if one considers the introduction of a new measure.
3 Empirical Application to a Government Job Training Program
We investigate predictions on (a-d) with a focus on (a). Before proceeding, we present
background evidence to demonstrate the validity of our case study. First, we review the training
program literature that has computed correlations as well as regression estimates to validate
performance measures in similar environments as the one we consider. This provides a
preliminary assessment of the model. Second, we argue that the assumptions of the model hold in
our case study.
3.1 Literature Review and Preliminary Evidence
Job training programs that serve the economically disadvantaged have been an important part
of the federal government’s war on poverty at least since the Kennedy administration. In the
1970s several influential studies showing the ineffectiveness of federal job training efforts
prompted Congress to reconsider how job training programs were constituted. Beginning with the
Job Training Partnership Act (JTPA) of 1982 and continuing under the legislation that supplanted
JTPA, the Workforce Investment Act (WIA) of 1998, the bureaucracy that runs the federal
government’s most important job training program for the poor has become highly decentralized.
Since the early 1980’s, training has been conducted by over 600 local job training agencies (the
agent in the model) each enjoying substantial discretion over who they enroll and what types of
training they provide. By allowing this discretion, Congress hoped that job training administrators
would be free to use their expertise in training and their superior knowledge of “conditions on the
ground” to provide better training. But in increasing administrators’ discretion over their work,

18
Congress anticipated that administrators would also have greater means to pursue private
objectives. Therefore, in addition to allowing more freedom in decision-making, Congress sought
to provide stronger incentives to promote programmatic objectives by linking financial incentives
to measures of program outcomes. Thus, since JTPA’s passage, training agency budgets have been
partly contingent on their performance on explicitly defined measures. These measures were
comprised of variants of program participants’ employment and wage rates measured at or shortly
after the participants’ “graduation” from their training.
Performance measure validation literature
JTPA’s stated goal was to promote increases in the employment and earnings of enrollees
(JTPA, Section 106(a)). Numerous studies have attempted to test the ability of short-term outcome-
based measures, such as those of JTPA, to capture long-term earnings and employment gains of
enrollees. These studies have been conducted using job training data from JTPA, but also from
other job training programs that had not been subject to performance-based measurement.
Gay and Borus (1980), Friedlander (1988) and Zornitsky, et al. (1988) conducted their
studies of the association of short-run outcomes and long-term employment and earnings gains
based on data from job training programs that had no explicit performance measurement backed by
financial incentives.14 Gay and Borus regressed V (earnings impacts) on various measures of P.
For those P that they constructed to look like JTPA’s performance measures, they found no positive
and significant estimates of the coefficient on P. Friedlander used sample correlations of P and V
to assess P’s validity. He found that employment rates were correlated with measures of earnings
impacts in most cases. Zornitsky et al. tested a wide range of JTPA-like performance measures and
reported that enrollees who were likely to produce high scores on employment-based performance
measures were also likely to generate high earnings impacts. They used statistical correlation to
14 Each of these studies measure impact at the subgroup level (α in V represents a demographic subgroup) and performance outcome at the individual level (α in P represents an individual ).

19
establish the positive association between various P measures and V. They also used R-squareds
from regressions of V on P to rank different measures by their predictive power.
In their studies based on data generated from JTPA, Heckman, Heinrich, and Smith (2002)
and Barnow (2000), however, found little evidence of a relationship between performance
measures and earnings impacts. Heckman, Heinrich, and Smith found that the performance
measures “are weakly and sometimes perversely, related to long-term impacts” (Heckman et al, p.
778). As we do in this paper, Heckman et al. related performance and measures of organizational
value at the enrollee subgroup level. Also like us, they used regression analysis to test the
association between P and V. Barnow’s unit of analysis was the training agency. He used simple
correlation and rank correlation tests to evaluate the association of P and V.
An important implication of our model is that the association between the performance
measure and the objective of the organization is endogenous. That is, because placing incentives on
performance measures cause agents to find low cost strategies that raise the performance measure
and that do not also raise the objective of the organization, the association between the performance
measure and the objective of the organization degrades after the measure’s introduction. What is
interesting about the above-cited studies for the purpose of our study is that only in programs where
performance is uncompensated (Friedlander and Zornitsky et al) have researchers found
statistically significant correlation between short-term performance measures and impacts.
Of course this observation is not definitive because we compare studies that are based on
different programs and on different methodologies. Some of these studies construct their measures
of job training success using data from social experiments, while others construct them by
comparing the labor market outcomes of persons who obtained training to outcomes of persons
from an artificially constructed control group. An analysis using a consistent methodology and
data from a single program subject to exogenous variation in performance measures in an
organizational environment that is in other ways unchanging would be more definitive. We
describe such an analysis next.

20
3.2 Application to JTPA
By meeting the numerical standards corresponding to a set of performance measures, training
agencies were eligible to win a monetary award. In the early years of JTPA, performance measures
were based on an enrollee’s employment status at the date the enrollee officially graduated from the
program. A training agency’s performance outcome for a given fiscal year was computed as the
average outcome over all enrollees graduated over the course of the year. One measure that was
important during the early part of JTPA (and through the period of our analysis) was computed as
the fraction of enrollees who were employed on the dates of their graduation. If the training
agency’s year-end employment rate at graduation exceeded the standard for that measure, the
training agency would win an award.15
In the late 1980s, the U.S. Department of Labor (DOL) began to change the set of
performance measures used to evaluate training agency performance. DOL formulated new
measures that rewarded training agencies for employment rates measured not on the graduation
date, but on the date ninety days following the graduation date. Other measures were based on an
enrollee’s employment history over the entire duration of the 90 days following graduation. Table
1 defines the new performance measures based on the ninety day follow-up period. By adding
measures that captured labor market outcomes further removed from job training, DOL hoped to
encourage training agencies to offer more substantive training that would produce longer-lasting
impacts on enrollees’ skills. DOL required states to implement these new measures, but gave
states some leeway in how quickly they were added. Thus, different states made these transitions
in different years.16 We use this variation in the years of implementation as a natural experiment.
15 The award for the successful training agency averaged about seven percent of its budget. In some states, the highest awards amounted to about sixty percent of the training agency’s budget. The reader who is interested in the details of the incentives confronting JTPA training agencies should see Courty and Marschke (2003b). 16 See Courty and Marschke (2003b) for a description of the performance measures, incentive system, and the reasons for the changes in the performance measures in these years. Courty and Marschke also detail the timing of the performance measure changes by state.

21
Although the absolute weights for several measures have changed in our sample we focus on
the addition of the follow-up measure for two reasons. First, this is the only set of measures for
which we are sure that the relative weight increases. Since the weight on these measures was zero
prior to activation, this weight relative to other measures has to increase after activation, and this
statement holds independently of the changes on the weights of other measures. Second, most states
have introduced the follow-up measures at some point in our sample while the change on the
weights of other measures were typically more idiosyncratic.
Before proceeding, we review the key assumptions of the model and argue that they are likely
to hold in our case study.
Exogeneity of changes in performance weights
We consider the introduction of the three performance measures presented in Table 1: the
employment rate at follow-up, average weeks employed at follow-up, and average earnings at
follow-up. An important assumption of the model is that the agent myopically maximizes the
performance award in each period (ignoring the impact of first period productive effort and gaming
choices on the second period performance weights). This is reasonable if the change in
performance weights, or the introduction of new performance measures, as in our case study, is not
influenced by the agent’s behavior. (If this assumption is violated, then the agent may internalize
the fact that her early actions may trigger a change in the performance measures. This may
influence the agent’s effort choice and also the association between the performance measure and
organizational value.)17 This assumption that each agent myopically maximizes her performance
award is reasonable in our application because there are more than 600 independent and
geographically separated agents and to our knowledge there is no evidence that the agents ever
colluded. Because the principal applies the same set of measures to all agents, the decision of each
17 For example, assume the principal retains a measure only if the correlation between that measure and the true goal does not decrease after its initial introduction. If the agent knows this, she may try to keep the correlation constant by trying to maintain a balance between the increase in measure specific effort and distortions. If this is the case, our test may fail to identify distortions.
22
individual agent to game a measure has very little impact on the principal’s decision to change the
set of measures.18 Another related concern is that some training agencies may have anticipated the
introduction of the follow-up measures and may have prepared for this new regime. This, however,
does not invalidate our test because these agencies had no reason to actually start investing in
distortive effort until the new measures were actually implemented.
Variation in Production Environment and Examples of Distortion in JTPA
A fundamental assumption of the model is that the researcher has access to observations
drawn from multiple production environments (index α in the model) and that the marginal return
of distortions is, at least to some extent, measure specific. In our empirical work we define a
project as a demographic group. The agency serves multiple demographic groups and we can
measure the performance outcome and the value added for each demographic group before and
after the introduction of the follow-up measures. (Note that this is not the case for individual
trainees because we cannot compute value added at the individual level as we explain shortly.)
There is a wide body of evidence showing that the marginal return of training varies across
demographic groups, that is, vi,α varies with α. See for example Orr, et al (1997), who show that
the impacts of different kinds of training in JTPA vary by demographic group (see especially Table
4, p. 565), and also the validation literature reviewed earlier.
The existence of measure specific distortion margins (η2,α≠0 and/or w2,α>0) is established
in Courty and Marschke (2004). They document how training agencies delayed graduating
unemployed enrollees, even after their training concluded, because unemployed graduates
counted against the training agencies in the first decade of JTPA. In addition, they show that the
training agency adapted this strategy toward the end of the year to respond to the threshold
18 The assumption that a single agent’s actions have no or little influence on the principal’s decision to change the set of measures is not inconsistent with the possibility that the behavior of all agents taken as a group could have such an influence. There is some evidence that this was indeed the case in our case study (Courty and Marschke, 2005).

23
effects in the incentive scheme.19 Courty and Marschke found that by timing performance
measurement in this way training agencies boosted their performance, and their awards, without
providing higher-quality services, or providing services more efficiently. In addition, the authors
found evidence that this kind of gaming behavior consumed program resources.
Survey evidence suggests that the follow up measures may have also displayed specific
margins of distortions. Courty and Marschke (2005) offer evidence that these new measures
induced case managers to begin monitoring enrollees between graduation and the end of the
ninety day follow-up period. To increase the chances that employment matches lasted until the
thirteenth week after graduation, some training agencies reported that between graduation and
follow-up they started to offer, after the introduction of the follow-up measures, additional
services such as childcare, transportation, and clothing allowances. Case managers also actively
pressed employers to retain the clients until the third month. If the client lost her job, case
managers scheduled job-counselling appointments and offered placement services. After the
ninety day follow up period, however, case managers apparently withdrew offers of placement or
counselling services and severed contact with clients. These responses were clearly specific to
the follow up measures and it seems reasonable that these responses (e.g. childcare allowance)
varied across demographic groups. Although potentially productive, these responses qualify as
random marginal productivity of effort (η2,α>0) if they diverted resources from other activities
that increased long term earning and employment more. Some of these responses may even
qualify as gaming (wi,α>0) if they were counter or un-productive.
3.3 Empirical Model
Define the observed outcomes as
19 An agency usually arrived at the end of the fiscal year with an inventory of idle, unemployed enrollees on its books. The training agency would then have to decide which fiscal year to graduate the unemployed enrollees. If the agency finds itself either comfortably above or hopelessly below its standard, it could enhance its odds of winning an award in the next fiscal year without jeopardizing its award in the current year by graduating most or all of its inventory. If the

24
α,~
ip (β1,β2)=ui,α+eα(β1,β2)vi,α+gα(β1,β2)wi,α+εi,α
αV~ (β1,β2)=u0,α+eα(β1,β2)v0,α-(ξ1,αg1+ξ2,αg2)+εv,α
where εi,α and εv,α are zero mean random variables independent of pi, α and Vα that capture
influences on performance and value-added that are unrelated to efforts. Predictions a-d still hold
for the observed outcomes under the assumption that the joint distribution of (εi,α,εv,α) does not
change with the change in the performance weights.
We evaluate the relation between organizational value and the new performance measures
described in Table 1 before and after their activation. We follow the methodology of Heckman,
Heinrich, and Smith (2002), who evaluate the JTPA’s performance measures by regressing the
earnings and employment impacts of JTPA training (the Vα in our model) on the performance
measures (the pi,α), using the same data we use here. We also report results using both earnings and
employment impact, which are natural candidates for Vα since they correspond to the stated
objective of the organization and are typically used in the evaluation literature. We conduct
separate analyses for each of three performance measures of Table 1. The basic idea of our
analysis is that we construct estimates of performance outcomes and employment and earnings
impacts for various demographic subgroups of the sample. We then examine how the coefficient
estimates from regressions of subgroup impacts on subgroup outcomes (as well as other measures
of association) change with the activation of the corresponding measure.
Sample
In the sample period of our study, states were taking on additional performance measures;
they had for the most part not yet discarded the graduation-based measures.20 We develop our
empirical measures of performance outcomes and programmatic impacts using data from the
training agency found itself above but close to the standard, it could increase its award in the present year by postponing graduation until the following year. 20 Fourteen of the sixteen states added one or more of the follow-up measures described in Table 1 during the period we study. Over the same period, two states dropped a cost standard that had rewarded training agencies for keeping costs

25
National JTPA Study (NJS), an experimental study of the effectiveness of JTPA commissioned by
DOL and conducted between 1987 and 1989. Sixteen of the organization’s roughly 640 job
training agencies participated in the NJS.21,22 The study was conducted using a classical
experiment methodology according to which JTPA applicants were randomized into treatment and
control groups. The control groups did not receive JTPA training services for at least 18 months
after random assignment. 20,601 JTPA-eligible adults and youth participated in the study: 13,972
were randomized into the treatment group and 6,629 into the control group.
The empirical analysis in this study is based on the 13,338 adult NJS controls and treatments
with valid data. The information contained in these data include participant-reported information
on their education level, labor market history, family composition, welfare program participation
and demographic characteristics, as well as labor market, training, and schooling activity for
approximately 18 months after random assignment.23 The data also contain information sufficient
to construct measures of enrollee performance outcomes.
We first identify for each training agency in our data the program years for which the
performance measure was in effect. The performance measures in place in each state and program
year were obtained from documents on file in states’ departments of labor (see Courty and
Marschke, 2003b). We then assign each experimental participant to one of two subsamples based
on whether their random assignment date occurred in a program year in which their training agency
was evaluated by the performance measure under consideration: one subsample consisting of
enrollees trained under regimes where the performance measure is activated, and the other
consisting of enrollees trained under regimes where the performance measure is not or de-activated.
Computing Vα
per employment at graduation low. We omit the cost measure from our analysis because we cannot produce training cost estimates at the enrolee level using our data. 21 Note that we focus in this analysis on the adult side of JTPA, and ignore the smaller youth side. 22 See Doolittle and Traeger (1990) for a description of the implementation of the National JTPA Study, and Bloom et al. (1997) for a detailed description of its results. 23 For one quarter of the experimental participants, data were collected for an additional 18 months. This paper utilizes only the employment data for the first 18 months following random assignment.

26
To construct a measure of organizational value, one needs to observe earnings in two
mutually exclusive states of the world: for a given participant one needs earnings after receiving
training and earnings during the same period had the participant not received training. Of course,
the economist only ever observes a person’s earnings in one or the other state—she never observes
the counterfactual. Selection and other issues imply that non-experimental estimators have to rely
on strong assumptions (on these issues, see e.g., Lalonde, 1986, and Heckman, Smith, and Lalonde,
1999.) Many economists who evaluate social programs consider a social experiment the most
reliable way to produce impact estimates. In a properly executed randomized trial, the persons
receiving training are statistically equivalent in both observed and unobserved characteristics to the
persons in the control group so that any difference in earnings and employment can reasonably be
attributed to the training intervention. Thus to construct our estimates of earnings and employment
impacts we exploit the experimental data of the NJS.
Although it is not possible to construct an experimental estimate of Vα at the individual level
for the reasons mentioned above, it is possible to construct experimental estimates of Vα at the
subgroup level. Following Heckman et al, we construct impact estimates for subgroups based on
individual characteristics measured at the point of application. For each subsample, we construct
56 subgroups based on marital status, welfare/AFDC/Food Stamp receipt, race, age, gender,
educational attainment, employment status at application, earnings in the year preceding
application, and training agency. Thus, each individual appears in our sample several times. For
each individual in a subgroup, we compute an earnings figure by aggregating his/her earnings over
the 18 months following their random assignment.24 In the absence of a drop out problem,
consistent estimates of the subgroup earnings impact can be obtained from a simple comparison of
the 18-month earnings of treatments and controls within the subgroup. Over one-third of the
individuals in the treatment group drop out, however. We use a regression framework to estimate
24 Following Heckman, Heinrich, and Smith, we delete from our sample observations in the top one percentile of self-reported earnings to limit the influence of outliers.

27
the earnings impacts, employing a method suggested by Bloom (1984) to control for dropouts.25
We similarly compute employment impacts by comparing the number of months of employment
reported by treatments and controls during the eighteen months following random assignment.
Table 2A shows the estimated earnings and employment impacts for many of the subgroups we
created. Table 2A shows that the impacts are often small relative to their standard errors. This is
consistent with findings using these data reported elsewhere (Heckman, Heinrich, and Smith).
This exercise produces for each of the three performance measures that we study, earnings and
employment impacts for up to 112 subgroups: one set of up to 56 subgroups of enrollees trained in
regimes where the performance measure is activated, and another set of up to 56 subgroups of
enrollees trained in regimes where the performance measure is not activated. A regime may
contain fewer than 56 subgroups if there are some subgroups that contain no individuals trained
under the regime.
Computing pι,α
Because we compute earnings impacts by subgroup, we compute performance outcomes by
subgroup as well. Participants supplied monthly wage and employment information for each job
held in the 18-month period after random assignment. The NJS data file also contains the exact
graduation dates from agency records. We constructed the enrollee-level follow-up date-based
performance outcomes using the enrollee’s reported employment hours and wage information from
the calendar month containing the graduation date through the calendar month containing the
follow-up date (which occurs ninety days after the graduation date). In computing the enrollee-
level employment rate at follow-up outcome, we considered an enrollee employed at follow-up if
he/she reported employment in the third calendar month following graduation. To be consistent
with JTPA's definition of the measures, we constructed the earnings outcomes only for enrollees
who were employed in the third month following graduation. We constructed the average weekly
25 For a comprehensive discussion of the Bloom assumption and of the problem of drop-outs in experimental evaluations more generally, see Heckman, Smith, and Taber (2002).

28
earnings at follow-up outcome by computing the average weekly earnings of all the enrollee’s
employment spells ongoing in the third month following the graduation month and then summing
over all spells. We constructed the enrollee’s average weeks worked outcome by aggregating her
number of weeks of employment over the three month follow-up period. Then, for each of the
performance measures, we computed the subgroup performance outcomes by averaging the
individual performance outcomes within each subgroup. Table 2B describes the means of the three
performance outcomes for selected subgroups in our sample.
3.4 Results
We regress subgroup estimated employment and earnings impacts on their performance
outcomes, weighting the regression by the inverse of the Eicker-White standard errors from the
impact estimations. In using a regression framework, we are following Heckman, Heinrich, and
Smith, but also the performance measure validation literature in accounting (see, e.g., Ittner and
Larcker and Banker, Potter, and Srinivasan). Note that this simple regression of V on P yields an
estimate of cov(P,V)/var(P). We thus test whether the coefficient on the performance outcome falls
with the activation of the corresponding measure. We take a finding that the coefficient falls as
evidence that activating a performance measure weakens its association with programmatic impacts
and implies the existence of distortions. Because we have two impact measures and three outcome
measures we have six equations, which we estimate jointly (using a seemingly unrelated regression
framework).
Evidence of distortion: Change in regression coefficient (prediction a)
Table 3 shows the results of our estimation. The dependent variables are the estimated
subgroup earnings and employment impacts. Each equation contains on the right hand side the
subgroup outcome (either the employment rate at follow-up, average weeks worked at follow-up,
or average weekly earnings at follow-up) and the outcome interacted with a dummy variable
indicating whether the performance measure is activated. (Note that this model deviates from

29
Heckman, Heinrich, and Smith only by the inclusion of the activation dummy variable.) Each
regression also contains an intercept and the activation dummy alone, whose coefficient estimates
are omitted from the table.
First, note that all coefficient estimates on the performance outcomes are positive and
significant. This suggests that the new performance outcomes do indeed predict impacts when the
performance outcomes are not awarded. Next, note that five of the coefficient estimates on the
interacted terms are negative. In addition, all six coefficients are jointly significant (the p value of
the joint significance test is .0001). This finding alone is consistent with the model, which implies
a reduction in the regression coefficient on the performance outcome with the measure’s activation.
Third, note that in three of the six cases—one case for each of the three performance measures—
the coefficient estimate on the interacted term is negative and significant. The drop in the
regression coefficient is consistent with the award triggering distortionary activities. The results
suggest that each measure is distorted.
Evidence of response to incentive: Change in outcome variance (prediction b)
Our model predicts that the variance of the measure should rise with activation, both because
activation elicits additional efforts and because activation may elicit distortionary behavior. Table
4 shows the sample variances of the performance outcomes with and without activation of the
corresponding performance measures. The evidence provides some support for prediction b. In the
case of the average weeks worked at follow-up and average weekly earnings at follow-up
measures, the variances increase with activation. In the latter case, the change in variance is
statistically significant by conventional significance criteria. The increase in the variance of the
average weeks worked at follow-up outcome is marginally significant by conventional significance
criteria.
Evidence of response to incentive: Change in outcome mean (prediction c)
The model predicts that activating a performance measure increases the performance
outcome. To test this, we estimate econometric models of the determinants of subgroup outcomes,

30
which include a performance measure activation dummy as an independent variable.26 Assume that
the subgroup follow-up outcome is determined as follows:
pfα=λf0+λf1dfα+ψfα+Xα (4)
where pfα is the follow-up outcome for subgroup α. The subgroup outcome is presumed a function
of a constant (λf0), the influence of the incentive scheme in place during α’s training (λf1dfα), and an
error term, ψfα, with E (ψfα|d) = 0. dfα is an indicator variable, equal to one if the follow-up
measure is activated, and zero otherwise. The activation dummy is correlated with time, as states
adopted the follow-up measure later in the period of our study. Xα captures the influence of
unboservable non-incentive related factors on performance outcomes such as political and
economic conditions. Differences in Xα across incentive regimes, and in particular trends in labor
market conditions, may therefore bias the estimate of the activation effect λf1 because
E(pfα|dfα=1)-E(pfα|dfα=0)=λf1+E(Xα | dfα =1)–E(Xα|dfα =0)≠ λf1.
However, if one assumes that Xα determines the outcome for the graduation-based measure in the
same way that it determines the outcome for the follow-up measure, then the omitted variable can
be differenced out. Assume that the graduation outcome is determined as follows:
ptα=λt0 +λt1dfα+ψtα+Xα (5)
where ptα is the graduation-based equivalent of pfα, λt1dfα is the effect of activating the follow-up
measure on the termination ptα, and E(ψtα|d) = 0. The regression we run is
p′fα=λ′f0 +λ′f1dfα+ψ′fα (6)
which is constructed by subtracting (5) from (4), and where p′fα = (pfα – ptα) and λ′f1 = (λf1 - λt1),
E(ψ′fα|d) = 0, and, because Xα differences out,
E(p′fα|dfα = 1)-E(p′fα|dfα=0)=λ′f1=(λf1-λt1).
The theoretical model predicts λf1 > 0 and λt1 < 0, which imply λ′f1 > 0.27
26 We perform this analysis at the subgroup level to remain consistent with the rest of the paper. 27 In JTPA, the activation of the follow-up measure was often accompanied by activations and deactivations of other measures so that the combined effect on the marginal return to effort exerted on ptα is ambiguous. However, it is likely that any positive impact of the changes that accompanied the activation of the follow-up measure on the graduation

31
We estimate (6) for the activation of the employment rate at follow-up, where pfα and ptα are
subgroup α’s employment rate at follow-up and employment rate at graduation, respectively, and
dfα is an indicator of the employment rate at follow-up’s activation.28 For the average weekly
earnings at follow-up, we construct a graduation date-based analogue to control for the unobserved
heterogeneity (Xα) when we subtract (5) from (4). Thus for the average weekly earnings at follow-
up test, we estimate (6), where pfα and ptα are subgroup α’s average weekly earnings at follow-up
and graduation, respectively, and dfα is an indicator of the activation of the average weekly earnings
at follow-up measure.29
Table 5 presents the results of the estimation of (6). The first two columns of the table
show our estimates of λf0 and λf1 from a regression of the follow-up outcome on the activation
dummy. The equations for the employment rate at follow-up and average weekly earning at
follow-up outcomes were estimated jointly in a SUR framework. Note that the estimate of λf1 in
the employment rate at follow-up equation is negative, although statistically insignificant; the
estimate of λf1 in the average weekly earning at follow-up equation is positive. The second two
columns present the results from an estimation which uses as its dependent variable the difference
between the follow-up and graduation outcome. The estimates of λ′f1 are both positive as predicted
but only statistically significant in the earnings equation.30
Evidence of distortion: Change in covariance (prediction d)
According to prediction (d) a drop in the covariance between V and P when P is activated is a
sufficient indicator of gaming in P. A rising or constant covariance could occur if either there is no
gaming in P or if the gaming behavior is small relative to the increase in measure specific effort.
outcome is dominated by the direct effect of the follow-up measure’s activation on the follow-up outcome, and thus λ′f1 should be positive. 28 The subgroup employment rate at follow-up outcome is constructed as above. The subgroup employment rate at graduation outcome is constructed directly from the employment status at graduation variable given in the NJS administrative data. These data provide performance outcome information only for the employment at graduation performance measure. Outcomes for all other performance measures must be estimated using enrollee’s reporting of their employment information. 29 There is no termination equivalent to the average weeks worked at follow-up. Thus, we do not conduct a test of prediction b for this measure.

32
To test for changes in the covariance with activation of the performance measure, we regress a
transformed V on P. Following the analysis above, for each of the six performance outcome and
impact combinations, we divide the sample into two subsamples, one containing the subgroups
whose individuals’ random assignment dates occur under an incentive regime where the
performance measure is deactivated, and the other containing subgroups whose individuals’
random assignment dates occur in a regime where the performance measure is activated. Then,
within each subsample, we multiply V by the subgroup sum of the squared deviations of P from its
mean, 2)( pp −∑α
α , pool the two subsamples and regress the transformed V on P, estimating a
separate slope (and intercepts) for the activation and deactivation subsamples, using a SUR
regression framework (as in Table 3). This transformation makes the estimate of the slope
coefficient an unbiased estimate of (N-1)Cov(V,P) where N is the number of subgroups (because
the 2)( pp −∑α
α in the transformed V and the denominator of the slope coefficient estimate cancel
out). For each performance outcome and impact pair, we simply compare the slope coefficient
estimated from the subsample from the regime with the measure activated, to the slope coefficient
from the subsample from the regime with the measure deactivated.31 Because there are six impact-
outcome combinations, we estimate six equations.
Table 6 reports the results from our estimation. The equations estimated are numbered I
through VI. For example, in equation I the dependent variable is the subgroup 18 month earning
impact (weighted by 2)( pp −∑α
α ). The right hand side includes separate intercepts for the
activation and deactivation subsamples, but these estimates are omitted from the table, as they are
of no special interest. The right hand side of equation I includes the employment rate at follow-up
outcome interacted with an activation and deactivation dummy. Below the pair of coefficient
30 These results are not substantially different from the results produced in separate least squares regressions with heteroscedasticity-corrected standard errors. 31 We thank Kajal Lahiri for suggesting this covariance equality test.

33
estimates, the table reports the p value associated with the test of their equality. Thus we find that
the covariance of earnings impact and the follow-up employment rate increases after this measure
is activated and this increase is statistically significant. This suggests that measure specific
productive effort, rather than gaming, must play a dominant role in the agent’s response. This
finding is consistent with the previous finding that there were no evidence of distortion in the
employment rate at follow-up performance measure when one consider the earning impact (top
left-hand of Table 3).
In the employment rate at follow-up equation (equation IV) where the dependent variable is
the 18 month employment impact, we find no significant difference in the outcome coefficient
estimate across the two regimes. Combined with the result in Table 3, the insignificant difference
in covariance suggests that the employment impact distortion in the employment rate at follow-up
measure (bottom left of Table 3) was probably driven by distortion due to random marginal
productivity rather than gaming distortion.
For the other covariance tests involving employment impacts (equations V and VI), we find
no statistically significant differences in the covariance. Recall that Table 3 reports no individually
significant changes in the corresponding regression coefficient tests, as well. With the activation of
the average weeks worked at follow-up and average earnings at follow measures, however, the
covariances between these measures and earnings impact falls, and this change is statistically
significant (the p values corresponding to the equality tests are both about.0001). Thus, we find
that the results of the covariance and regression coefficient tests are consistent with each other and
with the hypothesis that gaming plays a role: where activation produces a statistically significant
decline in covariance, it also produces a statistically significant decline in regression coefficient.
Evidence of changes in performance measure ranking
Researchers and practitioners have used correlation methods to sort candidate performance
measures and to rank them. Our theoretical model, however, shows that the correlation between
outcomes and goals is endogenous and that using a correlation measure to identify good

34
performance measures can be misleading. To illustrate this point, assume the organization is
considering adding a new performance measure to complement an existing one. Assume there are
two candidate measures, measure 2 and 2’ that are identical in all respects, but performance
measure 2 is more correlated with the principal’s objective than measure 2’. Selecting measure 2
on this criterion may be misleading. In fact, it may turn out that the correlation between
organizational value-added and measure two drops after its introduction. It is even possible that
measure 2’ becomes more correlated with value, if the correlation is measured after the measure’s
introduction. Although our model does not provide a method to select performance measures, it
suggests that one has to be cautious in using a correlation based selection criterion.
To illustrate this issue in our case study, we investigate whether the ranking of performance
measures based on a correlation criteria changes before and after the introduction of a measure.
Table 7 shows the explanatory power of each of the three performance measures in impact
regressions by whether the measure is activated. The first line of the table shows the slope
coefficient estimates and R-squareds of the regressions of earnings impacts on employment rate at
follow-up, average weeks worked at follow-up, and average weekly earnings at follow-up
outcomes, respectively, in training agency-years where the corresponding performance measure is
not activated.32 The second line shows the R-squared for these regressions using training agency-
year data in which the performance measure is activated. The bottom two lines repeat the
comparison for the employment impact measure.
Consider the results for the top half of the table which show the effect of activating
performance measures on the earnings impact regressions. Note first that the coefficient estimates
32 The R-squared is a measure of explanatory or predictive power of the performance measure because it shows the fraction of the variation in the impact that is explained by the variation in the performance outcome. Others in the literature have evaluated performance measures by a comparison of R-squareds; see Ittner and Larcker, pp. 14-15. The results shown in Table 7 differ from the earlier results of Table 3 because the earlier results are generated from a single SUR regression. The results of Table 3 are generated from twelve separate regressions: two dependent variables (the two impact measures) crossed with three independent variables (the three performance outcomes) for each of two subsets of the data (persons trained subject to the corresponding performance measure and persons trained absent the corresponding performance measure). We estimated the twelve models separately so as to observe how performance measure activation affected R-squareds.

35
are all significant and positive when the performance measure is not activated. When they are not
activated, a ranking of the performance measures by R-squared places the employment rate at
follow-up measure behind both the average weeks worked and average weekly earnings at follow-
up measures. When the performance measure is activated, however, while the coefficient estimate
for the employment rate at follow-up remains positive and significant, the coefficient estimates for
the other measures fall—indeed they become insignificant—along with their R-squareds.
Activating the performance measures, therefore, reverses their rankings: after activation, the
employment rate at follow-up measure dominates the other two measures.
The bottom half of the table shows the effect of activating performance measures on the
employment impact regressions. When the measures are not activated, only in the employment
rate at follow-up regression is the slope coefficient estimate significant. When the measures are
activated, all coefficient estimates are insignificant, but the R-squared of the employment rate at
follow-up regression is higher than in the others. Thus, in the case of employment impacts,
activation does not affect the ranking of performance measures.
4 Conclusions
An important lesson from the incentive literature is that performance measures are often
distorted, eliciting dysfunctional and unintended responses, also known as gaming responses.
These responses, however, are typically hidden from the researcher. This paper develops a simple
multitasking model and derives tests for the existence of distortions in performance measures. The
model shows that one can identify the existence of distortions by estimating how the association
between a performance measure and the true goal of the organization changes with the activation of
the measure.
Using data from the JTPA incentive system, we test the model's main prediction by
estimating changes in regression coefficient in a regression of organizational value on the
performance measure. To test for the existence of distortions, we focus on the introduction of the

36
follow-up measures, which corresponds to one of the most dramatic changes in the measurement
system. For three follow-up measures, we test whether the regression coefficient estimate
decreases after the introduction of the measure. We find evidence consistent with our hypothesis.
We conclude that the new measures were distorted. These findings are corroborated by our
previous work that used the specific rules of the performance measurement system to demonstrate
the existence of distortions.
The paper also contributes to the literature on the implementation of performance
measurement (Ittner and Larcker (1998), Banker, Potter, and Srinivasan (2000), Heckman,
Heinrich, and Smith (2002)). Our model formally demonstrates the suspicion that the association
between a performance measure and value-added is endogenous. Our evidence suggests that using
a correlation measure to identify good performance measures can be misleading. A selection
method for performance measures that is based on how well measures predict the true objective
(using correlation or other methods), as is commonly used by practitioners, has important
limitations. In fact, we show that the ranking of the performance measures according to how
correlated they are with the principal’s objective can depend on the set of performance measures
used.
This point suggests that the construction of optimal measurement systems as well as the
welfare assessment of the benefit of using performance measurement may be more complicated
than presented in the literature. The standard model assumes that the principal knows the
production environment and can compute the optimal combination of performance measures by
balancing measurement noise and incentive provision (e.g. Banker and Datar 2001 and Baker
2002). Our paper shows that this method fails to take into account the distortion margins that are
typically revealed only after the performance measure has been used. If the principal cannot
observe the technology of distortion---arguably, a reasonable assumption---then the construction of
optimal incentive systems cannot be modeled as a static decision problem. The principal has to
take into account the fact that more information about the performance measure may become

37
available after the measure is introduced. This dynamic process suggests a new perspective on the
construction of performance measurement systems.

38
Appendix: Proofs of Claims made in section 2
Proposition 1: (i) Measure two is distorted if and only if Cov(p2,α,Vα)/Var(p2,α) decreases after an increase in β2/β1. (ii) If measure two is not distorted, then Corr(p2,α,Vα) increases when β2/β1 increases. Proof: (i) Let )( 212 βββγ +=
( )
( )2,2
2,2,2
22,0
,2,22,2,2,2,2
2,2,2
22,0
21,2
2121,2
)(),())(,)((
),()),(),,((
αααα
ααααααααα
α
αα
ηγ
ξηηγββ
ββββVarwvVarVarv
wwCovvvvCovVarvpVar
VpCov+++
−+++=
Let
=
),()),(),,((
21,2
2121,2
ββββββ
γ α
αα
pVarVpCov
ddsignS
( )( )2,2
2,2,2,2,2
2,2,2,2,2
2,2,2 var)(),())(,)(( ααααααααααα ηξηη wvVarwwCovvvvCovsignS ++−−++=
( )2,2,2,2
2,2,2,2,2
2,2,2 ),())(,)(( ααααααααα ξηηη VarwwwCovvvCovsign −−++−=
But 2,2
2,2,2,2,2,2,2,2
2,2,2 )(var)(,)(( αααααααααα ηηηηηη vEvvvCov ++=++ since 03
,2 =αηE . We have
( )2,2,2,2
2,2
2,2
2,2,2,2,2 var),())(( ααααααααα ξηηη wwwCovvEvVarsignS −−−+−= .
If the measure is not distorted, S=0 and Cov(p2,α,Vα)/Var(p2,α) is independent of β2/β1. If the measure is distorted S<0 and Cov(p2,α,Vα)/Var(p2,α) decreases after an increase in β2/β1. (ii) Assume η2,α=w2,α=0. The variance and covariance of p2,α and Vα are
2,2
22
2,0
22121,2 )(),( ααα βββββ VarvVarvpVar ++=
2,2
22,1,1,1
21
2,0
22121 )()(),( αααααα βηβββββ VarvvVarvVarvVVar ++++=
2,2
22
2,0
2212121,2 )()),(),,(( αααα βββββββ VarvVarvVpCov ++=
The correlation between p2 and V is 2/1
2,2
22
2,0
221
,1,1,12
12121,2 )(
)(1)),(),,((
−
++
++=
αα
ααααα βββ
ηβββββ
VarvVarvvVarv
VpCorr
2/1
2,2
2
1
22,0
2
1
2
,1,1,12121,2
1
)(1)),(),,((
−
+
+
++=
αα
ααααα
ββ
ββ
ηββββ
VarvVarv
vVarvVpCorr
The correlation increases with β2/β1. QED Claim: Assume v2,α=η2,α=ξ1,α=ξ2,α=0 for all α. Condition (3) implies that the correlation decreases after an increase in β2/β1. Proof: The correlation is
( ) ( ) 2/1,1,1,1
21
2,0
221
2/12,2
22
2,0
221
2,0
221
,2)()()(
)(),(
αααααα
ααα
ηηββββββ
ββ
+++++
+=
vVarVarvVarwVarv
VarvVpCorr
Write the correlation as 2/12
21
2,2 )])1(1)(1[(),( −−++= KKVpCorr γγαα where
2,0
,1,1,122
,0
2,2
1
)(,
α
ααα
α
α ηVarv
vVarvK
VarvVarw
K+
==

39
−++−=
))1(1)(1(),( 2
21
2,2
12
KKddSignVpCorr
ddSign γγ
γββ αα
))21)(1()1((2))1(1)(1( 212122
12 KKKKKK
dd γγγγγγγγ
−−+−−=−++
−+−
−−=−++ 1
2
122
21
2 )21(1)1(
)1(2))1(1)(1( KK
KKKKdd γγ
γγγγγ
γ
A sufficient condition for 0/),( ,2 <γαα dVpdCorr is 1)1( 2
1 ≥− K
Kγ
γ which is equivalent to
22
11 KK β
β≥ . This condition is identical to (3). QED

40
REFERENCES Asch, B.J. (1990), ‘Do Incentives Matter? The Case of Navy Recruiters’, Industrial and
Labor Relations Review, 43, 89S-106S.
Baker, G. P. (1992), ‘Incentive Contracts and Performance Measurement’, Journal of
Political Economy, 100(3), 598-614.
Baker, G. P. (2002), ‘Distortion and Risk in Optimal Incentive Contracts’ Journal of
Human Resources, 37(4), 728-751.
Baker, George, Robert Gibbons and Kevin J. Murphy. (1994) “Subjective Performance
Measures in Optimal Incentive Contracts.” The Quarterly Journal of Economics. Volume 109,
Issue 4, 1125-56.
Banker, R., and Datar, S. (2001), ‘Sensitivity, Precision, and Linear Aggregation of
Signals for Performance Evaluation’, Journal of Accounting Research, 27(1), 21-39.
Banker, R., Potter, G., and Srinivasan, D. (2000), “An Empirical Investigation of an
Incentive Plan that Includes Nonfinancial Performance Measures,” The Accounting Review,
75(1), 65-92
Barnow, B. (2000). “Exploring the Relationship Between Performance Measurement and
Program Impact,” Journal of Policy Analysis and Management, 19(1), 118-141.
Bloom, H. S. (1984). Accounting for No-Shows in Experimental Evaluation Designs.
Evaluation Review, 8.
Bloom, H. S., Orr, L. L., Bell, S. H., Cave, G., Doolittle, F., Lin, W., and Bos, J. M. (1997)
“The Benefits and Costs of JTPA Title II-A Programs: Key Findings from the National Job
Training Partnership Act Study,” The Journal of Human Resources, 32(3), 549-576.
Burgess, Simon, Carol Propper, and Debhorah Wilson. (2002). Does Performance
Monitoring Work? A Review of the Evidence from the UK Public Sector, Excluding Health
Care Working Paper, CMPO, 02/049.

41
Courty, P. and Marschke, G. (2003a). Dynamics of Performance Measurement Systems. Oxford
Review of Economic Policy. 2003, 19 (2), 268-84.
Courty, P. and Marschke, G. (2003b). Performance Funding in Federal Agencies: A Case
Study of a Federal Job Training Program. Public Budgeting and Finance. Fall issue (Vol.
23:3). 22-48.
Courty, P., and Marschke, G. (2004). An Empirical Investigation of Gaming Responses to Explicit
Performance Incentives, Journal of Labor Economics, 22(1), 23-56.
Courty, P., and Marschke, G. (2005, forthcoming). Making Government Accountable: Lessons from a
Federal Job Training Program, Public Administration Review.
Cragg, M. (1997). Performance incentives in the public sector: Evidence from the Job
Training Partnership Act. Journal of Law, Economics and Organization 13 (April), 147–68.
Dixit, A. (2002), ‘Incentives and Organizations in the Public Sector’, Journal of Human
Resources, 37(4), 696-727.
Doolittle, F. and Traeger, L. (1990). Implementing the National JTPA Study. Manpower
Demonstration Research Corporation, New York.
Feltham, G., and Xie, J. (1994), ‘Performance Measure Congruity and Diversity in Multi-
Task Principal/Agent Relations’, The Accounting Review, 69(3), 429-53.
Friedlander, D. 1988. Subgroup Impacts and Performance Indicators for Selected Welfare
Employment Programs. New York: Manpower Development Research Corp.
Gay, R. and M. Borus. 1980. Validating Performance Indicators for Employment and
Training Programs. Journal of Human Resources, 15, 1: 29-48.
Gibbons, R. (1997), ‘Incentives and Careers in Organizations’ in ‘Advances in economics
and econometrics: Theory and applications: Seventh World Congress’ , (ed.), Kreps and
Wallis, Cambridge University Press, 1997.
Gibbs, Michael, Kenneth Merchant, Wim Van der Stede, and Mark Vargus. (2004)
‘Performance Measure Properties and Incentives.’ Chicago GSB Mimeo.

42
Healy, P. (1985), ‘The Effect of Bonus Schemes on Accounting Decisions’, Journal of
Accounting and Economics, 7, 85-107.
Heckman, J. 1992. Randomization and Social Program Evaluation, in Evaluating Welfare
and Training Programs, (C. Manski and I. Garfinkel ed.), 201-230. Cambridge, MA: Harvard
University Press.
Heckman, J. J., Heinrich, C., and Smith, J.A. (2002), ‘The Performance of Performance
Standards’, Journal of Human Resources, 37(4), 778-811.
Heckman, J. J., Smith, J., and Clements, N. (1997), ‘Making the Most Out of Programme
Evaluations and Social Experiments: Accounting for Heterogeneity in Programme Impacts’,
Review of Economic Studies, 65(4), 487-535.
Heckman, J. J., Smith, J., and Taber, C. (2002), `Accounting for Dropouts.’ Review of
Economics and Statistics.
Holmstrom, B., and Milgrom, P. (1991), ‘Multitask Principal-Agent Analyses: Incentive
Contracts, Asset Ownership, and Job Design,’ The Journal of Law, Economics, and
Organization, 7, 24-52.
Ittner, C. D. and Larcker, D. F. (1998), “Are Nonfinancial Measures Leading Indicators of
Financial Performance? An Analysis of Customer Satisfaction,” Journal of Accounting
Research, 36(Supplement), 1-35.
Jacob, Brian A., and Steven D. Levitt. (2003) “Rotten Apples: An Investigation of the
Prevalence and Predictors of Teacher Cheating.” Quarterly Journal of Economics, 118(3), 843-
877.
Lalonde, R. (1986) Evaluating the Econometric Evaluations of Training Programs with
Experimental Data. American Economic Review, 76(4), 604-620.
Heckman, J., LaLonde, R., Smith, J. (1999). The Economics and Econometrics of Active
Labor Market Programs. In Ashenfelter, O., Card, D., eds., Handbook of Labor Economics
Volume 3A (North-Holland, Amsterdam). 1865-2097.

43
.
Marschke, G. (2003) "Performance Incentives and Organizational Behavior: Evidence
from a Federal Bureaucracy," Manuscript, University at Albany, State University of New York.
Meyer, M. W. and Gupta, V. (1994). The Performance Paradox. Research in
Organizational Behavior, 16, 309-369
Oettinger, G. (2002), “The Effect of Nonlinear Incentives on Performance: Evidence from
‘Econ 101’”. The Review of Economics and Statistics, 84(3), 509-17.
Oyer, P. (1998), ‘Fiscal Year Ends and Non-Linear Incentive Contracts: The Effect on
Business Seasonality’, Quarterly Journal of Economics, 113, 149-85.
Prendergast, C. (1999), ‘The Provision of Incentives in Firms’, Journal of Economic
Literature, 37(1), 7-63.
van Praag, M. and Cools, K. (2001) “Performance Measure Selection: Noise Reduction
and Goal Alignment.” Manuscript, University of Amsterdam.
Zornitsky, J., Rubin M., Bell, S., and Martin, W. (1988) Establishing a Performance
Management System for Targeted Welfare Programs. Washington DC: National Commission
for Employment Policy, Research Report 88-14.

44
Table 1 Revised JTPA Performance Measures for JTPA’s Adult Program
Performance Measure Description Employment Rate at Follow-up
Fraction of graduates who were employed at 13 weeks after graduation
Average Weekly Earnings at Follow-up
Average weekly wage of graduates who were employed 13 weeks after graduation
Average Weeks Worked by Follow-up
Average number of weeks worked by graduates in 13 weeks following graduation
Notes: 1. The date of graduation is the date the enrollee officially exits training. A graduate is an enrollee after he/she has officially exited training. 2. All measures are calculated over the year’s graduate population. Therefore, the average follow-up weekly earnings for 1987 was calculated using earnings at follow-up for the graduates who graduated in 1987, even if their follow-up period extended into 1988. Likewise, persons who graduated in 1986 were not included in the 1987 measure, even if their follow-up period extended into 1987.

45
Table 2A Experimental Impacts By Subgroup
Subgroup 18 Month
Earnings Impacts ($) 18 Month
Employment Impacts (months) Receiving Food Stamps No 490.823
(273.314) 0.117
( 0.191) Yes 269.646
(281.878 0.298
(0.235) Gender Male 46.236
(335.312) 0.099
(0.219) Female 574.451
(225.046) 0.240
(0.200) Highest grade completed < 10 yrs 508.109
(466.333) 0.458
(0.371) 10-11 yrs 455.366
(406.520) 0.314
(0.323) 12 yrs 528.377
(314.432) 0.104
(0.237) 13-15 yrs 115.078
(597.620) -0.312 (0.399)
> 15 yrs -394.491 (1210.037)
0.735 (0.718)
Race White 513.505
(261.964) 0.070
(0.192) Black 373.860
(358.973) 0.362
(0.282) Hispanic -330.982
(629.107) 0.212
(0.458) Other 85.816
(1156.137) 1.008
(0.846) Age 22-29 yrs 582.795
(303.606) 0.436
(0.220) 30-39 yrs 337.990
(340.071) 0.208
(0.253) 40-49 yrs 167.248
(528.506) -0.220 (0.414)
50-54 yrs -829.954 (1043.039)
-1.722 (0.881)
> 54 yrs 588.204 (765.385)
0.197 (0.758)
Employment status at time of application Currently employed 1037.772
(483.793) 0.191
(0.324) Last employed 0-2 months ago 196.212
(470.613) 0.009
(0.318) Last employed 3-5 months ago -413.393
(562.806) -0.086 (0.382)
Last employed 6-8 months ago 607.643 (746.237)
0.440 (0.544)
Last employed 9-11 months ago 1952.2044 (949.928)
0.805 (0.695)
Last employed > 11 months ago 463.599 (459.239)
0.785 (0.366)
Never employed
291.431 (462.171)
0.327 (0.426)

46
Table 2A (continued) Experimental Impacts By Subgroup
Subgroup 18 Months
Earnings Impacts ($) 18 Months
Earnings Impacts (months) Training Agency Corpus Christi, TX -847.637
(731.918) -0.295 (0.531)
Cedar Rapids, IA 1057.610 (1295.772)
-0.282 (0.997)
Coosa Valley, GA 1271.657 (633.922)
0.666 (0.471)
Heartland, FL 1005.343 (1270.066)
1.363 (0.942)
Fort Wayne, IN -417.937 (505.544)
-0.644 (0.369)
Jersey City, NJ 191.213 (985.257)
-0.277 (0.729)
Jackson, MS 1974.543 (747.497)
1.633 (0.557)
Larimer, CO -12.400 (874.319)
0.490 (0.628)
Decatur, IL 14.810 (1171.069)
0.171 (0.783)
Northwest, MN -2272.185 (1170.215)
-2.287 (0.949)
Butte, MT -913.574 (1098.605)
-0.690 (0.801)
Omaha, NE 1185.606 (662.263)
1.335 (0.576)
Marion County, OH 968.491 (667.529)
0.151 (0.549)
Oakland, CA -1034.381 (850.677)
-0.020 (0.593)
Providence, RI 966.893 (844.981)
0.830 (0.618)
Springfield, MO 378.675 (710.688)
-0.305 (0.481)
Earnings at time of application $0-$3,000 497.049
(245.126) 0.378
(0.204) $3,000-$6,000 487.801
(521.988) 0.075
(0.347) $6,000-$9,000 -439.713
(704.655) -0.295 (0.440)
$9,000-$12,000 842.508 (1091.196)
-0.358 (0.635)
$12,000-$15,000 1569.974 (1675.107)
0.636 (0.907)
>$15,000 -613.327 (2086.843)
-0.211 (1.070)
Notes: Robust standard errors of the estimates reported in parentheses. The estimated impacts are corrected for treatment group drop-outs. The earnings and employment impacts are estimated from the 10746 adult experimental participants who report a valid earnings figure (zeros are included) in each of the 18 months after random assignment. The employment impacts are denominated in months of employment and the earnings impacts are denominated in dollars. Subgroups created using AFDC receipt, marital status, and family size excluded for space considerations.

47
Table 2B Mean Performance Outcomes By Subgroup
Subgroup Employment Rate at
Follow-up Average Weeks Worked
at Follow-up (weeks) Average Weekly Earnings
at Follow-up ($) Receiving Food Stamps No 0.574
(0.495) 8.868
(5.657) 230.247
(119.805) Yes 0.496
(0.500) 7.113
(6.079) 207.264
(118.138) Gender Male 0.531
(0.499) 8.393
(5.820) 8.393
(5.820) Female 0.520
(0.500) 7.918
(5.960) 7.918
(5.960) Highest grade completed < 10 yrs 0.469
(0.499) 7.388
(6.024) 207.738
(114.193) 10-11 yrs 0.484
(0.500) 7.419
(6.038) 214.441
(104.217) 12 yrs 0.545
(0.498) 8.414
(5.822) 219.978
(121.682) 13-15 yrs 0.572
(0.495) 8.883
(5.659) 242.324
(135.507) > 15 yrs 0.692
(0.463) 9.764
(5.239) 250.349
(127.915) Race White 0.566
(0.499) 8.601
(5.788) 221.835
(122.813) Black 0.467
(0.499) 7.267
(6.031) 227.086
(123.865) Hispanic 0.468
(0.499) 7.801
(5.966) 207.418
(100.502) Other 0.525
(0.500) 8.186
(5.784) 237.655
(110.805) Age 22-29 yrs 0.525
(0.499) 8.194
(5.898) 220.764
(105.620) 30-39 yrs 0.525
(0.499) 8.165
(5.858) 228.466
(124.000) 40-49 yrs 0.522
(0.500) 7.939
(5.969) 223.282
(144.536) 50-54 yrs 0.500
(0.501) 7..558 (6.053)
219.755 (172.393)
> 54 yrs 0.553 (0.498)
8.068 (6.028)
161.767 (102.369)
Employment status at time of application Currently employed 0.666
(0.472) 10.120 (5.054)
221.082 (111.279)
Last employed 0-2 months ago
0.594 (0.491)
8.949 (5.587)
234.982 (143.728)
Last employed 3-5 months ago
0.552 (0.498)
8.658 (5.660)
231.269 (113.235)
Last employed 6-8 months ago
0.522 (0.500)
8.168 (5.856)
229.595 (108.832)
Last employed 9-11 months ago
0.525 (0.500)
8.098 (5.922)
217.886 (101.381)
Last employed > 11 months ago
0.435 (0.496)
6.721 (6.108)
209.313 (125.440)
Never employed
0.392 (0.489)
6.302 (6.189)
190.362 (102.424)

48
Table 2B Mean Performance Outcomes By Subgroup
Subgroup Employment Rate
at Follow-up Average Weeks Worked
at Follow-up (weeks) Average Weekly Earnings
at Follow-up ($) Training Agency Corpus Christi, TX 0.499
(0.501) 8.500
(5.780) 193.378
(111.705) Cedar Rapids, IA 0.559
(0.498) 8.479
(5.911) 235.631
(179.038) Coosa Valley, GA 0.581
(0.494) 8.168
(5.847) 232.552
(134.171) Heartland, FL 0.504
(0.502) 7.779
(5.502) 207.493 (82.616)
Fort Wayne, IN 0.658 (0.475)
9.873 (5.213)
216.703 (99.946)
Jersey City, NJ 0.411 (0.493)
6.244 (6.062)
268.118 (112.040)
Jackson, MS 0.578 (0.494)
8.291 (5.737)
210.692 (134.768)
Larimer, CO 0.509 (0.500)
8.553 (5.855)
218.458 (122.377)
Decatur, IL 0.643 (0.480)
9.562 (5.237)
247.448 (149.839)
Northwest, MN 0.571 (0.497)
8.736 (5.938)
222.843 (90.900)
Butte, MT 0.509 (0.501)
7.923 (5.969)
234.589 (178.290)
Omaha, NE 0.508 (0.500)
7.279 (6.025)
197.955 (91.602)
Marion County, OH 0.411 (0.492)
6.451 (6.190)
197.563 (107.089)
Oakland, CA 0.393 (0.489)
7.120 (6.121)
271.745 (125.767)
Providence, RI 0.369 (0.483)
5.977 (6.137)
249.088 (96.094)
Springfield, MO 0.702 (0.458)
10.250 (4.871)
209.348 (98.995)
Earnings at time of application $0-$3,000 0.467
(0.499) 7.286
(6.042) 210.294
(123.507) $3,000-$6,000 0.601
(0.490) 9.163
(5.503) 223.564
(114.387) $6,000-$9,000 0.665
(0.473) 9.966
(5.108) 240.109
(112.070) $9,000-$12,000 0.642
(0.480) 10.130 (4.968)
265.643 (113.000)
$12,000-$15,000 0.609 (0.490)
9.711 (5.497)
293.612 (98.025)
>$15,000 0.694 (0.463)
10.078 (5.233)
345.931 (192.342)
Notes: Standard deviations are reported in parentheses. The performance outcome means are reported from 10746 adult experimental participants who report a valid earnings figure in each of the 18 months after random assignment. Subgroups created using AFDC receipt, marital status, and family size excluded for space considerations.
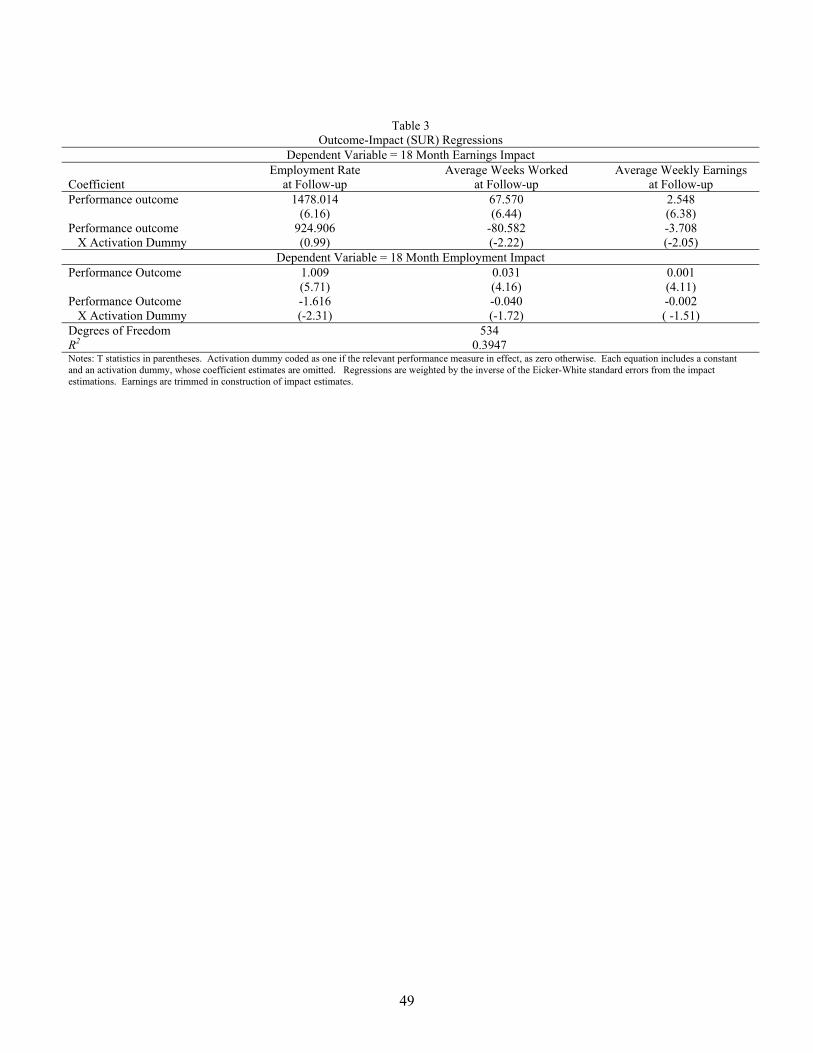
49
Table 3 Outcome-Impact (SUR) Regressions
Dependent Variable = 18 Month Earnings Impact
Coefficient Employment Rate
at Follow-up Average Weeks Worked
at Follow-up Average Weekly Earnings
at Follow-up Performance outcome 1478.014
(6.16) 67.570 (6.44)
2.548 (6.38)
Performance outcome X Activation Dummy
924.906 (0.99)
-80.582 (-2.22)
-3.708 (-2.05)
Dependent Variable = 18 Month Employment Impact Performance Outcome 1.009
(5.71) 0.031 (4.16)
0.001 (4.11)
Performance Outcome X Activation Dummy
-1.616 (-2.31)
-0.040 (-1.72)
-0.002 ( -1.51)
Degrees of Freedom R2
534 0.3947
Notes: T statistics in parentheses. Activation dummy coded as one if the relevant performance measure in effect, as zero otherwise. Each equation includes a constant and an activation dummy, whose coefficient estimates are omitted. Regressions are weighted by the inverse of the Eicker-White standard errors from the impact estimations. Earnings are trimmed in construction of impact estimates.

50
Table 4 Test of Performance Measure Activation on Variance of Performance Outcome
Sample Variance of
Performance Measure Activated
Employment Rate
at Follow-Up
Average Weeks Worked
at Follow-up
Average Weekly Earnings
at Follow-up
No
0.250
34.287
13958.75 Yes
0.249
36.233
16318.43
F Test of equal variances (p value)*
0.505
0.105
0.003
*F test: ,: 22NoYesoH σσ = 22: NoYesaH σσ >

51
Table 5 Outcome (SUR) Regressions
Dependent Variable Regression I Regression II
Coefficient
(1) Employment Rate at Follow-up
(2) Average Weekly Earnings at
Follow-up
(3) Employment Rate at Follow-up – Employment Rate at Termination
(4) Average Weekly Earnings at Follow-up – Average Weekly
Earnings at Termination Constant 0.547
(45.32) 227.576 (41.34)
-0.083 (-6.89)
3.324 (1.66)
Activation dummy -0.013 (-0.75)
11.526 (1.45)
0.020 (1.18)
10.927 (3.77)
Degrees of Freedom 188 188 R2 0.020 0.038 Notes: T statistics in parentheses. Activation dummy coded as one if the relevant performance measure in effect, as zero otherwise. The activation dummy for columns (1) and (3) are for the employment rate at follow-up measure. The activation dummy for the regressions (2) and (4) are for the average weekly earnings at follow-up measure.

52
Table 6 Regressions for Covariance Tests
Dependent Variable = Weighted* 18 Month Earnings Impact
Coefficient
I Employment Rate
at Follow-up
II Average Weeks Worked
at Follow-up
III Average Weekly Earnings
at Follow-up Performance outcome X (1 – Activation Dummy)
0.04 (1.73)
0.139 (7.92)
3.486 (7.13)
Performance outcome X (Activation Dummy)
0.010 (5.42)
0.009 (0.31)
0.188 ( 0.26)
P value of test of equivalence of above coefficients
0.0392 0.0001 0.0001
Dependent Variable = Weighted* 18 Month Employment Impact
Coefficient
IV Employment Rate
at Follow-up
V Average Weeks Worked
at Follow-up
VI Average Weekly Earnings
at Follow-up Performance outcome X (1 – Activation Dummy)
5.071 (1.39)
47.752 (3.11)
1163.968 (2.89)
Performance outcome X (Activation Dummy)
2.860 (1.06)
11.231 ( 0.53)
344.213 (0.67)
P value of test of equivalence of above coefficients
0.5909 0.1235 0.1652
Degrees of Freedom R2
468 0.4945
Notes: T statistics in parentheses. The six equations are estimated in a single SUR framework. Each equation pools the activation and deactivation subsamples and allows separate intercepts for the two subsamples, but only the estimates of the coefficients on the (interacted) performance outcomes are reported. For each equation, we dropped any subgroup that was void of individuals from one or both of the incentive regimes. This assured that the number of subgroups (N) was identical for the two subsamples and that the test of regression coefficient equality was also a test of the equality of Cov(V,P) (see text). Regressions are weighted by the inverse of the Eicker-White standard errors from the impact estimations. Earnings are trimmed in construction of impact estimates. *The dependent variable is weighted by the sum of squared deviations of the performance outcome about its mean.

53
Table 7 R2’s and P Values and from Least Square Regressions of Impacts on Outcomes
By Whether Performance Measure Activated*
Employment Rate
at Follow-Up
Average Weeks Worked
at Follow-up
Average Weekly Earnings
at Follow-up
Dependent Variable
Performance Measure Activated
Obs.
Coef. Est.
P
Value
R2 Obs. Coef. Est.
P
Value
R2 Obs. Coef. Est.
P
Value
R2 Earnings Impact
No 48
1167.20
0.0008
0.215 48 72.40
<0.0001
0.370 48 2.84 <0.0001
0.383
Yes 43
1039.18
0.0003
0.270 43 -16.51
0.6756
0.004 43 -0.47 0.7336
0.003
Employment Impact No 48
0.56
0.0204
0.109 48 0.01
0.3632
0.018 48 0.00 0.1761
0.039
Yes 43 0.11
0.6244
0.006 43 0.00
0.9613
0.000 43 0.00 0.8498
0.001
* This table describes the slope coefficient estimates and R2’s of 12 regressions of impacts on performance outcomes. For each of the six outcome-impact combinations, we perform two regressions: one for individuals trained in regimes with the corresponding performance measure activated and one for individuals without the performance measure activated. Regressions are weighted by the inverse of the Eicker-White standard errors from the impact estimations. Earnings are trimmed in construction of impact estimates.