a generalized model study of scour around bridge...
TRANSCRIPT

A GENERALIZED MODEL STUDY OF SCOUR AROUND BRIDGE PIERS AND ABUTMENTS
by E. M. Laursen and Arthur Toch
STATE UNIVERSITY OF IOWA REPRINTS IN ENGINEERING
REPRINT NO. 120
REPRINTED FROM
PROCEEDINGS
Minnesota International Hydraulics Convention
September 1-4, 1953
Minneapolis, Minnesota

A GENERALIZED MODEL STUDY OF SCOUR AROUND BRIDGE PIERS AND ABUTMENTS
Emmet M. Laursen and Arthur Toch State University of Iowa
United States
ABSTRACT
Four classes of variables are apparent in the problem of scour around bridge piers and abutments--geometry of piers and abutments, stream-flow characteristics, sediment characteristics, and geometry of site. The laboratory investigation, from its inception, has been divided into four phases based on these classes. In each phase the variables in three of the classes are held constant and those in the pertinent class are varied. To date, the first three phases have been studied.
Typical scour bole patterns related to the geometry of the pier or abutment have been found. For equilibrium conditions of scour with uniform sand, the velocity of flow and the sand size do not appear to have any measurable effects on the depth of scour. This result is especially encouraging in the search for correlation between model and prototype since it would indicate that, primarily, only the depth of flow might be involved in the scale effect. The technique of model testing has been simplified, therefore, because rate of sediment transportation does not need to be scaled. Prior to the establishment of equilibrium conditions, however, depths of scour in excess of those for equilibrium conditions have been found. A concept of active scour as an imbalance between sediment transport capacity and rate of sediment supply has been used to explain the laboratory observations.
INTRODUCTION
Many of the failures of bridges recorded in the past can be attributed directly to the undermining of piers or abutments by scour. A graphic example of such occurrences, during the Kansas River flood of July, 1951, was the failure of the Rock Island railroad bridge at Topeka, Kansas, shown in Fig. 1. A pier or abutment will be absolutely safe from scour only if based on firm bed rock and of sufficient structural stability to stand by itself. Such a foundation, though desirable, is often economically unobtainable--particularly in alluvial streams where a solid geological formation may only be found at great depth. For the latter condition, a calculated risk must be taken, and the pier or abutment must be built in such a manner that the probability of scour action disturbing the stability of the pier is balanced against tbe replacement cost of the entire bridge structure. If means can be obtained for the prediction of the amount of scour, the calculated risk can then be confined to the probability of flood occurrences.
To ascertain the influence of the various factors which determine the extent of the scour hole is the purpose of the model study upon which this paper is based. Conducted at the Iowa Institute of Hydraulic Research, the program is sponsored by the Iowa State Highway Commission and the Bureau of Public Roads [l, 2].
GENERAL CONSIDERATIONS
The phenomenon of scour is itself complex; scour around bridge piers and abutments is even more complex because conditions, both natural and man-made, vary greatly from one site to
123

Fig. I - "A e raphic example."
124

another. That criteria for design are still lacking today, after years of experience in bridge building, is, therefore, not surprising. The geometry of the piers and abutments and the geometry of the site are but two of the classes of variables to be considered. The streamflow characteristics and the sediment characteristics are the other classes.
Complete separation of the many variables was not feasible even with the controls existent in the laboratory. The investigation could, however, be divided into four phases: geometry of pier and abutment, hydraulics of the stream, sediment characteristics, and geometry of site. The laboratory studies to date have been limited to the first three phases. The variables of three classes were held constant in each phase and those of the pertinent class were varied.
Several observations, which increase the knowledge of the nature of scour, were made in the course of the investigations. The scour holes were found to be characterized by ce"rtain features which applied to all models tested. The modification of the mean flow pattern could be correlated to the extent of the scour hole. For equilibrium. conditions, velocity and sediment size were found to have no measurable effect on the depth of scour. The· depth of scour was, however, related to the depth of flow. During the transient stage, before equilibrium conditions were established, excess scour depths occurred, and seemed to be a function of all three of these variables.
THE SCOUR PHENOMENON
If an obstruction is placed in a stream, the flow pattern in the vicinity of that obstruction will be modified. Since the transport capacity is a function of tbe flow characteristics, the transport capacity pattern will also be modified. In any area where the transport capacity is not equal to the rate at which material is supplied, scour or deposition must occur. The bed configuration will then change until a balance is again achieved between capacity and supply.
Scour around bridge piers and abutments is a particular case of this general problem. The special characteristic of this case is the functional relationship of the rate of supply to the flow conditions in the unobstructed stream. The capacity in the vicinity of the pier or abutment is related to these same flow conditions and to the geometry of the obstruction.
GEOMETRY OF PIERS AND ABUTMENTS
For the purpose of conducting the first phase of the investigation, two flumes, 35 ft long and 5 ft wide, were constructed in the Institute laboratory (Fig. 2). Removal of the ·dividing wall left a single flume 10. 5 ft wide. The flow was measured by means of an orifice plate in the 10-in. line supplying both flumes. Simple tailgates provided water-level control.
The many existing pier and abutment shapes used in Iowa were arbitrarily reduced to the models shown in Figs. 3 and 4. Only modern pier shapes, relatively slender in cross section, were considered. The abutment shapes were also representative of modern Iowa designs.
Preliminary tests led to a standard run with a depth of 0.3 ft and a velocity of 1.25 fps for comparison of shape effects. At this flow condition, the movement of sediment did not lower the overall bed elevation, while the scour hole formed in easily observable time. The sand used had a mean diameter of 0.58 mm, as shown in Fig. 5. The measurement of the scour depth was accomplished by means of layers of dyed sand, 0.01-ft thick at intervals of 0.1 ft. Scour exposed successively the layers of the dyed sand, thus permitting quick determination of the depth.
Scour depths observed in the tests are summarized in Figs. 3 and 4 for piers and abutments, respectively. It is readily apparent that the inclusion of a web between the two pier shafts, a practice which is frequently followed, causes considerable increase in the depth of scour at any angle of attack other than zero. This observation is of importance because a large number of streams change their main flow direction with stage. Thus, a pier which at one stage is aligned with the flow may be positioned badly at another stage if there is a web between the shafts. The rectangular shafts cause a deeper.scour hole to develop than do the round shafts. This shape effect of the pier shafts, however, is small compared to the shape effect of the webbed, skewed piers (see Fig. 6). It is noteworthy that the greatest scour occurs around the forms which would be expected to distort the flow pattern the most. This causal connection is demonstrated by the correlation of scour depth d to drag coefficient Cn shown in Fig. 7, in which the subscripts denote the angle of attack.
125

F i ); . ~ - F lumes fo r s tudy o f 11cnmetr}".
0 7
0 6
0.51
0 Wi thout Webs
..c
~0.2 0
QI !-------"- r1 1 1 r ~el I ,,,_l""' Model Il
0 o 11
5 3Q 45 60 75 Angle of Attack in Degrees ex
Fig. 3 - Effect of pier 9eometry
r
126
Scour depth around abutments is f ound to be pr imarily a f unction of the contract i on of the f l ow section. Th~
shape of the abutment itself also affects t he scour , but to a lesser extent. The scour ho les observed have simi l ar shapes , with the deepest sect i on always adjacent t o the ups tream cor ner (Fi g . 8) . In the protect i on of abu tments thi s typical shape of the scour hol e should be t ake n into account.
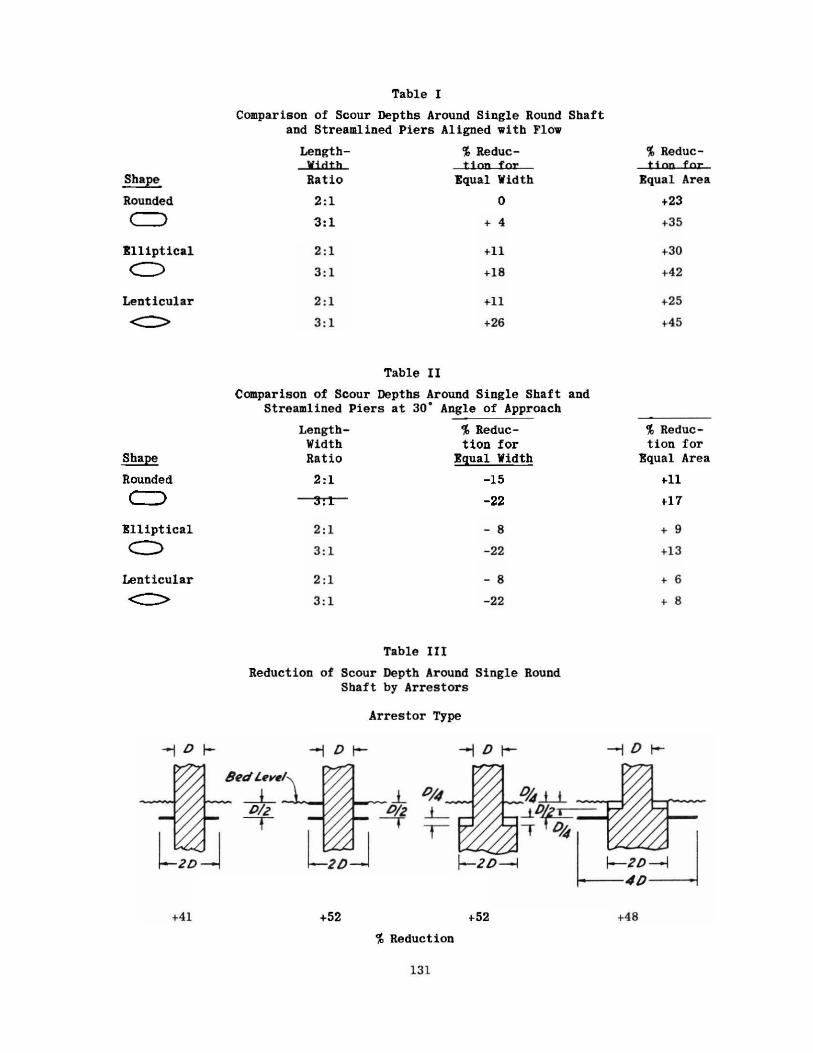
A cont inuation of t he study of pier geometry was conduc t ed by Schneible [3). Three simple streamlined s hapes we r e tested . The results of these tests ar e shown by Tables I and II. A comparison with t he s cour depth occurr ing at a s ingle round shaf t was made, both on the basis of equal area and equal width . A more judic ious basis of compar ison should include str uctural strength, stability, and construction cost. The angle of at tack is a primary factor in de termining the depth of scour around these shapes as around webbed pie rs. The advantage of streamlining is l ost if t he axis of the pie r is skewed to t he s tream.
Schneible al so inves tigated t he eff ect of arrestor devices placed a r ound a single r ound shaf t . The arrestor s which gave t he best reduc tion are summari zed i n Table III. Subsequent tests indi cate tha t the late ral extent of these arr estor shapes depends on t he vertical posit i oning. If placed at s t ream-bed e levation, t he late ral extent of t he arr estor must be very great to inhibit scour. I f placed below the bed l evel, the late ral extent of t he arr estor can be reduced, but the size required is a function of t he unarrested scour dept h. If the str eam bed is subject to fluctuations in e levation, the proper location of the ar restor is even more indetP.rminate.
EFFECT OF VELOCITY AND DEPTH OF FLOW
An investigation of the effect of stream-flow characteristics must, of necessity, involve the normal movement of the bed load . The fl ume shown in Fig . 9 with dimensions similar to those previousl y given has a sediment trap at the downstream end . Bed l oad f alling into this trap was weighed continuousl y by means of an interconnected balance. An elevator at the upstream end was then used to feed sand into the stream at the same rate. By this method it was possible to make

., .,
1.0.--------.------.------~----~---~
0
~QGl------r<--t------::~""""--F-----+----+-------1 / c
~
" 0 u Vl0.4f------+-- ---+------+------l------I 0
a. ., 00.2 C(1 ,QJL ~
o Model IV "'Model V o Model VJ 00,__ __ ~o~.~1 ---~0~2~--~o~.3----o~A~-----="o.5
Contraction Ratio
Fig. 4 - Effect of abutment geometry.
continuous runs of considerable length to check on the eauilibrium conditions obtaining for scour. The shape of the pier, Model II with web in Fig. 3, and the angle of attack were held constant throughout this set of experiments, as was the size of sand used. Various depths and velocities of flow were tested. The maximum depth was limited by the height of the flume wa1ls, and the minimum by the Froude number approaching unity. The maximum velocity was limited by the tendency of the sand to be carried past the trap in suspension, and the minimum by an approach to zero bed-load movement in the flume. In terms of sediment movement, the variation in flows used was considerable: from 0.004 lb per sec to 0.27 lb per sec, or a seventy-fold
Diameter in mm
Microphotoorophs 2.5•
Fig. S - Sand characteristics.
range. For the purpose of taking continuous measurements of the depth of scour, other means than the dyed sand used for the first phase had to be devised. An electrical scour meter was
<X = 00 ()("' 30°
Fig. 6 - Scour patterns around plers .
(X = 60°
used which gave a continuous record. Electrodes were placed in the face of the pier, and the method depended for indication of depth on the difference in conductivity of the water and sand-water mixture.
Routine operation of a run began with the establishment of the required flow at a large depth and, consequently, low velocity over a previously leveled sand bed . The tailgate was then lowered to establish the desired depth of flow. At 5-min inte rvals the amount of sand trapped was measured and the elevator was raised an equivalent amount. The depth of scour at the upstream shaft of

6
(~}
Q
o Model I a Model 1I A Model m
2 6
Fig, 7 - Correlation with drag.
c
Q
7
the model pier was automatically and continuously measured by the scour meter. The run was continued until equilibrium had been established for both the rate of transport and the depth of scour.
As the data plotted on Fig. 10 indicate, the depth of flow is a primary factor in the determination of the depth of scour, whereas the velocity of flow bas little influence. A consideration of the relationship of velocity and depth of flow to the transport balance provides an explanation of their effect on the equilibrium depth of scour. The primary transport agent is the velocity of flow at the bed, In the flume this velocity is a function of the depth and the mean velocity of the flow. In the scour hole a spiral roller is formed, and the transport in the scour hole is dependent on the angular velocity of this roller and the size of the bole. As a first approximation the roller velocity should be a function of the mean velocity of flow.
If this is assumed, the mean equilibrilllll depth of scour should be a function only of the depth of flow. Because of the interrelation of the velocities, any increase in the mean velocity of flow will result in an increase in the angular velocity of the roller. The balapce of transport capacity in the flume and in the scour hole should thus be maintained without a change in the depth of scour.
Similarly, the argument explains the influence of the depth of flow. The velocity at the grain level decreases with an increase of the depth of flow. The scour hole must then enlarge if the depth of flow increases, to maintain the balance of transport capacities.
13•0.107
'IT
!3•0.296 0
Fig. 8 - Scour patterns around abutm ents.
This logical concept of scour is further confirmed by the experiments sUI1111arized in Fig. 11. Transport into the scour hole was minimized in runs in which the movable sand bed was confined to a small area around the pier. The variation of transport capacity in the scour hole as a function of the deoth of scour was thus obtained. The rate-of-scour curve is influenced at small depths by the unsteadiness resulting from flow establishment, at large depths by the significant, but low, rate of movement into the hole. Extrapolation of the middle portion of hole at the equilibrium depth.
any curve intersects the normal rate of supply to the scour
For nonequilibrium conditions the balance of transport capacities is not attained and the conclusions based on this concept are not applicable. In each run, the natural slope and bed configuration gradually formed from the initially level bed. During this period the transport in the flume was less than normal. As a result, the depth of scour could be greater than the
128

final equilibrium depth. That this excess depth of scour is the result of a required bed configuration as well as bed slope is shown in Fig. 12. Although a study of this unsteady phenomenon has not yet been given complete consideration, the experimental evidence suggests the possibility that this phase of the scour hole formation may be of importance during flood flows. A related phenomenon is the oftnoted general degradation of the stream bed. The depth of scour is to be measured, of course, from this new bed level.
EFFECT OF SEDIMENT SIZE
The explanation of the effect of depth and velocity of flow can be extended logically to include the effect of sediment size on the equilibrium depth of scour, For uniform size sands, the material being transported as bed load in the flume and the material being scoured from around the pier are the same. Since the sediment size will not have any effect on any existing balance of the transport capacities, the equilibrium depth of scour should not be affected by a change in sediment size. Figure 10 includes results of runs with four sizes of sediment, the characteristics of which are shown in Fig. 5, Within the precision of the
Fig. 9 - Transport flume .
scour depth meter no effect of sediment size can be seen, Although a five-fold range of sediment sizes, including a fine sand, has been tested, all transport occurred as bed-load movement. A sediment-size effect may become apparent if the mode of transport changes to suspen-sion .
-Q)
Q)
0.6
u.. o.4 c ... :::> 0 u II)
0 ..c0.2 a. Q)
0
I I -=-t- -rr
~/'r---~ I
Velocity ( fps)
...--:s. 0 1.00 / Mean ,,
Diameter Cmm)
e 1.25
p 0.46 g 1.50
0. 0.58 () 1.75
-0- l.60 Cl 2.00
9 2.20 ~ 2.25
I " 2.50
I
0.2 0.4 0.6 0.8 Dep th of Flow in Feet
Fig. l 0 - Effect of flow and s and character istics.
129
e I
Q, _ .... -1-. -
I -
-
-
-
I
1.0
CONCLUSIONS
Although means have not yet been evolved for the prediction of the depth of scour around prototype piers and abutments, the model studies have succeeded in bringing that goal a little closer. The efficacy of the concept of scour as an imbalance of capacity and supply has been demonstrated. The concept should be just as useful in the interpretation of future studies, both in the laboratory and in the field.
Several facts of immediate practical significance are also apparent from the results of the model studies. If scour is to be minimized, webbed piers must be aligned to the flow and

-c • ! "O • ,, 0 101
• -Cl a:
I\ \ v\
.r---Flume Tran1port ' V• 2.2!S fps
' \ vvvv "
~6 'Q
Rate of
---,--;- \ ll>' Scour-----
0\ ~v
( ·~ V•2.00 fp1
\ I\
"""\ ""' cc ~ V• l .7!S fpe
Cf\ 1~
0
Q
Equllibrlum Depth--:= 1- ... 00
I I 0.1
Depth of Scour In Feet LO
abutments •ust not encroach upon the flow section. The shape of the scour boles indicates where protection fro• scour is most needed. On stub abutaents, for example , the sheet piling enclosing the approach fill should be driven deepest at the upstrea11 corner.
The apparent absence of any effect of velocity of flow and sedilllent size upon the equilibrium depth of scour provides encouragement in the search for correlation between model and prototype. Preparation is now in progress for field measurements which will extend the range of the present investigation.
As the next step in the laboratory investigation, the study of the effect of sediment characteristics will be extended to natural, nonuniform sands . If unsteady flow conditions prove to be important in the field , further investigation of this phenomenon will be necessary in the laboratory. Phase four , the effect of site geometry, will begin with an extension of the contraction studies of the first phase.
BIBLIOGRAPHY
[l] Laursen, I . M. "Progress Report of Model Studies of Scour around Bridge Piers and Abutments." Research Report No. 13-B Highway Research Board , 1951.
(2) Laursen, I. M. and Toch, A. "Model Studies of Scour around Bridge Piers and Abutments, Second Progress Report." Proceedings 31st Annual Meeting Highway Research Board, 1952.
Fig, 11 - Trans port balance at e qu ilibrium. [3) Schneible, D. E. "An Investigation of the Effect
of Bridge-Pier Shape on the Relative Depth of Scour." M. S. Thesis, State University of Iowa, June, 1951.
~ Bed Colldltlon 02t-------+--~-=--- - Equ1Ubrl11m Slope and Dun•
/' r - - - Equlilbrlum Slope, No OunH 9 ' ; 1 - - Level and Smooth W I I ~ I I -~Q31-----,,~1----+---r----t--------t-------i
/ I I / : I
- - I - - - - _E_g1.!!!~lu!!! Qe_e!'!_
0·6oi..------~,oo~----_,2,...,!o~o,..-------=3,.,!o"""o-----4~00 Time in Minutes
Fig. I Z - ll!xces s depth of scour.
~ Rounded
c=:> llliptical C)
Lenticular
Shape
Rounded
c::> Elliptical
C::>
Lenticular
<::>
+41
Table I
Comparison of Scour Depths Around Single Round Shaft and Streamlined Piers Aligned with Flow
Length- % Reduc-Wi dtb t i on for
Rati o Equal Width
2 : 1 0
3 : 1 + 4
2: 1
3:1
2: 1
3 :1
Table II
+11
+18
+11
+26
Caa.parison of Scour Depths Around Single Shaft and Streaml i ned Piers at 30" Angle of Approach
Length- '.{, Reduc-Width tion for Ratio lgual Width
2:1 -15
3:1 -22
2 :1 - 8
3:1 -22
2 :1 - 8
3 : 1 - 22
Table III
Reduction of Scour Depth Around Single Round Sbaf t by Arrestors
Arrestor Type
+52 +52
'.{, Reduction
131
% Reduction for
Equal Area
+23
+35
+30
+42
+25
+45
% Reduc-tion for
Equal Area
+11
+17
+ 9
+13
+ 6
+ 8
+48