a generic framework for continuous energy management …
TRANSCRIPT

A GENERIC FRAMEWORK FOR CONTINUOUS
ENERGY MANAGEMENT AT CRYOGENIC AIR
SEPARATION PLANTS
by
Theunis Johannes Kruger
Submitted in partial fulfillment of the requirements for the degree of
Master of Engineering (Electrical Engineering)
in the
Faculty of Engineering Built Environment and Information
Technology
UNIVERSITY OF PRETORIA
December 2003
copycopy UUnniivveerrssiittyy ooff PPrreettoorriiaa
Acknowledgements
To thank all the people who gave me their continuous support throughout w ill not be possib le
in th e available space and to them I would like to express my deepest grati tude in making this
study poss ible
bull To my Heavenl y Father my God to li ve in Your Name truly is what it is all about
bull Domi nique Rouge of Air Liquide your insight into cryogenic plants was invaluable and I
thank you fo r your willingness in assisting me during th is study
bull Jan Lewis of Sasol oxygen plant thank you for your continued willingness and patience
in sharing your valuable plant ex perience with me in the countless sessions we had
bull Saso l for giving me the opportunity and means for conducting thi s study
bull James Calmeyer fo r his guidance during thi s study
bull M y parents Sina and Theuns you always gave me your unconditional love and support to
which I am infinitely grateful Maryna and Rina you are the best siste rs a brother could
ever hope to have
bull Lastl y to Marilene my wi fe and soul mate your unconditional love and never-ending
support ha ve always tru ly been a great inspiration to me I dedi cate this to you
To Marilene
Electrical Electronic and Computer Engineerin g
Abstract
SUMMARY
Steel petrochemicals metall urgy explosives food and many other industries requIre large
amounts of a ir products such as oxygen and ni trogen Cryogeni c air separati on technology is
unli ke other air separation technologies in a mature stage of its life cycle and currentl y the
only practical means avail able for mass-producti on of these air products Inherent to its
operation cryogeni c air separati on plants are generally energy intensive and power input is
considered the main factor on which the ultimate prod uction cost wil l depend Ex peri ence has
shown that relati vely small improvements in energy effic iency on these plants generall y resul t
in significant reducti on of production cost
Th is d issertation di scusses the means fo r effective energy management at these plants aimed
at ultimately reducing the electri cal cost per quantity of air product produced It introduces a
model aimed at the manager res ponsible for energy manage ment at plants of thi s nature
At the core of the model is the defin iti on of the energy management structure which consists
out of the foll owing main managerial functi ons organi zing planning leading and controlling
Organ ization impl ies a formali zed intentional structure of rol es and positions whereas the
plann ing process entails sett ing up the energy policy and defining the energy strategy The
manageri al functi on of lead ing in volves leadership moti vati on and communicati on and in
controlling the energy manager sets energy standards measures perfo rm ance and initiate
appropriate correcti ve acti ons
KEYWORDS
Cryogeni c Air Separati on plant Energy Management Model Energy Poli cy Energy Strategy
Electri cal Electroni c and Computer Engineering
Opsomming
OPSOMMING
Die staal industri e petrochemiese maatskappye metallurgie plofstofvervaardi gers en di e
voedselbedryf benodig groot hoeveelhede gasprodukte soos suurstof en stikstof Kri ogeniese
11Igskeiding tegnologie is anders as ander lugskeidingstegnologiee in n volwasse stadium
van sy lewenss iklus en is huidiglik ook die enigste praktiese manier beski kbaar vir massa
produksie van die laasgenoemde gasprodukte Inherent tot sy prosses is kriogeniese
lugskeidingsaanlegte normaal weg energie intensief en energie-inset word normaalweg beskou
as di e hoof faktor waarop die uiteindelike produksie koste sal afhang Ondervinding het bewys
dat relatiewe klein verbeterings in die energie effe kti witeit van hierdie aanlegte normaalweg
lei tot beduidende verJagings in produksiekoste
Hierdi e verhandeling bespreek n metode waarop effekti ewe energiebestuur by hi erdie
aanlegte toegepas ka n word en is daarop gemik om die uiteindelike energie koste per
uitsetprodukhoeveelheid te reduseer Dit stel n model bekend wat gemik is op di e bestuurder
wat verantwoordelik is vir energiebestuur by hierdie aanlegte
Die defini sie van di e energiebestuurstru ktuur vorm die kern van die model en bestaan ui t d ie
volgende hoof bestuursfun ksies organisering beplanning leiding en beheer
Organi sering impli seer n geformali seerde en beplande struktuur van take en funk sies terwy l
di e beplanningsprosses di e bepalling van di e energiebeleid en formul eering van di e
energiestrategie insluit Die bestuursfunk sie van leiding sluit in leierskap motivering en
kommunikasie en in die beheer funksie stel di e energiebestuurder energiestandaarde vas meet
prestasie en ini sieer relevante korrektiewe aksies
SLEUTELWOORDE
Kri ogeniese lugskeiding Energiebestullrmodel Energiebeleid Energiestrategie
Electri cal Electronic and Computer Engineering III
List of Abbreviations
LIST OF ABBREVIATIONS
Abbreviation Meaning
AC Air Compressor
Ar Argon
AR A verage Recovery
ASU Air Separation Unit
CB Coldbox
CBM Condition-based maintenance
CO2 Carbon Dioxide
CT Current Transformer
FfM Fixed-Time maintenance
GAN Gaseous Nitrogen
GOX Gaseous Oxygen
He Helium
HP High Pressure
IA Instrument Air
Kr Kripton
LOX Liquid Oxygen
LP Low Pressure
MG-set Motor-Generator set
MP Medium Pressure
N2 Nitrogen
Electrical Electronic and Computer Engineering iv
List of Abbreviations
O2
OC
OEM
PM
PT
tpd
WN2
Xe
Normal Cubic Meters per hour This is the flow of a
commodity (gas or liquid) at normal conditions
(OOe and 1013 absolute bar)
Oxygen
Oxygen Compressor
Original Equipment Manufacturer
Preventive Maintenance
Potential Transformer
Tons per Day
Waste Nitrogen
Xenon
Electrical Electronic and Computer Engineering v
Table of Contents
TABLE OF CONTENTS
CHAPTER 1 PROBLEM IDENTIFICATION AND BACKGROUND 1
11 INTRODUCTION 1
12 ENERGY MANAGEMENT AT CRYOGENIC AIR SEPARATION PLANTS 1
13 DISSERTATION OBJECTIVES 3
131 Main objective 3
132 Specific objectives 3
14 DISSERTATION STRUCTURE 3
CHAPTER 2 CRYOGENIC AIR SEPARATION 5
21 INTRODUCTION 5
22 PROCESS DESCRIPTION 6
23 DISTILLATION 9
231 Example Distillation of an alcohol and water mixture lO
232 Distillation of air 12
24 CONCLUSION 18
CHAPTER 3 ENERGY MANAGEMENT 19
31 INTRODUCTION 19
32 ENERGY MANAGEMENT AT CRYOGENIC AIR SEPARATION PLANTS 19
32 MODEL FOR ENERGY MANAGEMENT AT CRYOGENIC AIR SEPARATION
PLANTS 20
33 ENERGY MANAGEMENT SYSTEM THE TRANSFORMATION PROCESS 21
34 CONCLUSION 23
Electrical Electronic and Computer Engineering VI
Table of Contents
CHAPTER 4 ORGANIZING AND PLANNING 24
41 ORGANIZING 24
42 PLANNING 24
43 THE ENERGY POLICY 24
44 THE ENERGY POLICY STRATEGY 27
441 Deployment of human resources 28
442 Current situation evaluation 28
4421 The energy audit process 29
4422 The plant efficiencies 29
4423 Energy audit policy 33
4424 Energy audit strategy 33
443 Energy systems maintenance 50
4431 Establishing an energy systems maintenance life plan 52
4432 Energy systems maintenance on compressors 53
4433 Energy systems maintenance on motors 53
4434 Energy systems maintenance on distillation columns 64
4435 Energy systems maintenance life plan 65
444 The energy management plan 66
445 Measurement and control indicators 68
4451 KPI for determining the state ofthe compressor motor 70
4452 KPlfor determining the state ofthe air and product compressor 71
4453 KPlfor determining the state of the air separation unit 71
4454 KPlfor determining the overall efficiency ofthe plant 72
45 CONCLUSION 73
Electrical Electronic and Computer Engineering Vll
Table of Contents
CHAPTER 5 LEADING AND CONTROLLING 75
51 LEADING 75
52 CONTROLING 76
53 ESTABLISHING ENERGY STANDARDSNORMS 76
54 PERFORMANCE MEASUREMENT 76
55 CORRECTIVE ACTION 81
551 Global efficiency indicator 81
542 Compressor motors 81
5421 Air compressor motor 82
5422 Oxygen compressor motor 82
543 Air compressor 83
544 Oxygen compressor 83
545 Air separation unit 84
55 CONCLUSION 84
CHAPTER 6 CONCLUSIONS AND RECOMMENDATIONS 86
61 INTRODUCTION 86
62 CONCLUSIONS ON THE OBJECTIVES 86
621 Conclusion on the energy management model 86
622 Conclusion on the energy policy 87
623 Conclusion on the energy policy strategy 87
624 Conclusion on the energy audit process 88
625 Conclusion on the mathematical model 88
626 Conclusion on the performance indicators 89
627 Conclusion on energy systems maintenance 89
Electrical Electronic and Computer Engineering Vll1
Table of Contents
63 RECOMMENDAnONS 90
631 Recommendations on setting up the energy management program 90
632 Recommendations regarding existing energy management programs 91
633 Recommendations regarding energy modeling 91
634 Recommendations regarding the energy manager 92
635 Recommendations regarding energy management at Sasol Secunda 92
64 FUTURE WORK 93
65 CLOSING REMARKS 93
REFERENCES 95
APPENDIX A CASE STUDY BASIC ENERGY CONVERSION MODEL
FOR THE SASOL SECUNDA OXYGEN PLANT 98
APPENDIX B LIST OF TABLES 106
APPENDIX C LIST OF FIGURES 108
Electrical Electronic and Computer Engineering IX
Chapter 1 Problem Identification and Background
CHAPTER 1 PROBLEM IDENTIFICATION AND BACKGROUND
11 INTRODUCTION
Steel metal and petrochemical industries all require large amounts of air products such as
oxygen and nitrogen Kotz et ai [1] states that oxygen and nitrogen are annual1y among the
top five chemicals produced in the United States Cryogenic air separation plants are
currently the only efficient and economical1y viable method of producing air products on
large scale (Smith et ai [2]) Because transportation adds considerably to the cost plants are
usually constructed on-site and located close to the point of consumption
It is also a fact that plants of this nature are generally energy intensive especially the large
tonnage plants and it has been found that relatively small improvements in plant energy
efficiency may lead to significant energy cost savings
12 ENERGY MANAGEMENT AT CRYOGENIC AIR SEPARATION PLANTS
The energy crises of the early 1970 s necessitated significant improvement of energy
management efforts at these energy intensive plants and initial efforts were mostly aimed at
energy conservation through introduction of better technology available for that time
(Birmingham et al [3])
As a consequence of this intentional consideration to improved plant energy efficiency has
been given during its design phase ([4] [5] [6]) this is manifested by the fact that energy
efficiency increased by approximately 91 from 1980 to the late 80s [4] and from 1997 to
2001 Air Liquide reports a 10 decrease in power consumption of its cryogenic air separation
plants [7]
Since the 1970s energy optimization techniques have been given elevated importance in the
design phase of cryogenic air separation plants and numerous studies addressing the issues
Electrical Electronic and Computer Engineering 1
Chapter 1 Problem Identification and Background
surrounding improved energy optimization have been widely publicized (refer to Birmingham
et ai [3] Biddulph [8] Gupta et al [9] and Sarkar [6]) It is also a fact that all these studies
are almost solely aimed at improving the energy efficiency of the plant through intervention at
the design phase of the cryogenic air separation plant Although there have certainly been
significant improvements in plant energy efficiency during the past years as stated earlier not
much have been written on how proper maintenance of this energy efficiency should be
conducted and needles to say proper energy management
The aim of energy management is defined by Thuman et ai [10] as the reduction of energy
expenditure for the purpose of reducing product cost this would ultimately lead to an increase
in competitive performance and it becomes clear that by employing effective energy
management much more benefit can be drawn by the relevant stakeholders and consequently
also makes business sense
This energy management effort should not only be confined to the design phase of the plant
but should be a continuous action applying it throughout the whole productive part of the
plants life-cycle
With todays relatively high and continuously increasing energy prices it not only becomes a
necessity but also makes business sense to maintain and continuously improve the plants
energy efficiency Managing the plants energy expenditure and efficiency would be the
correct response to the already high and ever-increasing energy cost and may reduce overall
input cost dramatically
To make this managerial action value-adding there needs to be an effective and continuous
energy management program in place that aims to reduce the plants energy expenditure so as
to ultimately reduce product cost
Electrical Electronic and Computer Engineering 2
Chapter 1 Problem Identification and Background
13 DISSERTATION OBJECTIVES
The dissertation objectives are as listed under the main and specific objectives in the subshy
sections that follow
131 Main objective
The main objective of this dissertation is to present a structured framework which would
enable effective management of energy cost and efficiency on cryogenic air separation plants
132 Specific objectives
The main objective is accomplished by addressing several key specific objectives
bull Present a model for energy management at cryogenic air separation plants
bull Introduce the theory behind an energy policy
bull Introduce an energy management strategy
bull Present an efficient energy audit process
bull Derivation of a mathematical model for the cryogenic air separation plant
bull Defining performance indicators which would assess the success of the energy
management program
bull Present the means for conducting energy systems maintenance on relevant
equipment on the plant
14 DISSERTATION STRUCTURE
This dissertation is structured in accordance with the energy management model
Chapter 2 introduces the reader to some of the various technologies available today for
producing air products and also elaborates on the basic theory behind cryogenic air separation
Electrical Electronic and Computer Engineering 3
Chapter 1 Problem Identification and Background
The main processes within the air separation plant are described as well as the equipment used
in realizing these processes
Chapter 3 introduces the energy management model and more specifically the energy
management system This chapter sets the scope for the chapters that follow and gives a brief
introduction of what each one entails
Chapter 4 describes the organizational structure of the energy management program as well as
the components its comprised of It also elaborates on energy management planning and
introduces the concept behind the energy policy and strategy In this chapter components of
the energy policy strategy are described in detail and selected concepts are explained by means
of case studies
In chapter 5 the managerial function of leading is described as well as a few issues
surrounding employee motivation Also included in chapter 5 is the theory behind energy
management controlling where concepts surrounding energy standards detection of deviations
and correction of deviations are elaborated on
The last chapter chapter 6 concludes the dissertation objectives and ends with
recommendations with regard to selected topics
Lastly the case studies presented in this study are with reference to the oxygen plant at Sasol
Secunda in South Africa unless otherwise stated
Electrical Electronic and Computer Engineering 4
Chapter 2 Cryogenic Air Separation
CHAPTER 2 CRYOGENIC AIR SEPARATION
21 INTRODUCTION
Air is a composition of various gasses of which nitrogen (N2) and oxygen (02) collectively
account for approximately 9903 of the total sample volume (Table 21) Various needs
have been developed for application of these gasses especially in the steel petrochemical and
metal industries where large amounts of oxygen and nitrogen are required According to Kotz
et ai [1] oxygen and nitrogen are used the most extensively by industry and they are annually
among the top five chemicals produced in the United States
Table 21 Components of air and their properties (Sources Austin [11] Kotz et ai [1])
Gas Molar Mass (mole) Volume () Boiling Point (K) Nitrogen 2801 78084 7735 Oxygen 3200 20946 9019 Argon 3995 0934 8727 Hydrogen 101 000005 2027 Neon 2018 0001921 2709 Helium 400 00005239 422 Krypton 8380 00001139 11981 Xenon 13129 00000087 16504 Carbon dioxide 4401 002-004 19468 bull Average molar mass of dry air =2896 gmol
Oxygen and nitrogen are produced by means of an air separation process which entails the
separation of air into its constituents The rare gasses like for example Argon Krypton and
Xenon are normally obtained as byproducts of the air separation process
Realization of the air separation process is done through the implementation of a specific air
separation technology There exist different air separation technologies today each one aimed
at exploiting different attributes with regard to the difference in physical properties between
the constituent air gasses In other words an air separation technology is based on the fact that
the fundamental components of air all have different physical properties and air separation is
Electrical Electronic and Computer Engineering 5
Chapter 2 Cryogenic Air Separation
therefore realized through for example distinguishing between molecule sizes distinguishing
between difference in diffusion rates through certain materials adsorption preference special
materials have towards certain gasses of the atmosphere and difference in boiling
temperatures
Some of the technologies being used today include adsorption chemical processes polymeric
membranes ion transport membrane (ITM) and cryogenic Table 22 compares the different
air separation technologies to each other in terms of technology status byproduct capability
product purity limit and plant startup time As can be seen from the table cryogenic air
separation technology is in a mature stage of its life cycle consequently making it the only
feasible means currently available for mass production of air products such as oxygen and
nitrogen
Table 22 Comparison of air separation technologies (Smith et ai [2])
Process Status Byproduct capability
Purity limit (vol )
Start-up time
Adsorption Semi -mature Poor 93-95 minutes Chemical developing Poor gt99 hours Cryogenic mature Excellent gt99 hours Membrane Semi-mature Poor 40 minutes ITM developing Poor gt99 hours
The sections that follow will be dedicated to cryogenic air separation technology
22 PROCESS DESCRIPTION
Cryogenic air separation technology is based on the fact that the different constituent gasses of
air all have different boiling points and by manipulating the immediate environment in terms
of temperature and pressure the air can be separated into its components
Various processes are needed in a cryogenic air separation plant of which the fundamental
ones are air compression air purification heat exchanging distillation and product
Electrical Electronic and Computer Engineering 6
Chapter 2 Cryogenic Air Separation
compression (figure 21)
Air Product Product compression compression delivery
I
Air - Heat Distillation
purification exchange
Figure 21 Processes involved in cryogenic air separation
Each process of figure 21 has a certain function and this function is performed by means of
relevant equipment Table 23 lists the equipment type utiHzed in each of the required
processes as well as their respective main functions
Table 23 A description on the function of each process and the equipment used for the
implementation thereof
Process Function Equipment type Pressurize air feed lines in
Air compression order to achieve required Compressor production I Purifying the air by Reversible exchangerssieve
Air purification removing water and CO2 adsorbers Cooling of incoming air feed by means of cold
Heat exchanging Heat exchanger recovery from exiting products Partial separation of air into
Distillation Distillation columns its constituents Pressurize outgoing product
Product compression feed in to meet user Compressor requirement
Electrical Electronic and Computer Engineering 7
Chapter 2 Cryogenic Air Separation
In figure 21 incoming air is pressurized by the air compressors and enters the process with a
certain flow-rate as determined by the demand of air product at the output of the plant
The air pre-treatment section removes impurities like water carbon dioxide and hydrocarbons
and is necessary because it prohibits vapour condensation liquid water solidification and
gaseous CO2 condensation from occurring within the heat-exchanger thus ensuring
continuous operation of a train
In order to obtain the required conditions for air distillation the air first needs to be cooled
down and this is done by means of heat exchanging between the air and outgoing product
streams
The distillation process is at the heart of the overall process this process performs the actual
separation of air into its constituents These air products are produced with a certain purity
which is defined as the ratio of the quantity of 100 pure air product to the quantity of total of
air product at the output
The outputs from the distillation process are fed back through the heat exchanger in order to
realize the cold recovery process that is needed for the cooling of the incoming air feed lines
The main air product is at low pressure when exiting the distillation process and is for this
reason usually compressed to the clients pressure specification prior to delivery
The system incorporating these processes is referred to as an oxygen or nitrogen train
whatever the main product may be A number of such trains are usually cascaded in order to
produce a high-tonnage air product output and is then collectively referred to as an oxygen or
nitrogen plant
The capacity of cryogenic air separation trains is expressed in tons per day (tpel) of main
Electrical Electronic and Computer Engineering 8
Chapter 2 Cryogenic Air Separation
product output The flow of air products is usually quantified in terms of normal-cubic meter
per hour (Nm31h) which is defined as the flow at 1013 absolute bar and DoC This is in
actuality a mass flow and not a volume flow and conversion between Nm3Ih and tpd may be
done by using the ideal gas law as stated in Perry et al [12] and Fishbane et al[13]
pV =nRT (1)
where
bull P is the gas pressure (kPa)
bull V is the volume (m3)
bull Tis the gas temperature (K)
bull R is the gas constant (831451JmoZ- i Ki)
Rearranging equation (1) and substituting the normal conditions stated earlier gives equation
(2)
V =22414xn (2)
Thus the volume occupied by one mole of gas is 22414m3 at normal conditions whatever the
gas may be The periodic table (Kotz et al [1]) states the molar mass of elements and this is
32gmol for oxygen (02) and 28gmol for nitrogen (N2) and knowing that Itpd is equivalent
to10624 glhour one may evaluate the ton per day rating for oxygen and nitrogen from the
mass flow specification or vice versa
ltpd O2 =2918 Nm31h (3)
1tpdN2= 3335 Nm31h (4)
23 DISTILLATION
As stated earlier the distillation process is at the heart of the overall process and for the
purpose of this dissertation this section will be dedicated to a basic explanation on its
operation The working of this process will be explained by means of an example highlighting
the critical elements of distillation and later on applying these principles to the distillation of
air
Electrical Electronic and Computer Engineering 9
Chapter 2 Cryogenic Air Separation
231 Example Distillation of an alcohol and water mixture
Consider a distillation flask in which there is a mixture of water and alcohol as depicted in
figure 22
Water + Alcohol
Figure 22 Distillation flask with water and alcohol mixture
In figure 23 the mixture is brought to boiling point with a boiler and a gaseous phase richer
in the most volatile component is obtained The gas is condensed and as alcohol vaporizes at
a lower temperature than water (we say that alcohol is more volatile than water) a distillate
richer in volatile elements is obtained
Gas richer in alcohol
Alcohol-rich
distillate
Figure 23 Water and alcohol mixture at boiling point producing a gas and consequent
distillate richer in alcohol
Condenser
Boiler
2 e]
Electrical Electronic and Computer Engineering 10
Chapter 2 Cryogenic Air Separation
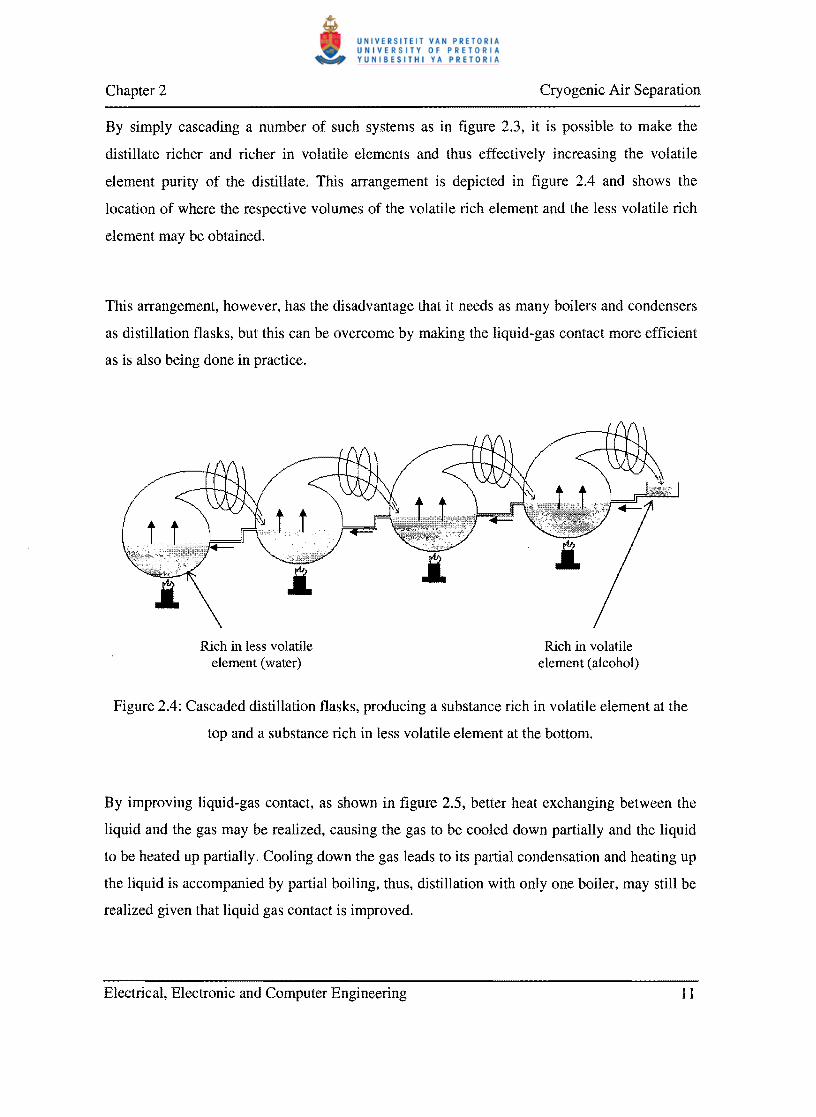
By simply cascading a number of such systems as in figure 23 it is possible to make the
distillate richer and richer in volatile elements and thus effectively increasing the volatile
element purity of the distillate This arrangement is depicted in figure 24 and shows the
location of where the respective volumes of the volatile rich element and the less volatile rich
element may be obtained
This arrangement however has the disadvantage that it needs as many boilers and condensers
as distillation flasks but this can be overcome by making the liquid-gas contact more efficient
as is also being done in practice
Rich in less volatile Rich in volatile element (water) element (alcohol)
Figure 24 Cascaded distillation flasks producing a substance rich in volatile element at the
top and a substance rich in less volatile element at the bottom
By improving liquid-gas contact as shown in figure 25 better heat exchanging between the
liquid and the gas may be realized causing the gas to be cooled down partially and the liquid
to be heated up partially Cooling down the gas leads to its partial condensation and heating up
the liquid is accompanied by partial boiling thus distillation with only one boiler may still be
realized given that liquid gas contact is improved
Electrical Electronic and Computer Engineering 11
Chapter 2 Cryogenic Air Separation
Rich in less volatile element
(water)
Rich in volatile element (alcohol)
Figure 25 Distillation by means of improved liquid-gas contact between cascaded distillation
flasks
This concludes the water and alcohol example and the basic theory explained here will now be
made applicable to air distillation
232 Distillation of air
In practice distillation trays instead of flasks are used and the basic function of the tray is to
enable efficient contact of the descending liquid and the rising gas Thus the tray sets the
stage for following
bull Cooling and partial condensation of the rising gas
bull Heating and partial vaporization of the descending liquid
Figure 26 depicts a distillation column with only one vaporizer and one condenser
Distillation is made possible by efficient liquid-gas contact and this is enabled through proper
contact between the descending liquid and the rising gas The respective purities of the most
volatile and less volatile elements differ at each tray with the lower and upper sides of the
disti1lation column being the two extremes which is also where the pure elements are
obtained
Electrical Electronic and Computer Engineering 12
Chapter 2 Cryogenic Air Separation
Suppose that the mixture is no longer water and alcohol but oxygen and nitrogen (Le air)
then oxygen (less volatile element) would be produced at the bottom and nitrogen (most
volatile element) at the top
In figure 26 it is clear that the tray provides the rising gas with a certain resistance and thus
creating a pressure drop this pressure drop must be as small as possible for it has a significant
impact on the energy consumption of the air compressor and is also an important parameter in
development of a trays technology Distillation packing is another technology that is being
used and as opposed to fractional distillation trays ensures a much smaller total pressure drop
as well as improved liquid-gas contact
Condenser
Liquid-gas contact c s 0 r w
Distillation )column
Tray )
Vaporizer
Most volatile
component
$1
~ 8shyS 0 u
~ cI-0 gt
S
4-lt 0
egt middotc ~
$1 ltU $1 0
ashy0 u ltU
3 -cI-0 gt ~
4-lt 0
egt middotc I
Q
Less volatile
component
Figure 26 Distillation column producing oxygen and nitrogen by means of fractional
distillation trays [5J
Electrical Electronic and Computer Engineering 13
Chapter 2 Cryogenic Air Separation
In practice the model presented in figure 26 would be uneconomical since it needs both a
vaporizer and condenser It is possible to remove either one but then the column would be
limited to either producing oxygen or nitrogen and not both at the same time
When removing the condenser it is still possible to produce oxygen however a liquid mixture
of nitrogen and oxygen is needed and this must be injected at the top of the column as shown
in figure 27
Residual product (N2 + O2)
GAS
LIQUID
Less volatile air product (02 )
LIQUID Vaporizer
Figure 27 Producing oxygen by utilizing a distillation column with no condenser [5]
It is important that the mixture entering the column must be in the liquid phase otherwise
there will only be one phase (gas phase) in the column which means that distillation would
not be possible as it requires both a gas phase and a liquid phase
Thus with the model presented in figure 27 liquid oxygen is produced at the bottom and a
residual gas consisting of nitrogen and oxygen at the top
Electrical Electronic and Computer Engineering 14
Chapter 2 Cryogenic Air Separation
Figure 28 shows a model for producing nitrogen The distillation column utilizes only a
condenser and it is required that a nitrogen and oxygen gas mixture be injected at the bottom
of the column
Condenser The more volatile product
GAS
Nz+ O2 mixture
Residual product (N2+ O2)GAS
LIQUID
Figure 28 Producing nitrogen by utilizing a distillation column with no vaporizer [5]
Gaseous nitrogen is obtained at the top of the column whereas a residual liquid mixture rich in
oxygen is obtained as a byproduct at the bottom of the column
By injecting a liquid oxygen and nitrogen mixture instead of a gaseous mixture at the bottom
of the column would make distillation impossible because there will again be only be one
phase (liquid phase) present
Thus to summarize when producing oxygen a liquid mixture of oxygen and nitrogen and a
column equipped with a vaporizer at the bottom is required To produce nitrogen a gaseous
Electrical Electronic and Computer Engineering 15
Chapter 2 Cryogenic Air Separation
mixture of oxygen and nitrogen as well as a column equipped with a condenser at the top is
needed a byproduct rich in oxygen will also be produced in this instance
By stacking the columns presented in figures 27 and 28 on top of one another and by
routing the oxygen rich liquid which is obtained at the bottom of the nitrogen column to the
top of the oxygen column it is possible to produce oxygen and nitrogen by using only a
condenser as shown in figure 29
An oxygen rich liquid enters the top of the upper distillation column and through distillation
results in liquid oxygen (LOX) at the bottom of the same column Vaporization of the LOX
into gaseous oxygen (OOX) is realized by means of the heat exchanging that occurs between
the gaseous nitrogen (OAN) at the top of the lower column and the LOX at the bottom of the
upper column At the top of the upper column a waste product consisting of a nitrogen and
oxygen gas mixture is also produced
In practice the function of the condenser is fulfilled by a heat exchanger that ensures that
proper heat is carried over from the OAN to the LOX and vice versa in order to enable
vaporization of the LOX and condensation of the OAN which is required for the continuous
operation of the distillation columns
In this model the columns are stacked on top of each other but it is also possible to place them
alongside one another as occasionally being done in practice
This concludes the discussion on distillation further explanation on this subject is beyond the
scope of this dissertation and the basic theory presented here should be sufficient and relevant
to understanding the selected material presented in this study
Electrical Electronic and Computer Engineering 16
Chapter 2 Cryogenic Air Separation
GOX ---shy
LOX l1li---shy
Condenser
GAN ---shy
Air
Oxygen rich liquid
Figure 29 Stacked column model that enables the production of oxygen and nitrogen
Electrical Electronic and Computer Engineering 17
Chapter 2 Cryogenic Air Separation
24 CONCLUSION
This chapter has explained the basic theory behind cryogenic air separation It details the
properties of air and compares the various technologies for producing certain air products
This chapter states the main processes of cryogemc air separation and they are air
compression air purification heat exchanging distillation and product compression These
processes as well as the interaction between them have been described
Distillation is the key process in cryogenic air separation and has consequently been given
special consideration to in this chapter The basic theory behind distillation as well as how this
applies to the separation of air have been elaborated on which should serve as a sufficient
reference for the remainder of this dissertation
Electrical Electronic and Computer Engineering 18
Chapter 3 Energy Management
CHAPTER 3 ENERGY MANAGEMENT
31 INTRODUCTION
Management is essential in any organized collaboration and should be implemented at all
levels of an enterprise (Koontz [14] et al) An organization has certain inputs to its disposal
be it human resources funds technology skills etc and it is the basic function of the manager
in charge to efficiently manage these valuable inputs in pursuit of achieving predefined
objectives in an optimum manner In an industrial plant like the cryogenic air separation plant
typical inputs are production personnel the various maintenance departments (electrical
mechanical instrument turbo etc) engineering financial and information technology among
others and all these resources are normally subjected to some form of management Energy is
another important input to the plant the plant needs energy to produce its products to the
clients specification and given that cryogenic air separation plants are energy intensive by
nature efficient energy management will have a definite impact in the cost per product
produced
For instance the oxygen plant at Sasol Secunda in South Africa is composed out of several
trains which col1ectively account for approximately 35 of the factorys total power
consumption In terms of the total operating cost of the oxygen plant itself the energy cost
constitutes 72 thereof compared to the 2 of labor costs and 8 of maintenance related
costs [15] This relatively large electricity cost is typical of cryogenic air separation plants
(also refer to Sarkar [6] and Gupta et al [9]) and it is quite possible to manage the usage of
energy in such a way as to ultimately reduce the cost per product produced
32 ENERGY MANAGEMENT AT CRYOGENIC AIR SEPARATION PLANTS
Turner [16] defines energy management as the control of energy consuming devices for the
purpose of minimizing energy demand and consumption Energy management is defined by
Janse van Rensburg [17] to be the perspicacious and efficient usage of energy Another
definition is that from Ottaviano [18] where energy management is defined as the reduction of
demand through conservation
Electrical Electronic and Computer Engineering 19
Chapter 3 Energy Management
The aim of energy management is defined by Thuman et al [10] as the reduction of energy
expenditure for the purpose of reducing the cost of a product so as to increase competitive
performance
With the various energy management definitions in mind one can come to the conclusion that
energy management is some sort of process ultimately resulting in reduced energy
expenditure How then would one go about describing this process which energy
management is In terms of energy management applied to cryogenic air separation plants
energy management may sufficiently be described as a transformation process and this will be
the topic of the next section
32 MODEL FOR ENERGY MANAGEMENT AT CRYOGENIC AIR SEPARATION
PLANTS
The Oxford dictionary [19] defines a model as a representation of reality a simplified
description of a complex system The model developed here serves as a generic framework for
energy management at cryogenic air separation plants and provides insight and understanding
of the energy management process as well as giving structure to this understanding it is a
product of systems thinking and takes on a holistic approach towards energy management A
basic outline ofthe model is presented in figure 31
External environment
Inputs
Resources Accomplished objectives
Figure 31 Basic outline of the energy management model
Energy management process
(transformation process) Outputs
Electrical Electronic and Computer Engineering 20
Chapter 3 Energy Management
The basic function of the energy manager is to transform the inputs (resources) in an effective
and efficient manner into outputs of higher value With the available resources as levers and
with the expected objectives in mind the energy manager has to convert the resources into the
pre-defined objectives by means of a transformation process This transformation process is
the organizational structure of the energy management program for which the management
thereof is the responsibility of the energy manager
The organizational structure of the energy management program is part of larger systems such
as the industry to which it belongs social systems economic systems and even the natural
environment and this is accounted for by the inclusion of the external environment Typical
inputs from the external environment are resources like capital skills facilities and people
and as shown in the figure the external environment is ultimately affected by the outcomes of
the energy management program
33 ENERGY MANAGEMENT SYSTEM THE TRANSFORMATION PROCESS
It is generally accepted that the fundamental components of management are planning
organizing staffing leading and controlling (Koontz et al [14]) Energy management is a
managerial action and most of these functions also apply to the energy management system
Figure 32 depicts the energy management model and states the components of the
transformation process
Through organizing the energy management program the energy manager gives it definition
and structure It mainly involves identification and classification of required activities and the
grouping of these activities in a structured and meaningful way
Planning involves the decision-making process This is where policies are set objectives are
determined and the strategies in attaining these objectives are established
Electrical Electronic and Computer Engineering
i L4502-7S
bH LczJ 717 ~
21
Chapter 3 Energy Management
Inputs Resources
- Capital
- Skills
- Facilities
- People
External environment
- Energy management structure C1et1m1t10Ilt~1
- Energy policy strategy
Hil- Human resource deployment
- Current situation evaluation
- Energy systems maintenance
- Energy management plan
Establishing standards
Performance measurement
Figure 32 The energy management model
Outputs Accomplished energy management objectives
- Reduced production cost
- PM maintenance strategies
- Improved plant design
- Improved production schedules
- etc
Electrical Electronic and Computer Engineering 22
Chapter 3 Energy Management
Leading refers to the process of influencing people so that they will strive willingly and
enthusiastically toward the achievement of energy management goals
Controlling is the measurement and correction of performance in order to ensure that
objectives and the plans devised in attaining them are being accomplished
These managerial functions make up the transformation process and in performing these
functions the energy manager enables an efficient and effective process for achieving energy
management objectives Analysis of each of these functions will be given in the chapters that
follow
34 CONCLUSION
In this chapter a model for energy management is given the energy management process is
modeled as a transformation process in which resource inputs are converted into outputs of
higher value
The model entails the transformation process its inputs and outputs and the external
environment as well as the interaction between all of these Inputs are resources like people
skills and facilities outputs are the accomplished energy management objectives like
improved preventive maintenance schedules optimized production schedules and reduced
energy cost
The external environment accounts for the higher-order systems to which the energy
management system belongs The transformation process involves the managerial functions of
organizing planning leading and controlling which are the core managerial functions the
energy manager has to perform Each function entails various activities and will be explained
in more detail in the chapters that follow
Electrical Electronic and Computer Engineering 23
Chapter 4 Organizing and Planning
CHAPTER 4 ORGANIZING AND PLANNING
41 ORGANIZING
With reference to general management Koontz et al [14] states that organization implies a
formalized intentional structure of roles and positions Generally organization involves 1) the
identification and classification of required activities 2) the grouping of activities necessary to
obtain objectives and 3) the delegation of authority for the means of managing these
groupings
With reference to energy management there should be an intentional and formal structure in
place for conducting a continuous and efficient energy management program The structure
presented in this study defines three groups of activities energy management planning
leading and controlling The activities under each grouping will be explained in the sections
and chapters that follow
42 PLANNING
Planning involves decision-making This is where courses of action are selected objectives are
set and strategies in attaining these objectives are determined The starting block of the energy
management program is the energy policy The energy policy is a statement or understanding
that guides or channels thinking it is an expression of the commitment plant management has
towards a continuous and effective energy management and sets the scope for energy
management strategies at plant level
43 THE ENERGY POLICY
Plant management should establish an energy policy that is in line with major policies in order
to ultimately add value to overall company objectives The energy policy at plant level may be
derived from a major policy and is therefore called a derivative or minor policy (Koontz et al
[141) Figure 41 shows the energy policy at various levels of the organization as well as the
scope of the policy at each of these levels
Electrical Electronic and Computer Engineering 24
C hapter 4 Organi zing and Planning
Company wide policy
Scope of company wide policy
incorporating all divis ions
Scope of divisional policy derived from
company poli cy
Scope of plant pol icy deri ved From the
divisional policy and made appl icable to
the plant
Figure 4 1 Energy policy at different levels o f the organi zati o n and the scope of the po licy at
each level
Thus the energy poli cy aL planL level is Lypicall y a deri vati on o f hi ghe r-orde r po li c ies Lhese
policies may be hi gher-level energy or environmental po li cies and has a much la rger scope
than the plant-level energy po li cy
As an example the sa fety hea lth and environmental po li cy of Sasol Secunda is a companyshy
wide policy
bull Compally-wide policy (Safety Health and Environll1el11al Policy)
Electrica l E lecLronic and Com pULer Eng ineering 25
Chapter 4 Organizing and Planning
We are committed to responsible utilization of natural resources and we will manage our
company wherever we do business in an ethical way that strikes an appropriate and well
reasoned balance between economic social and environmental needs [20]
From this policy it can be seen that Sasol recognizes its responsibility towards the
environment and also states that intentional effort concerning the balance between economic
and environmental issues will be instated by means of managerial actions which is also where
the high-level energy policy may stem from
bull Division-wide policy
To manage the SasollElectricity Supply Industry interface so as to minimize the total cost of
energy for the Sasol group of companies Further to this to promote energy efficiency and
reward energy management success by decentralizing accountability for electricity costs and
by aligning internal electricity tariff structures with the Eskom marginal rate [21]
From the above an energy policy at plant-level may now be derived
bull Plant-wide energy policy
We at oxygen plant are committed to responsible energy usage and endorse efficient energy
management practices in order to optimize our energy consumption
The energy policy normally consists out of three components the declaration of commitment
mission statement and specific objectives To illustrate the difference between these the
division-wide policy [21] will be taken as an example The mission statement defines the
scope of the energy management program and as can be seen in this case it has been included
in the declaration of commitment
Electrical Electronic and Computer Engineering 26
Chapter 4 Organizing and Planning
The specific objectives are the means for achieving that stated in the mission statement and
from the same example some objectives are
bull Develop ways of getting all stakeholders involved in energy management
bull Implement and continuously improve world-class best practice energy management
within our operations
bull Pioneer cross-functional and cross-divisional collaboration within the group of
companies
bull Facilitate the creation of an enabling environment which leads all key role players
agreeing to and achieving stretched targets
bull Develop and maintain the electricity measurement system within the group of companies
44 THE ENERGY POLICY STRATEGY
With the energy policy in place the logical next step would be to formulate a strategy in order
to realize the vision as expressed by the policy The energy policy strategy effectively
encapsulates the plan for changing current reality into future vision and in doing so the
following activities need to be addressed
bull deployment of human resources
bull current situation evaluation
bull energy systems maintenance
bull energy management planning
bull establishment of measurement and control indicators
These are the constituents of the energy policy strategy and each will be elaborated on in the
sections that follow
Electrical Electronic and Computer Engineering 27
Chapter 4 Organizing and Planning
441 Deployment of human resources
Plant management should appoint a dedicated person for taking the responsibility of driving
the energy management program This person should be knowledgeable of the technology
used in cryogenics and be experienced in energy auditing and management This person
should also assist plant management in adjustingrefining the current energy policy in order to
make sure that it adds value and makes allowance for the holistic approach of energy
management
Koontz et al [14] defines two types of policies namely intended policy and actual policy
Initially plant management may have had no intended energy policy but by agreeing upon the
appointment of a dedicated energy manager to drive an energy management program they
have in actuality instated an ill-defined energy policy and it is the task of the energy manager
to now properly structure and formalize the energy policy in conjunction with management
442 Current situation evaluation
The current situation of the plant is assessed by means of an energy audit process Energy
auditing is an important phase of the energy management program and the success of such a
program to a large extent depends on how well and to what extent the energy audit was done
(Thuman [22] and Ottaviano [18]) After all the plant first has to know itself before it can
correct itself The aim of the auditing process is to establish the relative position of the plant
from an energy management point of view
Auditing is not a once-off process instead it should be done on a regular basis so that the
energy manager can make the value-adding decisions regarding corrective measures The
outcomes of the auditing process are the following (refer also to Ottaviano [18])
bull assessment of energy consumption and energy usage patterns
bull identification of potential improvement opportunities
bull assessment of energy norms
Electrical Electronic and Computer Engineering 28
Chapter 4 Organizing and Planning
bull employee awareness
bull feasibility of potential energy projects
4421 The energy audit process
The audit process consists out of the energy audit policy and the energy audit strategy The
energy audit policy sets the scope for what to audit whereas the energy audit policy strategy
states how this would be done
The audit strategies are the means for conducting the energy audit and the relative position of
the plant with regard to energy management is determined through the evaluation of certain
plant efficiencies as listed by Senekal [23]
bull Management efficiency
bull Maintenance efficiency
bull Operating efficiency
bull Design efficiency
bull Storage efficiency
bull Information efficiency
These efficiencies are determined from an energy management perspective and a holistic
approach to energy management lies in managing available resources in such a manner as to
optimize all these efficiencies
4422 The plant efficiencies
The cryogenic air separation plant like any other enterprise aims to convert resource inputs
into outputs of higher value For the cryogenic air separation plant typical inputs are capital
employees skills and technology and the common goal is to convert these inputs into products
Electrical Electronic and Computer Engineering 29
Chapter 4 Organizing and Planning
like oxygen nitrogen andor rare gases to customer satisfaction This conversion is done with
some amount of efficiency loss and in optimizing the overall efficiency necessarily means a
higher level of output with the same amount of input
Each department within the plant contributes to the overall efficiency loss and the contribution
energy management has is assessed in terms of the efficiencies already listed
Plant structure from energy management perspective
Management Maintenance Operating Design Storage Information
efficiency efficiency efficiency efficiency efficiency efficiency ~ ~ ~
~ ~ ~ - ~ ~ - v
-- - - -
Quantity of output product Resources
per unit of electrical cost
Figure 42 An illustration of efficiency losses inherent to the plants structure from an energy
managers perspective and how they collectively contribute to the ultimate quantity of output
product per Rand of electrical cost
In order to assess these plant efficiencies certain strategies should be employed but first an
explanation on what each efficiency entail will be presented
bull Management efficiency
Management efficiency is determined in terms of the commitment plant management has
toward energy management The level of this commitment should be determined and is a
function of the following
bull The existing energy policy
bull Amount of resources allocated for energy management
Electrical Electronic and Computer Engineering 30
Chapter 4 Organizing and Planning
The energy manager should determine whether there is an existing energy policy in place and
also establish on which level this policy originates from Next it should be determined
whether this policy has been derived to plant level and also whether it has been applied at this
level The extent of this application should also be determined Le are there any strategies
outflowing from this policy Have any resources been committed Have they been
implemented Are they relevant and in scope
bull Maintenance efficiency
The maintenance efficiency is determined by the extent of intentional consideration given to
the optimization of energy efficiency of relevant equipment in existing maintenance life plans
Maintenance efficiency goes hand in hand with energy systems maintenance which will be
dealt with in more detail later on in this chapter
bull Operating efficiency
By taking the system just as it is and not altering any design features try to obtain the most
efficient system operation This could mean changing process schedules or consolidating plant
activities
As mentioned by Senekal [23] the operating design and storage efficiencies are very closely
related and in most of the cases by changing one it would have an influence on the other two
These three efficiencies may be determined by means of utilizing a mathematical model
which is a specific audit strategy and will be discussed later on
As an example of operating efficiency consider an oxygen plant that has electric motor driven
compressors as well as steam turbine driven compressors During peak hours steam is cheaper
than electricity which means that just by changing production schedules of the electric andmiddot
steam trains during these times (increasing production of the steam trains and lowering that of
the electric trains) significant energy cost savings may be realized
Electrical Electronic and Computer Engineering 31
Chapter 4 Organizing and Planning
bull Design efficiency
Design efficiency entails the evaluation of the plants efficiency by taking into account the
systems design Restraining factors in the design are identified and by altering design
parameters the auditor can determine possible ways of optimization These design
deficiencies are normally the cause of
bull Inadequate design from an energy managers point of view
bull Inefficient equipment - a cause of equipment deterioration andor the availability of
improved and more energy efficient technology
For example at one plant motor-generator sets are used for bringing the large air compressor
motors up to speed The MG sets were installed twenty years ago and compared to soft starter
technologies available today are much more unreliable The unreliability of the MG set
caused numerous startup delays in the past resulting in significant production losses with the
implication that production department insisted that the air compressors be kept online even
when product demand is low This decision acts as a barrier to potential energy savings that
lies in taking an air compressor off-line when demand is low Thus by changing the original
design through introducing better technology (implementing better soft starter technology)
may lead to potential energy cost savings
bull Storage efficiency
Often there are cost saving opportunities by using storage facilities more efficiently This can
be seen in the case were the plant has a LOX tank facility to its disposal Excess LOX can be
pumped to the tank during off-peak times and can then be used later on to supplement the
demand during peak times Because there is now an extra supply channel it leads to the air
compressors having to produce less compressed air and ultimately results in energy cost
savings
bull Information efficiency
Information efficiency refers to the availability and nature of the relevant information
Electrical Electronic and Computer Engineering 32
Chapter 4 Organizing and Planning
necessary for conducting the energy management program Correct and accurate information
is vital to the energy management program and the energy manager must make sure that
relevant information is easily accessible
For instance data concerning the state (flows pressures temperatures purities etc) of air
commodities within the plant and each of the respective trains is crucial performing certain
energy management activities and barriers restricting the accessibility and availability of this
information should be addressed and overcome if the energy management effort is by any
means going to be successful
4423 Energy audit policy
The audit policy scopes the auditing work to be done and basically serves as a guideline in the
auditing process It is advisable to establish a formal energy audit policy because it gives
direction to the audit process and for the holistic approach this policy should enable the
assessment of all the relevant plant efficiencies mentioned earlier
4424 Energy audit strategy
In order to determine the plant efficiencies as stated in the audit policy audit strategies are
utilized and those that are most relevant are (also refer to Turner [16])
bull Familiarization with plant characteristics and operation
bull The questionnaire
bull The walk audit
bull The measurement audit
bull Database building
bull Mathematical model
bull Financial analysis and feasibility studies
Each strategy will now be looked at in more detail in the sections that follow
Electrical Electronic and Computer Engineering 33
Chapter 4 Organizing and Planning
bull Familiarization with plant characteristics and operation
For the audit to bear meaningful results the energy manager should first attain a relatively
thorough understanding of the characteristics of the plant as well as its production policy This
entails the following
bull Understanding of operating characteristics and production policy This also
includes identifying the input and output streams to and from the plant
bull Construct relevant process flow diagrams - This includes process models of the
plant and relevant sub-systems Also identify and make a list of all the energy
consuming components include attributes such as equipment ratings purpose of
equipment and quantity of each
bull Establish the user requirements for the plant and critical sub-sections
The key principles in plant familiarization will now be applied by taking the oxygen plant at
Sasol Secunda as an example
o Understanding ofoperating characteristics and production policy
The oxygen plant is part of a process chain and to have an idea of where it fits into the overall
system the following two tables shows the inputs of and outputs to and from the oxygen plant
Table 41 Details surrounding commodity inputs to the oxygen plant at Sasol Secunda
Water works
Distribution
and Plant air Air utilities
Electrical Electronic and Computer Engineering 34
Chapter 4 Organizing and Planning
Table 42 Details surrounding commodity outputs from the oxygen plant at Sasol Secunda
upplying various factory loads
The plant is running at full load twenty-four hours per day seven days a week All the outputs
must be produced with minimal stoppage The plant also incorporates a very useful buffer
system a LOX tank which is supplemented with excess LOX at times when oxygen demand is
relatively low or whenever there is spare capacity available The LOX tank serves the purpose
of supplementing oxygen demand at peak times when the available capacity isnt able to
match the demand Because atmospheric temperature plays such an important role in
producing excess LOX this commodity is usually fed to the LOX tank overnight when
temperatures are relatively low
There is a balance to be maintained in producing the various products which means that a
change in major output streams has a definite influence on the other output products There is
however priority assigned to the production of each commodity detailed in table 43
Table 43 Prioritization of output products of the oxygen plant
Priority Product Implication of production loss 1 (highest) Oxygen amp Nitrogen Substantial production loss 2 Nitrogen Substantial production loss 3 Instrument air Non-critical plants trip 4 (lowest) LOX Production loss at KryptonXenon plant
Electrical Electronic and Computer Engineering
I
35
Chapter 4 Organizing and Planning
CJ Construct relevant process flow diagrams
The oxygen plant comprises of seven oxygen trains as well as a spare oxygen compressor and
the outline of the plant is shown in figure 43
Oxygen Plant
HP02
507 200 Nm3h and 985 purity
~
l~ 0 72 200 Nm3h I
Air Inbull Train 1 I II 1middot O2 72200 Nm3h middot middot I Air In
Train 2 II ~
I middot bull I
0 72 200 Nm31h middot middot Air Inbull Train 3 I I ~ bull ~
72 200 middot middot Nm(when online)
I LPO LP~ HPAIR I
COMMON middot middot COMMONbull Spare Train bullbull middot I HEADER HEADERmiddotI I middot middot middot
HP02 middot middotbull I ~
COMMON HEADER
I middot
Air In Train 4 bull middot
middot middot I
O2 72200 NmJh II middot ImiddotI middot Air Ini bull Train 5 I I 0 72 200 NmJh ~
bull bull I
I middot middot Air Inbull Train 6 I i 0 72 200 Nm3h HI bull
middot ~middot middot Air Iny Train 7 II I I
I ~ 0 74000 Nm________________________________J
Figure 43 Basic outline of the oxygen plant at Sasol Secunda The flows presented here are
the steady state maximum amounts of oxygen that each train is able to produce
Electrical Electronic and Computer Engineering 36
Chapter 4 Organizing and Planning
The trains are linked by means of three common headers the air LP oxygen and HP oxygen
common headers Each train can sustain a continuous production of up to 72 200Nm31h of
oxygen except for train 7 which has a slightly higher capacity (74 000Nm31h) resulting in a
collective maximum production capacity of 507 200Nm31h for the plant
The main product high purity gaseous oxygen is produced at 985 purity (minimum) which
is pumped into a common header and distributed to the various loads within each factory
(gasification and gas-reforming)
The main purpose of the air common header is to minimize losses whenever an air compressor
goes offline In normal operation however there is little or no air exchange between trains but
as soon as one air compressor goes offline the air present in the common header supplies that
trains air demand Trains 1-6 are connected to the air common header with train seven
working in isolation Usually the air valve of train seven remains closed it is only in abnormal
circumstances that it is opened but then only by a relatively small amount
A control system monitors and controls the production of compressed air and it does this by
monitoring the compressed air demand and then opening or closing the guide vanes of all six
compressors by an equal amount thus effectively sharing the load equally between the six air
compressors
The spare train consists only of an oxygen compressor and is put online whenever one of the
other oxygen compressors is taken out of operation (eg due to breakdown or for routine
maintenance) Each train has two oxygen outlets namely the high-pressure (HP) outlet and
the low-pressure (LP) outlet In normal operation the trains LP oxygen output is isolated from
the LP common header via a valve but as soon as that trains oxygen compressor is out of
operation the valve opens enabling the LP oxygen to enter the common header and the spare
oxygen compressor goes online
Electrical Electronic and Computer Engineering 37
--
tTl (l) () qshy(i ~ -shytTl (l) () qshy0s ()
sect CJ (1 0 gs tTls
(J(l
Ei (l)
~ Er
(J(l
w
(1r
Excess N2 toatm i
HPN1
Dry air
to factory
Main heat ExchanJ2cr
--------------
=-t--n rI
----n
-
-_ -- J
~Waste N2
1
Coldbox
LOX
TIciQ Air from s -- atmosphere
-- n -
-------- ~
f p0 () (l)
=shy0 ~ 0 ~
s (J(l
(l)
0
~ (J(l (l)
s qshy1
1
Air Water Tower Dryer Dryer
1 2
ChilI Wet air LP02
Water Tower
~ sect
HP02 N (to factory) s
(J(lLPN1
sect CJ
IA g (to factory) ~ ss
Smiddot (J(l 00
Chapter 4 Organizing and Planning
Figure 44 shows the process flow of a single train All the electric utili zi ng equipment are
highlighted Note the quantity and process requirements are also brought onto thi s process
flow diagra m for example (112) means that process requirements need one of the two
installed equipment types during normal operati on
Table 44 Summary of electri cal machinery ratings and capacity requirements for production
means
QuantityO2 Production Operating Motor description Rating requirement QTY
train online
timeday
Expansion turbine motor 525 kW 2 1 24 h
Nitrogen blower motor 300 kW 2 1 24 h
Oxygen compressor motor 137 MW I 1 24 h
Air compressor motor 37MW I I 24 h
Chi ll water pump motor 75 kW 2 1 24 h
Water pump motor 132 kW 2 1 24 h
Jack- up oil pump motor 36kW 2 1 24 h
Installed capacity 52836MW
Utilized capacity 51678MW
Utilization 980
o Establish Ihe II ser requirements
Table 4 5 li sts the user requirements for the oxygen plant s output products
Table 45 Summary of the user requ irements for each product
Product Quantity Purity Delivery p Delivery p (kNm1t) (min) (min) kPa (max) kPa
Oxygen 72000 985 3440 3480 Nitroen 22000 999 420 430 LOX 3500 - 100 120 IA 8000 - 420 450
Electrical Elec troni c and Computer Engineering 39
Chapter 4 Organizing and Planning
bull The questionnaire
In conducting the energy audit the energy manager would undoubtedly find it necessary to
conduct interviews with key personnel The questionnaire is a structured and well-planned
approach in acquiring important information from personnel and it is imperative to identify the
appropriate personnel when conducting the audit For example determining maintenance
practices by interviewing production personnel would in most cases give a distorted picture
of the actual situation or in other instances not bear any meaningful results at all
It is very important that the questionnaire is planned thoroughly in advance The energy
manager should aim to attain as much information as possible with the least amount of
questions since personnel do not always have adequate time available
bull The walk audit
The walk audit goes hand-in-hand with plant familiarization and it enables the energy manager
to view the plant first hand It entails determining the state of the plant and in order for the
energy manager to make this audit value adding it would be a good idea to also take a guide
along one who is experienced with the equipment and the operation of the plant
bull The measurement audit
Relevant measurements of energy consumption flows pressures and temperatures can be
taken whenever there is no automatic measurement system in place but at most of these plants
real-time data collection is in place and data may simply be downloaded from were it is stored
bull Database building
Because the audit process is such an important phase in the energy management program all
the data collected should be stored for easy reference The database is a collection of various
pieces of information in different formats and it is thus important to have a structure in place
in which the information is organized in a meaningful manner The database should compose
Electrical Electronic and Computer Engineering 40
Chapter 4 Organizing and Planning
of the following
bull Results from other audits conducted
bull Specifications of machine ratings
bull Process amp equipment limitations and constraints
bull Operating schedules of plant
bull Maintenance strategies and schedules
bull Financial analysis and feasibility studies
One output of the energy audit process is the identification of potential improvement
opportunities and in response to this the energy manager is now concerned with identifying
alternatives as the means for realizing the different improvements
Normally most of the options would require capital investment to realize and the problem is
that the benefits resulting from an investment option is stretched over a period of time whereas
the investment is required now Thus feasibility studies are conducted with the aid of financial
analysis tools and only the most feasible option for each alternative should be considered
bull Energy conversion model
The energy model is an important auditing tool and adds great value to the energy
management program The basic idea behind the energy conversion model is to express the
plants power consumption as a function of main air product output under certain conditions
From the cryogenic air separation plants point of view a fairly accurate model may be very
complicated but it will be the aim of this section to present model building blocks that are
relatively simple whilst still providing adequate accuracy
As Delport [24] mentions there are basically two levels within process modeling The first
level is the physical model which is the energy managers understanding of the real world
Electrical Electronic and Computer Engineering 41
Chapter 4 Organizing and Planning
system in conjunc ti on with the follo wing restraining factors
bull assumptions and simplifi cations that are in line with the model acc uracy and
requirements
bull level of detail that has been decided upon
bull system and subsystem boundaries
bull data requirements and avail abi li ty
The second level in process modeling is the energy conversion model which is the
mathematical representati on of the physical model The difference between the physica l model
and energy conversion model should be noted the physical model is an abstracti on of the real
world system and the energy conversion model is an abstraction of the physical model
In order to deri ve an energy model for the plant the plant first needs to broken down into its
various levels of subsystems as shown in fi gure 45 It should be noted that the air purifi cati on
system and all other au xili ary equipment have been omitted from thi s system breakdown thi s
is because it is assumed that the energy loss th rough the purification system is negli gible and
the energy consumption of all other auxiliary equ ipment is insignifi cant compared to that of
the compressor motors It may be th at in certa in plants the auxiliary equipment may not be
insignifi cant at all in these situati ons the energy manager is urged to deri ve models fo r these
subsystems as we ll
Whole CRYOGENIC AIR SEPARATION PLANT
Industry
EndmiddotUser Trains 1 to n
Groups
Processes Air Compression
Air Separation Process Product Compression
System Systelll
Machinery Air
Motor Air purifi cation Main Heat Distillation Product
Motor Compressor system Exchanger Columns Compressor
Figure 4 5 Simplified system breakdown structure of the cryogenic air separati on plant
Electrical Electronic and Computer Engineering 42
Chapter 4 Organizing and Planning
From figure 45 the following is clear
n
P =p (1)plant ~ train m
m=
where
bull n is the number of trains
bull Pplant is the power consumption of the cryogenic air separation plant (MW)
bull Ptrain m is the power consumption of train m (MW)
Neglecting power consumption of auxiliary machinery the power consumption for each endshy
user group will be as stated in equation (2)
P =P +P (2)train m ACm PCm
where
bull PACm is the input power of air compressor motor of train m (MW)
bull PPCm is the input power of product compressor motor from train m (MW)
The input power for a compressor motor is
pslUlft
P xm (3)xm
where
bull x refers to the motor of a compressor type x ie the motor driving the air or
product compressor
bull m is the train number
bull Pxm is the input power of type x compressor motor of train m (MW)
Electrical Electronic and Computer Engineering 43
Chapter 4 Organizing and Planning
bull p~ft is the shaft power (output power) of type x compressor motor of train m
(MW)
bull lm is the electromechanical efficiency of type x compressor motor of train m
It is a fact that when a gas is compressed its temperature rises significantly and if this increase
in temperature is too much it would cause the oil to ignite and deteriorate mechanical parts
This places a restriction on the compression ratio (ratio of absolute outlet pressure to absolute
inlet pressure) of the compressor and hence this ratio is rarely greater than three (Air Liquide
[5])
Because of this constraint multi-stage compression with inter-cooling is implemented to
achieve the required output pressure Inter-cooling is normally realized through either air- or
water-cooling however air-cooling is normally limited to smaller size compressors Watershy
cooling is the more effective of the two because of its ease of control and greater heat
absorption capability (Talbott [25])
Another reason for employing multi-staging in compressors is because of its energy saving
attribute the energy saving is achieved because cooling the air down between stages reduces
the inlet air volume of the next compression stage and hence the work required to complete the
compression (Salisbury [26] and Talbott [25])
The operation of the multi-stage compressor can be followed by referring to the pressureshy
volume diagram in figure 46 The area enclosed by 1-2-3-4 represents the adiabatic work to
be done by the compressor to compress a gas from a pressure of PI to P2 The area demarcated
by 1-2-5-4 represents the necessary work for isothermal compression
Electrical Electronic and Computer Engineering 44
Chapter 4 Organizing and Planning
Isothermal Adiabatic compression compression
p
~__________~~__+-______~~~2
v
Figure 46 Multi-stage compression cycle with interstage cooling (Coulson et al [27])
Because the gas inlet temperature at each stage stays constant one can see that actual
compression takes place near the isothermal curve Thus a simplifying assumption would be
to approximate the compressor characteristic by assuming isothermal compression
Thus the shaft power required by the compressor will be as expressed by equation (4)
(4)
where
bull P =output power of type x compressor of train m (MW)
bull 1] =isothermal efficiency of type x compressor of train m xm
Electrical Electronic and Computer Engineering 45
Chapter 4 Organizing and Planning
The output power of the compressor is a function of the intercooler temperature the air flow
and the pressure ratio and for isothermal compression this relationship is expressed as in
equation (5) (refer to Baumeister et al [28] amp Salisbury [26])
out pout = kxQ xl xln Pm (5)xm xm Ie In( Pxm
where
bull Qxm is the gas flow from compressor of type x of train m (kNm3h)
bull 0c is the intercooler temperature (K)
bull P~~ is the gas absolute output pressure of type x compressor of train m (kPa)
bull Pm is the absolute inlet pressure of type x compressor of train m (kP a)
In cryogenic air separation air is separated into its constituents and only by knowing the
constituent ratio of the main air product in a sample of air it is possible to determine the
airflow at the input of the train
QACm = (6a) rmain product
where
bull QACm is the air flow from air compressor of train m (kNm3h)
bull Qure is the total flow of (pure) main air product that originally entered the air
compressor of train m (kNm3h)
bull rmain product is the constituent ratio of the air product in a sample of air For oxygen
this ratio is 209 and for nitrogen this is 780 refer to table 21
Electrical Electronic and Computer Engineering 46
Chapter 4 Organizing and Planning
If there exists an air common header connecting all the trains the main output product may not
necessarily be a result of solely the airflow at that particular trains input since air exchange
between trains does occur and even more so in the case of an air compressor being out of
operation A good approximation would be to average out the total airflow over all the trains
In this case equation (6a) takes on the form of equation (6b)
(
= 1 ~QPureQ (6b)
ACm t- m nrmain product Jm=
The main product is rarely 100 pure there is to some acceptable extent impurities present
in the substance as well Secondly this product is produced with some amount of loss within
the air separation process this loss is quantified in terms the recovery efficiency Thus to
obtain the total flow of the pure product that originally entered at the air compressor side
Purity QPure =Q x main productm (7)
m PCm TJ recm
where
bull Qpcm is the flow rate of the main product from product compressor of train m
bull Puritymain productm is the purity of the primary output product of train m
bull TJrecm is the recovery efficiency of which the air separation process recovers the
primary constituent of air that originally entered the process
It is now possible to compute the air flow however the air discharge pressure is still needed
for computation of the compressor power consumption There is a definite relationship
between the air discharge pressure and air flow and this relationship is defined by the system
characteristic The system needs a specific discharge pressure at a certain flow rate from the
Electrical Electronic and Computer Engineering 47
Chapter 4 Organizing and Planning
air compressor and the relationship between these two parameters in the normal operating
region of the compressor may be approximated quite accurately by a linear model as shown
in figure 47
Thus discharge pressure as a function of air flow will be as shown in equation (8)
out h Q (8)PACm = m +gm ACm
where hm and gm are the constants for train m and may be determined by means of linear
regression
Compressor Surge line characteristic at
different modes of operation
System curve
Linear approximation
Flow
Figure 47 Linear approximation of system curve
Electrical Electronic and Computer Engineering 48
Chapter 4 Organizing and Planning
Although cryogenic air separation trains may have been designed in exactly the same manner
it is a fact that over time they drift in their parameter commonalities and by applying modeling
parameters in one train to other trains as well would ultimately result in high inaccuracy of the
overall plant model Thus certain parameters of the model should be done empirically train by
train Empirical modeling should be sufficient only for all the critical elements of each train
which include
bull electromechanical efficiency of each compressor motor
bull isothermal efficiency of the air and product compressor
bull recovery efficiency of the air separation process
Determination of the electromechanical efficiencies should be enabled through employment of
the correct maintenance strategy as will be discussed in the next chapter If there is no initial
data available concerning the current state of the motor an assumption should be made at first
The recovery lrecm is a symptom of the current state the ASU thus essentially modeling this
system it is determined by taking the average over a sufficient sample period
The isothermal efficiency of the compressor is a function of the gas flow pressure and
intercooler temperature The pressure range in which these compressors are suppose to operate
in is usually relatively small and the empiric modeling of the isothermal efficiency may be
approximated quite accurately by a linear model
out
n - xQ +b x Pxm + xT +d (9)IIxm - axm Xnl xtm -- cxm Ie xm Pinx
where a bull b bull e bull and d bull are constants of compressor type x of train m and arex m x m x m x m
determined by means of linear regression Multiple variable linear regression techniques like
Electrical Electronic and Computer Engineering 49
Chapter 4 Organizing and Planning
for example that described by Makridakis et al [29] should be utilized in determining the
constants If there is no empirical data available for the compressor motors as yet the motor
efficiency and the isothermal efficiency of the compressor may be lumped together (ie
making it one system) and this overall efficiency is then empirically modeled as in equation
(9) this means that the model then (equation 9) encapsulates the compressor efficiency as well
as the motor efficiency
Substitution of these equations leads to the final energy conversion model stated in equation
(10) For a discussion on the application and verification of the abovementioned energy
conversion model the reader is encouraged to refer to the case study presented in the
appendix
h + gm xPUritymainproducmJj[tQ xuritYmain proliuctm Jx~ xln__k_(~Q _m nrmain product =1 PCm Teem
nrmain producl ~ mel ~
reem K
[ m
PACrn
______________~--__-shy__~__________--~--------~) (10)
pp1an t m=J
ACm x [aAcm xQACm +bACm XP~~m + CACm X~C +dAcmJ PinIIC
kxQPCm X~C Xln[ P~m J + PK~
PCm x (apcm x QpCm +bpcm X pPm +CKm X~C +dpcmJ tnPC
443 Energy systems maintenance
There is a definite relationship between maintenance management and energy management
and in most cases one would find that by initiating an action in one would have a definite
effect on the other In fact Turner [16] has gone one step further and expressed the need for
energy systems maintenance Energy systems maintenance is defined as the maintenance of all
systems that use or affect the use of energy
Formulation of an energy systems maintenance life-plan as well as the management thereof is
the responsibility of the energy manager and later on it will be explained on how to assemble
such a plan The output of this maintenance effort is a recommendation and it is up to the
Electrical Electronic and Computer Engineering 50
Chapter 4 Organizing and Planning
energy manager to assist maintenance managers in adopting an energy systems maintenance
component into their life pans which would enable them to consider such a recommendation
In formulating an energy systems maintenance strategy the energy manager first has to
consider and understand at which point it is appropriate to initiate a suitable maintenance
action on relevant equipment To aid explanation to this question refer to figure 48 from an
energy management point of view this system experiences a functional failure A functional
failure is defined by Campbell [30] as the inability of a physical asset to deliver its expected
level of performance In terms of energy management this expected level of performance is
given in the form of an energy norm or standard The expected level of performance thus
defines what can be considered a failure
Engineering standard 1-----------__ ----------------------shy
Flaw in compressed air pipe
Leakage of compressed air
Energy management standard
General maintenance standard Minor leakage
Production standard Major leakage
Time
Figure 48 Functional failures and performance standards
Different departments within the plant (engineering maintenance production) may differ in
asset performance requirements and thus giving rise to the different standards In this example
the flaw in the compressed air pipe causes a leakage of compressed air leading to a decrease in
energy efficiency and money could be saved by initiating a maintenance action sooner than as
scheduled by maintenance department
Electrical Electronic and Computer Engineering 51
Chapter 4 Organizing and Planning
The energy norm or standard thus defines the not only what should be considered a failure but
also the amount of maintenance needed to preserve this level of performance
The difference in standards frequently creates conflict between various departments and when
initiating an energy cost saving maintenance action the energy manager should first reach a
compromise with the different departments For example the electrical maintenance
department of one plant reported high maintenance costs on the oxygen compressor motors
Maintenance department reported that the motors were at the end of their life-cycle and
blamed the more frequent maintenance intervals as the main cause of the rising cost An
energy audit also revealed that the motors lost an average of 9 electromechanical efficiency
from their initial value which gave rise to increased energy cost as well
Considering these two factors an oxygen replacement project was proposed with immediate
commencement Production department however rejected the proposal because the plant
which already operated at full capacity would suffer significant production losses during the
replacement action and proposed that the project should be postponed to a year from then
when an extra oxygen train currently being constructed at that time is in full operation to
which the parties agreed upon and thus effectively reaching a compromise
4431 Establishing an energy systems maintenance life plan
Because plant maintenance has such a significant effect on energy efficiency the energy
manager has to establish an energy systems maintenance life plan aimed at managing
electricity cost that would supplement existing maintenance efforts on the plant
Energy systems maintenance on only those systems that normally have a major impact on the
energy consumption of the train will now be discussed they are the air and product
compressors the air and product compressor motors and the ASU
Electrical Electronic and Computer Engineering 52
Chapter 4 Organizing and Planning
4432 Energy systems maintenance on compressors
Some of the major aspects influencing the energy efficiency of a compressor are the following
(Talbott [25])
bull Wear of mechanical parts
bull Component fouling
bull Contamination with impure substances
bull Inadequate or dirty lubricants
Wear of mechanical parts changes the characteristics of the compressor and ultimately leads to
decreased efficiency Mechanical wear also result from destructive effects dirt particles have
and it is crucial that filtration be kept effective and all inlet piping be kept clean
Fouling changes the flow and pressure relationship of the compressor and thus changing the
characteristic of the original design Even if a good filter is provided fouling is inevitable and
an obvious effect is the restriction of intercooler passages this not only causes poor heat
transfer between the coolant and gas but also leads to an increased pressure drop over the
intercooler resulting in reduced performance (lower efficiency)
Lubricated compressors depend upon oil for both friction reduction and sealing It is obvious
then that if the oil has to be contaminated or corrosive it would be destructive of both
efficiency and valuable capital equipment
4433 Energy systems maintenance on motors
The aim of energy systems maintenance on motors is to improve and preserve the motors
energy efficiency
The great majority of induction motors are used to drive pumps fans blowers and
Electrical Electronic and Computer Engineering 53
Chapter 4 Organizing and Planning
compressors attempting to increase the efficiency of these motors may well result in reduced
motor internal losses but this doesnt necessarily mean reduced input power unlike the case
for synchronous motors as also motivated by Htsui et al [31] Induction motors with a higher
efficiency normally run at a higher speed (lower slip) which ultimately leads to increased
compressor load (also refer to Sen [32]) Figure 49 shows a graphical representation of this
situation
bull The fan laws
Suppose that the existing motor (motor 1) is substituted by a new motor (motor 2) of higher
efficiency which inherently has a smaller full load slip motor 1 operated at operating point 1
(OP 1) and motor 2 now has another operating point (OP 2) The power curve of the new
motor intersects the system curve (compressor load) at a higher load speed resulting in the
compressor requiring more shaft power
Pz +---------------------~r-------~~~~-------------
sbaftspeed
Figure 49 Partial power curves of the existing motor (motor 1) and the new motor (motor 2)
as well as that of the compressor load illustrating the implication of installing a higher
efficiency motor than is currently in operation
Electrical Electronic and Computer Engineering 54
Chapter 4 Organizing and Planning
The reason for the load increasing with increased shaft speed is because of the compressor
conforming to the relationships expressed by the fan laws The following relationships are a
statement of the fan laws and are listed by Brown [33] The fan laws also apply to blowers
fans and pumps and the theory developed here may also be applied to induction motors driving
either one of these mechanical devices
Qan (11)
(12)
(13)
where
bull n is the shaft rotational speed (rpm)
bull Q is the gas flow (kNm3h)
bull P is the discharge pressure of the gas (kPa)
bull P is the power requirement of the compressor (MW)
Thus the gas flow is proportional to the shaft speed the discharge pressure is proportional to
the square of the shaft speed and lastly the compressor power requirement is proportional to
the cube of the shaft speed Equating the above relationships gives the following as stated by
Salisbury [26] and Baumeister et al [28]
(14)Q ~ Q(~J
p ~ p(~J (15)
(16)p~p(~J
Electrical Electronic and Computer Engineering 55
Chapter 4 Organizing and Planning
Were the 1 and 2 subscripts refer to the initial and new conditions respectively Thus by
knowing the compressor performance at one speed one may predict its performance at another
speed
Figure 410 shows a typical compressor characteristic curve as well as the characteristic at
other speeds other than the nominal
Surge line
Compressor characteristic at various speeds
Flow
Figure 410 Compressor characteristic curve at various shaft speeds
bull Energy efficiency analysis
At this stage it becomes quite obvious that there are two contradicting factors presenting
themselves if a higher efficiency motor is installed the motor internal losses have been
reduced but at the same time the motor is most likely to run at a lower slip leading to
increased shaft power demand
Electrical Electronic and Computer Engineering 56
Chapter 4 Organizing and Planning
Thus it becomes clear that an action aimed at reducing electricity cost by improving the motor
efficiency may not be as simple and the energy manager or person in charge should have a
means for quantifying the actual feasibility such an action would have
Installing a new motor for the aim of reducing electricity cost should only become an option
when at least the following statement is true
(17)
were Fnl and Fnz are the input power to motor 1 (current motor) and motor 2 (new motor)
respectively After substitution equation (17) becomes
ut 2 lt utI (18) 17mZx17D2 17m l x 17D1
where
bull utl and u12 are respectively the output power of the current and the new motor
at normal operating conditions
bull 17m and 17m2 are respectively the electromechanical efficiency of each motor
bull 17D1 and 17D2 are respectively the efficiency of the device (compressor blower fan
etc) at the operating point of motor 1 and that of motor 2
What is now needed is an indicator which would inform the energy manager on whether a
new high efficiency motor would consume less power than the existing one This indicator is
defined here as the threshold efficiency which is the efficiency the new motor should at least
have to be the more feasible option The inequality expressed in (18) can be rearranged to give
the following
17m2 gt 17ml (UI2 Jx( 17D1 J (19)ull 17D2
Electrical Electronic and Computer Engineering 57
Chapter 4 Organizing and Planning
The fan law implies that in changing the shaft speed of the compressor its efficiency stays
constant Le 17D2 = 1701 and by inserting equation (16) in (19) equation (20) is obtained
(20)
The operating speed of each motor is where the compressor load curve intersects each motors
power curve thus and may only be determined by actually plotting the motor curves nl n2
with that of the compressor load For the energy engineer to make a clear decision on whether
to upgrade motor efficiency it becomes clear that there should be a maintenance strategy in
place that result in the assessment of the motors current condition And as stated earlier this
assessment is made in terms of the motor efficiency as well as the power or toque curve of the
motor This assessment is the responsibility of the rewinder or the person responsible for the
refurbishment of the motor
The operating speed of the new proposed motor can be expressed in terms of its full load
speed and other known variables For low slip values the power curve may be approximated
by a linear relationship as shown in figure 411 which leads to equation (21)
(21)
where
bull subscript 2 refers to the new proposed motor
bull P2 is the output power (MW)
bull PFL2 is the rated full load shaft power (MW)
bull ns is the synchronous speed (rpm)
bull nFL2 is the rated full load speed (rpm)
Electrical Electronic and Computer Engineering 58
Chapter 4 Organizing and Planning
Motor power System Linear curve curve approximation
shaft speed
Fu1110ad
speed (nr)
Operating speed
(n)
Synchronous speed (ns)
Figure 411 Approximating the power curve with a linear model at low slip values
Applying the fan law by substituting equation (16) into (21) and rearranging to solve for n2
gives the following
(22)
This is a cubic equation and can be solved by applying Cardans solution [34] From Cardans
solution the equation has one real root and gives the approximate load speed the proposed new
motor will operate at
Electrical Electronic and Computer Engineering 59
Chapter 4 Organizing and Planning
Substituting (23) into inequality (20) gives the requirement in terms of its full load speed and
efficiency the new motor should conform to for it to be a more energy efficient option
bull Case study
Suppose the existing motor of figure 49 is considered for replacement This is a four-pole
137MW machine it is fifteen years old and have been rewound three times during its
productive life The decision to do a feasibility study comes after assessment of its current
condition which is detailed in table 46
Table 46 Current motor parameter values
Substituting these parameter values into (24) results in the graph depicted in figure 412 This
curve is basically a motor selection curve for selecting a new 4 pole 137 MW induction motor
as it houses the criteria for the proposed new compressor motor being more energy efficient
than the existing one Now suppose there are three suppliers of these motors as detailed in
table 47
Table 47 Three suppliers of a 4-pole 137MW induction motor with their respective ratings
I I
I Supplier Motor efficiency Motor rated full load speed 1 970 1492
I 2 960 1490 I 3 975 1496 I
Electrical Electronic and Computer Engineering 60
Chapter 4 Organizing and Planning
980 ltI~--~-------~---------lt-~------------------------------- Supplier Cbull975
Supplier A bull 970
tI 965 CI
~ 960 shy bullSupplier B Threshold line CI 955 -shy
CI ~ 95()-=a 945 ~
940
935
930 +-----------------------------------------1
14880 14900 14920 14940 14960 14980 15000
Full load speed (rpm)
Figure 412 Threshold efficiency proposed new motor should adhere to as a function of its
full load speed
As can be seen from the graph all three motors will in each case improve the energy
efficiency of the current compression system for they have ratings that enable them to be
above the threshold line
Now that we know that energy efficiency will be improved regardless of what motor is
selected the next step would be to quantify the energy saving in each case and obviously the
motor with the largest energy saving would ultimately be the most feasible option from an
energy managers point of view
Pinl and Pin2 have been defined in (8) and taking the ratio of these gives
or
Electrical Electronic and Computer Engineering 61
Chapter 4 Organizing and Planning
(25)
thus
(26)Power saving = pbullbull - P2 p+ - [ ~ )( J1 Substituting n2 of equation (23) into (26) gives the approximate power saving in terms of the
known quantities
Power saving =
Jj (27)
The results of each options power saving are listed in table 48
Table 48 Power saving for the different motors from the three suppliers
I Supplier Power saving I A 410kW
I B 260kW
I C 370kW
The motor from supplier A will be the most feasible option in terms of energy efficiency
although it doesnt have the highest efficiency
A condition-based maintenance strategy for the induction motors should be employed in
which the condition of the current motor is assessed either on an appropriate time base or
Electrical Electronic and Computer Engineering 62
Chapter 4 Organizing and Planning
when an opportunity arises to permit this The end-result of the motor assessment is the
threshold line which will be used as a reference for comparing the feasibilities of different
energy efficiency improvement alternatives
It is recommended that condition-based maintenance of this type only be done on the larger
motors where significant power savings are attainable which could justify the effort time and
cost involved in realizing this maintenance effort
bull An energy management tool for induction motor renewalreplacement
If an induction motor fails or experiences a functional failure is it better to refurbish it or
replace it with a high efficiency motor In most of the immediate circumstances
refurbishment is the more feasible option driven by the fact that it is approximately one fifth
the cost of buying a new motor On the other hand refurbishment in most cases refers to
rewinding and motors that have been rewound tend to be less efficient as also expressed by
Campbell [35]
By utilizing the maintenance strategy as presented in the foregoing section the energy
manager is in a position to make a fairly good decision between replacement and renewal
Suppose that the previously referred to 137 MW induction motors condition has been
assessed after each rewind and the threshold line after each assessment have been determined
as shown in figure 413
From the graph it can be seen that the threshold line changed with time and after each
assessment replacement seems to become a more and more attractive option
Electrical Electronic and Computer Engineering 63
96000
Chapter 4 Organizing and Planning
990
Supplier C InlYampI 98000
Supplier A shy lSI rewind Col 970
-bull shy-= ~ 2 rewind
Col Supp rB
IS lie bull~ -950 3rd rewindC -IS Q 940 --= -930==~
920
910
1486 1488 1490 1492 1494 1496 1498 1500
Fllll load speed (rpm)
Figure 413 Threshold lines of motor after every rewind
In conclusion the energy manager may recommend rewinding if the threshold line is near (just
above or below) that of the full load specifications of available motors and should recommend
replacement when the latter is sufficiently above the threshold line Lastly justifying motor
replacement will be a function of reduced energy costs as well as the projected maintenance
cost reduction
4434 Energy systems maintenance on distillation colnmns
The distillation column is made up out of distillation trays The basic function of these trays is
to enable contact of the descending liquid and the rising gas under the most favorable
conditions The mere presence of the trays provides the rising gas with a certain resistance
resulting in a pressure drop This pressure drop must be as small as possible for it has a
significant impact on the energy efficiency of the train Needless to say distillation trays have
a major impact on the energy consumption of the train as also pointed out by Biddulph [8]
Various technologies have been developed for reducing this pressure drop to the minimum of
Electrical Electronic and Computer Engineering 64
Chapter 4 Organizing and Planning
which distillation packing is the more recent and compared to the conventional sieve trays
are the more efficient as well (refer to chapter 2)
Deterioration of distillation trays are inevitable and possible damage may cause a decrease in
main product recovery efficiency and sometimes also increased pressure drop which
ultimately results in the train being less energy efficient
Maintenance on distillation trays are sometimes limited because of the large production losses
the plant would suffer during replacement but it is up to the energy manager to assess the loss
in energy expenditure and do feasibility studies on the relevant alternatives that would enable
upgrading of the columns energy efficiency
4435 Energy systems maintenance life plan
Table 49 shows an energy systems maintenance life plan based on the foregoing information
The condition of each major system is assessed in the control phase of the energy management
program and based on this assessment the energy manager is able to inform andor make
informed recommendations to the relevant maintenance department in case of the occurrence
of deviations
Electrical Electronic and Computer Engineering 65
Chapter 4 Organizing and Planning
Table 49 Energy systems life plan for the critical systems on the cryogenic air separation
plant
Compressor Motors
CBM off opportunity
based Contractor
(most likely)
motor
of motor condition
Compressor CBM on monthly Energy
manager
Inform relevant maintenance
dept on deviation and impact it has
Corrective action will be
enabled by relevant
maintenance dept
Distillation columns
CBM on monthly Energy
manager
Inform relevant maintenance
dept on deviation and impact it has
Corrective action will be
enabled by relevant
maintenance dept
444 The energy management plan
The energy management plan basically consists out of the long-range plan and the building
blocks that make up this plan which are the following
bull Primary objective
bull Specific objectives
bull Short term plan
bull Decisions surrounding project prioritization
bull Short term tactics
Electrical Electronic and Computer Engineering 66
Chapter 4 Organizing and Planning
Primary objectives are stated in the energy policy Long-range plans are the means for
achieving these objectives Thus long-range plans are the stepping-stones towards fulfilling
the vision posed by the energy policy A primary objective on its turn is a composition of
specific objectives and in achieving these objectives energy projects need to identified and
implemented Potential energy projects were already identified in the audit process and these
projects now need to be allocated to the relevant specific objectives and also prioritized
Normally mUltiple projects are required in fulfillment of a specific objective and
consequently there may be numerous projects listed under the short-term plan The energy
manager needs to assign priority to each project in order to ensure that the planned sequence
of events are structured in an optimally efficient manner
The short-term plan entails the decision-making with regard to which projects to implement
when for the next financial year The end result of the long-term plan ultimately depends on
the implementation of the short-term plans The short-term plan requires short-term tactics in
order to realize These short-term tactics are the actions and their timing that is needed to carry
out the short term plan
As an illustrative example consider the division-wide energy policy of Sasol presented in
section 43 [21]
bull Primary objective of the division-wide energy policy ofSa sol
To manage the SasollElectricity Supply Industry interface so as to minimize the total
cost of energy for the Sasol group of companies Further to this to promote energy
efficiency and reward energy management success by decentralizing accountability for
electricity costs and by aligning internal electricity tariff structures with the Eskom
marginal rate [21]
The underlined phrase is a primary objective of the energy policy and in order to realize the
decentralization of electricity cost accountability a few specific objectives first need to be
realized one such objective is stated in the list of specific objectives in the energy policy
Electrical Electronic and Computer Engineering 67
Chapter 4 Organizing and Planning
bull A specific objective ofthe energy policy
Develop and maintain the electricity measurement system within the group of
companies
A specific objective is realized through the implementation of a short term plan or
combination of short-term plans and for above mentioned specific objective a short term plan
is given in the next paragraph
bull Short term plan
o Upgrade existing measurement system on those plants that already have this
system in place
o Install measurement system on all energy intensive plants
o Establish a maintenance strategy for measurement system
o Make data freely accessible and
Actions and their timing are the tactics needed to carry out the short term plan and for the
underlined short term plan the short term tactics are as stated in the following paragraph
bull Short term tactics
o Finalize decisions surrounding data logger selection January 2000
o Order PTs and CTs for the measurement system - January 2000
o Install network connection in substations March 2000
o Install and commission data logger - May 2000
445 Measurement and control indicators
Now that there is an energy management program in place the energy manager has to decide
on how the progress and results of this program will be assessed Key performance indicators
have to be defined and energy standards need to be determined In the control function of this
Electrical Electronic and Computer Engineering 68
Chapter 4 Organizing and Planning
model the energy engineer will assess these KPIs and decide upon appropriate corrective
actions
There is one KPI that encapsulates the outcome of the whole energy management effort and
that is the energy cost per primary product output (RlkNm3) This is an important KPI as it is a
global indicator and by trending it over time the energy engineer is in a position to quantify
the impact of his energy management program however this doesnt mean that it is the only
one that should be monitored there need to be other indicators defined as well lower level
indicators that are more specific and are able to identify critical component inefficiencies
Critical system components are defined here as only that system components that have a major
impact on the energy consumption of the plant These system components include the
compressors the compressor motors and the air separation unit
The lower level KPIs should 1) indicate whether there has been a drift in system
characteristics and also 2) whether the system operated above or below expectation during the
past month It should be noted that only the means for determining the KPIs are presented
here and they will only be applied in the control function the energy manager has to fulfill as
detailed later on
Thus the following parameters are the important ones and need to be monitored
bull Electromechanical efficiency of the air and product compressor motors
bull Isothermal efficiency of each compressor
bull Recovery efficiency of each train
bull Specific energy of the plant (kWlkNm3 of main product)
With these parameters as the basis a key performance indicator will now be derived for each
Electrical Electronic and Computer Engineering 69
Chapter 4 Organizing and Planning
4451 KPI for determining the state of the compressor motor
The compressor motor efficiency has a significant influence on the overall efficiency of the
train therefore a key process indicator need to be defined for the compressor motors and this
KPI should comment on the degradation in motor electromechanical efficiency
Obviously it wouldnt make sense assessing this KPI each month and should therefore only
be assessed after each time the current condition of the motor has been evaluated
c llACmKPI (28)ACmaor = -i-
llACrn
where
bull m is the train number
bull ll~crn is the design efficiency of the motor ie the efficiency at the time when it
was initially installed
bull ll~crn is the current efficiency of the air compressor motor
The KPI of the product compressor motor takes on a similar form
(29)
where
bull KPlpcmotorrefers to the extent of deterioration within the air compressor motor
bull TJ~Cm is the design efficiency of the motor of train m ie the efficiency at the time
when it was originally installed
bull TJCrn is the current efficiency of the product compressor motor of train m
Electrical Electronic and Computer Engineering 70
Chapter 4 Organizing and Planning
4452 KPI for determining the state of the air and product compressor
(30)
where
bull KPlxm is an indicator that refers to how well compressor type x of train m
performed
bull TJheoretical is the theoretical isothermal efficiency of compressor type x of train m X In
bull TJcfual is the actual isothermal efficiency of compressor type x of train m ltm
Equation (30) then takes on the form of equation (31)
out J103x 10-4 xQ xT xln Pxmxm IC In( Pxbullm
~ctual xTJxm KPlxm out (31)
xQ +b x Pxm + xT +dax m x m x m -- ex m IC x m pin xm
where ~ctual is the actual measured MW power consumption at that specific flow and pressure
Again if the motor efficiency has not been determined yet it should be lumped with the
isothermal efficiency of the relevant compressor in this case equation (4) should be modified
by simply removing the electromechanical efficiency (TJxbullm ) of the motor
4453 KPI for determining the state of the air separation unit
actual
KPI = TJrecm (32)ASU m TJemperical
recm
where
Electrical Electronic and Computer Engineering 71
Chapter 4 Organizing and Planning
bull KPI is the indicator for how well the ASU operated during the sample time ASu bull m
bull 1Jemperical is the empirical recovery efficiency that has been determined for the ASU rectm
of train m
bull 1J~~1 is the actual recovery efficiency of the ASU of train m
4454 KPI for determining the overall efficiency of the plant
Except for the global energy cost KPI there should also be a KPI that measures the overall
energy efficiency of the plant This indicator should assist the energy manager in determining
the following
bull If there were any deviations in any system component of any train and also
quantify the impact of this on the overall efficiency of the plant
bull The impact of abnormal plant operation for example due to routine maintenance
on some trains or unexpected breakdown on the overall plant energy efficiency
bull Whether the plant operated above or below expectation
I ~heoretlCalm 1 [
m=l (33)
where
bull KPleff is the in indicator that measures the total plant energy efficiency (kWhlNm3
ofmain product)
bull Poctualm is the total power consumption of train m (MW)
bull Qm is the total main product flow at the output of train m (kNm3h)
Electrical Electronic and Computer Engineering 72
Chapter 4 Organizing and Planning
This indicator provides the energy manager with a summary with reference to the state of
energy efficiency of the whole plant Caution should be taken that this is an overall indicator
and may not be as sensitive to an inefficiency in a specific system component within a train
and by only looking at this indicator may give the energy manager a false idea of the actual
state of the plant Thus this indicator should be viewed in conjunction with the lower level
indicators
45 CONCLUSION
In this chapter energy management organizing and planning was discussed Through
organizing the energy management program is given definition and structure It mainly
involves identification and classification of required activities and the grouping of these
activities in a structured and meaningful way
Planning involves the setting up the energy policy and installing the energy policy strategy
The energy policy strategy has five components human resource deployment current
situation evaluation energy systems maintenance the energy management plan as well as
establishment of measurement and control indicators
Human resource deployment involves appointing a dedicated person charged with driving the
energy management program as well as giving this person access to other human resources
like administrative technical etc
Current situation evaluation is a critical step in the energy management program and the
outcome of the program to a large extent depends on how well and thorough the energy audit
was done
Plant maintenance has a definite and significant impact on energy efficiency and in this
chapter the need for an energy systems maintenance life plan was expressed This life plan is
Electrical Electronic and Computer Engineering 73
Chapter 4 Organizing and Planning
effectively the energy managers contribution to the overall maintenance effort on the plant
and aims to improve energy efficiency
The energy management plan is a structured and well-formulated set of plans and tactics that
should be followed in order to ultimately achieve the primary objectives as stipulated in the
energy policy It involves long-term and short-term planning as well as setting up tactics for
the means of achieving the short-term objectives
Key performance indicators (KPIs) were defined for the means of quantifying plant
performance in terms in energy efficiency and these find their application in the managerial
function of controlling which will be discussed in chapter 5
Electrical Electronic and Computer Engineering 74
Chapter 5 Leading and Controlling
CHAPTERS LEADING AND CONTROLLING
51 LEADING
The main purpose of leading is to harmonize individual and organizational objectives People
do not work in isolation rather they work in groups toward the achievement of personal and
enterprise objectives these objectives are not always in harmony and in fulfilling the function
of leading the manager aims to align objectives of the individual with that of the enterprise
Koontz et al [14] defines the managerial function of leading as the process of influencing
people so that they will strive willingly and enthusiastically toward the achievement of
organizational goals In order for people to willingly strive for such a goal they would need
some form of motivation to do so There exists various means for stimulating motivation in
people (refer to Fukuda [36] and Jordaan et al [37]) and one way of doing so is through
awareness
This awareness is encouraged by doing the following
bull Disclosing energy KPIs and also explaining possible abnormal deviations to
employees
bull The impact certain practices of relevant departments within the plants organization
have on the plants energy efficiency and ultimately energy cost For example this
may include energy inefficient maintenance strategies faulty equipment or even
inefficient production schedules
Turner [16] also lists the following relevant strategies for improved awareness
bull Providing relevant employees with energy management best practices which are
practical and relevant to their working environment within the plants organization
bull Providing energy conservation opportunity checklists to plant operators
maintenance personnel supervisors and engineers
Electrical Electronic and Computer Engineering 75
Chapter 5 Leading and Controlling
Another motivational tool is recognition The energy manager should recognize the energy
management efforts of employees and also show them the impact their efforts had during the
past month
Lastly Turner [16] also states that competition may lead to improved performance Fostering
reasonable competition between relevant departments in the plants organization may inspire
employees to work harder in achieving their goals
52 CONTROLING
Controlling is the measurement and correction of performance in order to ensure that
objectives and the plans devised in attaining them are being accomplished Koontz [14]
defines three basic steps for control 1) establishing standards 2) measuring performance
against these standards and 3) correcting undesired deviations from standards and plans
These steps will now each be defined from an energy management perspective
53 ESTABLISHING ENERGY STANDARDSINORMS
Previously energy management key process indicators were defined for the cryogenic air
separation plant those indicators are now utilized in the control function The standard for
each KPI is the theoretical quantity of the measured parameter ie the denominator of each
KPI as defined in equations (31) (32) and (33) of chapter 4 is the theoretical system
performance and also the standard to which actual system performance is compared KPIs for
the compressor motors are the exception (equations (28) and (29) of chapter 4) in that the
denominator in each is based on the original electromechanical efficiency specification
54 PERFORMANCE MEASUREMENT
The KPIs should be trended over time and significant deviations from expected performance
must be noted This must be done on a monthly basis except for the motor deterioration
indicators which may be assessed according that as stipulated by the maintenance strategy
Electrical Electronic and Computer Engineering 76
Chapter 5 Leading and Controlling
To illustrate performance measurement with a practical example consider the month-end
evaluation of one train of the seven-train oxygen plant at Sasol Secunda This specific train
boasts the characteristics listed in table 51
Table 51 Characteristic parameters of a train used in its performance measurements
Parameter Value KPI equation (Ch 4) 1 Motors
11 Air compressor motor 28 i
1]ACm 982
1]~cm 930
12 Product compressor motor 29 i
1]PCm 971
1]cm 910
2 Compressors 21 Air compressor 31
a 00009366 b -00574043 c 00021501 d 07272151
22 OXYfen compressor 31 a 00044099 b 00090275 c 00030923 d -09017176
3 ASU 32 1]emperical
recm 9541
What follows will be performance measurement by means of KPI trending after which
analysis of each will continue in the next section
Results for the trains global efficiency indicator is shown in figure 51
Electrical Electronic and Computer Engineering 77
Chapter 5 Leading and Controlling
11 ~---------------------------------------------------~-----~
105
095
Trendline
09
085 +--------------------------r---------r--------~----___------__--
OJ-May OS-May 09-May 13-May 17-May 21-May 25-May 29-May
Time
Figure 51 KPI trend for the global efficiency indicator
As implied earlier the KPIs characterizing each motors state are not trended over time
instead its given as a single value and are listed in table 52
Table 52 KPI values for the air and oxygen compressor motors
Compressor motor type KPlvaJue Air 0949 Oxygen 0937
Figure 52 shows KPI trending for the air compressor
Electrical Electronic and Computer Engineering 78
Chapter 5 Leading and Controlling
12
115
11 Trendline
1-1 ~ ~
09 +----L--r-------------------T----T~---__-----
105
1
01-May OS-May 09-May 13-May 17-May 2L-May 25-May 29-May
Time
Figure 52 KPI trending for the air compressor
The KPI trend for the oxygen compressor is shown in figure 53
l~ ----------------------------------- -------------
105 -t----------------------~----~--r--------~-----1
l~T--middot-----middot-~middotmiddotmiddot----middotmiddotmiddotmiddot-------middot--middotmiddotmiddot-middot-------~~-middotmiddotmiddot---middotmiddotmiddotmiddotmiddotmiddot---middotmiddot---1
103 i---middotmiddot-middotmiddotmiddot---middotmiddotmiddotmiddotmiddotmiddotmiddotmiddotmiddotmiddot---middotmiddot-middotmiddot--middotmiddotmiddotmiddotmiddot-middotmiddot----middotmiddotmiddotUrrt---middotmiddotmiddotmiddotmiddot-~-~-shy-+shy
Im~middotmiddot-middotmiddotmiddot~-~middotshy --~middotrftmiddotmiddot-~middot-middotmiddotmiddotmiddot----1rHll~r-middotH-middot-middotm~rlHj~~rJ~--middot---~jtr~~middot-shy
~ 101 hHHt-h1
099 -t-middot~middot--Ur---lmiddotft------middot-+middott-middotmiddotcr-----~---III ~I-----ti----middotmiddot-+---middotmiddotmiddot~~--middotmiddotmiddot------I+-imiddotmiddotmiddotmiddot--+--middotmiddotmiddot--~iH--l
098
097 -t--------~---~-shy -------~--~-~~--~--~~~~~----~-- ----~~
O+-------------~-------------middot-----~-----------~--shy
Ol-May OS-May 09-May 13-May 17-May 21-May 25-May 29-May
Time
Figure 53 KPI trend for the oxygen compressor
Electrical Electronic and Computer Engineering 79
Chapter 5 Leading and Controlling
The KPI trend for the air separation unit (ASU) is shown in figure 54
11 ~------------------------------------------------------------- Trend line
~ 095
~ 09
085
08
075
O1-May 05-May 09-May 13-May 17-May
Time
21-May 25-May 29-May
Figure 54 KPI trend for the ASU
Table 53 shows the average power loss contribution from each of the major systems These
results were obtained by calculating the average power loss defined as the difference between
actual performance and expected performance (Le at KPI equal to unity) during that
particular month
Table 53 System inefficiencies quantified in terms of average power loss
System A verage power loss Air compressor motor 660kW Oxygen compressor motor 400kW
Total lO60kW
Air compressor 630kW Oxygen compressor -70kW Air separation unit (ASU) 430kW
Total 990kW
Grand total 2050kW
Electrical Electronic and Computer Engineering 80
Chapter 5 Leading and Controlling
55 CORRECTIVE ACTION
Now that system performance have assessed the energy manager is now in a position to
manage equipment inefficiencies and determine whether there has been improvement in those
that have been addressed on previous occasions
551 Global efficiency indicator
This KPI should be below one in case of energy efficient train operation but as can be seen
from figure 51 it is mostly above unity implying some form of efficiency loss within the
oxygen train
On 8th May there was a sudden improvement in the global efficiency indicator and the reason
for this will become apparent in the discussion regarding the KPI trend for the air compressor
It is worth noting from the graph that there seem to be a slight trend downwards up to around
27th May were it stayed on or below unity for the rest of the remaining time the reason for this
is that average ambient temperature decreased as the year approached June ultimately leading
to increased train efficiency This trend can also be seen in the air compressor graph of figure
52 and the fact that the ambient temperature has such a favorable effect on train energy
efficiency its actual performance is disguised somewhat and one can expect that the losses
listed in table 53 may even be slightly higher during the summer months
542 Compressor motors
The fact that these two values are below one (refer to table 52) implies that there has been
some degradation in motor efficiencies the air compressor motor is currently about 95 of its
original efficiency and that of the oxygen compressor motor is around 94 Based on this
assessment the energy manager may quantify the cost associated with the respective 5 and
6 degradation in motor efficiencies and is now in a position to manage this energy loss
Electrical Electronic and Computer Engineering 81
Chapter 5 Leading and Controlling
5421 Air compressor motor
All air compressor motors on this plant are rated 37MW and are 2-pole synchronous motors
This air compressor motors KPI is at 0949 (table 52) which equates to an average power
loss of 660 kW The energy cost associated with this loss combined with current maintenance
costs cannot at this stage justify buying a new high-efficiency synchronous motor therefore
other corrective actions should be employed in improving the motors energy efficiency and in
this particular case the following steps will be taken
bull Assessment of partial discharge condition monitoring results and scheduling an
opportunity maintenance action if these results show a degree of partial discharge
bull Schedule an in-situ motor inspection carried out by the OEM in which the state of the
stator and rotor may be determined minor servicing of the motor may be enabled and
recommendations can be made by the OEM
5422 Oxygen compressor motor
All oxygen compressor motors on the plant are 137 MW 4-pole induction machines and for
this particular motor its KPI has been evaluated at 0937 leading to an average power loss of
400 kW (this result takes into account the principles discussed in section 4433 and is based
on the power saving that would result in upgrading it to its original specifications)
For the oxygen compressor motor there is much more potential for a replacement action
because of the relatively high energy loss and the fact that maintenance costs for this motor
has risen quite dramatically over the past two years Considering all the related variables a
payback period of 17 years has been calculated when replacing this motor with a new one
Management rules state that business-case approval will only be given to projects with a
payback period of 15 years or less however KPI monitoring on the other trains revealed that
the majority of oxygen compressor motors are in a worse state than the motor from this
particular train and by consolidating the project (ie recommending replacement of all motors
at once instead of just the one) the payback period was calculated at just below 15 years
Electrical Electronic and Computer Engineering 82
Chapter 5 Leading and Controlling
543 Air compressor
On 8th May the actual compressor performance was significantly above that expected (refer to
figure 52) the reason for this being that demand at that time required high product flow at
high purity and auxiliary air compressors were put online to supplement this demand the
auxiliary air compressors are unaccounted for in the model which ultimately manifests in
exceptional compressor performance
Although air compressor performance did improve as the month progressed (gradual decrease
in ambient temperature) for the majority of operational time it remained below expected
performance This under-performance resulted in an average power loss of 630 kW (table 53)
and upon further investigation it was found that routine maintenance was done quite a long
way back and given the poor air quality at Sasol Secunda a significant amount of compressor
fouling was inevitable Production requirements from production department and low priority
assignment from maintenance department resulted in these irregular and mostly delayed
maintenance intervals A proper corrective action from the energy manager in this case would
be to facilitate a compromise between these two departments by ensuring that consensus have
been reached on the scheduling of this maintenance action and also that this scheduling leads
to increased energy efficiency
544 Oxygen compressor
Figure 53 shows the KPI trend for the oxygen compressor and as can been seen from this
figure the KPI stayed above unity for the majority of time which implies good compressor
operation This is also manifested in the average power loss for this compressor which has
been calculated at -70kW as listed in table 53 implying that the oxygen compressor overall
operated slightly above expectation
In general one can expect that the product compressors performance in terms of energy
efficiency should normally be above that of the air compressor because as opposed to the air
compressor it handles a clean and pure gas and is therefore not as susceptible to compressor
Electrical Electronic and Computer Engineering 83
Chapter 5 Leading and Controlling
fouling also in some cases it is less prone to physical damage resulting from large solid
particles
545 Air separation unit
From figure 54 it can be seen that the ASU under-performed for the majority of time
resulting in an average power loss of 430 kW (table 53) Calculations showed that the average
recovery efficiency for this time was 9417 which is slightly less than its empirical value
(9541 ) meaning the air compressor has to make an added effort for compensating this drop
in efficiency
Production department acknowledged the decrease in recovery efficiency and the problem was
identified as damaged distillation trays inside the distillation column Initiating a maintenance
action to repair defective trays in the near future will not be feasible because this would lead to
significant production losses Again the energy manager has to manage this loss to the
minimum The following actions would do just this
bull Keep monitoring the recovery efficiency and initiate a maintenance action as soon
as energy loss could justify this andor determine the production loss when the air
compressor has reached its full capacity and cannot compensate for the recovery
efficiency loss anymore which ever comes first or should it be it the case when
both conditions have been reached
bull Minimize the loss by sharing a portion of this trains load equally between the
more efficient trains at times of low oxygen demand or whenever there is more
efficient spare capacity available
55 CONCLUSION
In this chapter the managerial functions of leading and energy management controlling have
been discussed
Electrical Electronic and Computer Engineering 84
Chapter 5 Leading and Controlling
The managerial function of leading involves leadership motivation and communication
Leadership refers to the ability to lead which involves the process of influencing people so
that they will strive willingly and enthusiastically toward the achievement of energy
management goals Motivation is vital in aligning objectives of the individual with that of the
energy management program and it is important that the energy manager practice effective
motivational techniques Communication is the process by which information can be received
or send It is a vital skill and an essential activity in the energy management program
Controlling is one of the functions the energy manager has to perform in order to ensure
continuity of an effective energy management program
Control is necessary in the energy management program as it brings actual performance in
line with desired performance and based on the discrepancy between these two the energy
manager is in a position to strategize corrective measures It is important for the energy
manager to establish good communication links with the relevant departments within the
plants organization as they are in a position to provide information relevant in the control
phase and are also the stakeholders that need convincing before buying into corrective action
strategies
Electrical Electronic and Computer Engineering 85
Chapter 6 Conclusions and Recommendations
CHAPTER 6 CONCLUSIONS AND RECOMMENDATIONS
61 INTRODUCTION
In chapter 1 the main and specific objectives of this dissertation were listed these objectives
were addressed during the course of this dissertation and will now be properly concluded
through referring to the relevant sections Lastly recommendations with regard to certain
aspects of the energy management system presented in this dissertation will be made followed
by a closing remark
62 CONCLUSIONS ON THE OBJECTIVES
The main objective of this dissertation was to present a framework that would enable effective
management of energy cost and efficiency in cryogenic air separation plants as stated in
section 12
In this dissertation a model has been defined which serves as the framework for the energy
management program at cryogenic air separation plants Within this framework various
functions have been defined and the energy management effort is realized through performing
the activities surrounding each of the respective functions
621 Conclusion on the energy management model
The energy management model was introduced in chapter 3 The model is depicted in figure
35 and entails the transformation process its inputs and outputs and the external environment
as well as the interaction between all of these Inputs are resources like capital skills people
and facilities outputs are the accomplished energy management objectives like improved
preventive maintenance strategies optimized production schedules reduced energy cost and
improved plant design
The external environment accounts for the higher order systems to which the energy
Electrical Electronic and Computer Engineering 86
Chapter 6 Conclusions and Recommendations
management system belongs The transformation process involves the managerial functions of
organizing planning leading and controlling which are the core managerial functions the
energy manager has to perform
622 Conclusion on the energy policy
Theory behind the energy policy was presented in section 43 The energy policy normally
consists out of three components the declaration of commitment mission statement and
specific objectives The energy policy guides or channels thinking it is an expression of the
commitment plant management has towards a continuous and effective energy management
program and sets the scope for energy management effort at plant level
623 Conclusion on the energy policy strategy
The energy policy strategy is the means for accomplishing the vision expressed by the energy
policy and was introduced in section 44 The energy policy strategy thus encapsulates the plan
for changing current reality into future vision This plan is composed of five activities and
they have been identified as the following
bull deployment of human resources
bull current situation evaluation
bull energy systems maintenance
bull energy management planning
bull establishment of measurement and control indicators
Deployment of human resources entails the appointment of a dedicated person in charge of
the plants energy management program as well as enabling this person to utilize other
relevant human resources
Energy systems maintenance refers to maintenance actions regarding the energy efficiency of
Electrical Electronic and Computer Engineering 87
Chapter 6 Conclusions and Recommendations
equipment that use or affect the use of energy
The energy management plan is a structured and well-formulated set of plans and tactics that
should be followed in order to ultimately achieve the primary objectives as stipulated in the
energy policy
Key performance indicators were presented in section 445 and these indicators enable the
energy manager to assess the plants energy efficiency and also to perform the control function
of the energy management program
624 Conclusion on the energy audit process
The energy audit process was discussed in section 442 and consists out of the energy audit
policy and the energy audit strategy The energy audit policy sets the scope for what to audit
whereas the energy audit policy strategy states how this would be done
Auditing is done through assessing relevant plant efficiencies as listed in section 4421 and
for the holistic approach to energy auditing assessment of all these plant efficiencies should
be enabled this assessment is done by means of the audit strategy as detailed in section
4424
625 Conclusion on the mathematical model
Model building blocks with regard to all the major systems were derived in section 4424
The energy conversion model is a very important auditing tool and most of the building blocks
derived in this section also find their application in the control function of the energy
management program (section 52)
Model accuracy is greatly enhanced through empirical modeling of critical plant elements and
Electrical Electronic and Computer Engineering 88
Chapter 6 Conclusions and Recommendations
as stated in chapter 4 it becomes obvious that availability of relevant data is critical in model
building
626 Conclusion on the performance indicators
KPIs (key performance indicators) were derived in section 445 and consist of global
indicators as well as lower level indicators Global indicators quantify the performance of the
plant as a whole and include the energy cost per product produced (RlNm3) and energy
consumption per cumulative product produced (kWhlNm The lower level indicators enable
the energy manager to monitor the energy efficiency of critical components such as the
compressor motors compressors and the distillation columns and are also utilized in the
control function of the energy management program
Each KPI is defined as the ratio between actual and theoretical performance The theoretical
performance effectively defines the energy standard of a particular system which enables the
energy manager to identify system inefficiencies when comparing this to the actual system
performance
627 Conclusion on energy systems maintenance
Energy systems maintenance with regard to cryogenic air separation plants was introduced in
section 443 Energy systems maintenance is the energy managers contribution to the overall
maintenance effort on the plant and is conducted by means of an energy maintenance life plan
The state of each of the respective critical systems is monitored in terms of their energy
efficiency and deviations are acted upon so as to minimize resulting energy losses The critical
systems are the compressors distillation columns and compressor motors and a maintenance
plan for these systems were presented in section 4435
A cryogenic air separation plant normally utilizes a large number of induction motors for
Electrical Electronic and Computer Engineering 89
Chapter 6 Conclusions and Recommendations
driving loads such as blowers pumps and compressors and these motors consequently have a
significant impact on the energy efficiency of the plant As stated in section 4433 energy
systems maintenance on large induction motors driving these loads may not be so simple and
in this section a tool that facilitates decision-making between induction motor replacement and
renewal was presented as well
63 RECOMMENDATIONS
This section contains recommendations with regard to certain aspects of the energy
management system at cryogenic air separation plants
631 Recommendations on setting up the energy management program
First and foremost it is the responsibility of the appointed energy manager to ensure that there
is a formal and well-defined energy policy in place at plant level for the whole energy
management program will be as a direct consequence of this policy and is therefore the
foundation from which all energy management efforts will outflow This policy should be
agreed upon by the relevant stakeholders and approved by top management
For the energy management system to be fully integrated into the plants organizational
structure and to ensure that top management continually gives it the commitment it needs it is
recommended that the outcomes of this program be accounted for in the overall performance
of the plant in order for it to ultimately have an impact on the merits of plant performance
As a direct consequence of the energy policy capita1 will be made available for the energy
management program in the form of a financial budget The energy manager is responsible for
formulating the energy management budget for the next financial year and this budget should
then serve as the cost goal for the energy management program This is a critical resource
input to the program and the energy manager should make sure that optimum use of this
resource is exercised through proper planning and allocation (see section 444)
Electrical Electronic and Computer Engineering 90
Chapter 6 Conclusions and Recommendations
When implementing the energy management program it is important that the appointed person
should first organize a workshop session in which all the relevant departments in the plants
organization are informed about what the proposed energy management effort entails what is
expected of them and how they can benefit from it This is also a good opportunity for the
energy manager to highlight the importance of effective energy management on these energy
intensive plants and to aspire fellow personnel in contributing positively towards energy
management objectives
632 Recommendations regarding existing energy management programs
In the case where there already is an existing energy management program in place the
contents of this dissertation may be used to supplement or adjust current efforts The model
presented in this dissertation aims to foster an effective and value-adding energy management
program without compromising production output streams and will add to the success of
existing energy management efforts
633 Recommendations regarding energy modeling
In section 4424 it becomes obvious that in building the energy conversion model the energy
manager requires a large amount of data of different types ranging from process variables like
temperature pressure and flow to capacity limits on equipment To avoid spending too much
time in model building and ensuring good accuracy the energy manager must enable easy
access to relevant data
Building the energy conversion model may take a relatively long time especially in plants
incorporating multiple trains and most of the time will be consumed by processing relevant
data it is therefore recommended that appropriate computer software be used Spreadsheets
will undoubtedly proof to be most efficient in data processing and it is also recommended that
software capable of multiple variable regression be utilized in modeling certain subsystems
Lastly some model building blocks are utilized in the control function of the energy
Electrical Electronic and Computer Engineering 91
Chapter 6 Conclusions and Recommendations
management system and it would be advisable to link the relevant model outputs to the
respective KPIs in which they are utilized in this manner KPIs are automatically evaluated
whenever plant performance needs to be determined
634 Recommendations regarding the energy manager
Although it is recommended that the energy management system should form part of the
plants organization it doesnt necessarily mean that the person appointed to drive this
program should be stationed at the plant This person may form part of an organization
external to the plants organization like for example an energy management task team that is
charged with managing energy cost on a company-wide level a technical hub or even an
outside company (outsourcing)
It is required that the appointed person should be experienced in general management and
competent in applying financial tools This person should also be technically orientated
typically operating from the base of mechanical electrical or process engineering
635 Recommendations regarding energy management at Sasol Secunda
It is a fact that certain plants within the Sasol complex are generally energy intensive and in
optimizing the energy cost per output product more efficiently it is recommended that
intentional consideration should be given to energy management at plant level Realizing this
energy management effort lies in adopting an efficient managerial structure such as the one
presented in this dissertation and allocating resources to fuel this energy management effort
Driving this managerial effort would be the responsibility of a dedicated energy manager
appointed by the company Lastly Janse van Rensburg [17] also suggested that an energy
manager should be appointed by each of the major energy consumers within the factory and
that a specific plants performance with regard to energy management should have an impact
on the overall performance merit of the plant thereby motivating relevant personnel in
achieving energy management objectives
Electrical Electronic and Computer Engineering 92
Chapter 6 Conclusions and Recommendations
64 FUTURE WORK
Although there are key commonalities between various cryogenic air separation plants they
may still be diverse in design and it is up to the energy manager to derive an energy model
specific to hisher plant this may be done by employing the basic modeling theory presented
in chapter 4
Another point worth mentioning is that of extending the application of the energy model
Utilization of the energy model is basically limited to that of the energy manager but by
modifying the model such that it is able to receive real-time data in order to produce specific
predefined outputs in real-time the proactive element of the energy management effort is
greatly enhanced The model may be added as an extension to the control operators
workstation The control operator is directly responsible for the process control of the plant
and is able to see (in real time) on how certain of hislher actions impact on the energy cost and
efficiency of the plant
Lastly this study was aimed at presenting a generic framework for energy management at
cryogenic air separation plants however it was also the intent of the author to introduce an
energy management framework that may be applied to plants of any nature In the quest for
deriving an energy management program future studies may thus apply the basic philosophy
presented in this study to other types of plants as well
65 CLOSING REMARKS
This dissertation presents a framework for energy management at cryogenic air separation
plants It addresses all the critical managerial aspects required in conducting a successful
energy management program and may be used as a reference or tool in managing electrical
cost and energy efficiency at these energy intensive plants
Because these plants are so energy intensive a relatively small improvement in energy
efficiency may lead to significant energy cost savings Cost savings are not the only benefits
Electrical Electronic and Computer Engineering 93
Chapter 6 Conclusions and Recommendations
resulting from the energy management effort indirect benefits resulting from this include
reduced C02 emissions and conservation of the earths energy resources
From the above it can be seen that energy management at plant level not only makes business
sense but is also the answer to environmental concerns and the ever-increasing energy price
Electrical Electronic and Computer Engineering 94
References
REFERENCES
[1] JC Kotz and P Treichel Chemistry And Chemical Reactivity 3rd edition Harcourt
Brace amp company Orlando USA 1996
[2] AR Smith and J Klosek A review of air separation technologies and their integration
with energy conversion processes Fuel Processing Technology VoL 70 pp115-134
2001
[3] BW Birmingham and CN Smith Cryogenics and the energy crisis Cryogenics Vol
15 Issue 3 pp115-118 1975
[4] Air Liquide Engineering Division Seminar Proceedings France May 1987
[5] Air Liquide Engineering amp large industry training department training handbook Air
Distillation Version 2 Champigny-sur-Mame Cedex France 2001
[6] SC Sarkar Energy savings in cryogenic plants Journal of Energy in Southern
Africa Vol 13 pp139-143 2002
[7] Air Liquide homepage Energy saving results
httpwwwairliquidecom France 2002
[8] MW Biddulph Efficiencies of trays in cryogenic distillation columns Cryogenics
Vol 26 pp24-29 1986
[9] N Gupta BK Srivathsa and KS Misra Energy optimization techniques in Air
Separation Plants Proceeding of International Cryogenic Congress Calcutta India
pp 391-409 1988
[10] A Thuman and DP Metha Handbook ofEnergy Engineering 2nd edition The Fairmont
Press Lilburn USA pp 377 1991
[11] GT Austin Sherves Chemical Industries 5th edition McGraw Hill Inc Singapore pp
115 -128 1984
[12] RH Perry and DW Green Perrys Chemical Engineers Handbook ih edition
McGraw-Hill New York USA pp 4-6 to 4-7 1982
Electrical Electronic and Computer Engineering 95
References
[13] PM Fishbane and S Gasiorowicz Physics for Scientists and Engineers extended 2nd
edition Prentice Hall New Jersey USA pp 438 - 504 1996
[14] HD Koontz C ODonnel H Weihrich Management 8th edition McGraw Hill Inc
Singapore 1984
[15] Oxygen plant financial statements financial results June 2003 and projected July 2004
Sasol Secunda South Africa
[16] WC Turner Energy Management Handbook The Fairmont Press Lilburn USA 1993
[17] WTB Janse van Rensburg Energiebenutting en Energiemodullering in die
Sasolproses Masters Dissertation Potchefstroom University South Africa pp 19-21
1994
[18] VB Ottaviano Energy Management The Fairmont Press Georgia USA pp 12-1 and
72-1 1985
[19] JB Sykes (Editor) The Concise Oxford Dictionary 7th Edition Oxford University
Press Oxford UK p 6501982
[20] Safety Health and Environmental policy of Sasol httpwwwsasolcom South Africa
[21] Materials an Services Management Team (electricity) of Sasol Ltd Cross-functional
and cross-divisional collaboration - The way to industrial electricity cost savings
South Africa ppI-5 2000
[22] A Thuman Handbook Of Energy Audits 5th edition Pretice-Hall New Jersey USA
pp 1-6 1998
[23] FBA Senekal Electricity Demand Management Manual EPR 400 Final Report Centre
for New Electricity Studies University of Pretoria Pretoria RSA pp 71-1011994
[24] GJ Delport Integrated Electricity End-Use Planning in Deep Level Mines Phd Thesis
University of Pretoria Pretoria RSA 1994
[25] EM Talbott Compressed Air Systems A guidebook on energy and cost savings 2nd
edition Fairmont Press New Jersey USA pp 28-30 and 164-167 1993
[26] JK Salisbury Kents Mechanical Engineers Handbook 12th edition John Wiley amp
Sons New York USA pp 1-34 to 1-54 1976
Electrical Electronic and Computer Engineering 96
References
[27] J M Coulson and J F Richardson Coulson amp Richardsons Chemical Engineering
volume 15th edition Butterworth Heinemann Bath Great Britain pp 311-321 1997
[28] T Baumeister and EA Avallone Marks Standard Handbook for Mechanical
Engineers 8th edition McGraw-Hill New York USA pp 14-30 to 14-44 1978
[29] S Makridakis SC Wheelwright et aI Forecasting Methods and Applications 2nd
edition John Wiley amp Sons New York USA pp 246-312 1983
[30] JD Campbell Uptime Strategies for Excellence in Maintenance Management
Productivity press New York USA pp 110 - 112 1995
[31] JS Htsui PJ Otaduy and JD Kueck Efficiency and reliability Assessments of
Retrofitted High-Efficiency Motors Industry Applications Conference Thirtieth lAS
Annual Meeting Conference record of the 1995 IEEE Vol 3 pp2745-2751 1995
[32] PC Sen Principles of Electric Machines and Power Electronics 2nd edition John
Wiley amp Sons New York USA pp207-277 1997
[33] RN Brown Compressors Selection and Sizing 2nd edition Gulf Publishing Company
Houston Texas pp 183-184 1997
[34] KA Stroud Engineering Mathematics 2nd edition Macmillan Great Britain London
pp 18-3 to 18-4 1982
[35] BH Campbell Failed motors Rewind or Replace Industry Applications Magazine
IEEE Vol 3 Issue 1 pp45-50 1997
[36] R Fukuda Managerial Engineering Techniques for improving Quality and
Productivity in the Workplace Productivity Inc Connecticut USA pp20-22 1983
[37] W Jordaan and J Jordaan Man in Context McGraw-Hill Johannesburg RSA pp 618shy
625 1984
Electrical Electronic and Computer Engineering 97
Appendix A
APPENDIX A CASE STUDY BASIC ENERGY CONVERSION MODEL FOR
THE SASOL SECUNDA OXYGEN PLANT
At MODEL INPUTS AND OUTPUTS
Table Al lists the empirical values for the oxygen compressor (refer to equation (9) of chapter
4) Factored into these constants are the respective electromechanical efficiencies of the
oxygen compressor motors
Table AI Oxygen compressor empirical values
Train a b c d 1 0004013 0008215 0002814 i 0820563 2 0004853 0009605 0002887 0960213 i
3 0005213 0004361 0003537 0960292 4 0001955 0005158 0001532 0193396 5 0004018 0008176 0002817 0820563 6 0005104 001082 0002722 0960236 i
7 0003524 0005223 0003751 0960292 ACs 0000871 -0853386 00019996 0067631 I
With reference to equation (8) of chapter 4 the system constants from the air compressor side
are the following h =014 and g 12 which have been assumed the same for all trains
The average recovery efficiencies for each train are as listed in table A2
Table A2 Coldbox average recovery efficiencies
i
i
Train AR 1 9467 2 9055 3 9518 4 9613 5 9528 6 9152 7 9509
Electrical Electronic and Computer Engineering 98
Appendix A
Refer to figure AI for model input and output nametags
Model inputs
bull Management rules Specifies production constraints ie the minimum and maximum
levels of the different commodities involved in the oxygen production process
bull Oxygen demand This input is mainly determined by the gasification and gasshy
reforming processes and will vary in response to their demand
bull Oxygen supply pressure This is the pressure with which oxygen is supplied to the
Gasification and Gas-Reforming plants The supply pressure should be kept between
the constraints as set forth by these two plants
bull Minimum and maximum limits of process outputs and equipment Specifies the
constraints in which the equipment should function in normal operation This includes
o Max amp Min limits of air compressor 37MW amp 28MW (when online)
respectively
o Max amp Min limits of oxygen compressor 137MW amp lOMW (when online)
respectively
o Max amp Min limits ofoxygen purity 994 amp 985 respectively
o Max amp Min limits of Pressure in oxygen common header 3480kPa amp
3350kPa respectively
o Max amp Min limits ofN02 ratio 30 amp 20 respectively
bull HP N21LP 02 ratio Defines the relationship between the HP nitrogen and LP Oxygen
and is assumed a constant value
bull Instrument Air flow The plant also produces instrument air and for the purpose of the
model a constant value is assumed
bull O2 purity The main product purity is assumed constant
bull Other constants This includes the following
o Atmospheric pressure at Secunda (85kPa)
Electrical Electronic and Computer Engineering 99
Appendix A
o 02 pressure at cold box outlet (95kPa)
o Cooling water temperature (20degC)
o A verage recovery efficiencies of each train (AR)
Model outputs
bull Specific energy This is defined as the energy efficiency of the oxygen plant ie the
efficiency with which energy is utilized in producing oxygen It has units of kWhlNm3
Le the amount of kilowatts that should constantly be applied for one hour in order to
produce one normal cubic meter of oxygen
bull New load profiles This includes
o Load profiles of all trains
o Load profile of whole industry (train 1-7)
bull Cost ofenergy Gives the cost of energy based on the tariff structure
For the model simulation the following input values listed in table A3 were used
Table A3 Input values used for model simulation
Parameter held constant Value Oxygen supply pressure 3440kPa
N202 ratio 25 Average recovery (AR) Refer to table C2 Instrument air flow 35 kNmjh Oxygen purity 986 Electricity tariff structure WEPS (2002 Sasol structure)
Electrical Electronic and Computer Engineering 100
Appendix A
Management Rules
O2 demand
O2 supply pressure
Min amp Max limits of
equipment
N202 ratiogt
L-_A_R__gt Instrument Air
(lA)flow
O2 purity
Electricity Tariff
Specific Energygt
Load profilesgt
Cost of Energygt
Figure Al Inputs and outputs for the basic energy conversion model
Electrical Electronic and Computer Engineering 101
- - - - - - -
Appendix A
Table A4 Simulation results calculated over a period of one moth
Parameter Value Specific energy 06589 kWhlNm
j
Cumulative load profile Refer to figure C2 Cost of energy during sample month R21156843
360
340
320
300 ~ 280 ~
260 Refer 10 figure A3
240
220
200 gt gt gt gt gt gt gt gt gt gt gt gt gt gt gt gt gt gt gt gt ol ol ol ol ol ~ ol ol ~ ol ol ol ol ol ol ol ol ol ol ol ol ol
~ ~ ~ ~ ~ ~ ~ ~ ~ ~ ~ ~ ~ ~ ~ ~ ~ ~ ~ ~ ~ ~ I I I I I I I I I I I I I I I I I I I I I
C-I ri on IQ 00 0 C-I ri on IQ 00 0- 0 C-I ri on IQ t- O- 0 C-I C-I C-I C-I C-I C-I C-I ri
Time
Figure A2 Actual and simulated load profile for the oxygen plant at Sasol Secunda
~ ~
360
340
320
300
260
240
220
200
I8-May I9-May 20-May 21-May 22-May 23-May 24-May 25-May
Time
Figure A3 Section of actual and simulated load profile of figure C2
Electrical Electronic and Computer Engineering 102
Appendix A
On 8th May the actual load profile plunges momentarily while the model doesnt seem to be
responding to this change in power consumption This is due to the fact that the model
assumes that only one oxygen compressor can be offline at any point in time which is usually
the case on this particular day however between 0730 and 930 train twos oxygen
compressor tripped and was offline for approximately two hours in addition to the oxygen
compressor of train one This has the implication that the spare oxygen compressor was
summed twice for two hours On 7th May the same incident happened for approximately one
hour
Two oxygen compressors are very rarely offline at the same time and as these incidents
happened only for a relatively small time the entire month (approximately three hours in total)
its impact is negligent and also for the sake of model simplicity this aspect was neglected in
modeling the oxygen plant
As will be illustrated later in this section an oxygen trains power consumption increases
when a higher purity oxygen is produced Between 15t and 2nd of May the actual load profile
seems to be slightly higher compared to that of the model The model assumes that oxygen is
produced at a constant purity (986) however in this case oxygen was produced at a higher
purity leading to an increased power consumption this is also the case for the respective load
profiles between 27th and 28th of May The same reasoning can be applied to the results seen
between 30th and 31 5t of May except that in this case lower purity oxygen (ie less than
986) was produced
When the power consumption of the oxygen plant drops like for instance at 5 7 8923 and
30th May it seems that the model overshoots the minimum point at times this is mainly due to
the minimum permissible power consumption the compressors are allowed to have The model
assumes 28MW and lOMW for the air and oxygen compressor motors respectively but these
values vary from train to train (may be higher or lower than 28MWllOMW) and thus may
overshoot at times or even undershoot the actual load profile at these conditions
Electrical Electronic and Computer Engineering 103
Appendix A
A2 IMPACT OF KEY PARAMETERS ON ENERGY EFFICIENCY
The energy conversion model defined in the previous section will now be used to quantify the
impact certain key process parameters have on the energy consumption efficiency and cost of
the plant Normal operating conditions will be used as the baseline and are as listed in table
A5 at these conditions the model outputs are as listed in table A6
Table A5 Normal operating conditions of the oxygen plant at Sasol Secunda
O2 Purity 986 HPNdLP02 25 IA flow 35 kNmlh O2 common header pressure 3440 kPa
Table A6 Model results at normal operating conditions
Specific energy 06589 kWhlNmf Load profile of oxygen plant Figure A2 Average power consumed 32344MW Total cost of energy R 21156843
The effects of changing following parameters will be determined
bull Oxygen purity
bull Average recovery efficiency (AR)
bull Instrument air flow (AI)
bull Cold box availability
Table A7 lists the different simulation scenarios with table A8 displaying the respective
model outputs in terms of specific energy average power consumption and total cost of
energy
Electrical Electronic and Computer Engineering 104
Appendix A
Table A7 Model simulation scenarios
Variables O2purity IA flow per 02CH Recovery
CD offline train pressure efficiencies
Oxygen purity - Scenario 1 985 35kNmJh 3440kPa Table A2 None - Scenario 2 987 I 35kNm3h 3440kPa Table A2 None
AR efficiency - Scenario 986 35kNm3h 3440kPa Trains 2amp6 None
changed to 95
IA flow - Scenario 986 Load shifting 3440kPa Table A2 None
IA of trains 2amp6 to train 7
Cold box availability - Scenario 986 35kNmj h 3440kPa Table A2 Train 1
Table A8 Model outputs based on the scenarios listed in table A7
Variables Specific Average Total cost Increase
Increase Increase I in average
of energy in specific in total
energy power power cost of
consumed energy (KWhINm3) (MW) (R) consumed energy
(R) Oxygen purity - Scenario 1 06553 32172 21049009 -055 -053 ~7834 - Scenario 2 06631 32553 21287147 064 065 0304
AR efficiency - Scenario 06524 32029 20960289 -099 -097 -196654
IA flow I
- Scenario 78 32291 21123850 -017 -016 -32993
Cold box availability - Scenario 07360 31189 20401463 1235 -357 -755380
Electrical Electronic and Computer Engineering 105
Appendix B
APPENDIXB LIST OF TABLES
Table 21 Components of air and their properties (Sources Austin [11] Kotz et al [1]) 5
Table 23 A description on the function of each process and the equipment used for the
Table 44 Summary of electrical machinery ratings and capacity requirements for production
Table 47 Three suppliers of a 4-pole 137MW induction motor with their respective ratings
Table 49 Energy systems life plan for the critical systems on the cryogenic air separation
Table 22 Comparison of air separation technologies (Smith et al [2]) 6
implementation thereof 7
Table 41 Details surrounding commodity inputs to the oxygen plant at Sasol Secunda 34
Table 42 Details surrounding commodity outputs from the oxygen plant at Sasol Secunda 35
Table 43 Prioritization of output products of the oxygen plant 35
means 39
Table 45 Summary of the user requirements for each product 39
Table 46 Current motor parameter values 60
60
Table 48 Power saving for the different motors from the three suppliers 62
plant 66
Table 51 Characteristic parameters of a train used in its performance measurements 77
Table 52 KPI values for the air and oxygen compressor motors 78
Table 53 System inefficiencies quantified in terms of average power loss 80
Table Al Oxygen compressor empirical values 98
Table A2 Coldbox average recovery efficiencies 98
Table A3 Input values used for model simulation 100
Table A4 Simulation results calculated over a period of one moth 102
Table A5 Normal operating conditions of the oxygen plant at Sasol Secunda 104
Electrical Electronic and Computer Engineering 106
Appendix B
Table A6 Model results at normal operating conditions 104
Table A7 Model simulation scenarios 105
Table A8 Model outputs based on the scenarios listed in table A7 105
Electrical Electronic and Computer Engineering 107
Appendix C
APPENDIXC LIST OF FIGURES
Figure 21 Processes involved in cryogenic air separation 7
Figure 23 Water and alcohol mixture at boiling point producing a gas and consequent
Figure 24 Cascaded distillation flasks producing a substance rich in volatile element at the
Figure 25 Distillation by means of improved liquid-gas contact between cascaded distillation
Figure 26 Distillation column producing oxygen and nitrogen by means of fractional
Figure 41 Energy policy at different levels of the organization and the scope of the policy at
Figure 42 An illustration of efficiency losses inherent to the plants structure from an energy
managers perspective and how they collectively contribute to the ultimate quantity of
Figure 43 Basic outline of the oxygen plant at Sasol Secunda The flows presented here are
Electrical Electronic and Computer Engineering
Figure 22 Distillation flask with water and alcohol mixture 10
distillate richer in alcohol 10
top and a substance rich in less volatile element at the bottom 11
flasks 12
distillation trays [5J 13
Figure 27 Producing oxygen by utilizing a distillation column with no condenser [5J 14
Figure 28 Producing nitrogen by utilizing a distillation column with no vaporizer [5J 15
Figure 29 Stacked column model that enables the production of oxygen and nitrogen 17
Figure 31 Basic outline of the energy management model 20
Figure 32 The energy management model 22
each level 25
output product per Rand of electrical cost 30
the steady state maximum amounts of oxygen that each train is able to produce 36
Figure 44 Process flow of a single oxygen train 38
Figure 45 Simplified system breakdown structure of the cryogenic air separation plant 42
Figure 46 Multi-stage compression cycle with interstage cooling (Coulson et ai [27])45
108
Appendix C
Figure 47 Linear approximation of system curve 48
Figure 48 Functional fai lures and performance standards 51
Figure 49 Partial power curves of the existing motor (motor 1) and the new motor (motor 2)
as well as that of the compressor load illustrating the implication of installing a higher
efficiency motor than is currently in operation 54
Figure 410 Compressor characteristic curve at various shaft speeds 56
Figure 4 11 Approximating the power curve with a linear model at low slip values 59
Figure 412 Threshold efficiency proposed new motor should adhere to as a function of its
full load speed 61
Figure 413 Threshold lines of motor after every rewind 64
Figure 51 KPI trend for the global efficiency indicator 78
Figure 52 KPI trending for the air compressor 79
Figure 53 KPI trend for the oxygen compressor 79
Figure 54 KPI trend for the ASU 80
Figure Al Inputs and outputs for the basic energy conversion model 101
Figure A2 Actual and simulated load profile for the oxygen plant at Sasol Secunda 102
Figure A3 Section of actual and simulated load profile of figure C2 102
Electrica l Electronic and Computer Engineering 109

Acknowledgements
To thank all the people who gave me their continuous support throughout w ill not be possib le
in th e available space and to them I would like to express my deepest grati tude in making this
study poss ible
bull To my Heavenl y Father my God to li ve in Your Name truly is what it is all about
bull Domi nique Rouge of Air Liquide your insight into cryogenic plants was invaluable and I
thank you fo r your willingness in assisting me during th is study
bull Jan Lewis of Sasol oxygen plant thank you for your continued willingness and patience
in sharing your valuable plant ex perience with me in the countless sessions we had
bull Saso l for giving me the opportunity and means for conducting thi s study
bull James Calmeyer fo r his guidance during thi s study
bull M y parents Sina and Theuns you always gave me your unconditional love and support to
which I am infinitely grateful Maryna and Rina you are the best siste rs a brother could
ever hope to have
bull Lastl y to Marilene my wi fe and soul mate your unconditional love and never-ending
support ha ve always tru ly been a great inspiration to me I dedi cate this to you
To Marilene
Electrical Electronic and Computer Engineerin g
Abstract
SUMMARY
Steel petrochemicals metall urgy explosives food and many other industries requIre large
amounts of a ir products such as oxygen and ni trogen Cryogeni c air separati on technology is
unli ke other air separation technologies in a mature stage of its life cycle and currentl y the
only practical means avail able for mass-producti on of these air products Inherent to its
operation cryogeni c air separati on plants are generally energy intensive and power input is
considered the main factor on which the ultimate prod uction cost wil l depend Ex peri ence has
shown that relati vely small improvements in energy effic iency on these plants generall y resul t
in significant reducti on of production cost
Th is d issertation di scusses the means fo r effective energy management at these plants aimed
at ultimately reducing the electri cal cost per quantity of air product produced It introduces a
model aimed at the manager res ponsible for energy manage ment at plants of thi s nature
At the core of the model is the defin iti on of the energy management structure which consists
out of the foll owing main managerial functi ons organi zing planning leading and controlling
Organ ization impl ies a formali zed intentional structure of rol es and positions whereas the
plann ing process entails sett ing up the energy policy and defining the energy strategy The
manageri al functi on of lead ing in volves leadership moti vati on and communicati on and in
controlling the energy manager sets energy standards measures perfo rm ance and initiate
appropriate correcti ve acti ons
KEYWORDS
Cryogeni c Air Separati on plant Energy Management Model Energy Poli cy Energy Strategy
Electri cal Electroni c and Computer Engineering
Opsomming
OPSOMMING
Die staal industri e petrochemiese maatskappye metallurgie plofstofvervaardi gers en di e
voedselbedryf benodig groot hoeveelhede gasprodukte soos suurstof en stikstof Kri ogeniese
11Igskeiding tegnologie is anders as ander lugskeidingstegnologiee in n volwasse stadium
van sy lewenss iklus en is huidiglik ook die enigste praktiese manier beski kbaar vir massa
produksie van die laasgenoemde gasprodukte Inherent tot sy prosses is kriogeniese
lugskeidingsaanlegte normaal weg energie intensief en energie-inset word normaalweg beskou
as di e hoof faktor waarop die uiteindelike produksie koste sal afhang Ondervinding het bewys
dat relatiewe klein verbeterings in die energie effe kti witeit van hierdie aanlegte normaalweg
lei tot beduidende verJagings in produksiekoste
Hierdi e verhandeling bespreek n metode waarop effekti ewe energiebestuur by hi erdie
aanlegte toegepas ka n word en is daarop gemik om die uiteindelike energie koste per
uitsetprodukhoeveelheid te reduseer Dit stel n model bekend wat gemik is op di e bestuurder
wat verantwoordelik is vir energiebestuur by hierdie aanlegte
Die defini sie van di e energiebestuurstru ktuur vorm die kern van die model en bestaan ui t d ie
volgende hoof bestuursfun ksies organisering beplanning leiding en beheer
Organi sering impli seer n geformali seerde en beplande struktuur van take en funk sies terwy l
di e beplanningsprosses di e bepalling van di e energiebeleid en formul eering van di e
energiestrategie insluit Die bestuursfunk sie van leiding sluit in leierskap motivering en
kommunikasie en in die beheer funksie stel di e energiebestuurder energiestandaarde vas meet
prestasie en ini sieer relevante korrektiewe aksies
SLEUTELWOORDE
Kri ogeniese lugskeiding Energiebestullrmodel Energiebeleid Energiestrategie
Electri cal Electronic and Computer Engineering III
List of Abbreviations
LIST OF ABBREVIATIONS
Abbreviation Meaning
AC Air Compressor
Ar Argon
AR A verage Recovery
ASU Air Separation Unit
CB Coldbox
CBM Condition-based maintenance
CO2 Carbon Dioxide
CT Current Transformer
FfM Fixed-Time maintenance
GAN Gaseous Nitrogen
GOX Gaseous Oxygen
He Helium
HP High Pressure
IA Instrument Air
Kr Kripton
LOX Liquid Oxygen
LP Low Pressure
MG-set Motor-Generator set
MP Medium Pressure
N2 Nitrogen
Electrical Electronic and Computer Engineering iv
List of Abbreviations
O2
OC
OEM
PM
PT
tpd
WN2
Xe
Normal Cubic Meters per hour This is the flow of a
commodity (gas or liquid) at normal conditions
(OOe and 1013 absolute bar)
Oxygen
Oxygen Compressor
Original Equipment Manufacturer
Preventive Maintenance
Potential Transformer
Tons per Day
Waste Nitrogen
Xenon
Electrical Electronic and Computer Engineering v
Table of Contents
TABLE OF CONTENTS
CHAPTER 1 PROBLEM IDENTIFICATION AND BACKGROUND 1
11 INTRODUCTION 1
12 ENERGY MANAGEMENT AT CRYOGENIC AIR SEPARATION PLANTS 1
13 DISSERTATION OBJECTIVES 3
131 Main objective 3
132 Specific objectives 3
14 DISSERTATION STRUCTURE 3
CHAPTER 2 CRYOGENIC AIR SEPARATION 5
21 INTRODUCTION 5
22 PROCESS DESCRIPTION 6
23 DISTILLATION 9
231 Example Distillation of an alcohol and water mixture lO
232 Distillation of air 12
24 CONCLUSION 18
CHAPTER 3 ENERGY MANAGEMENT 19
31 INTRODUCTION 19
32 ENERGY MANAGEMENT AT CRYOGENIC AIR SEPARATION PLANTS 19
32 MODEL FOR ENERGY MANAGEMENT AT CRYOGENIC AIR SEPARATION
PLANTS 20
33 ENERGY MANAGEMENT SYSTEM THE TRANSFORMATION PROCESS 21
34 CONCLUSION 23
Electrical Electronic and Computer Engineering VI
Table of Contents
CHAPTER 4 ORGANIZING AND PLANNING 24
41 ORGANIZING 24
42 PLANNING 24
43 THE ENERGY POLICY 24
44 THE ENERGY POLICY STRATEGY 27
441 Deployment of human resources 28
442 Current situation evaluation 28
4421 The energy audit process 29
4422 The plant efficiencies 29
4423 Energy audit policy 33
4424 Energy audit strategy 33
443 Energy systems maintenance 50
4431 Establishing an energy systems maintenance life plan 52
4432 Energy systems maintenance on compressors 53
4433 Energy systems maintenance on motors 53
4434 Energy systems maintenance on distillation columns 64
4435 Energy systems maintenance life plan 65
444 The energy management plan 66
445 Measurement and control indicators 68
4451 KPI for determining the state ofthe compressor motor 70
4452 KPlfor determining the state ofthe air and product compressor 71
4453 KPlfor determining the state of the air separation unit 71
4454 KPlfor determining the overall efficiency ofthe plant 72
45 CONCLUSION 73
Electrical Electronic and Computer Engineering Vll
Table of Contents
CHAPTER 5 LEADING AND CONTROLLING 75
51 LEADING 75
52 CONTROLING 76
53 ESTABLISHING ENERGY STANDARDSNORMS 76
54 PERFORMANCE MEASUREMENT 76
55 CORRECTIVE ACTION 81
551 Global efficiency indicator 81
542 Compressor motors 81
5421 Air compressor motor 82
5422 Oxygen compressor motor 82
543 Air compressor 83
544 Oxygen compressor 83
545 Air separation unit 84
55 CONCLUSION 84
CHAPTER 6 CONCLUSIONS AND RECOMMENDATIONS 86
61 INTRODUCTION 86
62 CONCLUSIONS ON THE OBJECTIVES 86
621 Conclusion on the energy management model 86
622 Conclusion on the energy policy 87
623 Conclusion on the energy policy strategy 87
624 Conclusion on the energy audit process 88
625 Conclusion on the mathematical model 88
626 Conclusion on the performance indicators 89
627 Conclusion on energy systems maintenance 89
Electrical Electronic and Computer Engineering Vll1
Table of Contents
63 RECOMMENDAnONS 90
631 Recommendations on setting up the energy management program 90
632 Recommendations regarding existing energy management programs 91
633 Recommendations regarding energy modeling 91
634 Recommendations regarding the energy manager 92
635 Recommendations regarding energy management at Sasol Secunda 92
64 FUTURE WORK 93
65 CLOSING REMARKS 93
REFERENCES 95
APPENDIX A CASE STUDY BASIC ENERGY CONVERSION MODEL
FOR THE SASOL SECUNDA OXYGEN PLANT 98
APPENDIX B LIST OF TABLES 106
APPENDIX C LIST OF FIGURES 108
Electrical Electronic and Computer Engineering IX
Chapter 1 Problem Identification and Background
CHAPTER 1 PROBLEM IDENTIFICATION AND BACKGROUND
11 INTRODUCTION
Steel metal and petrochemical industries all require large amounts of air products such as
oxygen and nitrogen Kotz et ai [1] states that oxygen and nitrogen are annual1y among the
top five chemicals produced in the United States Cryogenic air separation plants are
currently the only efficient and economical1y viable method of producing air products on
large scale (Smith et ai [2]) Because transportation adds considerably to the cost plants are
usually constructed on-site and located close to the point of consumption
It is also a fact that plants of this nature are generally energy intensive especially the large
tonnage plants and it has been found that relatively small improvements in plant energy
efficiency may lead to significant energy cost savings
12 ENERGY MANAGEMENT AT CRYOGENIC AIR SEPARATION PLANTS
The energy crises of the early 1970 s necessitated significant improvement of energy
management efforts at these energy intensive plants and initial efforts were mostly aimed at
energy conservation through introduction of better technology available for that time
(Birmingham et al [3])
As a consequence of this intentional consideration to improved plant energy efficiency has
been given during its design phase ([4] [5] [6]) this is manifested by the fact that energy
efficiency increased by approximately 91 from 1980 to the late 80s [4] and from 1997 to
2001 Air Liquide reports a 10 decrease in power consumption of its cryogenic air separation
plants [7]
Since the 1970s energy optimization techniques have been given elevated importance in the
design phase of cryogenic air separation plants and numerous studies addressing the issues
Electrical Electronic and Computer Engineering 1
Chapter 1 Problem Identification and Background
surrounding improved energy optimization have been widely publicized (refer to Birmingham
et ai [3] Biddulph [8] Gupta et al [9] and Sarkar [6]) It is also a fact that all these studies
are almost solely aimed at improving the energy efficiency of the plant through intervention at
the design phase of the cryogenic air separation plant Although there have certainly been
significant improvements in plant energy efficiency during the past years as stated earlier not
much have been written on how proper maintenance of this energy efficiency should be
conducted and needles to say proper energy management
The aim of energy management is defined by Thuman et ai [10] as the reduction of energy
expenditure for the purpose of reducing product cost this would ultimately lead to an increase
in competitive performance and it becomes clear that by employing effective energy
management much more benefit can be drawn by the relevant stakeholders and consequently
also makes business sense
This energy management effort should not only be confined to the design phase of the plant
but should be a continuous action applying it throughout the whole productive part of the
plants life-cycle
With todays relatively high and continuously increasing energy prices it not only becomes a
necessity but also makes business sense to maintain and continuously improve the plants
energy efficiency Managing the plants energy expenditure and efficiency would be the
correct response to the already high and ever-increasing energy cost and may reduce overall
input cost dramatically
To make this managerial action value-adding there needs to be an effective and continuous
energy management program in place that aims to reduce the plants energy expenditure so as
to ultimately reduce product cost
Electrical Electronic and Computer Engineering 2
Chapter 1 Problem Identification and Background
13 DISSERTATION OBJECTIVES
The dissertation objectives are as listed under the main and specific objectives in the subshy
sections that follow
131 Main objective
The main objective of this dissertation is to present a structured framework which would
enable effective management of energy cost and efficiency on cryogenic air separation plants
132 Specific objectives
The main objective is accomplished by addressing several key specific objectives
bull Present a model for energy management at cryogenic air separation plants
bull Introduce the theory behind an energy policy
bull Introduce an energy management strategy
bull Present an efficient energy audit process
bull Derivation of a mathematical model for the cryogenic air separation plant
bull Defining performance indicators which would assess the success of the energy
management program
bull Present the means for conducting energy systems maintenance on relevant
equipment on the plant
14 DISSERTATION STRUCTURE
This dissertation is structured in accordance with the energy management model
Chapter 2 introduces the reader to some of the various technologies available today for
producing air products and also elaborates on the basic theory behind cryogenic air separation
Electrical Electronic and Computer Engineering 3
Chapter 1 Problem Identification and Background
The main processes within the air separation plant are described as well as the equipment used
in realizing these processes
Chapter 3 introduces the energy management model and more specifically the energy
management system This chapter sets the scope for the chapters that follow and gives a brief
introduction of what each one entails
Chapter 4 describes the organizational structure of the energy management program as well as
the components its comprised of It also elaborates on energy management planning and
introduces the concept behind the energy policy and strategy In this chapter components of
the energy policy strategy are described in detail and selected concepts are explained by means
of case studies
In chapter 5 the managerial function of leading is described as well as a few issues
surrounding employee motivation Also included in chapter 5 is the theory behind energy
management controlling where concepts surrounding energy standards detection of deviations
and correction of deviations are elaborated on
The last chapter chapter 6 concludes the dissertation objectives and ends with
recommendations with regard to selected topics
Lastly the case studies presented in this study are with reference to the oxygen plant at Sasol
Secunda in South Africa unless otherwise stated
Electrical Electronic and Computer Engineering 4
Chapter 2 Cryogenic Air Separation
CHAPTER 2 CRYOGENIC AIR SEPARATION
21 INTRODUCTION
Air is a composition of various gasses of which nitrogen (N2) and oxygen (02) collectively
account for approximately 9903 of the total sample volume (Table 21) Various needs
have been developed for application of these gasses especially in the steel petrochemical and
metal industries where large amounts of oxygen and nitrogen are required According to Kotz
et ai [1] oxygen and nitrogen are used the most extensively by industry and they are annually
among the top five chemicals produced in the United States
Table 21 Components of air and their properties (Sources Austin [11] Kotz et ai [1])
Gas Molar Mass (mole) Volume () Boiling Point (K) Nitrogen 2801 78084 7735 Oxygen 3200 20946 9019 Argon 3995 0934 8727 Hydrogen 101 000005 2027 Neon 2018 0001921 2709 Helium 400 00005239 422 Krypton 8380 00001139 11981 Xenon 13129 00000087 16504 Carbon dioxide 4401 002-004 19468 bull Average molar mass of dry air =2896 gmol
Oxygen and nitrogen are produced by means of an air separation process which entails the
separation of air into its constituents The rare gasses like for example Argon Krypton and
Xenon are normally obtained as byproducts of the air separation process
Realization of the air separation process is done through the implementation of a specific air
separation technology There exist different air separation technologies today each one aimed
at exploiting different attributes with regard to the difference in physical properties between
the constituent air gasses In other words an air separation technology is based on the fact that
the fundamental components of air all have different physical properties and air separation is
Electrical Electronic and Computer Engineering 5
Chapter 2 Cryogenic Air Separation
therefore realized through for example distinguishing between molecule sizes distinguishing
between difference in diffusion rates through certain materials adsorption preference special
materials have towards certain gasses of the atmosphere and difference in boiling
temperatures
Some of the technologies being used today include adsorption chemical processes polymeric
membranes ion transport membrane (ITM) and cryogenic Table 22 compares the different
air separation technologies to each other in terms of technology status byproduct capability
product purity limit and plant startup time As can be seen from the table cryogenic air
separation technology is in a mature stage of its life cycle consequently making it the only
feasible means currently available for mass production of air products such as oxygen and
nitrogen
Table 22 Comparison of air separation technologies (Smith et ai [2])
Process Status Byproduct capability
Purity limit (vol )
Start-up time
Adsorption Semi -mature Poor 93-95 minutes Chemical developing Poor gt99 hours Cryogenic mature Excellent gt99 hours Membrane Semi-mature Poor 40 minutes ITM developing Poor gt99 hours
The sections that follow will be dedicated to cryogenic air separation technology
22 PROCESS DESCRIPTION
Cryogenic air separation technology is based on the fact that the different constituent gasses of
air all have different boiling points and by manipulating the immediate environment in terms
of temperature and pressure the air can be separated into its components
Various processes are needed in a cryogenic air separation plant of which the fundamental
ones are air compression air purification heat exchanging distillation and product
Electrical Electronic and Computer Engineering 6
Chapter 2 Cryogenic Air Separation
compression (figure 21)
Air Product Product compression compression delivery
I
Air - Heat Distillation
purification exchange
Figure 21 Processes involved in cryogenic air separation
Each process of figure 21 has a certain function and this function is performed by means of
relevant equipment Table 23 lists the equipment type utiHzed in each of the required
processes as well as their respective main functions
Table 23 A description on the function of each process and the equipment used for the
implementation thereof
Process Function Equipment type Pressurize air feed lines in
Air compression order to achieve required Compressor production I Purifying the air by Reversible exchangerssieve
Air purification removing water and CO2 adsorbers Cooling of incoming air feed by means of cold
Heat exchanging Heat exchanger recovery from exiting products Partial separation of air into
Distillation Distillation columns its constituents Pressurize outgoing product
Product compression feed in to meet user Compressor requirement
Electrical Electronic and Computer Engineering 7
Chapter 2 Cryogenic Air Separation
In figure 21 incoming air is pressurized by the air compressors and enters the process with a
certain flow-rate as determined by the demand of air product at the output of the plant
The air pre-treatment section removes impurities like water carbon dioxide and hydrocarbons
and is necessary because it prohibits vapour condensation liquid water solidification and
gaseous CO2 condensation from occurring within the heat-exchanger thus ensuring
continuous operation of a train
In order to obtain the required conditions for air distillation the air first needs to be cooled
down and this is done by means of heat exchanging between the air and outgoing product
streams
The distillation process is at the heart of the overall process this process performs the actual
separation of air into its constituents These air products are produced with a certain purity
which is defined as the ratio of the quantity of 100 pure air product to the quantity of total of
air product at the output
The outputs from the distillation process are fed back through the heat exchanger in order to
realize the cold recovery process that is needed for the cooling of the incoming air feed lines
The main air product is at low pressure when exiting the distillation process and is for this
reason usually compressed to the clients pressure specification prior to delivery
The system incorporating these processes is referred to as an oxygen or nitrogen train
whatever the main product may be A number of such trains are usually cascaded in order to
produce a high-tonnage air product output and is then collectively referred to as an oxygen or
nitrogen plant
The capacity of cryogenic air separation trains is expressed in tons per day (tpel) of main
Electrical Electronic and Computer Engineering 8
Chapter 2 Cryogenic Air Separation
product output The flow of air products is usually quantified in terms of normal-cubic meter
per hour (Nm31h) which is defined as the flow at 1013 absolute bar and DoC This is in
actuality a mass flow and not a volume flow and conversion between Nm3Ih and tpd may be
done by using the ideal gas law as stated in Perry et al [12] and Fishbane et al[13]
pV =nRT (1)
where
bull P is the gas pressure (kPa)
bull V is the volume (m3)
bull Tis the gas temperature (K)
bull R is the gas constant (831451JmoZ- i Ki)
Rearranging equation (1) and substituting the normal conditions stated earlier gives equation
(2)
V =22414xn (2)
Thus the volume occupied by one mole of gas is 22414m3 at normal conditions whatever the
gas may be The periodic table (Kotz et al [1]) states the molar mass of elements and this is
32gmol for oxygen (02) and 28gmol for nitrogen (N2) and knowing that Itpd is equivalent
to10624 glhour one may evaluate the ton per day rating for oxygen and nitrogen from the
mass flow specification or vice versa
ltpd O2 =2918 Nm31h (3)
1tpdN2= 3335 Nm31h (4)
23 DISTILLATION
As stated earlier the distillation process is at the heart of the overall process and for the
purpose of this dissertation this section will be dedicated to a basic explanation on its
operation The working of this process will be explained by means of an example highlighting
the critical elements of distillation and later on applying these principles to the distillation of
air
Electrical Electronic and Computer Engineering 9
Chapter 2 Cryogenic Air Separation
231 Example Distillation of an alcohol and water mixture
Consider a distillation flask in which there is a mixture of water and alcohol as depicted in
figure 22
Water + Alcohol
Figure 22 Distillation flask with water and alcohol mixture
In figure 23 the mixture is brought to boiling point with a boiler and a gaseous phase richer
in the most volatile component is obtained The gas is condensed and as alcohol vaporizes at
a lower temperature than water (we say that alcohol is more volatile than water) a distillate
richer in volatile elements is obtained
Gas richer in alcohol
Alcohol-rich
distillate
Figure 23 Water and alcohol mixture at boiling point producing a gas and consequent
distillate richer in alcohol
Condenser
Boiler
2 e]
Electrical Electronic and Computer Engineering 10
Chapter 2 Cryogenic Air Separation
By simply cascading a number of such systems as in figure 23 it is possible to make the
distillate richer and richer in volatile elements and thus effectively increasing the volatile
element purity of the distillate This arrangement is depicted in figure 24 and shows the
location of where the respective volumes of the volatile rich element and the less volatile rich
element may be obtained
This arrangement however has the disadvantage that it needs as many boilers and condensers
as distillation flasks but this can be overcome by making the liquid-gas contact more efficient
as is also being done in practice
Rich in less volatile Rich in volatile element (water) element (alcohol)
Figure 24 Cascaded distillation flasks producing a substance rich in volatile element at the
top and a substance rich in less volatile element at the bottom
By improving liquid-gas contact as shown in figure 25 better heat exchanging between the
liquid and the gas may be realized causing the gas to be cooled down partially and the liquid
to be heated up partially Cooling down the gas leads to its partial condensation and heating up
the liquid is accompanied by partial boiling thus distillation with only one boiler may still be
realized given that liquid gas contact is improved
Electrical Electronic and Computer Engineering 11
Chapter 2 Cryogenic Air Separation
Rich in less volatile element
(water)
Rich in volatile element (alcohol)
Figure 25 Distillation by means of improved liquid-gas contact between cascaded distillation
flasks
This concludes the water and alcohol example and the basic theory explained here will now be
made applicable to air distillation
232 Distillation of air
In practice distillation trays instead of flasks are used and the basic function of the tray is to
enable efficient contact of the descending liquid and the rising gas Thus the tray sets the
stage for following
bull Cooling and partial condensation of the rising gas
bull Heating and partial vaporization of the descending liquid
Figure 26 depicts a distillation column with only one vaporizer and one condenser
Distillation is made possible by efficient liquid-gas contact and this is enabled through proper
contact between the descending liquid and the rising gas The respective purities of the most
volatile and less volatile elements differ at each tray with the lower and upper sides of the
disti1lation column being the two extremes which is also where the pure elements are
obtained
Electrical Electronic and Computer Engineering 12
Chapter 2 Cryogenic Air Separation
Suppose that the mixture is no longer water and alcohol but oxygen and nitrogen (Le air)
then oxygen (less volatile element) would be produced at the bottom and nitrogen (most
volatile element) at the top
In figure 26 it is clear that the tray provides the rising gas with a certain resistance and thus
creating a pressure drop this pressure drop must be as small as possible for it has a significant
impact on the energy consumption of the air compressor and is also an important parameter in
development of a trays technology Distillation packing is another technology that is being
used and as opposed to fractional distillation trays ensures a much smaller total pressure drop
as well as improved liquid-gas contact
Condenser
Liquid-gas contact c s 0 r w
Distillation )column
Tray )
Vaporizer
Most volatile
component
$1
~ 8shyS 0 u
~ cI-0 gt
S
4-lt 0
egt middotc ~
$1 ltU $1 0
ashy0 u ltU
3 -cI-0 gt ~
4-lt 0
egt middotc I
Q
Less volatile
component
Figure 26 Distillation column producing oxygen and nitrogen by means of fractional
distillation trays [5J
Electrical Electronic and Computer Engineering 13
Chapter 2 Cryogenic Air Separation
In practice the model presented in figure 26 would be uneconomical since it needs both a
vaporizer and condenser It is possible to remove either one but then the column would be
limited to either producing oxygen or nitrogen and not both at the same time
When removing the condenser it is still possible to produce oxygen however a liquid mixture
of nitrogen and oxygen is needed and this must be injected at the top of the column as shown
in figure 27
Residual product (N2 + O2)
GAS
LIQUID
Less volatile air product (02 )
LIQUID Vaporizer
Figure 27 Producing oxygen by utilizing a distillation column with no condenser [5]
It is important that the mixture entering the column must be in the liquid phase otherwise
there will only be one phase (gas phase) in the column which means that distillation would
not be possible as it requires both a gas phase and a liquid phase
Thus with the model presented in figure 27 liquid oxygen is produced at the bottom and a
residual gas consisting of nitrogen and oxygen at the top
Electrical Electronic and Computer Engineering 14
Chapter 2 Cryogenic Air Separation
Figure 28 shows a model for producing nitrogen The distillation column utilizes only a
condenser and it is required that a nitrogen and oxygen gas mixture be injected at the bottom
of the column
Condenser The more volatile product
GAS
Nz+ O2 mixture
Residual product (N2+ O2)GAS
LIQUID
Figure 28 Producing nitrogen by utilizing a distillation column with no vaporizer [5]
Gaseous nitrogen is obtained at the top of the column whereas a residual liquid mixture rich in
oxygen is obtained as a byproduct at the bottom of the column
By injecting a liquid oxygen and nitrogen mixture instead of a gaseous mixture at the bottom
of the column would make distillation impossible because there will again be only be one
phase (liquid phase) present
Thus to summarize when producing oxygen a liquid mixture of oxygen and nitrogen and a
column equipped with a vaporizer at the bottom is required To produce nitrogen a gaseous
Electrical Electronic and Computer Engineering 15
Chapter 2 Cryogenic Air Separation
mixture of oxygen and nitrogen as well as a column equipped with a condenser at the top is
needed a byproduct rich in oxygen will also be produced in this instance
By stacking the columns presented in figures 27 and 28 on top of one another and by
routing the oxygen rich liquid which is obtained at the bottom of the nitrogen column to the
top of the oxygen column it is possible to produce oxygen and nitrogen by using only a
condenser as shown in figure 29
An oxygen rich liquid enters the top of the upper distillation column and through distillation
results in liquid oxygen (LOX) at the bottom of the same column Vaporization of the LOX
into gaseous oxygen (OOX) is realized by means of the heat exchanging that occurs between
the gaseous nitrogen (OAN) at the top of the lower column and the LOX at the bottom of the
upper column At the top of the upper column a waste product consisting of a nitrogen and
oxygen gas mixture is also produced
In practice the function of the condenser is fulfilled by a heat exchanger that ensures that
proper heat is carried over from the OAN to the LOX and vice versa in order to enable
vaporization of the LOX and condensation of the OAN which is required for the continuous
operation of the distillation columns
In this model the columns are stacked on top of each other but it is also possible to place them
alongside one another as occasionally being done in practice
This concludes the discussion on distillation further explanation on this subject is beyond the
scope of this dissertation and the basic theory presented here should be sufficient and relevant
to understanding the selected material presented in this study
Electrical Electronic and Computer Engineering 16
Chapter 2 Cryogenic Air Separation
GOX ---shy
LOX l1li---shy
Condenser
GAN ---shy
Air
Oxygen rich liquid
Figure 29 Stacked column model that enables the production of oxygen and nitrogen
Electrical Electronic and Computer Engineering 17
Chapter 2 Cryogenic Air Separation
24 CONCLUSION
This chapter has explained the basic theory behind cryogenic air separation It details the
properties of air and compares the various technologies for producing certain air products
This chapter states the main processes of cryogemc air separation and they are air
compression air purification heat exchanging distillation and product compression These
processes as well as the interaction between them have been described
Distillation is the key process in cryogenic air separation and has consequently been given
special consideration to in this chapter The basic theory behind distillation as well as how this
applies to the separation of air have been elaborated on which should serve as a sufficient
reference for the remainder of this dissertation
Electrical Electronic and Computer Engineering 18
Chapter 3 Energy Management
CHAPTER 3 ENERGY MANAGEMENT
31 INTRODUCTION
Management is essential in any organized collaboration and should be implemented at all
levels of an enterprise (Koontz [14] et al) An organization has certain inputs to its disposal
be it human resources funds technology skills etc and it is the basic function of the manager
in charge to efficiently manage these valuable inputs in pursuit of achieving predefined
objectives in an optimum manner In an industrial plant like the cryogenic air separation plant
typical inputs are production personnel the various maintenance departments (electrical
mechanical instrument turbo etc) engineering financial and information technology among
others and all these resources are normally subjected to some form of management Energy is
another important input to the plant the plant needs energy to produce its products to the
clients specification and given that cryogenic air separation plants are energy intensive by
nature efficient energy management will have a definite impact in the cost per product
produced
For instance the oxygen plant at Sasol Secunda in South Africa is composed out of several
trains which col1ectively account for approximately 35 of the factorys total power
consumption In terms of the total operating cost of the oxygen plant itself the energy cost
constitutes 72 thereof compared to the 2 of labor costs and 8 of maintenance related
costs [15] This relatively large electricity cost is typical of cryogenic air separation plants
(also refer to Sarkar [6] and Gupta et al [9]) and it is quite possible to manage the usage of
energy in such a way as to ultimately reduce the cost per product produced
32 ENERGY MANAGEMENT AT CRYOGENIC AIR SEPARATION PLANTS
Turner [16] defines energy management as the control of energy consuming devices for the
purpose of minimizing energy demand and consumption Energy management is defined by
Janse van Rensburg [17] to be the perspicacious and efficient usage of energy Another
definition is that from Ottaviano [18] where energy management is defined as the reduction of
demand through conservation
Electrical Electronic and Computer Engineering 19
Chapter 3 Energy Management
The aim of energy management is defined by Thuman et al [10] as the reduction of energy
expenditure for the purpose of reducing the cost of a product so as to increase competitive
performance
With the various energy management definitions in mind one can come to the conclusion that
energy management is some sort of process ultimately resulting in reduced energy
expenditure How then would one go about describing this process which energy
management is In terms of energy management applied to cryogenic air separation plants
energy management may sufficiently be described as a transformation process and this will be
the topic of the next section
32 MODEL FOR ENERGY MANAGEMENT AT CRYOGENIC AIR SEPARATION
PLANTS
The Oxford dictionary [19] defines a model as a representation of reality a simplified
description of a complex system The model developed here serves as a generic framework for
energy management at cryogenic air separation plants and provides insight and understanding
of the energy management process as well as giving structure to this understanding it is a
product of systems thinking and takes on a holistic approach towards energy management A
basic outline ofthe model is presented in figure 31
External environment
Inputs
Resources Accomplished objectives
Figure 31 Basic outline of the energy management model
Energy management process
(transformation process) Outputs
Electrical Electronic and Computer Engineering 20
Chapter 3 Energy Management
The basic function of the energy manager is to transform the inputs (resources) in an effective
and efficient manner into outputs of higher value With the available resources as levers and
with the expected objectives in mind the energy manager has to convert the resources into the
pre-defined objectives by means of a transformation process This transformation process is
the organizational structure of the energy management program for which the management
thereof is the responsibility of the energy manager
The organizational structure of the energy management program is part of larger systems such
as the industry to which it belongs social systems economic systems and even the natural
environment and this is accounted for by the inclusion of the external environment Typical
inputs from the external environment are resources like capital skills facilities and people
and as shown in the figure the external environment is ultimately affected by the outcomes of
the energy management program
33 ENERGY MANAGEMENT SYSTEM THE TRANSFORMATION PROCESS
It is generally accepted that the fundamental components of management are planning
organizing staffing leading and controlling (Koontz et al [14]) Energy management is a
managerial action and most of these functions also apply to the energy management system
Figure 32 depicts the energy management model and states the components of the
transformation process
Through organizing the energy management program the energy manager gives it definition
and structure It mainly involves identification and classification of required activities and the
grouping of these activities in a structured and meaningful way
Planning involves the decision-making process This is where policies are set objectives are
determined and the strategies in attaining these objectives are established
Electrical Electronic and Computer Engineering
i L4502-7S
bH LczJ 717 ~
21
Chapter 3 Energy Management
Inputs Resources
- Capital
- Skills
- Facilities
- People
External environment
- Energy management structure C1et1m1t10Ilt~1
- Energy policy strategy
Hil- Human resource deployment
- Current situation evaluation
- Energy systems maintenance
- Energy management plan
Establishing standards
Performance measurement
Figure 32 The energy management model
Outputs Accomplished energy management objectives
- Reduced production cost
- PM maintenance strategies
- Improved plant design
- Improved production schedules
- etc
Electrical Electronic and Computer Engineering 22
Chapter 3 Energy Management
Leading refers to the process of influencing people so that they will strive willingly and
enthusiastically toward the achievement of energy management goals
Controlling is the measurement and correction of performance in order to ensure that
objectives and the plans devised in attaining them are being accomplished
These managerial functions make up the transformation process and in performing these
functions the energy manager enables an efficient and effective process for achieving energy
management objectives Analysis of each of these functions will be given in the chapters that
follow
34 CONCLUSION
In this chapter a model for energy management is given the energy management process is
modeled as a transformation process in which resource inputs are converted into outputs of
higher value
The model entails the transformation process its inputs and outputs and the external
environment as well as the interaction between all of these Inputs are resources like people
skills and facilities outputs are the accomplished energy management objectives like
improved preventive maintenance schedules optimized production schedules and reduced
energy cost
The external environment accounts for the higher-order systems to which the energy
management system belongs The transformation process involves the managerial functions of
organizing planning leading and controlling which are the core managerial functions the
energy manager has to perform Each function entails various activities and will be explained
in more detail in the chapters that follow
Electrical Electronic and Computer Engineering 23
Chapter 4 Organizing and Planning
CHAPTER 4 ORGANIZING AND PLANNING
41 ORGANIZING
With reference to general management Koontz et al [14] states that organization implies a
formalized intentional structure of roles and positions Generally organization involves 1) the
identification and classification of required activities 2) the grouping of activities necessary to
obtain objectives and 3) the delegation of authority for the means of managing these
groupings
With reference to energy management there should be an intentional and formal structure in
place for conducting a continuous and efficient energy management program The structure
presented in this study defines three groups of activities energy management planning
leading and controlling The activities under each grouping will be explained in the sections
and chapters that follow
42 PLANNING
Planning involves decision-making This is where courses of action are selected objectives are
set and strategies in attaining these objectives are determined The starting block of the energy
management program is the energy policy The energy policy is a statement or understanding
that guides or channels thinking it is an expression of the commitment plant management has
towards a continuous and effective energy management and sets the scope for energy
management strategies at plant level
43 THE ENERGY POLICY
Plant management should establish an energy policy that is in line with major policies in order
to ultimately add value to overall company objectives The energy policy at plant level may be
derived from a major policy and is therefore called a derivative or minor policy (Koontz et al
[141) Figure 41 shows the energy policy at various levels of the organization as well as the
scope of the policy at each of these levels
Electrical Electronic and Computer Engineering 24
C hapter 4 Organi zing and Planning
Company wide policy
Scope of company wide policy
incorporating all divis ions
Scope of divisional policy derived from
company poli cy
Scope of plant pol icy deri ved From the
divisional policy and made appl icable to
the plant
Figure 4 1 Energy policy at different levels o f the organi zati o n and the scope of the po licy at
each level
Thus the energy poli cy aL planL level is Lypicall y a deri vati on o f hi ghe r-orde r po li c ies Lhese
policies may be hi gher-level energy or environmental po li cies and has a much la rger scope
than the plant-level energy po li cy
As an example the sa fety hea lth and environmental po li cy of Sasol Secunda is a companyshy
wide policy
bull Compally-wide policy (Safety Health and Environll1el11al Policy)
Electrica l E lecLronic and Com pULer Eng ineering 25
Chapter 4 Organizing and Planning
We are committed to responsible utilization of natural resources and we will manage our
company wherever we do business in an ethical way that strikes an appropriate and well
reasoned balance between economic social and environmental needs [20]
From this policy it can be seen that Sasol recognizes its responsibility towards the
environment and also states that intentional effort concerning the balance between economic
and environmental issues will be instated by means of managerial actions which is also where
the high-level energy policy may stem from
bull Division-wide policy
To manage the SasollElectricity Supply Industry interface so as to minimize the total cost of
energy for the Sasol group of companies Further to this to promote energy efficiency and
reward energy management success by decentralizing accountability for electricity costs and
by aligning internal electricity tariff structures with the Eskom marginal rate [21]
From the above an energy policy at plant-level may now be derived
bull Plant-wide energy policy
We at oxygen plant are committed to responsible energy usage and endorse efficient energy
management practices in order to optimize our energy consumption
The energy policy normally consists out of three components the declaration of commitment
mission statement and specific objectives To illustrate the difference between these the
division-wide policy [21] will be taken as an example The mission statement defines the
scope of the energy management program and as can be seen in this case it has been included
in the declaration of commitment
Electrical Electronic and Computer Engineering 26
Chapter 4 Organizing and Planning
The specific objectives are the means for achieving that stated in the mission statement and
from the same example some objectives are
bull Develop ways of getting all stakeholders involved in energy management
bull Implement and continuously improve world-class best practice energy management
within our operations
bull Pioneer cross-functional and cross-divisional collaboration within the group of
companies
bull Facilitate the creation of an enabling environment which leads all key role players
agreeing to and achieving stretched targets
bull Develop and maintain the electricity measurement system within the group of companies
44 THE ENERGY POLICY STRATEGY
With the energy policy in place the logical next step would be to formulate a strategy in order
to realize the vision as expressed by the policy The energy policy strategy effectively
encapsulates the plan for changing current reality into future vision and in doing so the
following activities need to be addressed
bull deployment of human resources
bull current situation evaluation
bull energy systems maintenance
bull energy management planning
bull establishment of measurement and control indicators
These are the constituents of the energy policy strategy and each will be elaborated on in the
sections that follow
Electrical Electronic and Computer Engineering 27
Chapter 4 Organizing and Planning
441 Deployment of human resources
Plant management should appoint a dedicated person for taking the responsibility of driving
the energy management program This person should be knowledgeable of the technology
used in cryogenics and be experienced in energy auditing and management This person
should also assist plant management in adjustingrefining the current energy policy in order to
make sure that it adds value and makes allowance for the holistic approach of energy
management
Koontz et al [14] defines two types of policies namely intended policy and actual policy
Initially plant management may have had no intended energy policy but by agreeing upon the
appointment of a dedicated energy manager to drive an energy management program they
have in actuality instated an ill-defined energy policy and it is the task of the energy manager
to now properly structure and formalize the energy policy in conjunction with management
442 Current situation evaluation
The current situation of the plant is assessed by means of an energy audit process Energy
auditing is an important phase of the energy management program and the success of such a
program to a large extent depends on how well and to what extent the energy audit was done
(Thuman [22] and Ottaviano [18]) After all the plant first has to know itself before it can
correct itself The aim of the auditing process is to establish the relative position of the plant
from an energy management point of view
Auditing is not a once-off process instead it should be done on a regular basis so that the
energy manager can make the value-adding decisions regarding corrective measures The
outcomes of the auditing process are the following (refer also to Ottaviano [18])
bull assessment of energy consumption and energy usage patterns
bull identification of potential improvement opportunities
bull assessment of energy norms
Electrical Electronic and Computer Engineering 28
Chapter 4 Organizing and Planning
bull employee awareness
bull feasibility of potential energy projects
4421 The energy audit process
The audit process consists out of the energy audit policy and the energy audit strategy The
energy audit policy sets the scope for what to audit whereas the energy audit policy strategy
states how this would be done
The audit strategies are the means for conducting the energy audit and the relative position of
the plant with regard to energy management is determined through the evaluation of certain
plant efficiencies as listed by Senekal [23]
bull Management efficiency
bull Maintenance efficiency
bull Operating efficiency
bull Design efficiency
bull Storage efficiency
bull Information efficiency
These efficiencies are determined from an energy management perspective and a holistic
approach to energy management lies in managing available resources in such a manner as to
optimize all these efficiencies
4422 The plant efficiencies
The cryogenic air separation plant like any other enterprise aims to convert resource inputs
into outputs of higher value For the cryogenic air separation plant typical inputs are capital
employees skills and technology and the common goal is to convert these inputs into products
Electrical Electronic and Computer Engineering 29
Chapter 4 Organizing and Planning
like oxygen nitrogen andor rare gases to customer satisfaction This conversion is done with
some amount of efficiency loss and in optimizing the overall efficiency necessarily means a
higher level of output with the same amount of input
Each department within the plant contributes to the overall efficiency loss and the contribution
energy management has is assessed in terms of the efficiencies already listed
Plant structure from energy management perspective
Management Maintenance Operating Design Storage Information
efficiency efficiency efficiency efficiency efficiency efficiency ~ ~ ~
~ ~ ~ - ~ ~ - v
-- - - -
Quantity of output product Resources
per unit of electrical cost
Figure 42 An illustration of efficiency losses inherent to the plants structure from an energy
managers perspective and how they collectively contribute to the ultimate quantity of output
product per Rand of electrical cost
In order to assess these plant efficiencies certain strategies should be employed but first an
explanation on what each efficiency entail will be presented
bull Management efficiency
Management efficiency is determined in terms of the commitment plant management has
toward energy management The level of this commitment should be determined and is a
function of the following
bull The existing energy policy
bull Amount of resources allocated for energy management
Electrical Electronic and Computer Engineering 30
Chapter 4 Organizing and Planning
The energy manager should determine whether there is an existing energy policy in place and
also establish on which level this policy originates from Next it should be determined
whether this policy has been derived to plant level and also whether it has been applied at this
level The extent of this application should also be determined Le are there any strategies
outflowing from this policy Have any resources been committed Have they been
implemented Are they relevant and in scope
bull Maintenance efficiency
The maintenance efficiency is determined by the extent of intentional consideration given to
the optimization of energy efficiency of relevant equipment in existing maintenance life plans
Maintenance efficiency goes hand in hand with energy systems maintenance which will be
dealt with in more detail later on in this chapter
bull Operating efficiency
By taking the system just as it is and not altering any design features try to obtain the most
efficient system operation This could mean changing process schedules or consolidating plant
activities
As mentioned by Senekal [23] the operating design and storage efficiencies are very closely
related and in most of the cases by changing one it would have an influence on the other two
These three efficiencies may be determined by means of utilizing a mathematical model
which is a specific audit strategy and will be discussed later on
As an example of operating efficiency consider an oxygen plant that has electric motor driven
compressors as well as steam turbine driven compressors During peak hours steam is cheaper
than electricity which means that just by changing production schedules of the electric andmiddot
steam trains during these times (increasing production of the steam trains and lowering that of
the electric trains) significant energy cost savings may be realized
Electrical Electronic and Computer Engineering 31
Chapter 4 Organizing and Planning
bull Design efficiency
Design efficiency entails the evaluation of the plants efficiency by taking into account the
systems design Restraining factors in the design are identified and by altering design
parameters the auditor can determine possible ways of optimization These design
deficiencies are normally the cause of
bull Inadequate design from an energy managers point of view
bull Inefficient equipment - a cause of equipment deterioration andor the availability of
improved and more energy efficient technology
For example at one plant motor-generator sets are used for bringing the large air compressor
motors up to speed The MG sets were installed twenty years ago and compared to soft starter
technologies available today are much more unreliable The unreliability of the MG set
caused numerous startup delays in the past resulting in significant production losses with the
implication that production department insisted that the air compressors be kept online even
when product demand is low This decision acts as a barrier to potential energy savings that
lies in taking an air compressor off-line when demand is low Thus by changing the original
design through introducing better technology (implementing better soft starter technology)
may lead to potential energy cost savings
bull Storage efficiency
Often there are cost saving opportunities by using storage facilities more efficiently This can
be seen in the case were the plant has a LOX tank facility to its disposal Excess LOX can be
pumped to the tank during off-peak times and can then be used later on to supplement the
demand during peak times Because there is now an extra supply channel it leads to the air
compressors having to produce less compressed air and ultimately results in energy cost
savings
bull Information efficiency
Information efficiency refers to the availability and nature of the relevant information
Electrical Electronic and Computer Engineering 32
Chapter 4 Organizing and Planning
necessary for conducting the energy management program Correct and accurate information
is vital to the energy management program and the energy manager must make sure that
relevant information is easily accessible
For instance data concerning the state (flows pressures temperatures purities etc) of air
commodities within the plant and each of the respective trains is crucial performing certain
energy management activities and barriers restricting the accessibility and availability of this
information should be addressed and overcome if the energy management effort is by any
means going to be successful
4423 Energy audit policy
The audit policy scopes the auditing work to be done and basically serves as a guideline in the
auditing process It is advisable to establish a formal energy audit policy because it gives
direction to the audit process and for the holistic approach this policy should enable the
assessment of all the relevant plant efficiencies mentioned earlier
4424 Energy audit strategy
In order to determine the plant efficiencies as stated in the audit policy audit strategies are
utilized and those that are most relevant are (also refer to Turner [16])
bull Familiarization with plant characteristics and operation
bull The questionnaire
bull The walk audit
bull The measurement audit
bull Database building
bull Mathematical model
bull Financial analysis and feasibility studies
Each strategy will now be looked at in more detail in the sections that follow
Electrical Electronic and Computer Engineering 33
Chapter 4 Organizing and Planning
bull Familiarization with plant characteristics and operation
For the audit to bear meaningful results the energy manager should first attain a relatively
thorough understanding of the characteristics of the plant as well as its production policy This
entails the following
bull Understanding of operating characteristics and production policy This also
includes identifying the input and output streams to and from the plant
bull Construct relevant process flow diagrams - This includes process models of the
plant and relevant sub-systems Also identify and make a list of all the energy
consuming components include attributes such as equipment ratings purpose of
equipment and quantity of each
bull Establish the user requirements for the plant and critical sub-sections
The key principles in plant familiarization will now be applied by taking the oxygen plant at
Sasol Secunda as an example
o Understanding ofoperating characteristics and production policy
The oxygen plant is part of a process chain and to have an idea of where it fits into the overall
system the following two tables shows the inputs of and outputs to and from the oxygen plant
Table 41 Details surrounding commodity inputs to the oxygen plant at Sasol Secunda
Water works
Distribution
and Plant air Air utilities
Electrical Electronic and Computer Engineering 34
Chapter 4 Organizing and Planning
Table 42 Details surrounding commodity outputs from the oxygen plant at Sasol Secunda
upplying various factory loads
The plant is running at full load twenty-four hours per day seven days a week All the outputs
must be produced with minimal stoppage The plant also incorporates a very useful buffer
system a LOX tank which is supplemented with excess LOX at times when oxygen demand is
relatively low or whenever there is spare capacity available The LOX tank serves the purpose
of supplementing oxygen demand at peak times when the available capacity isnt able to
match the demand Because atmospheric temperature plays such an important role in
producing excess LOX this commodity is usually fed to the LOX tank overnight when
temperatures are relatively low
There is a balance to be maintained in producing the various products which means that a
change in major output streams has a definite influence on the other output products There is
however priority assigned to the production of each commodity detailed in table 43
Table 43 Prioritization of output products of the oxygen plant
Priority Product Implication of production loss 1 (highest) Oxygen amp Nitrogen Substantial production loss 2 Nitrogen Substantial production loss 3 Instrument air Non-critical plants trip 4 (lowest) LOX Production loss at KryptonXenon plant
Electrical Electronic and Computer Engineering
I
35
Chapter 4 Organizing and Planning
CJ Construct relevant process flow diagrams
The oxygen plant comprises of seven oxygen trains as well as a spare oxygen compressor and
the outline of the plant is shown in figure 43
Oxygen Plant
HP02
507 200 Nm3h and 985 purity
~
l~ 0 72 200 Nm3h I
Air Inbull Train 1 I II 1middot O2 72200 Nm3h middot middot I Air In
Train 2 II ~
I middot bull I
0 72 200 Nm31h middot middot Air Inbull Train 3 I I ~ bull ~
72 200 middot middot Nm(when online)
I LPO LP~ HPAIR I
COMMON middot middot COMMONbull Spare Train bullbull middot I HEADER HEADERmiddotI I middot middot middot
HP02 middot middotbull I ~
COMMON HEADER
I middot
Air In Train 4 bull middot
middot middot I
O2 72200 NmJh II middot ImiddotI middot Air Ini bull Train 5 I I 0 72 200 NmJh ~
bull bull I
I middot middot Air Inbull Train 6 I i 0 72 200 Nm3h HI bull
middot ~middot middot Air Iny Train 7 II I I
I ~ 0 74000 Nm________________________________J
Figure 43 Basic outline of the oxygen plant at Sasol Secunda The flows presented here are
the steady state maximum amounts of oxygen that each train is able to produce
Electrical Electronic and Computer Engineering 36
Chapter 4 Organizing and Planning
The trains are linked by means of three common headers the air LP oxygen and HP oxygen
common headers Each train can sustain a continuous production of up to 72 200Nm31h of
oxygen except for train 7 which has a slightly higher capacity (74 000Nm31h) resulting in a
collective maximum production capacity of 507 200Nm31h for the plant
The main product high purity gaseous oxygen is produced at 985 purity (minimum) which
is pumped into a common header and distributed to the various loads within each factory
(gasification and gas-reforming)
The main purpose of the air common header is to minimize losses whenever an air compressor
goes offline In normal operation however there is little or no air exchange between trains but
as soon as one air compressor goes offline the air present in the common header supplies that
trains air demand Trains 1-6 are connected to the air common header with train seven
working in isolation Usually the air valve of train seven remains closed it is only in abnormal
circumstances that it is opened but then only by a relatively small amount
A control system monitors and controls the production of compressed air and it does this by
monitoring the compressed air demand and then opening or closing the guide vanes of all six
compressors by an equal amount thus effectively sharing the load equally between the six air
compressors
The spare train consists only of an oxygen compressor and is put online whenever one of the
other oxygen compressors is taken out of operation (eg due to breakdown or for routine
maintenance) Each train has two oxygen outlets namely the high-pressure (HP) outlet and
the low-pressure (LP) outlet In normal operation the trains LP oxygen output is isolated from
the LP common header via a valve but as soon as that trains oxygen compressor is out of
operation the valve opens enabling the LP oxygen to enter the common header and the spare
oxygen compressor goes online
Electrical Electronic and Computer Engineering 37
--
tTl (l) () qshy(i ~ -shytTl (l) () qshy0s ()
sect CJ (1 0 gs tTls
(J(l
Ei (l)
~ Er
(J(l
w
(1r
Excess N2 toatm i
HPN1
Dry air
to factory
Main heat ExchanJ2cr
--------------
=-t--n rI
----n
-
-_ -- J
~Waste N2
1
Coldbox
LOX
TIciQ Air from s -- atmosphere
-- n -
-------- ~
f p0 () (l)
=shy0 ~ 0 ~
s (J(l
(l)
0
~ (J(l (l)
s qshy1
1
Air Water Tower Dryer Dryer
1 2
ChilI Wet air LP02
Water Tower
~ sect
HP02 N (to factory) s
(J(lLPN1
sect CJ
IA g (to factory) ~ ss
Smiddot (J(l 00
Chapter 4 Organizing and Planning
Figure 44 shows the process flow of a single train All the electric utili zi ng equipment are
highlighted Note the quantity and process requirements are also brought onto thi s process
flow diagra m for example (112) means that process requirements need one of the two
installed equipment types during normal operati on
Table 44 Summary of electri cal machinery ratings and capacity requirements for production
means
QuantityO2 Production Operating Motor description Rating requirement QTY
train online
timeday
Expansion turbine motor 525 kW 2 1 24 h
Nitrogen blower motor 300 kW 2 1 24 h
Oxygen compressor motor 137 MW I 1 24 h
Air compressor motor 37MW I I 24 h
Chi ll water pump motor 75 kW 2 1 24 h
Water pump motor 132 kW 2 1 24 h
Jack- up oil pump motor 36kW 2 1 24 h
Installed capacity 52836MW
Utilized capacity 51678MW
Utilization 980
o Establish Ihe II ser requirements
Table 4 5 li sts the user requirements for the oxygen plant s output products
Table 45 Summary of the user requ irements for each product
Product Quantity Purity Delivery p Delivery p (kNm1t) (min) (min) kPa (max) kPa
Oxygen 72000 985 3440 3480 Nitroen 22000 999 420 430 LOX 3500 - 100 120 IA 8000 - 420 450
Electrical Elec troni c and Computer Engineering 39
Chapter 4 Organizing and Planning
bull The questionnaire
In conducting the energy audit the energy manager would undoubtedly find it necessary to
conduct interviews with key personnel The questionnaire is a structured and well-planned
approach in acquiring important information from personnel and it is imperative to identify the
appropriate personnel when conducting the audit For example determining maintenance
practices by interviewing production personnel would in most cases give a distorted picture
of the actual situation or in other instances not bear any meaningful results at all
It is very important that the questionnaire is planned thoroughly in advance The energy
manager should aim to attain as much information as possible with the least amount of
questions since personnel do not always have adequate time available
bull The walk audit
The walk audit goes hand-in-hand with plant familiarization and it enables the energy manager
to view the plant first hand It entails determining the state of the plant and in order for the
energy manager to make this audit value adding it would be a good idea to also take a guide
along one who is experienced with the equipment and the operation of the plant
bull The measurement audit
Relevant measurements of energy consumption flows pressures and temperatures can be
taken whenever there is no automatic measurement system in place but at most of these plants
real-time data collection is in place and data may simply be downloaded from were it is stored
bull Database building
Because the audit process is such an important phase in the energy management program all
the data collected should be stored for easy reference The database is a collection of various
pieces of information in different formats and it is thus important to have a structure in place
in which the information is organized in a meaningful manner The database should compose
Electrical Electronic and Computer Engineering 40
Chapter 4 Organizing and Planning
of the following
bull Results from other audits conducted
bull Specifications of machine ratings
bull Process amp equipment limitations and constraints
bull Operating schedules of plant
bull Maintenance strategies and schedules
bull Financial analysis and feasibility studies
One output of the energy audit process is the identification of potential improvement
opportunities and in response to this the energy manager is now concerned with identifying
alternatives as the means for realizing the different improvements
Normally most of the options would require capital investment to realize and the problem is
that the benefits resulting from an investment option is stretched over a period of time whereas
the investment is required now Thus feasibility studies are conducted with the aid of financial
analysis tools and only the most feasible option for each alternative should be considered
bull Energy conversion model
The energy model is an important auditing tool and adds great value to the energy
management program The basic idea behind the energy conversion model is to express the
plants power consumption as a function of main air product output under certain conditions
From the cryogenic air separation plants point of view a fairly accurate model may be very
complicated but it will be the aim of this section to present model building blocks that are
relatively simple whilst still providing adequate accuracy
As Delport [24] mentions there are basically two levels within process modeling The first
level is the physical model which is the energy managers understanding of the real world
Electrical Electronic and Computer Engineering 41
Chapter 4 Organizing and Planning
system in conjunc ti on with the follo wing restraining factors
bull assumptions and simplifi cations that are in line with the model acc uracy and
requirements
bull level of detail that has been decided upon
bull system and subsystem boundaries
bull data requirements and avail abi li ty
The second level in process modeling is the energy conversion model which is the
mathematical representati on of the physical model The difference between the physica l model
and energy conversion model should be noted the physical model is an abstracti on of the real
world system and the energy conversion model is an abstraction of the physical model
In order to deri ve an energy model for the plant the plant first needs to broken down into its
various levels of subsystems as shown in fi gure 45 It should be noted that the air purifi cati on
system and all other au xili ary equipment have been omitted from thi s system breakdown thi s
is because it is assumed that the energy loss th rough the purification system is negli gible and
the energy consumption of all other auxiliary equ ipment is insignifi cant compared to that of
the compressor motors It may be th at in certa in plants the auxiliary equipment may not be
insignifi cant at all in these situati ons the energy manager is urged to deri ve models fo r these
subsystems as we ll
Whole CRYOGENIC AIR SEPARATION PLANT
Industry
EndmiddotUser Trains 1 to n
Groups
Processes Air Compression
Air Separation Process Product Compression
System Systelll
Machinery Air
Motor Air purifi cation Main Heat Distillation Product
Motor Compressor system Exchanger Columns Compressor
Figure 4 5 Simplified system breakdown structure of the cryogenic air separati on plant
Electrical Electronic and Computer Engineering 42
Chapter 4 Organizing and Planning
From figure 45 the following is clear
n
P =p (1)plant ~ train m
m=
where
bull n is the number of trains
bull Pplant is the power consumption of the cryogenic air separation plant (MW)
bull Ptrain m is the power consumption of train m (MW)
Neglecting power consumption of auxiliary machinery the power consumption for each endshy
user group will be as stated in equation (2)
P =P +P (2)train m ACm PCm
where
bull PACm is the input power of air compressor motor of train m (MW)
bull PPCm is the input power of product compressor motor from train m (MW)
The input power for a compressor motor is
pslUlft
P xm (3)xm
where
bull x refers to the motor of a compressor type x ie the motor driving the air or
product compressor
bull m is the train number
bull Pxm is the input power of type x compressor motor of train m (MW)
Electrical Electronic and Computer Engineering 43
Chapter 4 Organizing and Planning
bull p~ft is the shaft power (output power) of type x compressor motor of train m
(MW)
bull lm is the electromechanical efficiency of type x compressor motor of train m
It is a fact that when a gas is compressed its temperature rises significantly and if this increase
in temperature is too much it would cause the oil to ignite and deteriorate mechanical parts
This places a restriction on the compression ratio (ratio of absolute outlet pressure to absolute
inlet pressure) of the compressor and hence this ratio is rarely greater than three (Air Liquide
[5])
Because of this constraint multi-stage compression with inter-cooling is implemented to
achieve the required output pressure Inter-cooling is normally realized through either air- or
water-cooling however air-cooling is normally limited to smaller size compressors Watershy
cooling is the more effective of the two because of its ease of control and greater heat
absorption capability (Talbott [25])
Another reason for employing multi-staging in compressors is because of its energy saving
attribute the energy saving is achieved because cooling the air down between stages reduces
the inlet air volume of the next compression stage and hence the work required to complete the
compression (Salisbury [26] and Talbott [25])
The operation of the multi-stage compressor can be followed by referring to the pressureshy
volume diagram in figure 46 The area enclosed by 1-2-3-4 represents the adiabatic work to
be done by the compressor to compress a gas from a pressure of PI to P2 The area demarcated
by 1-2-5-4 represents the necessary work for isothermal compression
Electrical Electronic and Computer Engineering 44
Chapter 4 Organizing and Planning
Isothermal Adiabatic compression compression
p
~__________~~__+-______~~~2
v
Figure 46 Multi-stage compression cycle with interstage cooling (Coulson et al [27])
Because the gas inlet temperature at each stage stays constant one can see that actual
compression takes place near the isothermal curve Thus a simplifying assumption would be
to approximate the compressor characteristic by assuming isothermal compression
Thus the shaft power required by the compressor will be as expressed by equation (4)
(4)
where
bull P =output power of type x compressor of train m (MW)
bull 1] =isothermal efficiency of type x compressor of train m xm
Electrical Electronic and Computer Engineering 45
Chapter 4 Organizing and Planning
The output power of the compressor is a function of the intercooler temperature the air flow
and the pressure ratio and for isothermal compression this relationship is expressed as in
equation (5) (refer to Baumeister et al [28] amp Salisbury [26])
out pout = kxQ xl xln Pm (5)xm xm Ie In( Pxm
where
bull Qxm is the gas flow from compressor of type x of train m (kNm3h)
bull 0c is the intercooler temperature (K)
bull P~~ is the gas absolute output pressure of type x compressor of train m (kPa)
bull Pm is the absolute inlet pressure of type x compressor of train m (kP a)
In cryogenic air separation air is separated into its constituents and only by knowing the
constituent ratio of the main air product in a sample of air it is possible to determine the
airflow at the input of the train
QACm = (6a) rmain product
where
bull QACm is the air flow from air compressor of train m (kNm3h)
bull Qure is the total flow of (pure) main air product that originally entered the air
compressor of train m (kNm3h)
bull rmain product is the constituent ratio of the air product in a sample of air For oxygen
this ratio is 209 and for nitrogen this is 780 refer to table 21
Electrical Electronic and Computer Engineering 46
Chapter 4 Organizing and Planning
If there exists an air common header connecting all the trains the main output product may not
necessarily be a result of solely the airflow at that particular trains input since air exchange
between trains does occur and even more so in the case of an air compressor being out of
operation A good approximation would be to average out the total airflow over all the trains
In this case equation (6a) takes on the form of equation (6b)
(
= 1 ~QPureQ (6b)
ACm t- m nrmain product Jm=
The main product is rarely 100 pure there is to some acceptable extent impurities present
in the substance as well Secondly this product is produced with some amount of loss within
the air separation process this loss is quantified in terms the recovery efficiency Thus to
obtain the total flow of the pure product that originally entered at the air compressor side
Purity QPure =Q x main productm (7)
m PCm TJ recm
where
bull Qpcm is the flow rate of the main product from product compressor of train m
bull Puritymain productm is the purity of the primary output product of train m
bull TJrecm is the recovery efficiency of which the air separation process recovers the
primary constituent of air that originally entered the process
It is now possible to compute the air flow however the air discharge pressure is still needed
for computation of the compressor power consumption There is a definite relationship
between the air discharge pressure and air flow and this relationship is defined by the system
characteristic The system needs a specific discharge pressure at a certain flow rate from the
Electrical Electronic and Computer Engineering 47
Chapter 4 Organizing and Planning
air compressor and the relationship between these two parameters in the normal operating
region of the compressor may be approximated quite accurately by a linear model as shown
in figure 47
Thus discharge pressure as a function of air flow will be as shown in equation (8)
out h Q (8)PACm = m +gm ACm
where hm and gm are the constants for train m and may be determined by means of linear
regression
Compressor Surge line characteristic at
different modes of operation
System curve
Linear approximation
Flow
Figure 47 Linear approximation of system curve
Electrical Electronic and Computer Engineering 48
Chapter 4 Organizing and Planning
Although cryogenic air separation trains may have been designed in exactly the same manner
it is a fact that over time they drift in their parameter commonalities and by applying modeling
parameters in one train to other trains as well would ultimately result in high inaccuracy of the
overall plant model Thus certain parameters of the model should be done empirically train by
train Empirical modeling should be sufficient only for all the critical elements of each train
which include
bull electromechanical efficiency of each compressor motor
bull isothermal efficiency of the air and product compressor
bull recovery efficiency of the air separation process
Determination of the electromechanical efficiencies should be enabled through employment of
the correct maintenance strategy as will be discussed in the next chapter If there is no initial
data available concerning the current state of the motor an assumption should be made at first
The recovery lrecm is a symptom of the current state the ASU thus essentially modeling this
system it is determined by taking the average over a sufficient sample period
The isothermal efficiency of the compressor is a function of the gas flow pressure and
intercooler temperature The pressure range in which these compressors are suppose to operate
in is usually relatively small and the empiric modeling of the isothermal efficiency may be
approximated quite accurately by a linear model
out
n - xQ +b x Pxm + xT +d (9)IIxm - axm Xnl xtm -- cxm Ie xm Pinx
where a bull b bull e bull and d bull are constants of compressor type x of train m and arex m x m x m x m
determined by means of linear regression Multiple variable linear regression techniques like
Electrical Electronic and Computer Engineering 49
Chapter 4 Organizing and Planning
for example that described by Makridakis et al [29] should be utilized in determining the
constants If there is no empirical data available for the compressor motors as yet the motor
efficiency and the isothermal efficiency of the compressor may be lumped together (ie
making it one system) and this overall efficiency is then empirically modeled as in equation
(9) this means that the model then (equation 9) encapsulates the compressor efficiency as well
as the motor efficiency
Substitution of these equations leads to the final energy conversion model stated in equation
(10) For a discussion on the application and verification of the abovementioned energy
conversion model the reader is encouraged to refer to the case study presented in the
appendix
h + gm xPUritymainproducmJj[tQ xuritYmain proliuctm Jx~ xln__k_(~Q _m nrmain product =1 PCm Teem
nrmain producl ~ mel ~
reem K
[ m
PACrn
______________~--__-shy__~__________--~--------~) (10)
pp1an t m=J
ACm x [aAcm xQACm +bACm XP~~m + CACm X~C +dAcmJ PinIIC
kxQPCm X~C Xln[ P~m J + PK~
PCm x (apcm x QpCm +bpcm X pPm +CKm X~C +dpcmJ tnPC
443 Energy systems maintenance
There is a definite relationship between maintenance management and energy management
and in most cases one would find that by initiating an action in one would have a definite
effect on the other In fact Turner [16] has gone one step further and expressed the need for
energy systems maintenance Energy systems maintenance is defined as the maintenance of all
systems that use or affect the use of energy
Formulation of an energy systems maintenance life-plan as well as the management thereof is
the responsibility of the energy manager and later on it will be explained on how to assemble
such a plan The output of this maintenance effort is a recommendation and it is up to the
Electrical Electronic and Computer Engineering 50
Chapter 4 Organizing and Planning
energy manager to assist maintenance managers in adopting an energy systems maintenance
component into their life pans which would enable them to consider such a recommendation
In formulating an energy systems maintenance strategy the energy manager first has to
consider and understand at which point it is appropriate to initiate a suitable maintenance
action on relevant equipment To aid explanation to this question refer to figure 48 from an
energy management point of view this system experiences a functional failure A functional
failure is defined by Campbell [30] as the inability of a physical asset to deliver its expected
level of performance In terms of energy management this expected level of performance is
given in the form of an energy norm or standard The expected level of performance thus
defines what can be considered a failure
Engineering standard 1-----------__ ----------------------shy
Flaw in compressed air pipe
Leakage of compressed air
Energy management standard
General maintenance standard Minor leakage
Production standard Major leakage
Time
Figure 48 Functional failures and performance standards
Different departments within the plant (engineering maintenance production) may differ in
asset performance requirements and thus giving rise to the different standards In this example
the flaw in the compressed air pipe causes a leakage of compressed air leading to a decrease in
energy efficiency and money could be saved by initiating a maintenance action sooner than as
scheduled by maintenance department
Electrical Electronic and Computer Engineering 51
Chapter 4 Organizing and Planning
The energy norm or standard thus defines the not only what should be considered a failure but
also the amount of maintenance needed to preserve this level of performance
The difference in standards frequently creates conflict between various departments and when
initiating an energy cost saving maintenance action the energy manager should first reach a
compromise with the different departments For example the electrical maintenance
department of one plant reported high maintenance costs on the oxygen compressor motors
Maintenance department reported that the motors were at the end of their life-cycle and
blamed the more frequent maintenance intervals as the main cause of the rising cost An
energy audit also revealed that the motors lost an average of 9 electromechanical efficiency
from their initial value which gave rise to increased energy cost as well
Considering these two factors an oxygen replacement project was proposed with immediate
commencement Production department however rejected the proposal because the plant
which already operated at full capacity would suffer significant production losses during the
replacement action and proposed that the project should be postponed to a year from then
when an extra oxygen train currently being constructed at that time is in full operation to
which the parties agreed upon and thus effectively reaching a compromise
4431 Establishing an energy systems maintenance life plan
Because plant maintenance has such a significant effect on energy efficiency the energy
manager has to establish an energy systems maintenance life plan aimed at managing
electricity cost that would supplement existing maintenance efforts on the plant
Energy systems maintenance on only those systems that normally have a major impact on the
energy consumption of the train will now be discussed they are the air and product
compressors the air and product compressor motors and the ASU
Electrical Electronic and Computer Engineering 52
Chapter 4 Organizing and Planning
4432 Energy systems maintenance on compressors
Some of the major aspects influencing the energy efficiency of a compressor are the following
(Talbott [25])
bull Wear of mechanical parts
bull Component fouling
bull Contamination with impure substances
bull Inadequate or dirty lubricants
Wear of mechanical parts changes the characteristics of the compressor and ultimately leads to
decreased efficiency Mechanical wear also result from destructive effects dirt particles have
and it is crucial that filtration be kept effective and all inlet piping be kept clean
Fouling changes the flow and pressure relationship of the compressor and thus changing the
characteristic of the original design Even if a good filter is provided fouling is inevitable and
an obvious effect is the restriction of intercooler passages this not only causes poor heat
transfer between the coolant and gas but also leads to an increased pressure drop over the
intercooler resulting in reduced performance (lower efficiency)
Lubricated compressors depend upon oil for both friction reduction and sealing It is obvious
then that if the oil has to be contaminated or corrosive it would be destructive of both
efficiency and valuable capital equipment
4433 Energy systems maintenance on motors
The aim of energy systems maintenance on motors is to improve and preserve the motors
energy efficiency
The great majority of induction motors are used to drive pumps fans blowers and
Electrical Electronic and Computer Engineering 53
Chapter 4 Organizing and Planning
compressors attempting to increase the efficiency of these motors may well result in reduced
motor internal losses but this doesnt necessarily mean reduced input power unlike the case
for synchronous motors as also motivated by Htsui et al [31] Induction motors with a higher
efficiency normally run at a higher speed (lower slip) which ultimately leads to increased
compressor load (also refer to Sen [32]) Figure 49 shows a graphical representation of this
situation
bull The fan laws
Suppose that the existing motor (motor 1) is substituted by a new motor (motor 2) of higher
efficiency which inherently has a smaller full load slip motor 1 operated at operating point 1
(OP 1) and motor 2 now has another operating point (OP 2) The power curve of the new
motor intersects the system curve (compressor load) at a higher load speed resulting in the
compressor requiring more shaft power
Pz +---------------------~r-------~~~~-------------
sbaftspeed
Figure 49 Partial power curves of the existing motor (motor 1) and the new motor (motor 2)
as well as that of the compressor load illustrating the implication of installing a higher
efficiency motor than is currently in operation
Electrical Electronic and Computer Engineering 54
Chapter 4 Organizing and Planning
The reason for the load increasing with increased shaft speed is because of the compressor
conforming to the relationships expressed by the fan laws The following relationships are a
statement of the fan laws and are listed by Brown [33] The fan laws also apply to blowers
fans and pumps and the theory developed here may also be applied to induction motors driving
either one of these mechanical devices
Qan (11)
(12)
(13)
where
bull n is the shaft rotational speed (rpm)
bull Q is the gas flow (kNm3h)
bull P is the discharge pressure of the gas (kPa)
bull P is the power requirement of the compressor (MW)
Thus the gas flow is proportional to the shaft speed the discharge pressure is proportional to
the square of the shaft speed and lastly the compressor power requirement is proportional to
the cube of the shaft speed Equating the above relationships gives the following as stated by
Salisbury [26] and Baumeister et al [28]
(14)Q ~ Q(~J
p ~ p(~J (15)
(16)p~p(~J
Electrical Electronic and Computer Engineering 55
Chapter 4 Organizing and Planning
Were the 1 and 2 subscripts refer to the initial and new conditions respectively Thus by
knowing the compressor performance at one speed one may predict its performance at another
speed
Figure 410 shows a typical compressor characteristic curve as well as the characteristic at
other speeds other than the nominal
Surge line
Compressor characteristic at various speeds
Flow
Figure 410 Compressor characteristic curve at various shaft speeds
bull Energy efficiency analysis
At this stage it becomes quite obvious that there are two contradicting factors presenting
themselves if a higher efficiency motor is installed the motor internal losses have been
reduced but at the same time the motor is most likely to run at a lower slip leading to
increased shaft power demand
Electrical Electronic and Computer Engineering 56
Chapter 4 Organizing and Planning
Thus it becomes clear that an action aimed at reducing electricity cost by improving the motor
efficiency may not be as simple and the energy manager or person in charge should have a
means for quantifying the actual feasibility such an action would have
Installing a new motor for the aim of reducing electricity cost should only become an option
when at least the following statement is true
(17)
were Fnl and Fnz are the input power to motor 1 (current motor) and motor 2 (new motor)
respectively After substitution equation (17) becomes
ut 2 lt utI (18) 17mZx17D2 17m l x 17D1
where
bull utl and u12 are respectively the output power of the current and the new motor
at normal operating conditions
bull 17m and 17m2 are respectively the electromechanical efficiency of each motor
bull 17D1 and 17D2 are respectively the efficiency of the device (compressor blower fan
etc) at the operating point of motor 1 and that of motor 2
What is now needed is an indicator which would inform the energy manager on whether a
new high efficiency motor would consume less power than the existing one This indicator is
defined here as the threshold efficiency which is the efficiency the new motor should at least
have to be the more feasible option The inequality expressed in (18) can be rearranged to give
the following
17m2 gt 17ml (UI2 Jx( 17D1 J (19)ull 17D2
Electrical Electronic and Computer Engineering 57
Chapter 4 Organizing and Planning
The fan law implies that in changing the shaft speed of the compressor its efficiency stays
constant Le 17D2 = 1701 and by inserting equation (16) in (19) equation (20) is obtained
(20)
The operating speed of each motor is where the compressor load curve intersects each motors
power curve thus and may only be determined by actually plotting the motor curves nl n2
with that of the compressor load For the energy engineer to make a clear decision on whether
to upgrade motor efficiency it becomes clear that there should be a maintenance strategy in
place that result in the assessment of the motors current condition And as stated earlier this
assessment is made in terms of the motor efficiency as well as the power or toque curve of the
motor This assessment is the responsibility of the rewinder or the person responsible for the
refurbishment of the motor
The operating speed of the new proposed motor can be expressed in terms of its full load
speed and other known variables For low slip values the power curve may be approximated
by a linear relationship as shown in figure 411 which leads to equation (21)
(21)
where
bull subscript 2 refers to the new proposed motor
bull P2 is the output power (MW)
bull PFL2 is the rated full load shaft power (MW)
bull ns is the synchronous speed (rpm)
bull nFL2 is the rated full load speed (rpm)
Electrical Electronic and Computer Engineering 58
Chapter 4 Organizing and Planning
Motor power System Linear curve curve approximation
shaft speed
Fu1110ad
speed (nr)
Operating speed
(n)
Synchronous speed (ns)
Figure 411 Approximating the power curve with a linear model at low slip values
Applying the fan law by substituting equation (16) into (21) and rearranging to solve for n2
gives the following
(22)
This is a cubic equation and can be solved by applying Cardans solution [34] From Cardans
solution the equation has one real root and gives the approximate load speed the proposed new
motor will operate at
Electrical Electronic and Computer Engineering 59
Chapter 4 Organizing and Planning
Substituting (23) into inequality (20) gives the requirement in terms of its full load speed and
efficiency the new motor should conform to for it to be a more energy efficient option
bull Case study
Suppose the existing motor of figure 49 is considered for replacement This is a four-pole
137MW machine it is fifteen years old and have been rewound three times during its
productive life The decision to do a feasibility study comes after assessment of its current
condition which is detailed in table 46
Table 46 Current motor parameter values
Substituting these parameter values into (24) results in the graph depicted in figure 412 This
curve is basically a motor selection curve for selecting a new 4 pole 137 MW induction motor
as it houses the criteria for the proposed new compressor motor being more energy efficient
than the existing one Now suppose there are three suppliers of these motors as detailed in
table 47
Table 47 Three suppliers of a 4-pole 137MW induction motor with their respective ratings
I I
I Supplier Motor efficiency Motor rated full load speed 1 970 1492
I 2 960 1490 I 3 975 1496 I
Electrical Electronic and Computer Engineering 60
Chapter 4 Organizing and Planning
980 ltI~--~-------~---------lt-~------------------------------- Supplier Cbull975
Supplier A bull 970
tI 965 CI
~ 960 shy bullSupplier B Threshold line CI 955 -shy
CI ~ 95()-=a 945 ~
940
935
930 +-----------------------------------------1
14880 14900 14920 14940 14960 14980 15000
Full load speed (rpm)
Figure 412 Threshold efficiency proposed new motor should adhere to as a function of its
full load speed
As can be seen from the graph all three motors will in each case improve the energy
efficiency of the current compression system for they have ratings that enable them to be
above the threshold line
Now that we know that energy efficiency will be improved regardless of what motor is
selected the next step would be to quantify the energy saving in each case and obviously the
motor with the largest energy saving would ultimately be the most feasible option from an
energy managers point of view
Pinl and Pin2 have been defined in (8) and taking the ratio of these gives
or
Electrical Electronic and Computer Engineering 61
Chapter 4 Organizing and Planning
(25)
thus
(26)Power saving = pbullbull - P2 p+ - [ ~ )( J1 Substituting n2 of equation (23) into (26) gives the approximate power saving in terms of the
known quantities
Power saving =
Jj (27)
The results of each options power saving are listed in table 48
Table 48 Power saving for the different motors from the three suppliers
I Supplier Power saving I A 410kW
I B 260kW
I C 370kW
The motor from supplier A will be the most feasible option in terms of energy efficiency
although it doesnt have the highest efficiency
A condition-based maintenance strategy for the induction motors should be employed in
which the condition of the current motor is assessed either on an appropriate time base or
Electrical Electronic and Computer Engineering 62
Chapter 4 Organizing and Planning
when an opportunity arises to permit this The end-result of the motor assessment is the
threshold line which will be used as a reference for comparing the feasibilities of different
energy efficiency improvement alternatives
It is recommended that condition-based maintenance of this type only be done on the larger
motors where significant power savings are attainable which could justify the effort time and
cost involved in realizing this maintenance effort
bull An energy management tool for induction motor renewalreplacement
If an induction motor fails or experiences a functional failure is it better to refurbish it or
replace it with a high efficiency motor In most of the immediate circumstances
refurbishment is the more feasible option driven by the fact that it is approximately one fifth
the cost of buying a new motor On the other hand refurbishment in most cases refers to
rewinding and motors that have been rewound tend to be less efficient as also expressed by
Campbell [35]
By utilizing the maintenance strategy as presented in the foregoing section the energy
manager is in a position to make a fairly good decision between replacement and renewal
Suppose that the previously referred to 137 MW induction motors condition has been
assessed after each rewind and the threshold line after each assessment have been determined
as shown in figure 413
From the graph it can be seen that the threshold line changed with time and after each
assessment replacement seems to become a more and more attractive option
Electrical Electronic and Computer Engineering 63
96000
Chapter 4 Organizing and Planning
990
Supplier C InlYampI 98000
Supplier A shy lSI rewind Col 970
-bull shy-= ~ 2 rewind
Col Supp rB
IS lie bull~ -950 3rd rewindC -IS Q 940 --= -930==~
920
910
1486 1488 1490 1492 1494 1496 1498 1500
Fllll load speed (rpm)
Figure 413 Threshold lines of motor after every rewind
In conclusion the energy manager may recommend rewinding if the threshold line is near (just
above or below) that of the full load specifications of available motors and should recommend
replacement when the latter is sufficiently above the threshold line Lastly justifying motor
replacement will be a function of reduced energy costs as well as the projected maintenance
cost reduction
4434 Energy systems maintenance on distillation colnmns
The distillation column is made up out of distillation trays The basic function of these trays is
to enable contact of the descending liquid and the rising gas under the most favorable
conditions The mere presence of the trays provides the rising gas with a certain resistance
resulting in a pressure drop This pressure drop must be as small as possible for it has a
significant impact on the energy efficiency of the train Needless to say distillation trays have
a major impact on the energy consumption of the train as also pointed out by Biddulph [8]
Various technologies have been developed for reducing this pressure drop to the minimum of
Electrical Electronic and Computer Engineering 64
Chapter 4 Organizing and Planning
which distillation packing is the more recent and compared to the conventional sieve trays
are the more efficient as well (refer to chapter 2)
Deterioration of distillation trays are inevitable and possible damage may cause a decrease in
main product recovery efficiency and sometimes also increased pressure drop which
ultimately results in the train being less energy efficient
Maintenance on distillation trays are sometimes limited because of the large production losses
the plant would suffer during replacement but it is up to the energy manager to assess the loss
in energy expenditure and do feasibility studies on the relevant alternatives that would enable
upgrading of the columns energy efficiency
4435 Energy systems maintenance life plan
Table 49 shows an energy systems maintenance life plan based on the foregoing information
The condition of each major system is assessed in the control phase of the energy management
program and based on this assessment the energy manager is able to inform andor make
informed recommendations to the relevant maintenance department in case of the occurrence
of deviations
Electrical Electronic and Computer Engineering 65
Chapter 4 Organizing and Planning
Table 49 Energy systems life plan for the critical systems on the cryogenic air separation
plant
Compressor Motors
CBM off opportunity
based Contractor
(most likely)
motor
of motor condition
Compressor CBM on monthly Energy
manager
Inform relevant maintenance
dept on deviation and impact it has
Corrective action will be
enabled by relevant
maintenance dept
Distillation columns
CBM on monthly Energy
manager
Inform relevant maintenance
dept on deviation and impact it has
Corrective action will be
enabled by relevant
maintenance dept
444 The energy management plan
The energy management plan basically consists out of the long-range plan and the building
blocks that make up this plan which are the following
bull Primary objective
bull Specific objectives
bull Short term plan
bull Decisions surrounding project prioritization
bull Short term tactics
Electrical Electronic and Computer Engineering 66
Chapter 4 Organizing and Planning
Primary objectives are stated in the energy policy Long-range plans are the means for
achieving these objectives Thus long-range plans are the stepping-stones towards fulfilling
the vision posed by the energy policy A primary objective on its turn is a composition of
specific objectives and in achieving these objectives energy projects need to identified and
implemented Potential energy projects were already identified in the audit process and these
projects now need to be allocated to the relevant specific objectives and also prioritized
Normally mUltiple projects are required in fulfillment of a specific objective and
consequently there may be numerous projects listed under the short-term plan The energy
manager needs to assign priority to each project in order to ensure that the planned sequence
of events are structured in an optimally efficient manner
The short-term plan entails the decision-making with regard to which projects to implement
when for the next financial year The end result of the long-term plan ultimately depends on
the implementation of the short-term plans The short-term plan requires short-term tactics in
order to realize These short-term tactics are the actions and their timing that is needed to carry
out the short term plan
As an illustrative example consider the division-wide energy policy of Sasol presented in
section 43 [21]
bull Primary objective of the division-wide energy policy ofSa sol
To manage the SasollElectricity Supply Industry interface so as to minimize the total
cost of energy for the Sasol group of companies Further to this to promote energy
efficiency and reward energy management success by decentralizing accountability for
electricity costs and by aligning internal electricity tariff structures with the Eskom
marginal rate [21]
The underlined phrase is a primary objective of the energy policy and in order to realize the
decentralization of electricity cost accountability a few specific objectives first need to be
realized one such objective is stated in the list of specific objectives in the energy policy
Electrical Electronic and Computer Engineering 67
Chapter 4 Organizing and Planning
bull A specific objective ofthe energy policy
Develop and maintain the electricity measurement system within the group of
companies
A specific objective is realized through the implementation of a short term plan or
combination of short-term plans and for above mentioned specific objective a short term plan
is given in the next paragraph
bull Short term plan
o Upgrade existing measurement system on those plants that already have this
system in place
o Install measurement system on all energy intensive plants
o Establish a maintenance strategy for measurement system
o Make data freely accessible and
Actions and their timing are the tactics needed to carry out the short term plan and for the
underlined short term plan the short term tactics are as stated in the following paragraph
bull Short term tactics
o Finalize decisions surrounding data logger selection January 2000
o Order PTs and CTs for the measurement system - January 2000
o Install network connection in substations March 2000
o Install and commission data logger - May 2000
445 Measurement and control indicators
Now that there is an energy management program in place the energy manager has to decide
on how the progress and results of this program will be assessed Key performance indicators
have to be defined and energy standards need to be determined In the control function of this
Electrical Electronic and Computer Engineering 68
Chapter 4 Organizing and Planning
model the energy engineer will assess these KPIs and decide upon appropriate corrective
actions
There is one KPI that encapsulates the outcome of the whole energy management effort and
that is the energy cost per primary product output (RlkNm3) This is an important KPI as it is a
global indicator and by trending it over time the energy engineer is in a position to quantify
the impact of his energy management program however this doesnt mean that it is the only
one that should be monitored there need to be other indicators defined as well lower level
indicators that are more specific and are able to identify critical component inefficiencies
Critical system components are defined here as only that system components that have a major
impact on the energy consumption of the plant These system components include the
compressors the compressor motors and the air separation unit
The lower level KPIs should 1) indicate whether there has been a drift in system
characteristics and also 2) whether the system operated above or below expectation during the
past month It should be noted that only the means for determining the KPIs are presented
here and they will only be applied in the control function the energy manager has to fulfill as
detailed later on
Thus the following parameters are the important ones and need to be monitored
bull Electromechanical efficiency of the air and product compressor motors
bull Isothermal efficiency of each compressor
bull Recovery efficiency of each train
bull Specific energy of the plant (kWlkNm3 of main product)
With these parameters as the basis a key performance indicator will now be derived for each
Electrical Electronic and Computer Engineering 69
Chapter 4 Organizing and Planning
4451 KPI for determining the state of the compressor motor
The compressor motor efficiency has a significant influence on the overall efficiency of the
train therefore a key process indicator need to be defined for the compressor motors and this
KPI should comment on the degradation in motor electromechanical efficiency
Obviously it wouldnt make sense assessing this KPI each month and should therefore only
be assessed after each time the current condition of the motor has been evaluated
c llACmKPI (28)ACmaor = -i-
llACrn
where
bull m is the train number
bull ll~crn is the design efficiency of the motor ie the efficiency at the time when it
was initially installed
bull ll~crn is the current efficiency of the air compressor motor
The KPI of the product compressor motor takes on a similar form
(29)
where
bull KPlpcmotorrefers to the extent of deterioration within the air compressor motor
bull TJ~Cm is the design efficiency of the motor of train m ie the efficiency at the time
when it was originally installed
bull TJCrn is the current efficiency of the product compressor motor of train m
Electrical Electronic and Computer Engineering 70
Chapter 4 Organizing and Planning
4452 KPI for determining the state of the air and product compressor
(30)
where
bull KPlxm is an indicator that refers to how well compressor type x of train m
performed
bull TJheoretical is the theoretical isothermal efficiency of compressor type x of train m X In
bull TJcfual is the actual isothermal efficiency of compressor type x of train m ltm
Equation (30) then takes on the form of equation (31)
out J103x 10-4 xQ xT xln Pxmxm IC In( Pxbullm
~ctual xTJxm KPlxm out (31)
xQ +b x Pxm + xT +dax m x m x m -- ex m IC x m pin xm
where ~ctual is the actual measured MW power consumption at that specific flow and pressure
Again if the motor efficiency has not been determined yet it should be lumped with the
isothermal efficiency of the relevant compressor in this case equation (4) should be modified
by simply removing the electromechanical efficiency (TJxbullm ) of the motor
4453 KPI for determining the state of the air separation unit
actual
KPI = TJrecm (32)ASU m TJemperical
recm
where
Electrical Electronic and Computer Engineering 71
Chapter 4 Organizing and Planning
bull KPI is the indicator for how well the ASU operated during the sample time ASu bull m
bull 1Jemperical is the empirical recovery efficiency that has been determined for the ASU rectm
of train m
bull 1J~~1 is the actual recovery efficiency of the ASU of train m
4454 KPI for determining the overall efficiency of the plant
Except for the global energy cost KPI there should also be a KPI that measures the overall
energy efficiency of the plant This indicator should assist the energy manager in determining
the following
bull If there were any deviations in any system component of any train and also
quantify the impact of this on the overall efficiency of the plant
bull The impact of abnormal plant operation for example due to routine maintenance
on some trains or unexpected breakdown on the overall plant energy efficiency
bull Whether the plant operated above or below expectation
I ~heoretlCalm 1 [
m=l (33)
where
bull KPleff is the in indicator that measures the total plant energy efficiency (kWhlNm3
ofmain product)
bull Poctualm is the total power consumption of train m (MW)
bull Qm is the total main product flow at the output of train m (kNm3h)
Electrical Electronic and Computer Engineering 72
Chapter 4 Organizing and Planning
This indicator provides the energy manager with a summary with reference to the state of
energy efficiency of the whole plant Caution should be taken that this is an overall indicator
and may not be as sensitive to an inefficiency in a specific system component within a train
and by only looking at this indicator may give the energy manager a false idea of the actual
state of the plant Thus this indicator should be viewed in conjunction with the lower level
indicators
45 CONCLUSION
In this chapter energy management organizing and planning was discussed Through
organizing the energy management program is given definition and structure It mainly
involves identification and classification of required activities and the grouping of these
activities in a structured and meaningful way
Planning involves the setting up the energy policy and installing the energy policy strategy
The energy policy strategy has five components human resource deployment current
situation evaluation energy systems maintenance the energy management plan as well as
establishment of measurement and control indicators
Human resource deployment involves appointing a dedicated person charged with driving the
energy management program as well as giving this person access to other human resources
like administrative technical etc
Current situation evaluation is a critical step in the energy management program and the
outcome of the program to a large extent depends on how well and thorough the energy audit
was done
Plant maintenance has a definite and significant impact on energy efficiency and in this
chapter the need for an energy systems maintenance life plan was expressed This life plan is
Electrical Electronic and Computer Engineering 73
Chapter 4 Organizing and Planning
effectively the energy managers contribution to the overall maintenance effort on the plant
and aims to improve energy efficiency
The energy management plan is a structured and well-formulated set of plans and tactics that
should be followed in order to ultimately achieve the primary objectives as stipulated in the
energy policy It involves long-term and short-term planning as well as setting up tactics for
the means of achieving the short-term objectives
Key performance indicators (KPIs) were defined for the means of quantifying plant
performance in terms in energy efficiency and these find their application in the managerial
function of controlling which will be discussed in chapter 5
Electrical Electronic and Computer Engineering 74
Chapter 5 Leading and Controlling
CHAPTERS LEADING AND CONTROLLING
51 LEADING
The main purpose of leading is to harmonize individual and organizational objectives People
do not work in isolation rather they work in groups toward the achievement of personal and
enterprise objectives these objectives are not always in harmony and in fulfilling the function
of leading the manager aims to align objectives of the individual with that of the enterprise
Koontz et al [14] defines the managerial function of leading as the process of influencing
people so that they will strive willingly and enthusiastically toward the achievement of
organizational goals In order for people to willingly strive for such a goal they would need
some form of motivation to do so There exists various means for stimulating motivation in
people (refer to Fukuda [36] and Jordaan et al [37]) and one way of doing so is through
awareness
This awareness is encouraged by doing the following
bull Disclosing energy KPIs and also explaining possible abnormal deviations to
employees
bull The impact certain practices of relevant departments within the plants organization
have on the plants energy efficiency and ultimately energy cost For example this
may include energy inefficient maintenance strategies faulty equipment or even
inefficient production schedules
Turner [16] also lists the following relevant strategies for improved awareness
bull Providing relevant employees with energy management best practices which are
practical and relevant to their working environment within the plants organization
bull Providing energy conservation opportunity checklists to plant operators
maintenance personnel supervisors and engineers
Electrical Electronic and Computer Engineering 75
Chapter 5 Leading and Controlling
Another motivational tool is recognition The energy manager should recognize the energy
management efforts of employees and also show them the impact their efforts had during the
past month
Lastly Turner [16] also states that competition may lead to improved performance Fostering
reasonable competition between relevant departments in the plants organization may inspire
employees to work harder in achieving their goals
52 CONTROLING
Controlling is the measurement and correction of performance in order to ensure that
objectives and the plans devised in attaining them are being accomplished Koontz [14]
defines three basic steps for control 1) establishing standards 2) measuring performance
against these standards and 3) correcting undesired deviations from standards and plans
These steps will now each be defined from an energy management perspective
53 ESTABLISHING ENERGY STANDARDSINORMS
Previously energy management key process indicators were defined for the cryogenic air
separation plant those indicators are now utilized in the control function The standard for
each KPI is the theoretical quantity of the measured parameter ie the denominator of each
KPI as defined in equations (31) (32) and (33) of chapter 4 is the theoretical system
performance and also the standard to which actual system performance is compared KPIs for
the compressor motors are the exception (equations (28) and (29) of chapter 4) in that the
denominator in each is based on the original electromechanical efficiency specification
54 PERFORMANCE MEASUREMENT
The KPIs should be trended over time and significant deviations from expected performance
must be noted This must be done on a monthly basis except for the motor deterioration
indicators which may be assessed according that as stipulated by the maintenance strategy
Electrical Electronic and Computer Engineering 76
Chapter 5 Leading and Controlling
To illustrate performance measurement with a practical example consider the month-end
evaluation of one train of the seven-train oxygen plant at Sasol Secunda This specific train
boasts the characteristics listed in table 51
Table 51 Characteristic parameters of a train used in its performance measurements
Parameter Value KPI equation (Ch 4) 1 Motors
11 Air compressor motor 28 i
1]ACm 982
1]~cm 930
12 Product compressor motor 29 i
1]PCm 971
1]cm 910
2 Compressors 21 Air compressor 31
a 00009366 b -00574043 c 00021501 d 07272151
22 OXYfen compressor 31 a 00044099 b 00090275 c 00030923 d -09017176
3 ASU 32 1]emperical
recm 9541
What follows will be performance measurement by means of KPI trending after which
analysis of each will continue in the next section
Results for the trains global efficiency indicator is shown in figure 51
Electrical Electronic and Computer Engineering 77
Chapter 5 Leading and Controlling
11 ~---------------------------------------------------~-----~
105
095
Trendline
09
085 +--------------------------r---------r--------~----___------__--
OJ-May OS-May 09-May 13-May 17-May 21-May 25-May 29-May
Time
Figure 51 KPI trend for the global efficiency indicator
As implied earlier the KPIs characterizing each motors state are not trended over time
instead its given as a single value and are listed in table 52
Table 52 KPI values for the air and oxygen compressor motors
Compressor motor type KPlvaJue Air 0949 Oxygen 0937
Figure 52 shows KPI trending for the air compressor
Electrical Electronic and Computer Engineering 78
Chapter 5 Leading and Controlling
12
115
11 Trendline
1-1 ~ ~
09 +----L--r-------------------T----T~---__-----
105
1
01-May OS-May 09-May 13-May 17-May 2L-May 25-May 29-May
Time
Figure 52 KPI trending for the air compressor
The KPI trend for the oxygen compressor is shown in figure 53
l~ ----------------------------------- -------------
105 -t----------------------~----~--r--------~-----1
l~T--middot-----middot-~middotmiddotmiddot----middotmiddotmiddotmiddot-------middot--middotmiddotmiddot-middot-------~~-middotmiddotmiddot---middotmiddotmiddotmiddotmiddotmiddot---middotmiddot---1
103 i---middotmiddot-middotmiddotmiddot---middotmiddotmiddotmiddotmiddotmiddotmiddotmiddotmiddotmiddot---middotmiddot-middotmiddot--middotmiddotmiddotmiddotmiddot-middotmiddot----middotmiddotmiddotUrrt---middotmiddotmiddotmiddotmiddot-~-~-shy-+shy
Im~middotmiddot-middotmiddotmiddot~-~middotshy --~middotrftmiddotmiddot-~middot-middotmiddotmiddotmiddot----1rHll~r-middotH-middot-middotm~rlHj~~rJ~--middot---~jtr~~middot-shy
~ 101 hHHt-h1
099 -t-middot~middot--Ur---lmiddotft------middot-+middott-middotmiddotcr-----~---III ~I-----ti----middotmiddot-+---middotmiddotmiddot~~--middotmiddotmiddot------I+-imiddotmiddotmiddotmiddot--+--middotmiddotmiddot--~iH--l
098
097 -t--------~---~-shy -------~--~-~~--~--~~~~~----~-- ----~~
O+-------------~-------------middot-----~-----------~--shy
Ol-May OS-May 09-May 13-May 17-May 21-May 25-May 29-May
Time
Figure 53 KPI trend for the oxygen compressor
Electrical Electronic and Computer Engineering 79
Chapter 5 Leading and Controlling
The KPI trend for the air separation unit (ASU) is shown in figure 54
11 ~------------------------------------------------------------- Trend line
~ 095
~ 09
085
08
075
O1-May 05-May 09-May 13-May 17-May
Time
21-May 25-May 29-May
Figure 54 KPI trend for the ASU
Table 53 shows the average power loss contribution from each of the major systems These
results were obtained by calculating the average power loss defined as the difference between
actual performance and expected performance (Le at KPI equal to unity) during that
particular month
Table 53 System inefficiencies quantified in terms of average power loss
System A verage power loss Air compressor motor 660kW Oxygen compressor motor 400kW
Total lO60kW
Air compressor 630kW Oxygen compressor -70kW Air separation unit (ASU) 430kW
Total 990kW
Grand total 2050kW
Electrical Electronic and Computer Engineering 80
Chapter 5 Leading and Controlling
55 CORRECTIVE ACTION
Now that system performance have assessed the energy manager is now in a position to
manage equipment inefficiencies and determine whether there has been improvement in those
that have been addressed on previous occasions
551 Global efficiency indicator
This KPI should be below one in case of energy efficient train operation but as can be seen
from figure 51 it is mostly above unity implying some form of efficiency loss within the
oxygen train
On 8th May there was a sudden improvement in the global efficiency indicator and the reason
for this will become apparent in the discussion regarding the KPI trend for the air compressor
It is worth noting from the graph that there seem to be a slight trend downwards up to around
27th May were it stayed on or below unity for the rest of the remaining time the reason for this
is that average ambient temperature decreased as the year approached June ultimately leading
to increased train efficiency This trend can also be seen in the air compressor graph of figure
52 and the fact that the ambient temperature has such a favorable effect on train energy
efficiency its actual performance is disguised somewhat and one can expect that the losses
listed in table 53 may even be slightly higher during the summer months
542 Compressor motors
The fact that these two values are below one (refer to table 52) implies that there has been
some degradation in motor efficiencies the air compressor motor is currently about 95 of its
original efficiency and that of the oxygen compressor motor is around 94 Based on this
assessment the energy manager may quantify the cost associated with the respective 5 and
6 degradation in motor efficiencies and is now in a position to manage this energy loss
Electrical Electronic and Computer Engineering 81
Chapter 5 Leading and Controlling
5421 Air compressor motor
All air compressor motors on this plant are rated 37MW and are 2-pole synchronous motors
This air compressor motors KPI is at 0949 (table 52) which equates to an average power
loss of 660 kW The energy cost associated with this loss combined with current maintenance
costs cannot at this stage justify buying a new high-efficiency synchronous motor therefore
other corrective actions should be employed in improving the motors energy efficiency and in
this particular case the following steps will be taken
bull Assessment of partial discharge condition monitoring results and scheduling an
opportunity maintenance action if these results show a degree of partial discharge
bull Schedule an in-situ motor inspection carried out by the OEM in which the state of the
stator and rotor may be determined minor servicing of the motor may be enabled and
recommendations can be made by the OEM
5422 Oxygen compressor motor
All oxygen compressor motors on the plant are 137 MW 4-pole induction machines and for
this particular motor its KPI has been evaluated at 0937 leading to an average power loss of
400 kW (this result takes into account the principles discussed in section 4433 and is based
on the power saving that would result in upgrading it to its original specifications)
For the oxygen compressor motor there is much more potential for a replacement action
because of the relatively high energy loss and the fact that maintenance costs for this motor
has risen quite dramatically over the past two years Considering all the related variables a
payback period of 17 years has been calculated when replacing this motor with a new one
Management rules state that business-case approval will only be given to projects with a
payback period of 15 years or less however KPI monitoring on the other trains revealed that
the majority of oxygen compressor motors are in a worse state than the motor from this
particular train and by consolidating the project (ie recommending replacement of all motors
at once instead of just the one) the payback period was calculated at just below 15 years
Electrical Electronic and Computer Engineering 82
Chapter 5 Leading and Controlling
543 Air compressor
On 8th May the actual compressor performance was significantly above that expected (refer to
figure 52) the reason for this being that demand at that time required high product flow at
high purity and auxiliary air compressors were put online to supplement this demand the
auxiliary air compressors are unaccounted for in the model which ultimately manifests in
exceptional compressor performance
Although air compressor performance did improve as the month progressed (gradual decrease
in ambient temperature) for the majority of operational time it remained below expected
performance This under-performance resulted in an average power loss of 630 kW (table 53)
and upon further investigation it was found that routine maintenance was done quite a long
way back and given the poor air quality at Sasol Secunda a significant amount of compressor
fouling was inevitable Production requirements from production department and low priority
assignment from maintenance department resulted in these irregular and mostly delayed
maintenance intervals A proper corrective action from the energy manager in this case would
be to facilitate a compromise between these two departments by ensuring that consensus have
been reached on the scheduling of this maintenance action and also that this scheduling leads
to increased energy efficiency
544 Oxygen compressor
Figure 53 shows the KPI trend for the oxygen compressor and as can been seen from this
figure the KPI stayed above unity for the majority of time which implies good compressor
operation This is also manifested in the average power loss for this compressor which has
been calculated at -70kW as listed in table 53 implying that the oxygen compressor overall
operated slightly above expectation
In general one can expect that the product compressors performance in terms of energy
efficiency should normally be above that of the air compressor because as opposed to the air
compressor it handles a clean and pure gas and is therefore not as susceptible to compressor
Electrical Electronic and Computer Engineering 83
Chapter 5 Leading and Controlling
fouling also in some cases it is less prone to physical damage resulting from large solid
particles
545 Air separation unit
From figure 54 it can be seen that the ASU under-performed for the majority of time
resulting in an average power loss of 430 kW (table 53) Calculations showed that the average
recovery efficiency for this time was 9417 which is slightly less than its empirical value
(9541 ) meaning the air compressor has to make an added effort for compensating this drop
in efficiency
Production department acknowledged the decrease in recovery efficiency and the problem was
identified as damaged distillation trays inside the distillation column Initiating a maintenance
action to repair defective trays in the near future will not be feasible because this would lead to
significant production losses Again the energy manager has to manage this loss to the
minimum The following actions would do just this
bull Keep monitoring the recovery efficiency and initiate a maintenance action as soon
as energy loss could justify this andor determine the production loss when the air
compressor has reached its full capacity and cannot compensate for the recovery
efficiency loss anymore which ever comes first or should it be it the case when
both conditions have been reached
bull Minimize the loss by sharing a portion of this trains load equally between the
more efficient trains at times of low oxygen demand or whenever there is more
efficient spare capacity available
55 CONCLUSION
In this chapter the managerial functions of leading and energy management controlling have
been discussed
Electrical Electronic and Computer Engineering 84
Chapter 5 Leading and Controlling
The managerial function of leading involves leadership motivation and communication
Leadership refers to the ability to lead which involves the process of influencing people so
that they will strive willingly and enthusiastically toward the achievement of energy
management goals Motivation is vital in aligning objectives of the individual with that of the
energy management program and it is important that the energy manager practice effective
motivational techniques Communication is the process by which information can be received
or send It is a vital skill and an essential activity in the energy management program
Controlling is one of the functions the energy manager has to perform in order to ensure
continuity of an effective energy management program
Control is necessary in the energy management program as it brings actual performance in
line with desired performance and based on the discrepancy between these two the energy
manager is in a position to strategize corrective measures It is important for the energy
manager to establish good communication links with the relevant departments within the
plants organization as they are in a position to provide information relevant in the control
phase and are also the stakeholders that need convincing before buying into corrective action
strategies
Electrical Electronic and Computer Engineering 85
Chapter 6 Conclusions and Recommendations
CHAPTER 6 CONCLUSIONS AND RECOMMENDATIONS
61 INTRODUCTION
In chapter 1 the main and specific objectives of this dissertation were listed these objectives
were addressed during the course of this dissertation and will now be properly concluded
through referring to the relevant sections Lastly recommendations with regard to certain
aspects of the energy management system presented in this dissertation will be made followed
by a closing remark
62 CONCLUSIONS ON THE OBJECTIVES
The main objective of this dissertation was to present a framework that would enable effective
management of energy cost and efficiency in cryogenic air separation plants as stated in
section 12
In this dissertation a model has been defined which serves as the framework for the energy
management program at cryogenic air separation plants Within this framework various
functions have been defined and the energy management effort is realized through performing
the activities surrounding each of the respective functions
621 Conclusion on the energy management model
The energy management model was introduced in chapter 3 The model is depicted in figure
35 and entails the transformation process its inputs and outputs and the external environment
as well as the interaction between all of these Inputs are resources like capital skills people
and facilities outputs are the accomplished energy management objectives like improved
preventive maintenance strategies optimized production schedules reduced energy cost and
improved plant design
The external environment accounts for the higher order systems to which the energy
Electrical Electronic and Computer Engineering 86
Chapter 6 Conclusions and Recommendations
management system belongs The transformation process involves the managerial functions of
organizing planning leading and controlling which are the core managerial functions the
energy manager has to perform
622 Conclusion on the energy policy
Theory behind the energy policy was presented in section 43 The energy policy normally
consists out of three components the declaration of commitment mission statement and
specific objectives The energy policy guides or channels thinking it is an expression of the
commitment plant management has towards a continuous and effective energy management
program and sets the scope for energy management effort at plant level
623 Conclusion on the energy policy strategy
The energy policy strategy is the means for accomplishing the vision expressed by the energy
policy and was introduced in section 44 The energy policy strategy thus encapsulates the plan
for changing current reality into future vision This plan is composed of five activities and
they have been identified as the following
bull deployment of human resources
bull current situation evaluation
bull energy systems maintenance
bull energy management planning
bull establishment of measurement and control indicators
Deployment of human resources entails the appointment of a dedicated person in charge of
the plants energy management program as well as enabling this person to utilize other
relevant human resources
Energy systems maintenance refers to maintenance actions regarding the energy efficiency of
Electrical Electronic and Computer Engineering 87
Chapter 6 Conclusions and Recommendations
equipment that use or affect the use of energy
The energy management plan is a structured and well-formulated set of plans and tactics that
should be followed in order to ultimately achieve the primary objectives as stipulated in the
energy policy
Key performance indicators were presented in section 445 and these indicators enable the
energy manager to assess the plants energy efficiency and also to perform the control function
of the energy management program
624 Conclusion on the energy audit process
The energy audit process was discussed in section 442 and consists out of the energy audit
policy and the energy audit strategy The energy audit policy sets the scope for what to audit
whereas the energy audit policy strategy states how this would be done
Auditing is done through assessing relevant plant efficiencies as listed in section 4421 and
for the holistic approach to energy auditing assessment of all these plant efficiencies should
be enabled this assessment is done by means of the audit strategy as detailed in section
4424
625 Conclusion on the mathematical model
Model building blocks with regard to all the major systems were derived in section 4424
The energy conversion model is a very important auditing tool and most of the building blocks
derived in this section also find their application in the control function of the energy
management program (section 52)
Model accuracy is greatly enhanced through empirical modeling of critical plant elements and
Electrical Electronic and Computer Engineering 88
Chapter 6 Conclusions and Recommendations
as stated in chapter 4 it becomes obvious that availability of relevant data is critical in model
building
626 Conclusion on the performance indicators
KPIs (key performance indicators) were derived in section 445 and consist of global
indicators as well as lower level indicators Global indicators quantify the performance of the
plant as a whole and include the energy cost per product produced (RlNm3) and energy
consumption per cumulative product produced (kWhlNm The lower level indicators enable
the energy manager to monitor the energy efficiency of critical components such as the
compressor motors compressors and the distillation columns and are also utilized in the
control function of the energy management program
Each KPI is defined as the ratio between actual and theoretical performance The theoretical
performance effectively defines the energy standard of a particular system which enables the
energy manager to identify system inefficiencies when comparing this to the actual system
performance
627 Conclusion on energy systems maintenance
Energy systems maintenance with regard to cryogenic air separation plants was introduced in
section 443 Energy systems maintenance is the energy managers contribution to the overall
maintenance effort on the plant and is conducted by means of an energy maintenance life plan
The state of each of the respective critical systems is monitored in terms of their energy
efficiency and deviations are acted upon so as to minimize resulting energy losses The critical
systems are the compressors distillation columns and compressor motors and a maintenance
plan for these systems were presented in section 4435
A cryogenic air separation plant normally utilizes a large number of induction motors for
Electrical Electronic and Computer Engineering 89
Chapter 6 Conclusions and Recommendations
driving loads such as blowers pumps and compressors and these motors consequently have a
significant impact on the energy efficiency of the plant As stated in section 4433 energy
systems maintenance on large induction motors driving these loads may not be so simple and
in this section a tool that facilitates decision-making between induction motor replacement and
renewal was presented as well
63 RECOMMENDATIONS
This section contains recommendations with regard to certain aspects of the energy
management system at cryogenic air separation plants
631 Recommendations on setting up the energy management program
First and foremost it is the responsibility of the appointed energy manager to ensure that there
is a formal and well-defined energy policy in place at plant level for the whole energy
management program will be as a direct consequence of this policy and is therefore the
foundation from which all energy management efforts will outflow This policy should be
agreed upon by the relevant stakeholders and approved by top management
For the energy management system to be fully integrated into the plants organizational
structure and to ensure that top management continually gives it the commitment it needs it is
recommended that the outcomes of this program be accounted for in the overall performance
of the plant in order for it to ultimately have an impact on the merits of plant performance
As a direct consequence of the energy policy capita1 will be made available for the energy
management program in the form of a financial budget The energy manager is responsible for
formulating the energy management budget for the next financial year and this budget should
then serve as the cost goal for the energy management program This is a critical resource
input to the program and the energy manager should make sure that optimum use of this
resource is exercised through proper planning and allocation (see section 444)
Electrical Electronic and Computer Engineering 90
Chapter 6 Conclusions and Recommendations
When implementing the energy management program it is important that the appointed person
should first organize a workshop session in which all the relevant departments in the plants
organization are informed about what the proposed energy management effort entails what is
expected of them and how they can benefit from it This is also a good opportunity for the
energy manager to highlight the importance of effective energy management on these energy
intensive plants and to aspire fellow personnel in contributing positively towards energy
management objectives
632 Recommendations regarding existing energy management programs
In the case where there already is an existing energy management program in place the
contents of this dissertation may be used to supplement or adjust current efforts The model
presented in this dissertation aims to foster an effective and value-adding energy management
program without compromising production output streams and will add to the success of
existing energy management efforts
633 Recommendations regarding energy modeling
In section 4424 it becomes obvious that in building the energy conversion model the energy
manager requires a large amount of data of different types ranging from process variables like
temperature pressure and flow to capacity limits on equipment To avoid spending too much
time in model building and ensuring good accuracy the energy manager must enable easy
access to relevant data
Building the energy conversion model may take a relatively long time especially in plants
incorporating multiple trains and most of the time will be consumed by processing relevant
data it is therefore recommended that appropriate computer software be used Spreadsheets
will undoubtedly proof to be most efficient in data processing and it is also recommended that
software capable of multiple variable regression be utilized in modeling certain subsystems
Lastly some model building blocks are utilized in the control function of the energy
Electrical Electronic and Computer Engineering 91
Chapter 6 Conclusions and Recommendations
management system and it would be advisable to link the relevant model outputs to the
respective KPIs in which they are utilized in this manner KPIs are automatically evaluated
whenever plant performance needs to be determined
634 Recommendations regarding the energy manager
Although it is recommended that the energy management system should form part of the
plants organization it doesnt necessarily mean that the person appointed to drive this
program should be stationed at the plant This person may form part of an organization
external to the plants organization like for example an energy management task team that is
charged with managing energy cost on a company-wide level a technical hub or even an
outside company (outsourcing)
It is required that the appointed person should be experienced in general management and
competent in applying financial tools This person should also be technically orientated
typically operating from the base of mechanical electrical or process engineering
635 Recommendations regarding energy management at Sasol Secunda
It is a fact that certain plants within the Sasol complex are generally energy intensive and in
optimizing the energy cost per output product more efficiently it is recommended that
intentional consideration should be given to energy management at plant level Realizing this
energy management effort lies in adopting an efficient managerial structure such as the one
presented in this dissertation and allocating resources to fuel this energy management effort
Driving this managerial effort would be the responsibility of a dedicated energy manager
appointed by the company Lastly Janse van Rensburg [17] also suggested that an energy
manager should be appointed by each of the major energy consumers within the factory and
that a specific plants performance with regard to energy management should have an impact
on the overall performance merit of the plant thereby motivating relevant personnel in
achieving energy management objectives
Electrical Electronic and Computer Engineering 92
Chapter 6 Conclusions and Recommendations
64 FUTURE WORK
Although there are key commonalities between various cryogenic air separation plants they
may still be diverse in design and it is up to the energy manager to derive an energy model
specific to hisher plant this may be done by employing the basic modeling theory presented
in chapter 4
Another point worth mentioning is that of extending the application of the energy model
Utilization of the energy model is basically limited to that of the energy manager but by
modifying the model such that it is able to receive real-time data in order to produce specific
predefined outputs in real-time the proactive element of the energy management effort is
greatly enhanced The model may be added as an extension to the control operators
workstation The control operator is directly responsible for the process control of the plant
and is able to see (in real time) on how certain of hislher actions impact on the energy cost and
efficiency of the plant
Lastly this study was aimed at presenting a generic framework for energy management at
cryogenic air separation plants however it was also the intent of the author to introduce an
energy management framework that may be applied to plants of any nature In the quest for
deriving an energy management program future studies may thus apply the basic philosophy
presented in this study to other types of plants as well
65 CLOSING REMARKS
This dissertation presents a framework for energy management at cryogenic air separation
plants It addresses all the critical managerial aspects required in conducting a successful
energy management program and may be used as a reference or tool in managing electrical
cost and energy efficiency at these energy intensive plants
Because these plants are so energy intensive a relatively small improvement in energy
efficiency may lead to significant energy cost savings Cost savings are not the only benefits
Electrical Electronic and Computer Engineering 93
Chapter 6 Conclusions and Recommendations
resulting from the energy management effort indirect benefits resulting from this include
reduced C02 emissions and conservation of the earths energy resources
From the above it can be seen that energy management at plant level not only makes business
sense but is also the answer to environmental concerns and the ever-increasing energy price
Electrical Electronic and Computer Engineering 94
References
REFERENCES
[1] JC Kotz and P Treichel Chemistry And Chemical Reactivity 3rd edition Harcourt
Brace amp company Orlando USA 1996
[2] AR Smith and J Klosek A review of air separation technologies and their integration
with energy conversion processes Fuel Processing Technology VoL 70 pp115-134
2001
[3] BW Birmingham and CN Smith Cryogenics and the energy crisis Cryogenics Vol
15 Issue 3 pp115-118 1975
[4] Air Liquide Engineering Division Seminar Proceedings France May 1987
[5] Air Liquide Engineering amp large industry training department training handbook Air
Distillation Version 2 Champigny-sur-Mame Cedex France 2001
[6] SC Sarkar Energy savings in cryogenic plants Journal of Energy in Southern
Africa Vol 13 pp139-143 2002
[7] Air Liquide homepage Energy saving results
httpwwwairliquidecom France 2002
[8] MW Biddulph Efficiencies of trays in cryogenic distillation columns Cryogenics
Vol 26 pp24-29 1986
[9] N Gupta BK Srivathsa and KS Misra Energy optimization techniques in Air
Separation Plants Proceeding of International Cryogenic Congress Calcutta India
pp 391-409 1988
[10] A Thuman and DP Metha Handbook ofEnergy Engineering 2nd edition The Fairmont
Press Lilburn USA pp 377 1991
[11] GT Austin Sherves Chemical Industries 5th edition McGraw Hill Inc Singapore pp
115 -128 1984
[12] RH Perry and DW Green Perrys Chemical Engineers Handbook ih edition
McGraw-Hill New York USA pp 4-6 to 4-7 1982
Electrical Electronic and Computer Engineering 95
References
[13] PM Fishbane and S Gasiorowicz Physics for Scientists and Engineers extended 2nd
edition Prentice Hall New Jersey USA pp 438 - 504 1996
[14] HD Koontz C ODonnel H Weihrich Management 8th edition McGraw Hill Inc
Singapore 1984
[15] Oxygen plant financial statements financial results June 2003 and projected July 2004
Sasol Secunda South Africa
[16] WC Turner Energy Management Handbook The Fairmont Press Lilburn USA 1993
[17] WTB Janse van Rensburg Energiebenutting en Energiemodullering in die
Sasolproses Masters Dissertation Potchefstroom University South Africa pp 19-21
1994
[18] VB Ottaviano Energy Management The Fairmont Press Georgia USA pp 12-1 and
72-1 1985
[19] JB Sykes (Editor) The Concise Oxford Dictionary 7th Edition Oxford University
Press Oxford UK p 6501982
[20] Safety Health and Environmental policy of Sasol httpwwwsasolcom South Africa
[21] Materials an Services Management Team (electricity) of Sasol Ltd Cross-functional
and cross-divisional collaboration - The way to industrial electricity cost savings
South Africa ppI-5 2000
[22] A Thuman Handbook Of Energy Audits 5th edition Pretice-Hall New Jersey USA
pp 1-6 1998
[23] FBA Senekal Electricity Demand Management Manual EPR 400 Final Report Centre
for New Electricity Studies University of Pretoria Pretoria RSA pp 71-1011994
[24] GJ Delport Integrated Electricity End-Use Planning in Deep Level Mines Phd Thesis
University of Pretoria Pretoria RSA 1994
[25] EM Talbott Compressed Air Systems A guidebook on energy and cost savings 2nd
edition Fairmont Press New Jersey USA pp 28-30 and 164-167 1993
[26] JK Salisbury Kents Mechanical Engineers Handbook 12th edition John Wiley amp
Sons New York USA pp 1-34 to 1-54 1976
Electrical Electronic and Computer Engineering 96
References
[27] J M Coulson and J F Richardson Coulson amp Richardsons Chemical Engineering
volume 15th edition Butterworth Heinemann Bath Great Britain pp 311-321 1997
[28] T Baumeister and EA Avallone Marks Standard Handbook for Mechanical
Engineers 8th edition McGraw-Hill New York USA pp 14-30 to 14-44 1978
[29] S Makridakis SC Wheelwright et aI Forecasting Methods and Applications 2nd
edition John Wiley amp Sons New York USA pp 246-312 1983
[30] JD Campbell Uptime Strategies for Excellence in Maintenance Management
Productivity press New York USA pp 110 - 112 1995
[31] JS Htsui PJ Otaduy and JD Kueck Efficiency and reliability Assessments of
Retrofitted High-Efficiency Motors Industry Applications Conference Thirtieth lAS
Annual Meeting Conference record of the 1995 IEEE Vol 3 pp2745-2751 1995
[32] PC Sen Principles of Electric Machines and Power Electronics 2nd edition John
Wiley amp Sons New York USA pp207-277 1997
[33] RN Brown Compressors Selection and Sizing 2nd edition Gulf Publishing Company
Houston Texas pp 183-184 1997
[34] KA Stroud Engineering Mathematics 2nd edition Macmillan Great Britain London
pp 18-3 to 18-4 1982
[35] BH Campbell Failed motors Rewind or Replace Industry Applications Magazine
IEEE Vol 3 Issue 1 pp45-50 1997
[36] R Fukuda Managerial Engineering Techniques for improving Quality and
Productivity in the Workplace Productivity Inc Connecticut USA pp20-22 1983
[37] W Jordaan and J Jordaan Man in Context McGraw-Hill Johannesburg RSA pp 618shy
625 1984
Electrical Electronic and Computer Engineering 97
Appendix A
APPENDIX A CASE STUDY BASIC ENERGY CONVERSION MODEL FOR
THE SASOL SECUNDA OXYGEN PLANT
At MODEL INPUTS AND OUTPUTS
Table Al lists the empirical values for the oxygen compressor (refer to equation (9) of chapter
4) Factored into these constants are the respective electromechanical efficiencies of the
oxygen compressor motors
Table AI Oxygen compressor empirical values
Train a b c d 1 0004013 0008215 0002814 i 0820563 2 0004853 0009605 0002887 0960213 i
3 0005213 0004361 0003537 0960292 4 0001955 0005158 0001532 0193396 5 0004018 0008176 0002817 0820563 6 0005104 001082 0002722 0960236 i
7 0003524 0005223 0003751 0960292 ACs 0000871 -0853386 00019996 0067631 I
With reference to equation (8) of chapter 4 the system constants from the air compressor side
are the following h =014 and g 12 which have been assumed the same for all trains
The average recovery efficiencies for each train are as listed in table A2
Table A2 Coldbox average recovery efficiencies
i
i
Train AR 1 9467 2 9055 3 9518 4 9613 5 9528 6 9152 7 9509
Electrical Electronic and Computer Engineering 98
Appendix A
Refer to figure AI for model input and output nametags
Model inputs
bull Management rules Specifies production constraints ie the minimum and maximum
levels of the different commodities involved in the oxygen production process
bull Oxygen demand This input is mainly determined by the gasification and gasshy
reforming processes and will vary in response to their demand
bull Oxygen supply pressure This is the pressure with which oxygen is supplied to the
Gasification and Gas-Reforming plants The supply pressure should be kept between
the constraints as set forth by these two plants
bull Minimum and maximum limits of process outputs and equipment Specifies the
constraints in which the equipment should function in normal operation This includes
o Max amp Min limits of air compressor 37MW amp 28MW (when online)
respectively
o Max amp Min limits of oxygen compressor 137MW amp lOMW (when online)
respectively
o Max amp Min limits ofoxygen purity 994 amp 985 respectively
o Max amp Min limits of Pressure in oxygen common header 3480kPa amp
3350kPa respectively
o Max amp Min limits ofN02 ratio 30 amp 20 respectively
bull HP N21LP 02 ratio Defines the relationship between the HP nitrogen and LP Oxygen
and is assumed a constant value
bull Instrument Air flow The plant also produces instrument air and for the purpose of the
model a constant value is assumed
bull O2 purity The main product purity is assumed constant
bull Other constants This includes the following
o Atmospheric pressure at Secunda (85kPa)
Electrical Electronic and Computer Engineering 99
Appendix A
o 02 pressure at cold box outlet (95kPa)
o Cooling water temperature (20degC)
o A verage recovery efficiencies of each train (AR)
Model outputs
bull Specific energy This is defined as the energy efficiency of the oxygen plant ie the
efficiency with which energy is utilized in producing oxygen It has units of kWhlNm3
Le the amount of kilowatts that should constantly be applied for one hour in order to
produce one normal cubic meter of oxygen
bull New load profiles This includes
o Load profiles of all trains
o Load profile of whole industry (train 1-7)
bull Cost ofenergy Gives the cost of energy based on the tariff structure
For the model simulation the following input values listed in table A3 were used
Table A3 Input values used for model simulation
Parameter held constant Value Oxygen supply pressure 3440kPa
N202 ratio 25 Average recovery (AR) Refer to table C2 Instrument air flow 35 kNmjh Oxygen purity 986 Electricity tariff structure WEPS (2002 Sasol structure)
Electrical Electronic and Computer Engineering 100
Appendix A
Management Rules
O2 demand
O2 supply pressure
Min amp Max limits of
equipment
N202 ratiogt
L-_A_R__gt Instrument Air
(lA)flow
O2 purity
Electricity Tariff
Specific Energygt
Load profilesgt
Cost of Energygt
Figure Al Inputs and outputs for the basic energy conversion model
Electrical Electronic and Computer Engineering 101
- - - - - - -
Appendix A
Table A4 Simulation results calculated over a period of one moth
Parameter Value Specific energy 06589 kWhlNm
j
Cumulative load profile Refer to figure C2 Cost of energy during sample month R21156843
360
340
320
300 ~ 280 ~
260 Refer 10 figure A3
240
220
200 gt gt gt gt gt gt gt gt gt gt gt gt gt gt gt gt gt gt gt gt ol ol ol ol ol ~ ol ol ~ ol ol ol ol ol ol ol ol ol ol ol ol ol
~ ~ ~ ~ ~ ~ ~ ~ ~ ~ ~ ~ ~ ~ ~ ~ ~ ~ ~ ~ ~ ~ I I I I I I I I I I I I I I I I I I I I I
C-I ri on IQ 00 0 C-I ri on IQ 00 0- 0 C-I ri on IQ t- O- 0 C-I C-I C-I C-I C-I C-I C-I ri
Time
Figure A2 Actual and simulated load profile for the oxygen plant at Sasol Secunda
~ ~
360
340
320
300
260
240
220
200
I8-May I9-May 20-May 21-May 22-May 23-May 24-May 25-May
Time
Figure A3 Section of actual and simulated load profile of figure C2
Electrical Electronic and Computer Engineering 102
Appendix A
On 8th May the actual load profile plunges momentarily while the model doesnt seem to be
responding to this change in power consumption This is due to the fact that the model
assumes that only one oxygen compressor can be offline at any point in time which is usually
the case on this particular day however between 0730 and 930 train twos oxygen
compressor tripped and was offline for approximately two hours in addition to the oxygen
compressor of train one This has the implication that the spare oxygen compressor was
summed twice for two hours On 7th May the same incident happened for approximately one
hour
Two oxygen compressors are very rarely offline at the same time and as these incidents
happened only for a relatively small time the entire month (approximately three hours in total)
its impact is negligent and also for the sake of model simplicity this aspect was neglected in
modeling the oxygen plant
As will be illustrated later in this section an oxygen trains power consumption increases
when a higher purity oxygen is produced Between 15t and 2nd of May the actual load profile
seems to be slightly higher compared to that of the model The model assumes that oxygen is
produced at a constant purity (986) however in this case oxygen was produced at a higher
purity leading to an increased power consumption this is also the case for the respective load
profiles between 27th and 28th of May The same reasoning can be applied to the results seen
between 30th and 31 5t of May except that in this case lower purity oxygen (ie less than
986) was produced
When the power consumption of the oxygen plant drops like for instance at 5 7 8923 and
30th May it seems that the model overshoots the minimum point at times this is mainly due to
the minimum permissible power consumption the compressors are allowed to have The model
assumes 28MW and lOMW for the air and oxygen compressor motors respectively but these
values vary from train to train (may be higher or lower than 28MWllOMW) and thus may
overshoot at times or even undershoot the actual load profile at these conditions
Electrical Electronic and Computer Engineering 103
Appendix A
A2 IMPACT OF KEY PARAMETERS ON ENERGY EFFICIENCY
The energy conversion model defined in the previous section will now be used to quantify the
impact certain key process parameters have on the energy consumption efficiency and cost of
the plant Normal operating conditions will be used as the baseline and are as listed in table
A5 at these conditions the model outputs are as listed in table A6
Table A5 Normal operating conditions of the oxygen plant at Sasol Secunda
O2 Purity 986 HPNdLP02 25 IA flow 35 kNmlh O2 common header pressure 3440 kPa
Table A6 Model results at normal operating conditions
Specific energy 06589 kWhlNmf Load profile of oxygen plant Figure A2 Average power consumed 32344MW Total cost of energy R 21156843
The effects of changing following parameters will be determined
bull Oxygen purity
bull Average recovery efficiency (AR)
bull Instrument air flow (AI)
bull Cold box availability
Table A7 lists the different simulation scenarios with table A8 displaying the respective
model outputs in terms of specific energy average power consumption and total cost of
energy
Electrical Electronic and Computer Engineering 104
Appendix A
Table A7 Model simulation scenarios
Variables O2purity IA flow per 02CH Recovery
CD offline train pressure efficiencies
Oxygen purity - Scenario 1 985 35kNmJh 3440kPa Table A2 None - Scenario 2 987 I 35kNm3h 3440kPa Table A2 None
AR efficiency - Scenario 986 35kNm3h 3440kPa Trains 2amp6 None
changed to 95
IA flow - Scenario 986 Load shifting 3440kPa Table A2 None
IA of trains 2amp6 to train 7
Cold box availability - Scenario 986 35kNmj h 3440kPa Table A2 Train 1
Table A8 Model outputs based on the scenarios listed in table A7
Variables Specific Average Total cost Increase
Increase Increase I in average
of energy in specific in total
energy power power cost of
consumed energy (KWhINm3) (MW) (R) consumed energy
(R) Oxygen purity - Scenario 1 06553 32172 21049009 -055 -053 ~7834 - Scenario 2 06631 32553 21287147 064 065 0304
AR efficiency - Scenario 06524 32029 20960289 -099 -097 -196654
IA flow I
- Scenario 78 32291 21123850 -017 -016 -32993
Cold box availability - Scenario 07360 31189 20401463 1235 -357 -755380
Electrical Electronic and Computer Engineering 105
Appendix B
APPENDIXB LIST OF TABLES
Table 21 Components of air and their properties (Sources Austin [11] Kotz et al [1]) 5
Table 23 A description on the function of each process and the equipment used for the
Table 44 Summary of electrical machinery ratings and capacity requirements for production
Table 47 Three suppliers of a 4-pole 137MW induction motor with their respective ratings
Table 49 Energy systems life plan for the critical systems on the cryogenic air separation
Table 22 Comparison of air separation technologies (Smith et al [2]) 6
implementation thereof 7
Table 41 Details surrounding commodity inputs to the oxygen plant at Sasol Secunda 34
Table 42 Details surrounding commodity outputs from the oxygen plant at Sasol Secunda 35
Table 43 Prioritization of output products of the oxygen plant 35
means 39
Table 45 Summary of the user requirements for each product 39
Table 46 Current motor parameter values 60
60
Table 48 Power saving for the different motors from the three suppliers 62
plant 66
Table 51 Characteristic parameters of a train used in its performance measurements 77
Table 52 KPI values for the air and oxygen compressor motors 78
Table 53 System inefficiencies quantified in terms of average power loss 80
Table Al Oxygen compressor empirical values 98
Table A2 Coldbox average recovery efficiencies 98
Table A3 Input values used for model simulation 100
Table A4 Simulation results calculated over a period of one moth 102
Table A5 Normal operating conditions of the oxygen plant at Sasol Secunda 104
Electrical Electronic and Computer Engineering 106
Appendix B
Table A6 Model results at normal operating conditions 104
Table A7 Model simulation scenarios 105
Table A8 Model outputs based on the scenarios listed in table A7 105
Electrical Electronic and Computer Engineering 107
Appendix C
APPENDIXC LIST OF FIGURES
Figure 21 Processes involved in cryogenic air separation 7
Figure 23 Water and alcohol mixture at boiling point producing a gas and consequent
Figure 24 Cascaded distillation flasks producing a substance rich in volatile element at the
Figure 25 Distillation by means of improved liquid-gas contact between cascaded distillation
Figure 26 Distillation column producing oxygen and nitrogen by means of fractional
Figure 41 Energy policy at different levels of the organization and the scope of the policy at
Figure 42 An illustration of efficiency losses inherent to the plants structure from an energy
managers perspective and how they collectively contribute to the ultimate quantity of
Figure 43 Basic outline of the oxygen plant at Sasol Secunda The flows presented here are
Electrical Electronic and Computer Engineering
Figure 22 Distillation flask with water and alcohol mixture 10
distillate richer in alcohol 10
top and a substance rich in less volatile element at the bottom 11
flasks 12
distillation trays [5J 13
Figure 27 Producing oxygen by utilizing a distillation column with no condenser [5J 14
Figure 28 Producing nitrogen by utilizing a distillation column with no vaporizer [5J 15
Figure 29 Stacked column model that enables the production of oxygen and nitrogen 17
Figure 31 Basic outline of the energy management model 20
Figure 32 The energy management model 22
each level 25
output product per Rand of electrical cost 30
the steady state maximum amounts of oxygen that each train is able to produce 36
Figure 44 Process flow of a single oxygen train 38
Figure 45 Simplified system breakdown structure of the cryogenic air separation plant 42
Figure 46 Multi-stage compression cycle with interstage cooling (Coulson et ai [27])45
108
Appendix C
Figure 47 Linear approximation of system curve 48
Figure 48 Functional fai lures and performance standards 51
Figure 49 Partial power curves of the existing motor (motor 1) and the new motor (motor 2)
as well as that of the compressor load illustrating the implication of installing a higher
efficiency motor than is currently in operation 54
Figure 410 Compressor characteristic curve at various shaft speeds 56
Figure 4 11 Approximating the power curve with a linear model at low slip values 59
Figure 412 Threshold efficiency proposed new motor should adhere to as a function of its
full load speed 61
Figure 413 Threshold lines of motor after every rewind 64
Figure 51 KPI trend for the global efficiency indicator 78
Figure 52 KPI trending for the air compressor 79
Figure 53 KPI trend for the oxygen compressor 79
Figure 54 KPI trend for the ASU 80
Figure Al Inputs and outputs for the basic energy conversion model 101
Figure A2 Actual and simulated load profile for the oxygen plant at Sasol Secunda 102
Figure A3 Section of actual and simulated load profile of figure C2 102
Electrica l Electronic and Computer Engineering 109

List of Abbreviations
O2
OC
OEM
PM
PT
tpd
WN2
Xe
Normal Cubic Meters per hour This is the flow of a
commodity (gas or liquid) at normal conditions
(OOe and 1013 absolute bar)
Oxygen
Oxygen Compressor
Original Equipment Manufacturer
Preventive Maintenance
Potential Transformer
Tons per Day
Waste Nitrogen
Xenon
Electrical Electronic and Computer Engineering v
Table of Contents
TABLE OF CONTENTS
CHAPTER 1 PROBLEM IDENTIFICATION AND BACKGROUND 1
11 INTRODUCTION 1
12 ENERGY MANAGEMENT AT CRYOGENIC AIR SEPARATION PLANTS 1
13 DISSERTATION OBJECTIVES 3
131 Main objective 3
132 Specific objectives 3
14 DISSERTATION STRUCTURE 3
CHAPTER 2 CRYOGENIC AIR SEPARATION 5
21 INTRODUCTION 5
22 PROCESS DESCRIPTION 6
23 DISTILLATION 9
231 Example Distillation of an alcohol and water mixture lO
232 Distillation of air 12
24 CONCLUSION 18
CHAPTER 3 ENERGY MANAGEMENT 19
31 INTRODUCTION 19
32 ENERGY MANAGEMENT AT CRYOGENIC AIR SEPARATION PLANTS 19
32 MODEL FOR ENERGY MANAGEMENT AT CRYOGENIC AIR SEPARATION
PLANTS 20
33 ENERGY MANAGEMENT SYSTEM THE TRANSFORMATION PROCESS 21
34 CONCLUSION 23
Electrical Electronic and Computer Engineering VI
Table of Contents
CHAPTER 4 ORGANIZING AND PLANNING 24
41 ORGANIZING 24
42 PLANNING 24
43 THE ENERGY POLICY 24
44 THE ENERGY POLICY STRATEGY 27
441 Deployment of human resources 28
442 Current situation evaluation 28
4421 The energy audit process 29
4422 The plant efficiencies 29
4423 Energy audit policy 33
4424 Energy audit strategy 33
443 Energy systems maintenance 50
4431 Establishing an energy systems maintenance life plan 52
4432 Energy systems maintenance on compressors 53
4433 Energy systems maintenance on motors 53
4434 Energy systems maintenance on distillation columns 64
4435 Energy systems maintenance life plan 65
444 The energy management plan 66
445 Measurement and control indicators 68
4451 KPI for determining the state ofthe compressor motor 70
4452 KPlfor determining the state ofthe air and product compressor 71
4453 KPlfor determining the state of the air separation unit 71
4454 KPlfor determining the overall efficiency ofthe plant 72
45 CONCLUSION 73
Electrical Electronic and Computer Engineering Vll
Table of Contents
CHAPTER 5 LEADING AND CONTROLLING 75
51 LEADING 75
52 CONTROLING 76
53 ESTABLISHING ENERGY STANDARDSNORMS 76
54 PERFORMANCE MEASUREMENT 76
55 CORRECTIVE ACTION 81
551 Global efficiency indicator 81
542 Compressor motors 81
5421 Air compressor motor 82
5422 Oxygen compressor motor 82
543 Air compressor 83
544 Oxygen compressor 83
545 Air separation unit 84
55 CONCLUSION 84
CHAPTER 6 CONCLUSIONS AND RECOMMENDATIONS 86
61 INTRODUCTION 86
62 CONCLUSIONS ON THE OBJECTIVES 86
621 Conclusion on the energy management model 86
622 Conclusion on the energy policy 87
623 Conclusion on the energy policy strategy 87
624 Conclusion on the energy audit process 88
625 Conclusion on the mathematical model 88
626 Conclusion on the performance indicators 89
627 Conclusion on energy systems maintenance 89
Electrical Electronic and Computer Engineering Vll1
Table of Contents
63 RECOMMENDAnONS 90
631 Recommendations on setting up the energy management program 90
632 Recommendations regarding existing energy management programs 91
633 Recommendations regarding energy modeling 91
634 Recommendations regarding the energy manager 92
635 Recommendations regarding energy management at Sasol Secunda 92
64 FUTURE WORK 93
65 CLOSING REMARKS 93
REFERENCES 95
APPENDIX A CASE STUDY BASIC ENERGY CONVERSION MODEL
FOR THE SASOL SECUNDA OXYGEN PLANT 98
APPENDIX B LIST OF TABLES 106
APPENDIX C LIST OF FIGURES 108
Electrical Electronic and Computer Engineering IX
Chapter 1 Problem Identification and Background
CHAPTER 1 PROBLEM IDENTIFICATION AND BACKGROUND
11 INTRODUCTION
Steel metal and petrochemical industries all require large amounts of air products such as
oxygen and nitrogen Kotz et ai [1] states that oxygen and nitrogen are annual1y among the
top five chemicals produced in the United States Cryogenic air separation plants are
currently the only efficient and economical1y viable method of producing air products on
large scale (Smith et ai [2]) Because transportation adds considerably to the cost plants are
usually constructed on-site and located close to the point of consumption
It is also a fact that plants of this nature are generally energy intensive especially the large
tonnage plants and it has been found that relatively small improvements in plant energy
efficiency may lead to significant energy cost savings
12 ENERGY MANAGEMENT AT CRYOGENIC AIR SEPARATION PLANTS
The energy crises of the early 1970 s necessitated significant improvement of energy
management efforts at these energy intensive plants and initial efforts were mostly aimed at
energy conservation through introduction of better technology available for that time
(Birmingham et al [3])
As a consequence of this intentional consideration to improved plant energy efficiency has
been given during its design phase ([4] [5] [6]) this is manifested by the fact that energy
efficiency increased by approximately 91 from 1980 to the late 80s [4] and from 1997 to
2001 Air Liquide reports a 10 decrease in power consumption of its cryogenic air separation
plants [7]
Since the 1970s energy optimization techniques have been given elevated importance in the
design phase of cryogenic air separation plants and numerous studies addressing the issues
Electrical Electronic and Computer Engineering 1
Chapter 1 Problem Identification and Background
surrounding improved energy optimization have been widely publicized (refer to Birmingham
et ai [3] Biddulph [8] Gupta et al [9] and Sarkar [6]) It is also a fact that all these studies
are almost solely aimed at improving the energy efficiency of the plant through intervention at
the design phase of the cryogenic air separation plant Although there have certainly been
significant improvements in plant energy efficiency during the past years as stated earlier not
much have been written on how proper maintenance of this energy efficiency should be
conducted and needles to say proper energy management
The aim of energy management is defined by Thuman et ai [10] as the reduction of energy
expenditure for the purpose of reducing product cost this would ultimately lead to an increase
in competitive performance and it becomes clear that by employing effective energy
management much more benefit can be drawn by the relevant stakeholders and consequently
also makes business sense
This energy management effort should not only be confined to the design phase of the plant
but should be a continuous action applying it throughout the whole productive part of the
plants life-cycle
With todays relatively high and continuously increasing energy prices it not only becomes a
necessity but also makes business sense to maintain and continuously improve the plants
energy efficiency Managing the plants energy expenditure and efficiency would be the
correct response to the already high and ever-increasing energy cost and may reduce overall
input cost dramatically
To make this managerial action value-adding there needs to be an effective and continuous
energy management program in place that aims to reduce the plants energy expenditure so as
to ultimately reduce product cost
Electrical Electronic and Computer Engineering 2
Chapter 1 Problem Identification and Background
13 DISSERTATION OBJECTIVES
The dissertation objectives are as listed under the main and specific objectives in the subshy
sections that follow
131 Main objective
The main objective of this dissertation is to present a structured framework which would
enable effective management of energy cost and efficiency on cryogenic air separation plants
132 Specific objectives
The main objective is accomplished by addressing several key specific objectives
bull Present a model for energy management at cryogenic air separation plants
bull Introduce the theory behind an energy policy
bull Introduce an energy management strategy
bull Present an efficient energy audit process
bull Derivation of a mathematical model for the cryogenic air separation plant
bull Defining performance indicators which would assess the success of the energy
management program
bull Present the means for conducting energy systems maintenance on relevant
equipment on the plant
14 DISSERTATION STRUCTURE
This dissertation is structured in accordance with the energy management model
Chapter 2 introduces the reader to some of the various technologies available today for
producing air products and also elaborates on the basic theory behind cryogenic air separation
Electrical Electronic and Computer Engineering 3
Chapter 1 Problem Identification and Background
The main processes within the air separation plant are described as well as the equipment used
in realizing these processes
Chapter 3 introduces the energy management model and more specifically the energy
management system This chapter sets the scope for the chapters that follow and gives a brief
introduction of what each one entails
Chapter 4 describes the organizational structure of the energy management program as well as
the components its comprised of It also elaborates on energy management planning and
introduces the concept behind the energy policy and strategy In this chapter components of
the energy policy strategy are described in detail and selected concepts are explained by means
of case studies
In chapter 5 the managerial function of leading is described as well as a few issues
surrounding employee motivation Also included in chapter 5 is the theory behind energy
management controlling where concepts surrounding energy standards detection of deviations
and correction of deviations are elaborated on
The last chapter chapter 6 concludes the dissertation objectives and ends with
recommendations with regard to selected topics
Lastly the case studies presented in this study are with reference to the oxygen plant at Sasol
Secunda in South Africa unless otherwise stated
Electrical Electronic and Computer Engineering 4
Chapter 2 Cryogenic Air Separation
CHAPTER 2 CRYOGENIC AIR SEPARATION
21 INTRODUCTION
Air is a composition of various gasses of which nitrogen (N2) and oxygen (02) collectively
account for approximately 9903 of the total sample volume (Table 21) Various needs
have been developed for application of these gasses especially in the steel petrochemical and
metal industries where large amounts of oxygen and nitrogen are required According to Kotz
et ai [1] oxygen and nitrogen are used the most extensively by industry and they are annually
among the top five chemicals produced in the United States
Table 21 Components of air and their properties (Sources Austin [11] Kotz et ai [1])
Gas Molar Mass (mole) Volume () Boiling Point (K) Nitrogen 2801 78084 7735 Oxygen 3200 20946 9019 Argon 3995 0934 8727 Hydrogen 101 000005 2027 Neon 2018 0001921 2709 Helium 400 00005239 422 Krypton 8380 00001139 11981 Xenon 13129 00000087 16504 Carbon dioxide 4401 002-004 19468 bull Average molar mass of dry air =2896 gmol
Oxygen and nitrogen are produced by means of an air separation process which entails the
separation of air into its constituents The rare gasses like for example Argon Krypton and
Xenon are normally obtained as byproducts of the air separation process
Realization of the air separation process is done through the implementation of a specific air
separation technology There exist different air separation technologies today each one aimed
at exploiting different attributes with regard to the difference in physical properties between
the constituent air gasses In other words an air separation technology is based on the fact that
the fundamental components of air all have different physical properties and air separation is
Electrical Electronic and Computer Engineering 5
Chapter 2 Cryogenic Air Separation
therefore realized through for example distinguishing between molecule sizes distinguishing
between difference in diffusion rates through certain materials adsorption preference special
materials have towards certain gasses of the atmosphere and difference in boiling
temperatures
Some of the technologies being used today include adsorption chemical processes polymeric
membranes ion transport membrane (ITM) and cryogenic Table 22 compares the different
air separation technologies to each other in terms of technology status byproduct capability
product purity limit and plant startup time As can be seen from the table cryogenic air
separation technology is in a mature stage of its life cycle consequently making it the only
feasible means currently available for mass production of air products such as oxygen and
nitrogen
Table 22 Comparison of air separation technologies (Smith et ai [2])
Process Status Byproduct capability
Purity limit (vol )
Start-up time
Adsorption Semi -mature Poor 93-95 minutes Chemical developing Poor gt99 hours Cryogenic mature Excellent gt99 hours Membrane Semi-mature Poor 40 minutes ITM developing Poor gt99 hours
The sections that follow will be dedicated to cryogenic air separation technology
22 PROCESS DESCRIPTION
Cryogenic air separation technology is based on the fact that the different constituent gasses of
air all have different boiling points and by manipulating the immediate environment in terms
of temperature and pressure the air can be separated into its components
Various processes are needed in a cryogenic air separation plant of which the fundamental
ones are air compression air purification heat exchanging distillation and product
Electrical Electronic and Computer Engineering 6
Chapter 2 Cryogenic Air Separation
compression (figure 21)
Air Product Product compression compression delivery
I
Air - Heat Distillation
purification exchange
Figure 21 Processes involved in cryogenic air separation
Each process of figure 21 has a certain function and this function is performed by means of
relevant equipment Table 23 lists the equipment type utiHzed in each of the required
processes as well as their respective main functions
Table 23 A description on the function of each process and the equipment used for the
implementation thereof
Process Function Equipment type Pressurize air feed lines in
Air compression order to achieve required Compressor production I Purifying the air by Reversible exchangerssieve
Air purification removing water and CO2 adsorbers Cooling of incoming air feed by means of cold
Heat exchanging Heat exchanger recovery from exiting products Partial separation of air into
Distillation Distillation columns its constituents Pressurize outgoing product
Product compression feed in to meet user Compressor requirement
Electrical Electronic and Computer Engineering 7
Chapter 2 Cryogenic Air Separation
In figure 21 incoming air is pressurized by the air compressors and enters the process with a
certain flow-rate as determined by the demand of air product at the output of the plant
The air pre-treatment section removes impurities like water carbon dioxide and hydrocarbons
and is necessary because it prohibits vapour condensation liquid water solidification and
gaseous CO2 condensation from occurring within the heat-exchanger thus ensuring
continuous operation of a train
In order to obtain the required conditions for air distillation the air first needs to be cooled
down and this is done by means of heat exchanging between the air and outgoing product
streams
The distillation process is at the heart of the overall process this process performs the actual
separation of air into its constituents These air products are produced with a certain purity
which is defined as the ratio of the quantity of 100 pure air product to the quantity of total of
air product at the output
The outputs from the distillation process are fed back through the heat exchanger in order to
realize the cold recovery process that is needed for the cooling of the incoming air feed lines
The main air product is at low pressure when exiting the distillation process and is for this
reason usually compressed to the clients pressure specification prior to delivery
The system incorporating these processes is referred to as an oxygen or nitrogen train
whatever the main product may be A number of such trains are usually cascaded in order to
produce a high-tonnage air product output and is then collectively referred to as an oxygen or
nitrogen plant
The capacity of cryogenic air separation trains is expressed in tons per day (tpel) of main
Electrical Electronic and Computer Engineering 8
Chapter 2 Cryogenic Air Separation
product output The flow of air products is usually quantified in terms of normal-cubic meter
per hour (Nm31h) which is defined as the flow at 1013 absolute bar and DoC This is in
actuality a mass flow and not a volume flow and conversion between Nm3Ih and tpd may be
done by using the ideal gas law as stated in Perry et al [12] and Fishbane et al[13]
pV =nRT (1)
where
bull P is the gas pressure (kPa)
bull V is the volume (m3)
bull Tis the gas temperature (K)
bull R is the gas constant (831451JmoZ- i Ki)
Rearranging equation (1) and substituting the normal conditions stated earlier gives equation
(2)
V =22414xn (2)
Thus the volume occupied by one mole of gas is 22414m3 at normal conditions whatever the
gas may be The periodic table (Kotz et al [1]) states the molar mass of elements and this is
32gmol for oxygen (02) and 28gmol for nitrogen (N2) and knowing that Itpd is equivalent
to10624 glhour one may evaluate the ton per day rating for oxygen and nitrogen from the
mass flow specification or vice versa
ltpd O2 =2918 Nm31h (3)
1tpdN2= 3335 Nm31h (4)
23 DISTILLATION
As stated earlier the distillation process is at the heart of the overall process and for the
purpose of this dissertation this section will be dedicated to a basic explanation on its
operation The working of this process will be explained by means of an example highlighting
the critical elements of distillation and later on applying these principles to the distillation of
air
Electrical Electronic and Computer Engineering 9
Chapter 2 Cryogenic Air Separation
231 Example Distillation of an alcohol and water mixture
Consider a distillation flask in which there is a mixture of water and alcohol as depicted in
figure 22
Water + Alcohol
Figure 22 Distillation flask with water and alcohol mixture
In figure 23 the mixture is brought to boiling point with a boiler and a gaseous phase richer
in the most volatile component is obtained The gas is condensed and as alcohol vaporizes at
a lower temperature than water (we say that alcohol is more volatile than water) a distillate
richer in volatile elements is obtained
Gas richer in alcohol
Alcohol-rich
distillate
Figure 23 Water and alcohol mixture at boiling point producing a gas and consequent
distillate richer in alcohol
Condenser
Boiler
2 e]
Electrical Electronic and Computer Engineering 10
Chapter 2 Cryogenic Air Separation
By simply cascading a number of such systems as in figure 23 it is possible to make the
distillate richer and richer in volatile elements and thus effectively increasing the volatile
element purity of the distillate This arrangement is depicted in figure 24 and shows the
location of where the respective volumes of the volatile rich element and the less volatile rich
element may be obtained
This arrangement however has the disadvantage that it needs as many boilers and condensers
as distillation flasks but this can be overcome by making the liquid-gas contact more efficient
as is also being done in practice
Rich in less volatile Rich in volatile element (water) element (alcohol)
Figure 24 Cascaded distillation flasks producing a substance rich in volatile element at the
top and a substance rich in less volatile element at the bottom
By improving liquid-gas contact as shown in figure 25 better heat exchanging between the
liquid and the gas may be realized causing the gas to be cooled down partially and the liquid
to be heated up partially Cooling down the gas leads to its partial condensation and heating up
the liquid is accompanied by partial boiling thus distillation with only one boiler may still be
realized given that liquid gas contact is improved
Electrical Electronic and Computer Engineering 11
Chapter 2 Cryogenic Air Separation
Rich in less volatile element
(water)
Rich in volatile element (alcohol)
Figure 25 Distillation by means of improved liquid-gas contact between cascaded distillation
flasks
This concludes the water and alcohol example and the basic theory explained here will now be
made applicable to air distillation
232 Distillation of air
In practice distillation trays instead of flasks are used and the basic function of the tray is to
enable efficient contact of the descending liquid and the rising gas Thus the tray sets the
stage for following
bull Cooling and partial condensation of the rising gas
bull Heating and partial vaporization of the descending liquid
Figure 26 depicts a distillation column with only one vaporizer and one condenser
Distillation is made possible by efficient liquid-gas contact and this is enabled through proper
contact between the descending liquid and the rising gas The respective purities of the most
volatile and less volatile elements differ at each tray with the lower and upper sides of the
disti1lation column being the two extremes which is also where the pure elements are
obtained
Electrical Electronic and Computer Engineering 12
Chapter 2 Cryogenic Air Separation
Suppose that the mixture is no longer water and alcohol but oxygen and nitrogen (Le air)
then oxygen (less volatile element) would be produced at the bottom and nitrogen (most
volatile element) at the top
In figure 26 it is clear that the tray provides the rising gas with a certain resistance and thus
creating a pressure drop this pressure drop must be as small as possible for it has a significant
impact on the energy consumption of the air compressor and is also an important parameter in
development of a trays technology Distillation packing is another technology that is being
used and as opposed to fractional distillation trays ensures a much smaller total pressure drop
as well as improved liquid-gas contact
Condenser
Liquid-gas contact c s 0 r w
Distillation )column
Tray )
Vaporizer
Most volatile
component
$1
~ 8shyS 0 u
~ cI-0 gt
S
4-lt 0
egt middotc ~
$1 ltU $1 0
ashy0 u ltU
3 -cI-0 gt ~
4-lt 0
egt middotc I
Q
Less volatile
component
Figure 26 Distillation column producing oxygen and nitrogen by means of fractional
distillation trays [5J
Electrical Electronic and Computer Engineering 13
Chapter 2 Cryogenic Air Separation
In practice the model presented in figure 26 would be uneconomical since it needs both a
vaporizer and condenser It is possible to remove either one but then the column would be
limited to either producing oxygen or nitrogen and not both at the same time
When removing the condenser it is still possible to produce oxygen however a liquid mixture
of nitrogen and oxygen is needed and this must be injected at the top of the column as shown
in figure 27
Residual product (N2 + O2)
GAS
LIQUID
Less volatile air product (02 )
LIQUID Vaporizer
Figure 27 Producing oxygen by utilizing a distillation column with no condenser [5]
It is important that the mixture entering the column must be in the liquid phase otherwise
there will only be one phase (gas phase) in the column which means that distillation would
not be possible as it requires both a gas phase and a liquid phase
Thus with the model presented in figure 27 liquid oxygen is produced at the bottom and a
residual gas consisting of nitrogen and oxygen at the top
Electrical Electronic and Computer Engineering 14
Chapter 2 Cryogenic Air Separation
Figure 28 shows a model for producing nitrogen The distillation column utilizes only a
condenser and it is required that a nitrogen and oxygen gas mixture be injected at the bottom
of the column
Condenser The more volatile product
GAS
Nz+ O2 mixture
Residual product (N2+ O2)GAS
LIQUID
Figure 28 Producing nitrogen by utilizing a distillation column with no vaporizer [5]
Gaseous nitrogen is obtained at the top of the column whereas a residual liquid mixture rich in
oxygen is obtained as a byproduct at the bottom of the column
By injecting a liquid oxygen and nitrogen mixture instead of a gaseous mixture at the bottom
of the column would make distillation impossible because there will again be only be one
phase (liquid phase) present
Thus to summarize when producing oxygen a liquid mixture of oxygen and nitrogen and a
column equipped with a vaporizer at the bottom is required To produce nitrogen a gaseous
Electrical Electronic and Computer Engineering 15
Chapter 2 Cryogenic Air Separation
mixture of oxygen and nitrogen as well as a column equipped with a condenser at the top is
needed a byproduct rich in oxygen will also be produced in this instance
By stacking the columns presented in figures 27 and 28 on top of one another and by
routing the oxygen rich liquid which is obtained at the bottom of the nitrogen column to the
top of the oxygen column it is possible to produce oxygen and nitrogen by using only a
condenser as shown in figure 29
An oxygen rich liquid enters the top of the upper distillation column and through distillation
results in liquid oxygen (LOX) at the bottom of the same column Vaporization of the LOX
into gaseous oxygen (OOX) is realized by means of the heat exchanging that occurs between
the gaseous nitrogen (OAN) at the top of the lower column and the LOX at the bottom of the
upper column At the top of the upper column a waste product consisting of a nitrogen and
oxygen gas mixture is also produced
In practice the function of the condenser is fulfilled by a heat exchanger that ensures that
proper heat is carried over from the OAN to the LOX and vice versa in order to enable
vaporization of the LOX and condensation of the OAN which is required for the continuous
operation of the distillation columns
In this model the columns are stacked on top of each other but it is also possible to place them
alongside one another as occasionally being done in practice
This concludes the discussion on distillation further explanation on this subject is beyond the
scope of this dissertation and the basic theory presented here should be sufficient and relevant
to understanding the selected material presented in this study
Electrical Electronic and Computer Engineering 16
Chapter 2 Cryogenic Air Separation
GOX ---shy
LOX l1li---shy
Condenser
GAN ---shy
Air
Oxygen rich liquid
Figure 29 Stacked column model that enables the production of oxygen and nitrogen
Electrical Electronic and Computer Engineering 17
Chapter 2 Cryogenic Air Separation
24 CONCLUSION
This chapter has explained the basic theory behind cryogenic air separation It details the
properties of air and compares the various technologies for producing certain air products
This chapter states the main processes of cryogemc air separation and they are air
compression air purification heat exchanging distillation and product compression These
processes as well as the interaction between them have been described
Distillation is the key process in cryogenic air separation and has consequently been given
special consideration to in this chapter The basic theory behind distillation as well as how this
applies to the separation of air have been elaborated on which should serve as a sufficient
reference for the remainder of this dissertation
Electrical Electronic and Computer Engineering 18
Chapter 3 Energy Management
CHAPTER 3 ENERGY MANAGEMENT
31 INTRODUCTION
Management is essential in any organized collaboration and should be implemented at all
levels of an enterprise (Koontz [14] et al) An organization has certain inputs to its disposal
be it human resources funds technology skills etc and it is the basic function of the manager
in charge to efficiently manage these valuable inputs in pursuit of achieving predefined
objectives in an optimum manner In an industrial plant like the cryogenic air separation plant
typical inputs are production personnel the various maintenance departments (electrical
mechanical instrument turbo etc) engineering financial and information technology among
others and all these resources are normally subjected to some form of management Energy is
another important input to the plant the plant needs energy to produce its products to the
clients specification and given that cryogenic air separation plants are energy intensive by
nature efficient energy management will have a definite impact in the cost per product
produced
For instance the oxygen plant at Sasol Secunda in South Africa is composed out of several
trains which col1ectively account for approximately 35 of the factorys total power
consumption In terms of the total operating cost of the oxygen plant itself the energy cost
constitutes 72 thereof compared to the 2 of labor costs and 8 of maintenance related
costs [15] This relatively large electricity cost is typical of cryogenic air separation plants
(also refer to Sarkar [6] and Gupta et al [9]) and it is quite possible to manage the usage of
energy in such a way as to ultimately reduce the cost per product produced
32 ENERGY MANAGEMENT AT CRYOGENIC AIR SEPARATION PLANTS
Turner [16] defines energy management as the control of energy consuming devices for the
purpose of minimizing energy demand and consumption Energy management is defined by
Janse van Rensburg [17] to be the perspicacious and efficient usage of energy Another
definition is that from Ottaviano [18] where energy management is defined as the reduction of
demand through conservation
Electrical Electronic and Computer Engineering 19
Chapter 3 Energy Management
The aim of energy management is defined by Thuman et al [10] as the reduction of energy
expenditure for the purpose of reducing the cost of a product so as to increase competitive
performance
With the various energy management definitions in mind one can come to the conclusion that
energy management is some sort of process ultimately resulting in reduced energy
expenditure How then would one go about describing this process which energy
management is In terms of energy management applied to cryogenic air separation plants
energy management may sufficiently be described as a transformation process and this will be
the topic of the next section
32 MODEL FOR ENERGY MANAGEMENT AT CRYOGENIC AIR SEPARATION
PLANTS
The Oxford dictionary [19] defines a model as a representation of reality a simplified
description of a complex system The model developed here serves as a generic framework for
energy management at cryogenic air separation plants and provides insight and understanding
of the energy management process as well as giving structure to this understanding it is a
product of systems thinking and takes on a holistic approach towards energy management A
basic outline ofthe model is presented in figure 31
External environment
Inputs
Resources Accomplished objectives
Figure 31 Basic outline of the energy management model
Energy management process
(transformation process) Outputs
Electrical Electronic and Computer Engineering 20
Chapter 3 Energy Management
The basic function of the energy manager is to transform the inputs (resources) in an effective
and efficient manner into outputs of higher value With the available resources as levers and
with the expected objectives in mind the energy manager has to convert the resources into the
pre-defined objectives by means of a transformation process This transformation process is
the organizational structure of the energy management program for which the management
thereof is the responsibility of the energy manager
The organizational structure of the energy management program is part of larger systems such
as the industry to which it belongs social systems economic systems and even the natural
environment and this is accounted for by the inclusion of the external environment Typical
inputs from the external environment are resources like capital skills facilities and people
and as shown in the figure the external environment is ultimately affected by the outcomes of
the energy management program
33 ENERGY MANAGEMENT SYSTEM THE TRANSFORMATION PROCESS
It is generally accepted that the fundamental components of management are planning
organizing staffing leading and controlling (Koontz et al [14]) Energy management is a
managerial action and most of these functions also apply to the energy management system
Figure 32 depicts the energy management model and states the components of the
transformation process
Through organizing the energy management program the energy manager gives it definition
and structure It mainly involves identification and classification of required activities and the
grouping of these activities in a structured and meaningful way
Planning involves the decision-making process This is where policies are set objectives are
determined and the strategies in attaining these objectives are established
Electrical Electronic and Computer Engineering
i L4502-7S
bH LczJ 717 ~
21
Chapter 3 Energy Management
Inputs Resources
- Capital
- Skills
- Facilities
- People
External environment
- Energy management structure C1et1m1t10Ilt~1
- Energy policy strategy
Hil- Human resource deployment
- Current situation evaluation
- Energy systems maintenance
- Energy management plan
Establishing standards
Performance measurement
Figure 32 The energy management model
Outputs Accomplished energy management objectives
- Reduced production cost
- PM maintenance strategies
- Improved plant design
- Improved production schedules
- etc
Electrical Electronic and Computer Engineering 22
Chapter 3 Energy Management
Leading refers to the process of influencing people so that they will strive willingly and
enthusiastically toward the achievement of energy management goals
Controlling is the measurement and correction of performance in order to ensure that
objectives and the plans devised in attaining them are being accomplished
These managerial functions make up the transformation process and in performing these
functions the energy manager enables an efficient and effective process for achieving energy
management objectives Analysis of each of these functions will be given in the chapters that
follow
34 CONCLUSION
In this chapter a model for energy management is given the energy management process is
modeled as a transformation process in which resource inputs are converted into outputs of
higher value
The model entails the transformation process its inputs and outputs and the external
environment as well as the interaction between all of these Inputs are resources like people
skills and facilities outputs are the accomplished energy management objectives like
improved preventive maintenance schedules optimized production schedules and reduced
energy cost
The external environment accounts for the higher-order systems to which the energy
management system belongs The transformation process involves the managerial functions of
organizing planning leading and controlling which are the core managerial functions the
energy manager has to perform Each function entails various activities and will be explained
in more detail in the chapters that follow
Electrical Electronic and Computer Engineering 23
Chapter 4 Organizing and Planning
CHAPTER 4 ORGANIZING AND PLANNING
41 ORGANIZING
With reference to general management Koontz et al [14] states that organization implies a
formalized intentional structure of roles and positions Generally organization involves 1) the
identification and classification of required activities 2) the grouping of activities necessary to
obtain objectives and 3) the delegation of authority for the means of managing these
groupings
With reference to energy management there should be an intentional and formal structure in
place for conducting a continuous and efficient energy management program The structure
presented in this study defines three groups of activities energy management planning
leading and controlling The activities under each grouping will be explained in the sections
and chapters that follow
42 PLANNING
Planning involves decision-making This is where courses of action are selected objectives are
set and strategies in attaining these objectives are determined The starting block of the energy
management program is the energy policy The energy policy is a statement or understanding
that guides or channels thinking it is an expression of the commitment plant management has
towards a continuous and effective energy management and sets the scope for energy
management strategies at plant level
43 THE ENERGY POLICY
Plant management should establish an energy policy that is in line with major policies in order
to ultimately add value to overall company objectives The energy policy at plant level may be
derived from a major policy and is therefore called a derivative or minor policy (Koontz et al
[141) Figure 41 shows the energy policy at various levels of the organization as well as the
scope of the policy at each of these levels
Electrical Electronic and Computer Engineering 24
C hapter 4 Organi zing and Planning
Company wide policy
Scope of company wide policy
incorporating all divis ions
Scope of divisional policy derived from
company poli cy
Scope of plant pol icy deri ved From the
divisional policy and made appl icable to
the plant
Figure 4 1 Energy policy at different levels o f the organi zati o n and the scope of the po licy at
each level
Thus the energy poli cy aL planL level is Lypicall y a deri vati on o f hi ghe r-orde r po li c ies Lhese
policies may be hi gher-level energy or environmental po li cies and has a much la rger scope
than the plant-level energy po li cy
As an example the sa fety hea lth and environmental po li cy of Sasol Secunda is a companyshy
wide policy
bull Compally-wide policy (Safety Health and Environll1el11al Policy)
Electrica l E lecLronic and Com pULer Eng ineering 25
Chapter 4 Organizing and Planning
We are committed to responsible utilization of natural resources and we will manage our
company wherever we do business in an ethical way that strikes an appropriate and well
reasoned balance between economic social and environmental needs [20]
From this policy it can be seen that Sasol recognizes its responsibility towards the
environment and also states that intentional effort concerning the balance between economic
and environmental issues will be instated by means of managerial actions which is also where
the high-level energy policy may stem from
bull Division-wide policy
To manage the SasollElectricity Supply Industry interface so as to minimize the total cost of
energy for the Sasol group of companies Further to this to promote energy efficiency and
reward energy management success by decentralizing accountability for electricity costs and
by aligning internal electricity tariff structures with the Eskom marginal rate [21]
From the above an energy policy at plant-level may now be derived
bull Plant-wide energy policy
We at oxygen plant are committed to responsible energy usage and endorse efficient energy
management practices in order to optimize our energy consumption
The energy policy normally consists out of three components the declaration of commitment
mission statement and specific objectives To illustrate the difference between these the
division-wide policy [21] will be taken as an example The mission statement defines the
scope of the energy management program and as can be seen in this case it has been included
in the declaration of commitment
Electrical Electronic and Computer Engineering 26
Chapter 4 Organizing and Planning
The specific objectives are the means for achieving that stated in the mission statement and
from the same example some objectives are
bull Develop ways of getting all stakeholders involved in energy management
bull Implement and continuously improve world-class best practice energy management
within our operations
bull Pioneer cross-functional and cross-divisional collaboration within the group of
companies
bull Facilitate the creation of an enabling environment which leads all key role players
agreeing to and achieving stretched targets
bull Develop and maintain the electricity measurement system within the group of companies
44 THE ENERGY POLICY STRATEGY
With the energy policy in place the logical next step would be to formulate a strategy in order
to realize the vision as expressed by the policy The energy policy strategy effectively
encapsulates the plan for changing current reality into future vision and in doing so the
following activities need to be addressed
bull deployment of human resources
bull current situation evaluation
bull energy systems maintenance
bull energy management planning
bull establishment of measurement and control indicators
These are the constituents of the energy policy strategy and each will be elaborated on in the
sections that follow
Electrical Electronic and Computer Engineering 27
Chapter 4 Organizing and Planning
441 Deployment of human resources
Plant management should appoint a dedicated person for taking the responsibility of driving
the energy management program This person should be knowledgeable of the technology
used in cryogenics and be experienced in energy auditing and management This person
should also assist plant management in adjustingrefining the current energy policy in order to
make sure that it adds value and makes allowance for the holistic approach of energy
management
Koontz et al [14] defines two types of policies namely intended policy and actual policy
Initially plant management may have had no intended energy policy but by agreeing upon the
appointment of a dedicated energy manager to drive an energy management program they
have in actuality instated an ill-defined energy policy and it is the task of the energy manager
to now properly structure and formalize the energy policy in conjunction with management
442 Current situation evaluation
The current situation of the plant is assessed by means of an energy audit process Energy
auditing is an important phase of the energy management program and the success of such a
program to a large extent depends on how well and to what extent the energy audit was done
(Thuman [22] and Ottaviano [18]) After all the plant first has to know itself before it can
correct itself The aim of the auditing process is to establish the relative position of the plant
from an energy management point of view
Auditing is not a once-off process instead it should be done on a regular basis so that the
energy manager can make the value-adding decisions regarding corrective measures The
outcomes of the auditing process are the following (refer also to Ottaviano [18])
bull assessment of energy consumption and energy usage patterns
bull identification of potential improvement opportunities
bull assessment of energy norms
Electrical Electronic and Computer Engineering 28
Chapter 4 Organizing and Planning
bull employee awareness
bull feasibility of potential energy projects
4421 The energy audit process
The audit process consists out of the energy audit policy and the energy audit strategy The
energy audit policy sets the scope for what to audit whereas the energy audit policy strategy
states how this would be done
The audit strategies are the means for conducting the energy audit and the relative position of
the plant with regard to energy management is determined through the evaluation of certain
plant efficiencies as listed by Senekal [23]
bull Management efficiency
bull Maintenance efficiency
bull Operating efficiency
bull Design efficiency
bull Storage efficiency
bull Information efficiency
These efficiencies are determined from an energy management perspective and a holistic
approach to energy management lies in managing available resources in such a manner as to
optimize all these efficiencies
4422 The plant efficiencies
The cryogenic air separation plant like any other enterprise aims to convert resource inputs
into outputs of higher value For the cryogenic air separation plant typical inputs are capital
employees skills and technology and the common goal is to convert these inputs into products
Electrical Electronic and Computer Engineering 29
Chapter 4 Organizing and Planning
like oxygen nitrogen andor rare gases to customer satisfaction This conversion is done with
some amount of efficiency loss and in optimizing the overall efficiency necessarily means a
higher level of output with the same amount of input
Each department within the plant contributes to the overall efficiency loss and the contribution
energy management has is assessed in terms of the efficiencies already listed
Plant structure from energy management perspective
Management Maintenance Operating Design Storage Information
efficiency efficiency efficiency efficiency efficiency efficiency ~ ~ ~
~ ~ ~ - ~ ~ - v
-- - - -
Quantity of output product Resources
per unit of electrical cost
Figure 42 An illustration of efficiency losses inherent to the plants structure from an energy
managers perspective and how they collectively contribute to the ultimate quantity of output
product per Rand of electrical cost
In order to assess these plant efficiencies certain strategies should be employed but first an
explanation on what each efficiency entail will be presented
bull Management efficiency
Management efficiency is determined in terms of the commitment plant management has
toward energy management The level of this commitment should be determined and is a
function of the following
bull The existing energy policy
bull Amount of resources allocated for energy management
Electrical Electronic and Computer Engineering 30
Chapter 4 Organizing and Planning
The energy manager should determine whether there is an existing energy policy in place and
also establish on which level this policy originates from Next it should be determined
whether this policy has been derived to plant level and also whether it has been applied at this
level The extent of this application should also be determined Le are there any strategies
outflowing from this policy Have any resources been committed Have they been
implemented Are they relevant and in scope
bull Maintenance efficiency
The maintenance efficiency is determined by the extent of intentional consideration given to
the optimization of energy efficiency of relevant equipment in existing maintenance life plans
Maintenance efficiency goes hand in hand with energy systems maintenance which will be
dealt with in more detail later on in this chapter
bull Operating efficiency
By taking the system just as it is and not altering any design features try to obtain the most
efficient system operation This could mean changing process schedules or consolidating plant
activities
As mentioned by Senekal [23] the operating design and storage efficiencies are very closely
related and in most of the cases by changing one it would have an influence on the other two
These three efficiencies may be determined by means of utilizing a mathematical model
which is a specific audit strategy and will be discussed later on
As an example of operating efficiency consider an oxygen plant that has electric motor driven
compressors as well as steam turbine driven compressors During peak hours steam is cheaper
than electricity which means that just by changing production schedules of the electric andmiddot
steam trains during these times (increasing production of the steam trains and lowering that of
the electric trains) significant energy cost savings may be realized
Electrical Electronic and Computer Engineering 31
Chapter 4 Organizing and Planning
bull Design efficiency
Design efficiency entails the evaluation of the plants efficiency by taking into account the
systems design Restraining factors in the design are identified and by altering design
parameters the auditor can determine possible ways of optimization These design
deficiencies are normally the cause of
bull Inadequate design from an energy managers point of view
bull Inefficient equipment - a cause of equipment deterioration andor the availability of
improved and more energy efficient technology
For example at one plant motor-generator sets are used for bringing the large air compressor
motors up to speed The MG sets were installed twenty years ago and compared to soft starter
technologies available today are much more unreliable The unreliability of the MG set
caused numerous startup delays in the past resulting in significant production losses with the
implication that production department insisted that the air compressors be kept online even
when product demand is low This decision acts as a barrier to potential energy savings that
lies in taking an air compressor off-line when demand is low Thus by changing the original
design through introducing better technology (implementing better soft starter technology)
may lead to potential energy cost savings
bull Storage efficiency
Often there are cost saving opportunities by using storage facilities more efficiently This can
be seen in the case were the plant has a LOX tank facility to its disposal Excess LOX can be
pumped to the tank during off-peak times and can then be used later on to supplement the
demand during peak times Because there is now an extra supply channel it leads to the air
compressors having to produce less compressed air and ultimately results in energy cost
savings
bull Information efficiency
Information efficiency refers to the availability and nature of the relevant information
Electrical Electronic and Computer Engineering 32
Chapter 4 Organizing and Planning
necessary for conducting the energy management program Correct and accurate information
is vital to the energy management program and the energy manager must make sure that
relevant information is easily accessible
For instance data concerning the state (flows pressures temperatures purities etc) of air
commodities within the plant and each of the respective trains is crucial performing certain
energy management activities and barriers restricting the accessibility and availability of this
information should be addressed and overcome if the energy management effort is by any
means going to be successful
4423 Energy audit policy
The audit policy scopes the auditing work to be done and basically serves as a guideline in the
auditing process It is advisable to establish a formal energy audit policy because it gives
direction to the audit process and for the holistic approach this policy should enable the
assessment of all the relevant plant efficiencies mentioned earlier
4424 Energy audit strategy
In order to determine the plant efficiencies as stated in the audit policy audit strategies are
utilized and those that are most relevant are (also refer to Turner [16])
bull Familiarization with plant characteristics and operation
bull The questionnaire
bull The walk audit
bull The measurement audit
bull Database building
bull Mathematical model
bull Financial analysis and feasibility studies
Each strategy will now be looked at in more detail in the sections that follow
Electrical Electronic and Computer Engineering 33
Chapter 4 Organizing and Planning
bull Familiarization with plant characteristics and operation
For the audit to bear meaningful results the energy manager should first attain a relatively
thorough understanding of the characteristics of the plant as well as its production policy This
entails the following
bull Understanding of operating characteristics and production policy This also
includes identifying the input and output streams to and from the plant
bull Construct relevant process flow diagrams - This includes process models of the
plant and relevant sub-systems Also identify and make a list of all the energy
consuming components include attributes such as equipment ratings purpose of
equipment and quantity of each
bull Establish the user requirements for the plant and critical sub-sections
The key principles in plant familiarization will now be applied by taking the oxygen plant at
Sasol Secunda as an example
o Understanding ofoperating characteristics and production policy
The oxygen plant is part of a process chain and to have an idea of where it fits into the overall
system the following two tables shows the inputs of and outputs to and from the oxygen plant
Table 41 Details surrounding commodity inputs to the oxygen plant at Sasol Secunda
Water works
Distribution
and Plant air Air utilities
Electrical Electronic and Computer Engineering 34
Chapter 4 Organizing and Planning
Table 42 Details surrounding commodity outputs from the oxygen plant at Sasol Secunda
upplying various factory loads
The plant is running at full load twenty-four hours per day seven days a week All the outputs
must be produced with minimal stoppage The plant also incorporates a very useful buffer
system a LOX tank which is supplemented with excess LOX at times when oxygen demand is
relatively low or whenever there is spare capacity available The LOX tank serves the purpose
of supplementing oxygen demand at peak times when the available capacity isnt able to
match the demand Because atmospheric temperature plays such an important role in
producing excess LOX this commodity is usually fed to the LOX tank overnight when
temperatures are relatively low
There is a balance to be maintained in producing the various products which means that a
change in major output streams has a definite influence on the other output products There is
however priority assigned to the production of each commodity detailed in table 43
Table 43 Prioritization of output products of the oxygen plant
Priority Product Implication of production loss 1 (highest) Oxygen amp Nitrogen Substantial production loss 2 Nitrogen Substantial production loss 3 Instrument air Non-critical plants trip 4 (lowest) LOX Production loss at KryptonXenon plant
Electrical Electronic and Computer Engineering
I
35
Chapter 4 Organizing and Planning
CJ Construct relevant process flow diagrams
The oxygen plant comprises of seven oxygen trains as well as a spare oxygen compressor and
the outline of the plant is shown in figure 43
Oxygen Plant
HP02
507 200 Nm3h and 985 purity
~
l~ 0 72 200 Nm3h I
Air Inbull Train 1 I II 1middot O2 72200 Nm3h middot middot I Air In
Train 2 II ~
I middot bull I
0 72 200 Nm31h middot middot Air Inbull Train 3 I I ~ bull ~
72 200 middot middot Nm(when online)
I LPO LP~ HPAIR I
COMMON middot middot COMMONbull Spare Train bullbull middot I HEADER HEADERmiddotI I middot middot middot
HP02 middot middotbull I ~
COMMON HEADER
I middot
Air In Train 4 bull middot
middot middot I
O2 72200 NmJh II middot ImiddotI middot Air Ini bull Train 5 I I 0 72 200 NmJh ~
bull bull I
I middot middot Air Inbull Train 6 I i 0 72 200 Nm3h HI bull
middot ~middot middot Air Iny Train 7 II I I
I ~ 0 74000 Nm________________________________J
Figure 43 Basic outline of the oxygen plant at Sasol Secunda The flows presented here are
the steady state maximum amounts of oxygen that each train is able to produce
Electrical Electronic and Computer Engineering 36
Chapter 4 Organizing and Planning
The trains are linked by means of three common headers the air LP oxygen and HP oxygen
common headers Each train can sustain a continuous production of up to 72 200Nm31h of
oxygen except for train 7 which has a slightly higher capacity (74 000Nm31h) resulting in a
collective maximum production capacity of 507 200Nm31h for the plant
The main product high purity gaseous oxygen is produced at 985 purity (minimum) which
is pumped into a common header and distributed to the various loads within each factory
(gasification and gas-reforming)
The main purpose of the air common header is to minimize losses whenever an air compressor
goes offline In normal operation however there is little or no air exchange between trains but
as soon as one air compressor goes offline the air present in the common header supplies that
trains air demand Trains 1-6 are connected to the air common header with train seven
working in isolation Usually the air valve of train seven remains closed it is only in abnormal
circumstances that it is opened but then only by a relatively small amount
A control system monitors and controls the production of compressed air and it does this by
monitoring the compressed air demand and then opening or closing the guide vanes of all six
compressors by an equal amount thus effectively sharing the load equally between the six air
compressors
The spare train consists only of an oxygen compressor and is put online whenever one of the
other oxygen compressors is taken out of operation (eg due to breakdown or for routine
maintenance) Each train has two oxygen outlets namely the high-pressure (HP) outlet and
the low-pressure (LP) outlet In normal operation the trains LP oxygen output is isolated from
the LP common header via a valve but as soon as that trains oxygen compressor is out of
operation the valve opens enabling the LP oxygen to enter the common header and the spare
oxygen compressor goes online
Electrical Electronic and Computer Engineering 37
--
tTl (l) () qshy(i ~ -shytTl (l) () qshy0s ()
sect CJ (1 0 gs tTls
(J(l
Ei (l)
~ Er
(J(l
w
(1r
Excess N2 toatm i
HPN1
Dry air
to factory
Main heat ExchanJ2cr
--------------
=-t--n rI
----n
-
-_ -- J
~Waste N2
1
Coldbox
LOX
TIciQ Air from s -- atmosphere
-- n -
-------- ~
f p0 () (l)
=shy0 ~ 0 ~
s (J(l
(l)
0
~ (J(l (l)
s qshy1
1
Air Water Tower Dryer Dryer
1 2
ChilI Wet air LP02
Water Tower
~ sect
HP02 N (to factory) s
(J(lLPN1
sect CJ
IA g (to factory) ~ ss
Smiddot (J(l 00
Chapter 4 Organizing and Planning
Figure 44 shows the process flow of a single train All the electric utili zi ng equipment are
highlighted Note the quantity and process requirements are also brought onto thi s process
flow diagra m for example (112) means that process requirements need one of the two
installed equipment types during normal operati on
Table 44 Summary of electri cal machinery ratings and capacity requirements for production
means
QuantityO2 Production Operating Motor description Rating requirement QTY
train online
timeday
Expansion turbine motor 525 kW 2 1 24 h
Nitrogen blower motor 300 kW 2 1 24 h
Oxygen compressor motor 137 MW I 1 24 h
Air compressor motor 37MW I I 24 h
Chi ll water pump motor 75 kW 2 1 24 h
Water pump motor 132 kW 2 1 24 h
Jack- up oil pump motor 36kW 2 1 24 h
Installed capacity 52836MW
Utilized capacity 51678MW
Utilization 980
o Establish Ihe II ser requirements
Table 4 5 li sts the user requirements for the oxygen plant s output products
Table 45 Summary of the user requ irements for each product
Product Quantity Purity Delivery p Delivery p (kNm1t) (min) (min) kPa (max) kPa
Oxygen 72000 985 3440 3480 Nitroen 22000 999 420 430 LOX 3500 - 100 120 IA 8000 - 420 450
Electrical Elec troni c and Computer Engineering 39
Chapter 4 Organizing and Planning
bull The questionnaire
In conducting the energy audit the energy manager would undoubtedly find it necessary to
conduct interviews with key personnel The questionnaire is a structured and well-planned
approach in acquiring important information from personnel and it is imperative to identify the
appropriate personnel when conducting the audit For example determining maintenance
practices by interviewing production personnel would in most cases give a distorted picture
of the actual situation or in other instances not bear any meaningful results at all
It is very important that the questionnaire is planned thoroughly in advance The energy
manager should aim to attain as much information as possible with the least amount of
questions since personnel do not always have adequate time available
bull The walk audit
The walk audit goes hand-in-hand with plant familiarization and it enables the energy manager
to view the plant first hand It entails determining the state of the plant and in order for the
energy manager to make this audit value adding it would be a good idea to also take a guide
along one who is experienced with the equipment and the operation of the plant
bull The measurement audit
Relevant measurements of energy consumption flows pressures and temperatures can be
taken whenever there is no automatic measurement system in place but at most of these plants
real-time data collection is in place and data may simply be downloaded from were it is stored
bull Database building
Because the audit process is such an important phase in the energy management program all
the data collected should be stored for easy reference The database is a collection of various
pieces of information in different formats and it is thus important to have a structure in place
in which the information is organized in a meaningful manner The database should compose
Electrical Electronic and Computer Engineering 40
Chapter 4 Organizing and Planning
of the following
bull Results from other audits conducted
bull Specifications of machine ratings
bull Process amp equipment limitations and constraints
bull Operating schedules of plant
bull Maintenance strategies and schedules
bull Financial analysis and feasibility studies
One output of the energy audit process is the identification of potential improvement
opportunities and in response to this the energy manager is now concerned with identifying
alternatives as the means for realizing the different improvements
Normally most of the options would require capital investment to realize and the problem is
that the benefits resulting from an investment option is stretched over a period of time whereas
the investment is required now Thus feasibility studies are conducted with the aid of financial
analysis tools and only the most feasible option for each alternative should be considered
bull Energy conversion model
The energy model is an important auditing tool and adds great value to the energy
management program The basic idea behind the energy conversion model is to express the
plants power consumption as a function of main air product output under certain conditions
From the cryogenic air separation plants point of view a fairly accurate model may be very
complicated but it will be the aim of this section to present model building blocks that are
relatively simple whilst still providing adequate accuracy
As Delport [24] mentions there are basically two levels within process modeling The first
level is the physical model which is the energy managers understanding of the real world
Electrical Electronic and Computer Engineering 41
Chapter 4 Organizing and Planning
system in conjunc ti on with the follo wing restraining factors
bull assumptions and simplifi cations that are in line with the model acc uracy and
requirements
bull level of detail that has been decided upon
bull system and subsystem boundaries
bull data requirements and avail abi li ty
The second level in process modeling is the energy conversion model which is the
mathematical representati on of the physical model The difference between the physica l model
and energy conversion model should be noted the physical model is an abstracti on of the real
world system and the energy conversion model is an abstraction of the physical model
In order to deri ve an energy model for the plant the plant first needs to broken down into its
various levels of subsystems as shown in fi gure 45 It should be noted that the air purifi cati on
system and all other au xili ary equipment have been omitted from thi s system breakdown thi s
is because it is assumed that the energy loss th rough the purification system is negli gible and
the energy consumption of all other auxiliary equ ipment is insignifi cant compared to that of
the compressor motors It may be th at in certa in plants the auxiliary equipment may not be
insignifi cant at all in these situati ons the energy manager is urged to deri ve models fo r these
subsystems as we ll
Whole CRYOGENIC AIR SEPARATION PLANT
Industry
EndmiddotUser Trains 1 to n
Groups
Processes Air Compression
Air Separation Process Product Compression
System Systelll
Machinery Air
Motor Air purifi cation Main Heat Distillation Product
Motor Compressor system Exchanger Columns Compressor
Figure 4 5 Simplified system breakdown structure of the cryogenic air separati on plant
Electrical Electronic and Computer Engineering 42
Chapter 4 Organizing and Planning
From figure 45 the following is clear
n
P =p (1)plant ~ train m
m=
where
bull n is the number of trains
bull Pplant is the power consumption of the cryogenic air separation plant (MW)
bull Ptrain m is the power consumption of train m (MW)
Neglecting power consumption of auxiliary machinery the power consumption for each endshy
user group will be as stated in equation (2)
P =P +P (2)train m ACm PCm
where
bull PACm is the input power of air compressor motor of train m (MW)
bull PPCm is the input power of product compressor motor from train m (MW)
The input power for a compressor motor is
pslUlft
P xm (3)xm
where
bull x refers to the motor of a compressor type x ie the motor driving the air or
product compressor
bull m is the train number
bull Pxm is the input power of type x compressor motor of train m (MW)
Electrical Electronic and Computer Engineering 43
Chapter 4 Organizing and Planning
bull p~ft is the shaft power (output power) of type x compressor motor of train m
(MW)
bull lm is the electromechanical efficiency of type x compressor motor of train m
It is a fact that when a gas is compressed its temperature rises significantly and if this increase
in temperature is too much it would cause the oil to ignite and deteriorate mechanical parts
This places a restriction on the compression ratio (ratio of absolute outlet pressure to absolute
inlet pressure) of the compressor and hence this ratio is rarely greater than three (Air Liquide
[5])
Because of this constraint multi-stage compression with inter-cooling is implemented to
achieve the required output pressure Inter-cooling is normally realized through either air- or
water-cooling however air-cooling is normally limited to smaller size compressors Watershy
cooling is the more effective of the two because of its ease of control and greater heat
absorption capability (Talbott [25])
Another reason for employing multi-staging in compressors is because of its energy saving
attribute the energy saving is achieved because cooling the air down between stages reduces
the inlet air volume of the next compression stage and hence the work required to complete the
compression (Salisbury [26] and Talbott [25])
The operation of the multi-stage compressor can be followed by referring to the pressureshy
volume diagram in figure 46 The area enclosed by 1-2-3-4 represents the adiabatic work to
be done by the compressor to compress a gas from a pressure of PI to P2 The area demarcated
by 1-2-5-4 represents the necessary work for isothermal compression
Electrical Electronic and Computer Engineering 44
Chapter 4 Organizing and Planning
Isothermal Adiabatic compression compression
p
~__________~~__+-______~~~2
v
Figure 46 Multi-stage compression cycle with interstage cooling (Coulson et al [27])
Because the gas inlet temperature at each stage stays constant one can see that actual
compression takes place near the isothermal curve Thus a simplifying assumption would be
to approximate the compressor characteristic by assuming isothermal compression
Thus the shaft power required by the compressor will be as expressed by equation (4)
(4)
where
bull P =output power of type x compressor of train m (MW)
bull 1] =isothermal efficiency of type x compressor of train m xm
Electrical Electronic and Computer Engineering 45
Chapter 4 Organizing and Planning
The output power of the compressor is a function of the intercooler temperature the air flow
and the pressure ratio and for isothermal compression this relationship is expressed as in
equation (5) (refer to Baumeister et al [28] amp Salisbury [26])
out pout = kxQ xl xln Pm (5)xm xm Ie In( Pxm
where
bull Qxm is the gas flow from compressor of type x of train m (kNm3h)
bull 0c is the intercooler temperature (K)
bull P~~ is the gas absolute output pressure of type x compressor of train m (kPa)
bull Pm is the absolute inlet pressure of type x compressor of train m (kP a)
In cryogenic air separation air is separated into its constituents and only by knowing the
constituent ratio of the main air product in a sample of air it is possible to determine the
airflow at the input of the train
QACm = (6a) rmain product
where
bull QACm is the air flow from air compressor of train m (kNm3h)
bull Qure is the total flow of (pure) main air product that originally entered the air
compressor of train m (kNm3h)
bull rmain product is the constituent ratio of the air product in a sample of air For oxygen
this ratio is 209 and for nitrogen this is 780 refer to table 21
Electrical Electronic and Computer Engineering 46
Chapter 4 Organizing and Planning
If there exists an air common header connecting all the trains the main output product may not
necessarily be a result of solely the airflow at that particular trains input since air exchange
between trains does occur and even more so in the case of an air compressor being out of
operation A good approximation would be to average out the total airflow over all the trains
In this case equation (6a) takes on the form of equation (6b)
(
= 1 ~QPureQ (6b)
ACm t- m nrmain product Jm=
The main product is rarely 100 pure there is to some acceptable extent impurities present
in the substance as well Secondly this product is produced with some amount of loss within
the air separation process this loss is quantified in terms the recovery efficiency Thus to
obtain the total flow of the pure product that originally entered at the air compressor side
Purity QPure =Q x main productm (7)
m PCm TJ recm
where
bull Qpcm is the flow rate of the main product from product compressor of train m
bull Puritymain productm is the purity of the primary output product of train m
bull TJrecm is the recovery efficiency of which the air separation process recovers the
primary constituent of air that originally entered the process
It is now possible to compute the air flow however the air discharge pressure is still needed
for computation of the compressor power consumption There is a definite relationship
between the air discharge pressure and air flow and this relationship is defined by the system
characteristic The system needs a specific discharge pressure at a certain flow rate from the
Electrical Electronic and Computer Engineering 47
Chapter 4 Organizing and Planning
air compressor and the relationship between these two parameters in the normal operating
region of the compressor may be approximated quite accurately by a linear model as shown
in figure 47
Thus discharge pressure as a function of air flow will be as shown in equation (8)
out h Q (8)PACm = m +gm ACm
where hm and gm are the constants for train m and may be determined by means of linear
regression
Compressor Surge line characteristic at
different modes of operation
System curve
Linear approximation
Flow
Figure 47 Linear approximation of system curve
Electrical Electronic and Computer Engineering 48
Chapter 4 Organizing and Planning
Although cryogenic air separation trains may have been designed in exactly the same manner
it is a fact that over time they drift in their parameter commonalities and by applying modeling
parameters in one train to other trains as well would ultimately result in high inaccuracy of the
overall plant model Thus certain parameters of the model should be done empirically train by
train Empirical modeling should be sufficient only for all the critical elements of each train
which include
bull electromechanical efficiency of each compressor motor
bull isothermal efficiency of the air and product compressor
bull recovery efficiency of the air separation process
Determination of the electromechanical efficiencies should be enabled through employment of
the correct maintenance strategy as will be discussed in the next chapter If there is no initial
data available concerning the current state of the motor an assumption should be made at first
The recovery lrecm is a symptom of the current state the ASU thus essentially modeling this
system it is determined by taking the average over a sufficient sample period
The isothermal efficiency of the compressor is a function of the gas flow pressure and
intercooler temperature The pressure range in which these compressors are suppose to operate
in is usually relatively small and the empiric modeling of the isothermal efficiency may be
approximated quite accurately by a linear model
out
n - xQ +b x Pxm + xT +d (9)IIxm - axm Xnl xtm -- cxm Ie xm Pinx
where a bull b bull e bull and d bull are constants of compressor type x of train m and arex m x m x m x m
determined by means of linear regression Multiple variable linear regression techniques like
Electrical Electronic and Computer Engineering 49
Chapter 4 Organizing and Planning
for example that described by Makridakis et al [29] should be utilized in determining the
constants If there is no empirical data available for the compressor motors as yet the motor
efficiency and the isothermal efficiency of the compressor may be lumped together (ie
making it one system) and this overall efficiency is then empirically modeled as in equation
(9) this means that the model then (equation 9) encapsulates the compressor efficiency as well
as the motor efficiency
Substitution of these equations leads to the final energy conversion model stated in equation
(10) For a discussion on the application and verification of the abovementioned energy
conversion model the reader is encouraged to refer to the case study presented in the
appendix
h + gm xPUritymainproducmJj[tQ xuritYmain proliuctm Jx~ xln__k_(~Q _m nrmain product =1 PCm Teem
nrmain producl ~ mel ~
reem K
[ m
PACrn
______________~--__-shy__~__________--~--------~) (10)
pp1an t m=J
ACm x [aAcm xQACm +bACm XP~~m + CACm X~C +dAcmJ PinIIC
kxQPCm X~C Xln[ P~m J + PK~
PCm x (apcm x QpCm +bpcm X pPm +CKm X~C +dpcmJ tnPC
443 Energy systems maintenance
There is a definite relationship between maintenance management and energy management
and in most cases one would find that by initiating an action in one would have a definite
effect on the other In fact Turner [16] has gone one step further and expressed the need for
energy systems maintenance Energy systems maintenance is defined as the maintenance of all
systems that use or affect the use of energy
Formulation of an energy systems maintenance life-plan as well as the management thereof is
the responsibility of the energy manager and later on it will be explained on how to assemble
such a plan The output of this maintenance effort is a recommendation and it is up to the
Electrical Electronic and Computer Engineering 50
Chapter 4 Organizing and Planning
energy manager to assist maintenance managers in adopting an energy systems maintenance
component into their life pans which would enable them to consider such a recommendation
In formulating an energy systems maintenance strategy the energy manager first has to
consider and understand at which point it is appropriate to initiate a suitable maintenance
action on relevant equipment To aid explanation to this question refer to figure 48 from an
energy management point of view this system experiences a functional failure A functional
failure is defined by Campbell [30] as the inability of a physical asset to deliver its expected
level of performance In terms of energy management this expected level of performance is
given in the form of an energy norm or standard The expected level of performance thus
defines what can be considered a failure
Engineering standard 1-----------__ ----------------------shy
Flaw in compressed air pipe
Leakage of compressed air
Energy management standard
General maintenance standard Minor leakage
Production standard Major leakage
Time
Figure 48 Functional failures and performance standards
Different departments within the plant (engineering maintenance production) may differ in
asset performance requirements and thus giving rise to the different standards In this example
the flaw in the compressed air pipe causes a leakage of compressed air leading to a decrease in
energy efficiency and money could be saved by initiating a maintenance action sooner than as
scheduled by maintenance department
Electrical Electronic and Computer Engineering 51
Chapter 4 Organizing and Planning
The energy norm or standard thus defines the not only what should be considered a failure but
also the amount of maintenance needed to preserve this level of performance
The difference in standards frequently creates conflict between various departments and when
initiating an energy cost saving maintenance action the energy manager should first reach a
compromise with the different departments For example the electrical maintenance
department of one plant reported high maintenance costs on the oxygen compressor motors
Maintenance department reported that the motors were at the end of their life-cycle and
blamed the more frequent maintenance intervals as the main cause of the rising cost An
energy audit also revealed that the motors lost an average of 9 electromechanical efficiency
from their initial value which gave rise to increased energy cost as well
Considering these two factors an oxygen replacement project was proposed with immediate
commencement Production department however rejected the proposal because the plant
which already operated at full capacity would suffer significant production losses during the
replacement action and proposed that the project should be postponed to a year from then
when an extra oxygen train currently being constructed at that time is in full operation to
which the parties agreed upon and thus effectively reaching a compromise
4431 Establishing an energy systems maintenance life plan
Because plant maintenance has such a significant effect on energy efficiency the energy
manager has to establish an energy systems maintenance life plan aimed at managing
electricity cost that would supplement existing maintenance efforts on the plant
Energy systems maintenance on only those systems that normally have a major impact on the
energy consumption of the train will now be discussed they are the air and product
compressors the air and product compressor motors and the ASU
Electrical Electronic and Computer Engineering 52
Chapter 4 Organizing and Planning
4432 Energy systems maintenance on compressors
Some of the major aspects influencing the energy efficiency of a compressor are the following
(Talbott [25])
bull Wear of mechanical parts
bull Component fouling
bull Contamination with impure substances
bull Inadequate or dirty lubricants
Wear of mechanical parts changes the characteristics of the compressor and ultimately leads to
decreased efficiency Mechanical wear also result from destructive effects dirt particles have
and it is crucial that filtration be kept effective and all inlet piping be kept clean
Fouling changes the flow and pressure relationship of the compressor and thus changing the
characteristic of the original design Even if a good filter is provided fouling is inevitable and
an obvious effect is the restriction of intercooler passages this not only causes poor heat
transfer between the coolant and gas but also leads to an increased pressure drop over the
intercooler resulting in reduced performance (lower efficiency)
Lubricated compressors depend upon oil for both friction reduction and sealing It is obvious
then that if the oil has to be contaminated or corrosive it would be destructive of both
efficiency and valuable capital equipment
4433 Energy systems maintenance on motors
The aim of energy systems maintenance on motors is to improve and preserve the motors
energy efficiency
The great majority of induction motors are used to drive pumps fans blowers and
Electrical Electronic and Computer Engineering 53
Chapter 4 Organizing and Planning
compressors attempting to increase the efficiency of these motors may well result in reduced
motor internal losses but this doesnt necessarily mean reduced input power unlike the case
for synchronous motors as also motivated by Htsui et al [31] Induction motors with a higher
efficiency normally run at a higher speed (lower slip) which ultimately leads to increased
compressor load (also refer to Sen [32]) Figure 49 shows a graphical representation of this
situation
bull The fan laws
Suppose that the existing motor (motor 1) is substituted by a new motor (motor 2) of higher
efficiency which inherently has a smaller full load slip motor 1 operated at operating point 1
(OP 1) and motor 2 now has another operating point (OP 2) The power curve of the new
motor intersects the system curve (compressor load) at a higher load speed resulting in the
compressor requiring more shaft power
Pz +---------------------~r-------~~~~-------------
sbaftspeed
Figure 49 Partial power curves of the existing motor (motor 1) and the new motor (motor 2)
as well as that of the compressor load illustrating the implication of installing a higher
efficiency motor than is currently in operation
Electrical Electronic and Computer Engineering 54
Chapter 4 Organizing and Planning
The reason for the load increasing with increased shaft speed is because of the compressor
conforming to the relationships expressed by the fan laws The following relationships are a
statement of the fan laws and are listed by Brown [33] The fan laws also apply to blowers
fans and pumps and the theory developed here may also be applied to induction motors driving
either one of these mechanical devices
Qan (11)
(12)
(13)
where
bull n is the shaft rotational speed (rpm)
bull Q is the gas flow (kNm3h)
bull P is the discharge pressure of the gas (kPa)
bull P is the power requirement of the compressor (MW)
Thus the gas flow is proportional to the shaft speed the discharge pressure is proportional to
the square of the shaft speed and lastly the compressor power requirement is proportional to
the cube of the shaft speed Equating the above relationships gives the following as stated by
Salisbury [26] and Baumeister et al [28]
(14)Q ~ Q(~J
p ~ p(~J (15)
(16)p~p(~J
Electrical Electronic and Computer Engineering 55
Chapter 4 Organizing and Planning
Were the 1 and 2 subscripts refer to the initial and new conditions respectively Thus by
knowing the compressor performance at one speed one may predict its performance at another
speed
Figure 410 shows a typical compressor characteristic curve as well as the characteristic at
other speeds other than the nominal
Surge line
Compressor characteristic at various speeds
Flow
Figure 410 Compressor characteristic curve at various shaft speeds
bull Energy efficiency analysis
At this stage it becomes quite obvious that there are two contradicting factors presenting
themselves if a higher efficiency motor is installed the motor internal losses have been
reduced but at the same time the motor is most likely to run at a lower slip leading to
increased shaft power demand
Electrical Electronic and Computer Engineering 56
Chapter 4 Organizing and Planning
Thus it becomes clear that an action aimed at reducing electricity cost by improving the motor
efficiency may not be as simple and the energy manager or person in charge should have a
means for quantifying the actual feasibility such an action would have
Installing a new motor for the aim of reducing electricity cost should only become an option
when at least the following statement is true
(17)
were Fnl and Fnz are the input power to motor 1 (current motor) and motor 2 (new motor)
respectively After substitution equation (17) becomes
ut 2 lt utI (18) 17mZx17D2 17m l x 17D1
where
bull utl and u12 are respectively the output power of the current and the new motor
at normal operating conditions
bull 17m and 17m2 are respectively the electromechanical efficiency of each motor
bull 17D1 and 17D2 are respectively the efficiency of the device (compressor blower fan
etc) at the operating point of motor 1 and that of motor 2
What is now needed is an indicator which would inform the energy manager on whether a
new high efficiency motor would consume less power than the existing one This indicator is
defined here as the threshold efficiency which is the efficiency the new motor should at least
have to be the more feasible option The inequality expressed in (18) can be rearranged to give
the following
17m2 gt 17ml (UI2 Jx( 17D1 J (19)ull 17D2
Electrical Electronic and Computer Engineering 57
Chapter 4 Organizing and Planning
The fan law implies that in changing the shaft speed of the compressor its efficiency stays
constant Le 17D2 = 1701 and by inserting equation (16) in (19) equation (20) is obtained
(20)
The operating speed of each motor is where the compressor load curve intersects each motors
power curve thus and may only be determined by actually plotting the motor curves nl n2
with that of the compressor load For the energy engineer to make a clear decision on whether
to upgrade motor efficiency it becomes clear that there should be a maintenance strategy in
place that result in the assessment of the motors current condition And as stated earlier this
assessment is made in terms of the motor efficiency as well as the power or toque curve of the
motor This assessment is the responsibility of the rewinder or the person responsible for the
refurbishment of the motor
The operating speed of the new proposed motor can be expressed in terms of its full load
speed and other known variables For low slip values the power curve may be approximated
by a linear relationship as shown in figure 411 which leads to equation (21)
(21)
where
bull subscript 2 refers to the new proposed motor
bull P2 is the output power (MW)
bull PFL2 is the rated full load shaft power (MW)
bull ns is the synchronous speed (rpm)
bull nFL2 is the rated full load speed (rpm)
Electrical Electronic and Computer Engineering 58
Chapter 4 Organizing and Planning
Motor power System Linear curve curve approximation
shaft speed
Fu1110ad
speed (nr)
Operating speed
(n)
Synchronous speed (ns)
Figure 411 Approximating the power curve with a linear model at low slip values
Applying the fan law by substituting equation (16) into (21) and rearranging to solve for n2
gives the following
(22)
This is a cubic equation and can be solved by applying Cardans solution [34] From Cardans
solution the equation has one real root and gives the approximate load speed the proposed new
motor will operate at
Electrical Electronic and Computer Engineering 59
Chapter 4 Organizing and Planning
Substituting (23) into inequality (20) gives the requirement in terms of its full load speed and
efficiency the new motor should conform to for it to be a more energy efficient option
bull Case study
Suppose the existing motor of figure 49 is considered for replacement This is a four-pole
137MW machine it is fifteen years old and have been rewound three times during its
productive life The decision to do a feasibility study comes after assessment of its current
condition which is detailed in table 46
Table 46 Current motor parameter values
Substituting these parameter values into (24) results in the graph depicted in figure 412 This
curve is basically a motor selection curve for selecting a new 4 pole 137 MW induction motor
as it houses the criteria for the proposed new compressor motor being more energy efficient
than the existing one Now suppose there are three suppliers of these motors as detailed in
table 47
Table 47 Three suppliers of a 4-pole 137MW induction motor with their respective ratings
I I
I Supplier Motor efficiency Motor rated full load speed 1 970 1492
I 2 960 1490 I 3 975 1496 I
Electrical Electronic and Computer Engineering 60
Chapter 4 Organizing and Planning
980 ltI~--~-------~---------lt-~------------------------------- Supplier Cbull975
Supplier A bull 970
tI 965 CI
~ 960 shy bullSupplier B Threshold line CI 955 -shy
CI ~ 95()-=a 945 ~
940
935
930 +-----------------------------------------1
14880 14900 14920 14940 14960 14980 15000
Full load speed (rpm)
Figure 412 Threshold efficiency proposed new motor should adhere to as a function of its
full load speed
As can be seen from the graph all three motors will in each case improve the energy
efficiency of the current compression system for they have ratings that enable them to be
above the threshold line
Now that we know that energy efficiency will be improved regardless of what motor is
selected the next step would be to quantify the energy saving in each case and obviously the
motor with the largest energy saving would ultimately be the most feasible option from an
energy managers point of view
Pinl and Pin2 have been defined in (8) and taking the ratio of these gives
or
Electrical Electronic and Computer Engineering 61
Chapter 4 Organizing and Planning
(25)
thus
(26)Power saving = pbullbull - P2 p+ - [ ~ )( J1 Substituting n2 of equation (23) into (26) gives the approximate power saving in terms of the
known quantities
Power saving =
Jj (27)
The results of each options power saving are listed in table 48
Table 48 Power saving for the different motors from the three suppliers
I Supplier Power saving I A 410kW
I B 260kW
I C 370kW
The motor from supplier A will be the most feasible option in terms of energy efficiency
although it doesnt have the highest efficiency
A condition-based maintenance strategy for the induction motors should be employed in
which the condition of the current motor is assessed either on an appropriate time base or
Electrical Electronic and Computer Engineering 62
Chapter 4 Organizing and Planning
when an opportunity arises to permit this The end-result of the motor assessment is the
threshold line which will be used as a reference for comparing the feasibilities of different
energy efficiency improvement alternatives
It is recommended that condition-based maintenance of this type only be done on the larger
motors where significant power savings are attainable which could justify the effort time and
cost involved in realizing this maintenance effort
bull An energy management tool for induction motor renewalreplacement
If an induction motor fails or experiences a functional failure is it better to refurbish it or
replace it with a high efficiency motor In most of the immediate circumstances
refurbishment is the more feasible option driven by the fact that it is approximately one fifth
the cost of buying a new motor On the other hand refurbishment in most cases refers to
rewinding and motors that have been rewound tend to be less efficient as also expressed by
Campbell [35]
By utilizing the maintenance strategy as presented in the foregoing section the energy
manager is in a position to make a fairly good decision between replacement and renewal
Suppose that the previously referred to 137 MW induction motors condition has been
assessed after each rewind and the threshold line after each assessment have been determined
as shown in figure 413
From the graph it can be seen that the threshold line changed with time and after each
assessment replacement seems to become a more and more attractive option
Electrical Electronic and Computer Engineering 63
96000
Chapter 4 Organizing and Planning
990
Supplier C InlYampI 98000
Supplier A shy lSI rewind Col 970
-bull shy-= ~ 2 rewind
Col Supp rB
IS lie bull~ -950 3rd rewindC -IS Q 940 --= -930==~
920
910
1486 1488 1490 1492 1494 1496 1498 1500
Fllll load speed (rpm)
Figure 413 Threshold lines of motor after every rewind
In conclusion the energy manager may recommend rewinding if the threshold line is near (just
above or below) that of the full load specifications of available motors and should recommend
replacement when the latter is sufficiently above the threshold line Lastly justifying motor
replacement will be a function of reduced energy costs as well as the projected maintenance
cost reduction
4434 Energy systems maintenance on distillation colnmns
The distillation column is made up out of distillation trays The basic function of these trays is
to enable contact of the descending liquid and the rising gas under the most favorable
conditions The mere presence of the trays provides the rising gas with a certain resistance
resulting in a pressure drop This pressure drop must be as small as possible for it has a
significant impact on the energy efficiency of the train Needless to say distillation trays have
a major impact on the energy consumption of the train as also pointed out by Biddulph [8]
Various technologies have been developed for reducing this pressure drop to the minimum of
Electrical Electronic and Computer Engineering 64
Chapter 4 Organizing and Planning
which distillation packing is the more recent and compared to the conventional sieve trays
are the more efficient as well (refer to chapter 2)
Deterioration of distillation trays are inevitable and possible damage may cause a decrease in
main product recovery efficiency and sometimes also increased pressure drop which
ultimately results in the train being less energy efficient
Maintenance on distillation trays are sometimes limited because of the large production losses
the plant would suffer during replacement but it is up to the energy manager to assess the loss
in energy expenditure and do feasibility studies on the relevant alternatives that would enable
upgrading of the columns energy efficiency
4435 Energy systems maintenance life plan
Table 49 shows an energy systems maintenance life plan based on the foregoing information
The condition of each major system is assessed in the control phase of the energy management
program and based on this assessment the energy manager is able to inform andor make
informed recommendations to the relevant maintenance department in case of the occurrence
of deviations
Electrical Electronic and Computer Engineering 65
Chapter 4 Organizing and Planning
Table 49 Energy systems life plan for the critical systems on the cryogenic air separation
plant
Compressor Motors
CBM off opportunity
based Contractor
(most likely)
motor
of motor condition
Compressor CBM on monthly Energy
manager
Inform relevant maintenance
dept on deviation and impact it has
Corrective action will be
enabled by relevant
maintenance dept
Distillation columns
CBM on monthly Energy
manager
Inform relevant maintenance
dept on deviation and impact it has
Corrective action will be
enabled by relevant
maintenance dept
444 The energy management plan
The energy management plan basically consists out of the long-range plan and the building
blocks that make up this plan which are the following
bull Primary objective
bull Specific objectives
bull Short term plan
bull Decisions surrounding project prioritization
bull Short term tactics
Electrical Electronic and Computer Engineering 66
Chapter 4 Organizing and Planning
Primary objectives are stated in the energy policy Long-range plans are the means for
achieving these objectives Thus long-range plans are the stepping-stones towards fulfilling
the vision posed by the energy policy A primary objective on its turn is a composition of
specific objectives and in achieving these objectives energy projects need to identified and
implemented Potential energy projects were already identified in the audit process and these
projects now need to be allocated to the relevant specific objectives and also prioritized
Normally mUltiple projects are required in fulfillment of a specific objective and
consequently there may be numerous projects listed under the short-term plan The energy
manager needs to assign priority to each project in order to ensure that the planned sequence
of events are structured in an optimally efficient manner
The short-term plan entails the decision-making with regard to which projects to implement
when for the next financial year The end result of the long-term plan ultimately depends on
the implementation of the short-term plans The short-term plan requires short-term tactics in
order to realize These short-term tactics are the actions and their timing that is needed to carry
out the short term plan
As an illustrative example consider the division-wide energy policy of Sasol presented in
section 43 [21]
bull Primary objective of the division-wide energy policy ofSa sol
To manage the SasollElectricity Supply Industry interface so as to minimize the total
cost of energy for the Sasol group of companies Further to this to promote energy
efficiency and reward energy management success by decentralizing accountability for
electricity costs and by aligning internal electricity tariff structures with the Eskom
marginal rate [21]
The underlined phrase is a primary objective of the energy policy and in order to realize the
decentralization of electricity cost accountability a few specific objectives first need to be
realized one such objective is stated in the list of specific objectives in the energy policy
Electrical Electronic and Computer Engineering 67
Chapter 4 Organizing and Planning
bull A specific objective ofthe energy policy
Develop and maintain the electricity measurement system within the group of
companies
A specific objective is realized through the implementation of a short term plan or
combination of short-term plans and for above mentioned specific objective a short term plan
is given in the next paragraph
bull Short term plan
o Upgrade existing measurement system on those plants that already have this
system in place
o Install measurement system on all energy intensive plants
o Establish a maintenance strategy for measurement system
o Make data freely accessible and
Actions and their timing are the tactics needed to carry out the short term plan and for the
underlined short term plan the short term tactics are as stated in the following paragraph
bull Short term tactics
o Finalize decisions surrounding data logger selection January 2000
o Order PTs and CTs for the measurement system - January 2000
o Install network connection in substations March 2000
o Install and commission data logger - May 2000
445 Measurement and control indicators
Now that there is an energy management program in place the energy manager has to decide
on how the progress and results of this program will be assessed Key performance indicators
have to be defined and energy standards need to be determined In the control function of this
Electrical Electronic and Computer Engineering 68
Chapter 4 Organizing and Planning
model the energy engineer will assess these KPIs and decide upon appropriate corrective
actions
There is one KPI that encapsulates the outcome of the whole energy management effort and
that is the energy cost per primary product output (RlkNm3) This is an important KPI as it is a
global indicator and by trending it over time the energy engineer is in a position to quantify
the impact of his energy management program however this doesnt mean that it is the only
one that should be monitored there need to be other indicators defined as well lower level
indicators that are more specific and are able to identify critical component inefficiencies
Critical system components are defined here as only that system components that have a major
impact on the energy consumption of the plant These system components include the
compressors the compressor motors and the air separation unit
The lower level KPIs should 1) indicate whether there has been a drift in system
characteristics and also 2) whether the system operated above or below expectation during the
past month It should be noted that only the means for determining the KPIs are presented
here and they will only be applied in the control function the energy manager has to fulfill as
detailed later on
Thus the following parameters are the important ones and need to be monitored
bull Electromechanical efficiency of the air and product compressor motors
bull Isothermal efficiency of each compressor
bull Recovery efficiency of each train
bull Specific energy of the plant (kWlkNm3 of main product)
With these parameters as the basis a key performance indicator will now be derived for each
Electrical Electronic and Computer Engineering 69
Chapter 4 Organizing and Planning
4451 KPI for determining the state of the compressor motor
The compressor motor efficiency has a significant influence on the overall efficiency of the
train therefore a key process indicator need to be defined for the compressor motors and this
KPI should comment on the degradation in motor electromechanical efficiency
Obviously it wouldnt make sense assessing this KPI each month and should therefore only
be assessed after each time the current condition of the motor has been evaluated
c llACmKPI (28)ACmaor = -i-
llACrn
where
bull m is the train number
bull ll~crn is the design efficiency of the motor ie the efficiency at the time when it
was initially installed
bull ll~crn is the current efficiency of the air compressor motor
The KPI of the product compressor motor takes on a similar form
(29)
where
bull KPlpcmotorrefers to the extent of deterioration within the air compressor motor
bull TJ~Cm is the design efficiency of the motor of train m ie the efficiency at the time
when it was originally installed
bull TJCrn is the current efficiency of the product compressor motor of train m
Electrical Electronic and Computer Engineering 70
Chapter 4 Organizing and Planning
4452 KPI for determining the state of the air and product compressor
(30)
where
bull KPlxm is an indicator that refers to how well compressor type x of train m
performed
bull TJheoretical is the theoretical isothermal efficiency of compressor type x of train m X In
bull TJcfual is the actual isothermal efficiency of compressor type x of train m ltm
Equation (30) then takes on the form of equation (31)
out J103x 10-4 xQ xT xln Pxmxm IC In( Pxbullm
~ctual xTJxm KPlxm out (31)
xQ +b x Pxm + xT +dax m x m x m -- ex m IC x m pin xm
where ~ctual is the actual measured MW power consumption at that specific flow and pressure
Again if the motor efficiency has not been determined yet it should be lumped with the
isothermal efficiency of the relevant compressor in this case equation (4) should be modified
by simply removing the electromechanical efficiency (TJxbullm ) of the motor
4453 KPI for determining the state of the air separation unit
actual
KPI = TJrecm (32)ASU m TJemperical
recm
where
Electrical Electronic and Computer Engineering 71
Chapter 4 Organizing and Planning
bull KPI is the indicator for how well the ASU operated during the sample time ASu bull m
bull 1Jemperical is the empirical recovery efficiency that has been determined for the ASU rectm
of train m
bull 1J~~1 is the actual recovery efficiency of the ASU of train m
4454 KPI for determining the overall efficiency of the plant
Except for the global energy cost KPI there should also be a KPI that measures the overall
energy efficiency of the plant This indicator should assist the energy manager in determining
the following
bull If there were any deviations in any system component of any train and also
quantify the impact of this on the overall efficiency of the plant
bull The impact of abnormal plant operation for example due to routine maintenance
on some trains or unexpected breakdown on the overall plant energy efficiency
bull Whether the plant operated above or below expectation
I ~heoretlCalm 1 [
m=l (33)
where
bull KPleff is the in indicator that measures the total plant energy efficiency (kWhlNm3
ofmain product)
bull Poctualm is the total power consumption of train m (MW)
bull Qm is the total main product flow at the output of train m (kNm3h)
Electrical Electronic and Computer Engineering 72
Chapter 4 Organizing and Planning
This indicator provides the energy manager with a summary with reference to the state of
energy efficiency of the whole plant Caution should be taken that this is an overall indicator
and may not be as sensitive to an inefficiency in a specific system component within a train
and by only looking at this indicator may give the energy manager a false idea of the actual
state of the plant Thus this indicator should be viewed in conjunction with the lower level
indicators
45 CONCLUSION
In this chapter energy management organizing and planning was discussed Through
organizing the energy management program is given definition and structure It mainly
involves identification and classification of required activities and the grouping of these
activities in a structured and meaningful way
Planning involves the setting up the energy policy and installing the energy policy strategy
The energy policy strategy has five components human resource deployment current
situation evaluation energy systems maintenance the energy management plan as well as
establishment of measurement and control indicators
Human resource deployment involves appointing a dedicated person charged with driving the
energy management program as well as giving this person access to other human resources
like administrative technical etc
Current situation evaluation is a critical step in the energy management program and the
outcome of the program to a large extent depends on how well and thorough the energy audit
was done
Plant maintenance has a definite and significant impact on energy efficiency and in this
chapter the need for an energy systems maintenance life plan was expressed This life plan is
Electrical Electronic and Computer Engineering 73
Chapter 4 Organizing and Planning
effectively the energy managers contribution to the overall maintenance effort on the plant
and aims to improve energy efficiency
The energy management plan is a structured and well-formulated set of plans and tactics that
should be followed in order to ultimately achieve the primary objectives as stipulated in the
energy policy It involves long-term and short-term planning as well as setting up tactics for
the means of achieving the short-term objectives
Key performance indicators (KPIs) were defined for the means of quantifying plant
performance in terms in energy efficiency and these find their application in the managerial
function of controlling which will be discussed in chapter 5
Electrical Electronic and Computer Engineering 74
Chapter 5 Leading and Controlling
CHAPTERS LEADING AND CONTROLLING
51 LEADING
The main purpose of leading is to harmonize individual and organizational objectives People
do not work in isolation rather they work in groups toward the achievement of personal and
enterprise objectives these objectives are not always in harmony and in fulfilling the function
of leading the manager aims to align objectives of the individual with that of the enterprise
Koontz et al [14] defines the managerial function of leading as the process of influencing
people so that they will strive willingly and enthusiastically toward the achievement of
organizational goals In order for people to willingly strive for such a goal they would need
some form of motivation to do so There exists various means for stimulating motivation in
people (refer to Fukuda [36] and Jordaan et al [37]) and one way of doing so is through
awareness
This awareness is encouraged by doing the following
bull Disclosing energy KPIs and also explaining possible abnormal deviations to
employees
bull The impact certain practices of relevant departments within the plants organization
have on the plants energy efficiency and ultimately energy cost For example this
may include energy inefficient maintenance strategies faulty equipment or even
inefficient production schedules
Turner [16] also lists the following relevant strategies for improved awareness
bull Providing relevant employees with energy management best practices which are
practical and relevant to their working environment within the plants organization
bull Providing energy conservation opportunity checklists to plant operators
maintenance personnel supervisors and engineers
Electrical Electronic and Computer Engineering 75
Chapter 5 Leading and Controlling
Another motivational tool is recognition The energy manager should recognize the energy
management efforts of employees and also show them the impact their efforts had during the
past month
Lastly Turner [16] also states that competition may lead to improved performance Fostering
reasonable competition between relevant departments in the plants organization may inspire
employees to work harder in achieving their goals
52 CONTROLING
Controlling is the measurement and correction of performance in order to ensure that
objectives and the plans devised in attaining them are being accomplished Koontz [14]
defines three basic steps for control 1) establishing standards 2) measuring performance
against these standards and 3) correcting undesired deviations from standards and plans
These steps will now each be defined from an energy management perspective
53 ESTABLISHING ENERGY STANDARDSINORMS
Previously energy management key process indicators were defined for the cryogenic air
separation plant those indicators are now utilized in the control function The standard for
each KPI is the theoretical quantity of the measured parameter ie the denominator of each
KPI as defined in equations (31) (32) and (33) of chapter 4 is the theoretical system
performance and also the standard to which actual system performance is compared KPIs for
the compressor motors are the exception (equations (28) and (29) of chapter 4) in that the
denominator in each is based on the original electromechanical efficiency specification
54 PERFORMANCE MEASUREMENT
The KPIs should be trended over time and significant deviations from expected performance
must be noted This must be done on a monthly basis except for the motor deterioration
indicators which may be assessed according that as stipulated by the maintenance strategy
Electrical Electronic and Computer Engineering 76
Chapter 5 Leading and Controlling
To illustrate performance measurement with a practical example consider the month-end
evaluation of one train of the seven-train oxygen plant at Sasol Secunda This specific train
boasts the characteristics listed in table 51
Table 51 Characteristic parameters of a train used in its performance measurements
Parameter Value KPI equation (Ch 4) 1 Motors
11 Air compressor motor 28 i
1]ACm 982
1]~cm 930
12 Product compressor motor 29 i
1]PCm 971
1]cm 910
2 Compressors 21 Air compressor 31
a 00009366 b -00574043 c 00021501 d 07272151
22 OXYfen compressor 31 a 00044099 b 00090275 c 00030923 d -09017176
3 ASU 32 1]emperical
recm 9541
What follows will be performance measurement by means of KPI trending after which
analysis of each will continue in the next section
Results for the trains global efficiency indicator is shown in figure 51
Electrical Electronic and Computer Engineering 77
Chapter 5 Leading and Controlling
11 ~---------------------------------------------------~-----~
105
095
Trendline
09
085 +--------------------------r---------r--------~----___------__--
OJ-May OS-May 09-May 13-May 17-May 21-May 25-May 29-May
Time
Figure 51 KPI trend for the global efficiency indicator
As implied earlier the KPIs characterizing each motors state are not trended over time
instead its given as a single value and are listed in table 52
Table 52 KPI values for the air and oxygen compressor motors
Compressor motor type KPlvaJue Air 0949 Oxygen 0937
Figure 52 shows KPI trending for the air compressor
Electrical Electronic and Computer Engineering 78
Chapter 5 Leading and Controlling
12
115
11 Trendline
1-1 ~ ~
09 +----L--r-------------------T----T~---__-----
105
1
01-May OS-May 09-May 13-May 17-May 2L-May 25-May 29-May
Time
Figure 52 KPI trending for the air compressor
The KPI trend for the oxygen compressor is shown in figure 53
l~ ----------------------------------- -------------
105 -t----------------------~----~--r--------~-----1
l~T--middot-----middot-~middotmiddotmiddot----middotmiddotmiddotmiddot-------middot--middotmiddotmiddot-middot-------~~-middotmiddotmiddot---middotmiddotmiddotmiddotmiddotmiddot---middotmiddot---1
103 i---middotmiddot-middotmiddotmiddot---middotmiddotmiddotmiddotmiddotmiddotmiddotmiddotmiddotmiddot---middotmiddot-middotmiddot--middotmiddotmiddotmiddotmiddot-middotmiddot----middotmiddotmiddotUrrt---middotmiddotmiddotmiddotmiddot-~-~-shy-+shy
Im~middotmiddot-middotmiddotmiddot~-~middotshy --~middotrftmiddotmiddot-~middot-middotmiddotmiddotmiddot----1rHll~r-middotH-middot-middotm~rlHj~~rJ~--middot---~jtr~~middot-shy
~ 101 hHHt-h1
099 -t-middot~middot--Ur---lmiddotft------middot-+middott-middotmiddotcr-----~---III ~I-----ti----middotmiddot-+---middotmiddotmiddot~~--middotmiddotmiddot------I+-imiddotmiddotmiddotmiddot--+--middotmiddotmiddot--~iH--l
098
097 -t--------~---~-shy -------~--~-~~--~--~~~~~----~-- ----~~
O+-------------~-------------middot-----~-----------~--shy
Ol-May OS-May 09-May 13-May 17-May 21-May 25-May 29-May
Time
Figure 53 KPI trend for the oxygen compressor
Electrical Electronic and Computer Engineering 79
Chapter 5 Leading and Controlling
The KPI trend for the air separation unit (ASU) is shown in figure 54
11 ~------------------------------------------------------------- Trend line
~ 095
~ 09
085
08
075
O1-May 05-May 09-May 13-May 17-May
Time
21-May 25-May 29-May
Figure 54 KPI trend for the ASU
Table 53 shows the average power loss contribution from each of the major systems These
results were obtained by calculating the average power loss defined as the difference between
actual performance and expected performance (Le at KPI equal to unity) during that
particular month
Table 53 System inefficiencies quantified in terms of average power loss
System A verage power loss Air compressor motor 660kW Oxygen compressor motor 400kW
Total lO60kW
Air compressor 630kW Oxygen compressor -70kW Air separation unit (ASU) 430kW
Total 990kW
Grand total 2050kW
Electrical Electronic and Computer Engineering 80
Chapter 5 Leading and Controlling
55 CORRECTIVE ACTION
Now that system performance have assessed the energy manager is now in a position to
manage equipment inefficiencies and determine whether there has been improvement in those
that have been addressed on previous occasions
551 Global efficiency indicator
This KPI should be below one in case of energy efficient train operation but as can be seen
from figure 51 it is mostly above unity implying some form of efficiency loss within the
oxygen train
On 8th May there was a sudden improvement in the global efficiency indicator and the reason
for this will become apparent in the discussion regarding the KPI trend for the air compressor
It is worth noting from the graph that there seem to be a slight trend downwards up to around
27th May were it stayed on or below unity for the rest of the remaining time the reason for this
is that average ambient temperature decreased as the year approached June ultimately leading
to increased train efficiency This trend can also be seen in the air compressor graph of figure
52 and the fact that the ambient temperature has such a favorable effect on train energy
efficiency its actual performance is disguised somewhat and one can expect that the losses
listed in table 53 may even be slightly higher during the summer months
542 Compressor motors
The fact that these two values are below one (refer to table 52) implies that there has been
some degradation in motor efficiencies the air compressor motor is currently about 95 of its
original efficiency and that of the oxygen compressor motor is around 94 Based on this
assessment the energy manager may quantify the cost associated with the respective 5 and
6 degradation in motor efficiencies and is now in a position to manage this energy loss
Electrical Electronic and Computer Engineering 81
Chapter 5 Leading and Controlling
5421 Air compressor motor
All air compressor motors on this plant are rated 37MW and are 2-pole synchronous motors
This air compressor motors KPI is at 0949 (table 52) which equates to an average power
loss of 660 kW The energy cost associated with this loss combined with current maintenance
costs cannot at this stage justify buying a new high-efficiency synchronous motor therefore
other corrective actions should be employed in improving the motors energy efficiency and in
this particular case the following steps will be taken
bull Assessment of partial discharge condition monitoring results and scheduling an
opportunity maintenance action if these results show a degree of partial discharge
bull Schedule an in-situ motor inspection carried out by the OEM in which the state of the
stator and rotor may be determined minor servicing of the motor may be enabled and
recommendations can be made by the OEM
5422 Oxygen compressor motor
All oxygen compressor motors on the plant are 137 MW 4-pole induction machines and for
this particular motor its KPI has been evaluated at 0937 leading to an average power loss of
400 kW (this result takes into account the principles discussed in section 4433 and is based
on the power saving that would result in upgrading it to its original specifications)
For the oxygen compressor motor there is much more potential for a replacement action
because of the relatively high energy loss and the fact that maintenance costs for this motor
has risen quite dramatically over the past two years Considering all the related variables a
payback period of 17 years has been calculated when replacing this motor with a new one
Management rules state that business-case approval will only be given to projects with a
payback period of 15 years or less however KPI monitoring on the other trains revealed that
the majority of oxygen compressor motors are in a worse state than the motor from this
particular train and by consolidating the project (ie recommending replacement of all motors
at once instead of just the one) the payback period was calculated at just below 15 years
Electrical Electronic and Computer Engineering 82
Chapter 5 Leading and Controlling
543 Air compressor
On 8th May the actual compressor performance was significantly above that expected (refer to
figure 52) the reason for this being that demand at that time required high product flow at
high purity and auxiliary air compressors were put online to supplement this demand the
auxiliary air compressors are unaccounted for in the model which ultimately manifests in
exceptional compressor performance
Although air compressor performance did improve as the month progressed (gradual decrease
in ambient temperature) for the majority of operational time it remained below expected
performance This under-performance resulted in an average power loss of 630 kW (table 53)
and upon further investigation it was found that routine maintenance was done quite a long
way back and given the poor air quality at Sasol Secunda a significant amount of compressor
fouling was inevitable Production requirements from production department and low priority
assignment from maintenance department resulted in these irregular and mostly delayed
maintenance intervals A proper corrective action from the energy manager in this case would
be to facilitate a compromise between these two departments by ensuring that consensus have
been reached on the scheduling of this maintenance action and also that this scheduling leads
to increased energy efficiency
544 Oxygen compressor
Figure 53 shows the KPI trend for the oxygen compressor and as can been seen from this
figure the KPI stayed above unity for the majority of time which implies good compressor
operation This is also manifested in the average power loss for this compressor which has
been calculated at -70kW as listed in table 53 implying that the oxygen compressor overall
operated slightly above expectation
In general one can expect that the product compressors performance in terms of energy
efficiency should normally be above that of the air compressor because as opposed to the air
compressor it handles a clean and pure gas and is therefore not as susceptible to compressor
Electrical Electronic and Computer Engineering 83
Chapter 5 Leading and Controlling
fouling also in some cases it is less prone to physical damage resulting from large solid
particles
545 Air separation unit
From figure 54 it can be seen that the ASU under-performed for the majority of time
resulting in an average power loss of 430 kW (table 53) Calculations showed that the average
recovery efficiency for this time was 9417 which is slightly less than its empirical value
(9541 ) meaning the air compressor has to make an added effort for compensating this drop
in efficiency
Production department acknowledged the decrease in recovery efficiency and the problem was
identified as damaged distillation trays inside the distillation column Initiating a maintenance
action to repair defective trays in the near future will not be feasible because this would lead to
significant production losses Again the energy manager has to manage this loss to the
minimum The following actions would do just this
bull Keep monitoring the recovery efficiency and initiate a maintenance action as soon
as energy loss could justify this andor determine the production loss when the air
compressor has reached its full capacity and cannot compensate for the recovery
efficiency loss anymore which ever comes first or should it be it the case when
both conditions have been reached
bull Minimize the loss by sharing a portion of this trains load equally between the
more efficient trains at times of low oxygen demand or whenever there is more
efficient spare capacity available
55 CONCLUSION
In this chapter the managerial functions of leading and energy management controlling have
been discussed
Electrical Electronic and Computer Engineering 84
Chapter 5 Leading and Controlling
The managerial function of leading involves leadership motivation and communication
Leadership refers to the ability to lead which involves the process of influencing people so
that they will strive willingly and enthusiastically toward the achievement of energy
management goals Motivation is vital in aligning objectives of the individual with that of the
energy management program and it is important that the energy manager practice effective
motivational techniques Communication is the process by which information can be received
or send It is a vital skill and an essential activity in the energy management program
Controlling is one of the functions the energy manager has to perform in order to ensure
continuity of an effective energy management program
Control is necessary in the energy management program as it brings actual performance in
line with desired performance and based on the discrepancy between these two the energy
manager is in a position to strategize corrective measures It is important for the energy
manager to establish good communication links with the relevant departments within the
plants organization as they are in a position to provide information relevant in the control
phase and are also the stakeholders that need convincing before buying into corrective action
strategies
Electrical Electronic and Computer Engineering 85
Chapter 6 Conclusions and Recommendations
CHAPTER 6 CONCLUSIONS AND RECOMMENDATIONS
61 INTRODUCTION
In chapter 1 the main and specific objectives of this dissertation were listed these objectives
were addressed during the course of this dissertation and will now be properly concluded
through referring to the relevant sections Lastly recommendations with regard to certain
aspects of the energy management system presented in this dissertation will be made followed
by a closing remark
62 CONCLUSIONS ON THE OBJECTIVES
The main objective of this dissertation was to present a framework that would enable effective
management of energy cost and efficiency in cryogenic air separation plants as stated in
section 12
In this dissertation a model has been defined which serves as the framework for the energy
management program at cryogenic air separation plants Within this framework various
functions have been defined and the energy management effort is realized through performing
the activities surrounding each of the respective functions
621 Conclusion on the energy management model
The energy management model was introduced in chapter 3 The model is depicted in figure
35 and entails the transformation process its inputs and outputs and the external environment
as well as the interaction between all of these Inputs are resources like capital skills people
and facilities outputs are the accomplished energy management objectives like improved
preventive maintenance strategies optimized production schedules reduced energy cost and
improved plant design
The external environment accounts for the higher order systems to which the energy
Electrical Electronic and Computer Engineering 86
Chapter 6 Conclusions and Recommendations
management system belongs The transformation process involves the managerial functions of
organizing planning leading and controlling which are the core managerial functions the
energy manager has to perform
622 Conclusion on the energy policy
Theory behind the energy policy was presented in section 43 The energy policy normally
consists out of three components the declaration of commitment mission statement and
specific objectives The energy policy guides or channels thinking it is an expression of the
commitment plant management has towards a continuous and effective energy management
program and sets the scope for energy management effort at plant level
623 Conclusion on the energy policy strategy
The energy policy strategy is the means for accomplishing the vision expressed by the energy
policy and was introduced in section 44 The energy policy strategy thus encapsulates the plan
for changing current reality into future vision This plan is composed of five activities and
they have been identified as the following
bull deployment of human resources
bull current situation evaluation
bull energy systems maintenance
bull energy management planning
bull establishment of measurement and control indicators
Deployment of human resources entails the appointment of a dedicated person in charge of
the plants energy management program as well as enabling this person to utilize other
relevant human resources
Energy systems maintenance refers to maintenance actions regarding the energy efficiency of
Electrical Electronic and Computer Engineering 87
Chapter 6 Conclusions and Recommendations
equipment that use or affect the use of energy
The energy management plan is a structured and well-formulated set of plans and tactics that
should be followed in order to ultimately achieve the primary objectives as stipulated in the
energy policy
Key performance indicators were presented in section 445 and these indicators enable the
energy manager to assess the plants energy efficiency and also to perform the control function
of the energy management program
624 Conclusion on the energy audit process
The energy audit process was discussed in section 442 and consists out of the energy audit
policy and the energy audit strategy The energy audit policy sets the scope for what to audit
whereas the energy audit policy strategy states how this would be done
Auditing is done through assessing relevant plant efficiencies as listed in section 4421 and
for the holistic approach to energy auditing assessment of all these plant efficiencies should
be enabled this assessment is done by means of the audit strategy as detailed in section
4424
625 Conclusion on the mathematical model
Model building blocks with regard to all the major systems were derived in section 4424
The energy conversion model is a very important auditing tool and most of the building blocks
derived in this section also find their application in the control function of the energy
management program (section 52)
Model accuracy is greatly enhanced through empirical modeling of critical plant elements and
Electrical Electronic and Computer Engineering 88
Chapter 6 Conclusions and Recommendations
as stated in chapter 4 it becomes obvious that availability of relevant data is critical in model
building
626 Conclusion on the performance indicators
KPIs (key performance indicators) were derived in section 445 and consist of global
indicators as well as lower level indicators Global indicators quantify the performance of the
plant as a whole and include the energy cost per product produced (RlNm3) and energy
consumption per cumulative product produced (kWhlNm The lower level indicators enable
the energy manager to monitor the energy efficiency of critical components such as the
compressor motors compressors and the distillation columns and are also utilized in the
control function of the energy management program
Each KPI is defined as the ratio between actual and theoretical performance The theoretical
performance effectively defines the energy standard of a particular system which enables the
energy manager to identify system inefficiencies when comparing this to the actual system
performance
627 Conclusion on energy systems maintenance
Energy systems maintenance with regard to cryogenic air separation plants was introduced in
section 443 Energy systems maintenance is the energy managers contribution to the overall
maintenance effort on the plant and is conducted by means of an energy maintenance life plan
The state of each of the respective critical systems is monitored in terms of their energy
efficiency and deviations are acted upon so as to minimize resulting energy losses The critical
systems are the compressors distillation columns and compressor motors and a maintenance
plan for these systems were presented in section 4435
A cryogenic air separation plant normally utilizes a large number of induction motors for
Electrical Electronic and Computer Engineering 89
Chapter 6 Conclusions and Recommendations
driving loads such as blowers pumps and compressors and these motors consequently have a
significant impact on the energy efficiency of the plant As stated in section 4433 energy
systems maintenance on large induction motors driving these loads may not be so simple and
in this section a tool that facilitates decision-making between induction motor replacement and
renewal was presented as well
63 RECOMMENDATIONS
This section contains recommendations with regard to certain aspects of the energy
management system at cryogenic air separation plants
631 Recommendations on setting up the energy management program
First and foremost it is the responsibility of the appointed energy manager to ensure that there
is a formal and well-defined energy policy in place at plant level for the whole energy
management program will be as a direct consequence of this policy and is therefore the
foundation from which all energy management efforts will outflow This policy should be
agreed upon by the relevant stakeholders and approved by top management
For the energy management system to be fully integrated into the plants organizational
structure and to ensure that top management continually gives it the commitment it needs it is
recommended that the outcomes of this program be accounted for in the overall performance
of the plant in order for it to ultimately have an impact on the merits of plant performance
As a direct consequence of the energy policy capita1 will be made available for the energy
management program in the form of a financial budget The energy manager is responsible for
formulating the energy management budget for the next financial year and this budget should
then serve as the cost goal for the energy management program This is a critical resource
input to the program and the energy manager should make sure that optimum use of this
resource is exercised through proper planning and allocation (see section 444)
Electrical Electronic and Computer Engineering 90
Chapter 6 Conclusions and Recommendations
When implementing the energy management program it is important that the appointed person
should first organize a workshop session in which all the relevant departments in the plants
organization are informed about what the proposed energy management effort entails what is
expected of them and how they can benefit from it This is also a good opportunity for the
energy manager to highlight the importance of effective energy management on these energy
intensive plants and to aspire fellow personnel in contributing positively towards energy
management objectives
632 Recommendations regarding existing energy management programs
In the case where there already is an existing energy management program in place the
contents of this dissertation may be used to supplement or adjust current efforts The model
presented in this dissertation aims to foster an effective and value-adding energy management
program without compromising production output streams and will add to the success of
existing energy management efforts
633 Recommendations regarding energy modeling
In section 4424 it becomes obvious that in building the energy conversion model the energy
manager requires a large amount of data of different types ranging from process variables like
temperature pressure and flow to capacity limits on equipment To avoid spending too much
time in model building and ensuring good accuracy the energy manager must enable easy
access to relevant data
Building the energy conversion model may take a relatively long time especially in plants
incorporating multiple trains and most of the time will be consumed by processing relevant
data it is therefore recommended that appropriate computer software be used Spreadsheets
will undoubtedly proof to be most efficient in data processing and it is also recommended that
software capable of multiple variable regression be utilized in modeling certain subsystems
Lastly some model building blocks are utilized in the control function of the energy
Electrical Electronic and Computer Engineering 91
Chapter 6 Conclusions and Recommendations
management system and it would be advisable to link the relevant model outputs to the
respective KPIs in which they are utilized in this manner KPIs are automatically evaluated
whenever plant performance needs to be determined
634 Recommendations regarding the energy manager
Although it is recommended that the energy management system should form part of the
plants organization it doesnt necessarily mean that the person appointed to drive this
program should be stationed at the plant This person may form part of an organization
external to the plants organization like for example an energy management task team that is
charged with managing energy cost on a company-wide level a technical hub or even an
outside company (outsourcing)
It is required that the appointed person should be experienced in general management and
competent in applying financial tools This person should also be technically orientated
typically operating from the base of mechanical electrical or process engineering
635 Recommendations regarding energy management at Sasol Secunda
It is a fact that certain plants within the Sasol complex are generally energy intensive and in
optimizing the energy cost per output product more efficiently it is recommended that
intentional consideration should be given to energy management at plant level Realizing this
energy management effort lies in adopting an efficient managerial structure such as the one
presented in this dissertation and allocating resources to fuel this energy management effort
Driving this managerial effort would be the responsibility of a dedicated energy manager
appointed by the company Lastly Janse van Rensburg [17] also suggested that an energy
manager should be appointed by each of the major energy consumers within the factory and
that a specific plants performance with regard to energy management should have an impact
on the overall performance merit of the plant thereby motivating relevant personnel in
achieving energy management objectives
Electrical Electronic and Computer Engineering 92
Chapter 6 Conclusions and Recommendations
64 FUTURE WORK
Although there are key commonalities between various cryogenic air separation plants they
may still be diverse in design and it is up to the energy manager to derive an energy model
specific to hisher plant this may be done by employing the basic modeling theory presented
in chapter 4
Another point worth mentioning is that of extending the application of the energy model
Utilization of the energy model is basically limited to that of the energy manager but by
modifying the model such that it is able to receive real-time data in order to produce specific
predefined outputs in real-time the proactive element of the energy management effort is
greatly enhanced The model may be added as an extension to the control operators
workstation The control operator is directly responsible for the process control of the plant
and is able to see (in real time) on how certain of hislher actions impact on the energy cost and
efficiency of the plant
Lastly this study was aimed at presenting a generic framework for energy management at
cryogenic air separation plants however it was also the intent of the author to introduce an
energy management framework that may be applied to plants of any nature In the quest for
deriving an energy management program future studies may thus apply the basic philosophy
presented in this study to other types of plants as well
65 CLOSING REMARKS
This dissertation presents a framework for energy management at cryogenic air separation
plants It addresses all the critical managerial aspects required in conducting a successful
energy management program and may be used as a reference or tool in managing electrical
cost and energy efficiency at these energy intensive plants
Because these plants are so energy intensive a relatively small improvement in energy
efficiency may lead to significant energy cost savings Cost savings are not the only benefits
Electrical Electronic and Computer Engineering 93
Chapter 6 Conclusions and Recommendations
resulting from the energy management effort indirect benefits resulting from this include
reduced C02 emissions and conservation of the earths energy resources
From the above it can be seen that energy management at plant level not only makes business
sense but is also the answer to environmental concerns and the ever-increasing energy price
Electrical Electronic and Computer Engineering 94
References
REFERENCES
[1] JC Kotz and P Treichel Chemistry And Chemical Reactivity 3rd edition Harcourt
Brace amp company Orlando USA 1996
[2] AR Smith and J Klosek A review of air separation technologies and their integration
with energy conversion processes Fuel Processing Technology VoL 70 pp115-134
2001
[3] BW Birmingham and CN Smith Cryogenics and the energy crisis Cryogenics Vol
15 Issue 3 pp115-118 1975
[4] Air Liquide Engineering Division Seminar Proceedings France May 1987
[5] Air Liquide Engineering amp large industry training department training handbook Air
Distillation Version 2 Champigny-sur-Mame Cedex France 2001
[6] SC Sarkar Energy savings in cryogenic plants Journal of Energy in Southern
Africa Vol 13 pp139-143 2002
[7] Air Liquide homepage Energy saving results
httpwwwairliquidecom France 2002
[8] MW Biddulph Efficiencies of trays in cryogenic distillation columns Cryogenics
Vol 26 pp24-29 1986
[9] N Gupta BK Srivathsa and KS Misra Energy optimization techniques in Air
Separation Plants Proceeding of International Cryogenic Congress Calcutta India
pp 391-409 1988
[10] A Thuman and DP Metha Handbook ofEnergy Engineering 2nd edition The Fairmont
Press Lilburn USA pp 377 1991
[11] GT Austin Sherves Chemical Industries 5th edition McGraw Hill Inc Singapore pp
115 -128 1984
[12] RH Perry and DW Green Perrys Chemical Engineers Handbook ih edition
McGraw-Hill New York USA pp 4-6 to 4-7 1982
Electrical Electronic and Computer Engineering 95
References
[13] PM Fishbane and S Gasiorowicz Physics for Scientists and Engineers extended 2nd
edition Prentice Hall New Jersey USA pp 438 - 504 1996
[14] HD Koontz C ODonnel H Weihrich Management 8th edition McGraw Hill Inc
Singapore 1984
[15] Oxygen plant financial statements financial results June 2003 and projected July 2004
Sasol Secunda South Africa
[16] WC Turner Energy Management Handbook The Fairmont Press Lilburn USA 1993
[17] WTB Janse van Rensburg Energiebenutting en Energiemodullering in die
Sasolproses Masters Dissertation Potchefstroom University South Africa pp 19-21
1994
[18] VB Ottaviano Energy Management The Fairmont Press Georgia USA pp 12-1 and
72-1 1985
[19] JB Sykes (Editor) The Concise Oxford Dictionary 7th Edition Oxford University
Press Oxford UK p 6501982
[20] Safety Health and Environmental policy of Sasol httpwwwsasolcom South Africa
[21] Materials an Services Management Team (electricity) of Sasol Ltd Cross-functional
and cross-divisional collaboration - The way to industrial electricity cost savings
South Africa ppI-5 2000
[22] A Thuman Handbook Of Energy Audits 5th edition Pretice-Hall New Jersey USA
pp 1-6 1998
[23] FBA Senekal Electricity Demand Management Manual EPR 400 Final Report Centre
for New Electricity Studies University of Pretoria Pretoria RSA pp 71-1011994
[24] GJ Delport Integrated Electricity End-Use Planning in Deep Level Mines Phd Thesis
University of Pretoria Pretoria RSA 1994
[25] EM Talbott Compressed Air Systems A guidebook on energy and cost savings 2nd
edition Fairmont Press New Jersey USA pp 28-30 and 164-167 1993
[26] JK Salisbury Kents Mechanical Engineers Handbook 12th edition John Wiley amp
Sons New York USA pp 1-34 to 1-54 1976
Electrical Electronic and Computer Engineering 96
References
[27] J M Coulson and J F Richardson Coulson amp Richardsons Chemical Engineering
volume 15th edition Butterworth Heinemann Bath Great Britain pp 311-321 1997
[28] T Baumeister and EA Avallone Marks Standard Handbook for Mechanical
Engineers 8th edition McGraw-Hill New York USA pp 14-30 to 14-44 1978
[29] S Makridakis SC Wheelwright et aI Forecasting Methods and Applications 2nd
edition John Wiley amp Sons New York USA pp 246-312 1983
[30] JD Campbell Uptime Strategies for Excellence in Maintenance Management
Productivity press New York USA pp 110 - 112 1995
[31] JS Htsui PJ Otaduy and JD Kueck Efficiency and reliability Assessments of
Retrofitted High-Efficiency Motors Industry Applications Conference Thirtieth lAS
Annual Meeting Conference record of the 1995 IEEE Vol 3 pp2745-2751 1995
[32] PC Sen Principles of Electric Machines and Power Electronics 2nd edition John
Wiley amp Sons New York USA pp207-277 1997
[33] RN Brown Compressors Selection and Sizing 2nd edition Gulf Publishing Company
Houston Texas pp 183-184 1997
[34] KA Stroud Engineering Mathematics 2nd edition Macmillan Great Britain London
pp 18-3 to 18-4 1982
[35] BH Campbell Failed motors Rewind or Replace Industry Applications Magazine
IEEE Vol 3 Issue 1 pp45-50 1997
[36] R Fukuda Managerial Engineering Techniques for improving Quality and
Productivity in the Workplace Productivity Inc Connecticut USA pp20-22 1983
[37] W Jordaan and J Jordaan Man in Context McGraw-Hill Johannesburg RSA pp 618shy
625 1984
Electrical Electronic and Computer Engineering 97
Appendix A
APPENDIX A CASE STUDY BASIC ENERGY CONVERSION MODEL FOR
THE SASOL SECUNDA OXYGEN PLANT
At MODEL INPUTS AND OUTPUTS
Table Al lists the empirical values for the oxygen compressor (refer to equation (9) of chapter
4) Factored into these constants are the respective electromechanical efficiencies of the
oxygen compressor motors
Table AI Oxygen compressor empirical values
Train a b c d 1 0004013 0008215 0002814 i 0820563 2 0004853 0009605 0002887 0960213 i
3 0005213 0004361 0003537 0960292 4 0001955 0005158 0001532 0193396 5 0004018 0008176 0002817 0820563 6 0005104 001082 0002722 0960236 i
7 0003524 0005223 0003751 0960292 ACs 0000871 -0853386 00019996 0067631 I
With reference to equation (8) of chapter 4 the system constants from the air compressor side
are the following h =014 and g 12 which have been assumed the same for all trains
The average recovery efficiencies for each train are as listed in table A2
Table A2 Coldbox average recovery efficiencies
i
i
Train AR 1 9467 2 9055 3 9518 4 9613 5 9528 6 9152 7 9509
Electrical Electronic and Computer Engineering 98
Appendix A
Refer to figure AI for model input and output nametags
Model inputs
bull Management rules Specifies production constraints ie the minimum and maximum
levels of the different commodities involved in the oxygen production process
bull Oxygen demand This input is mainly determined by the gasification and gasshy
reforming processes and will vary in response to their demand
bull Oxygen supply pressure This is the pressure with which oxygen is supplied to the
Gasification and Gas-Reforming plants The supply pressure should be kept between
the constraints as set forth by these two plants
bull Minimum and maximum limits of process outputs and equipment Specifies the
constraints in which the equipment should function in normal operation This includes
o Max amp Min limits of air compressor 37MW amp 28MW (when online)
respectively
o Max amp Min limits of oxygen compressor 137MW amp lOMW (when online)
respectively
o Max amp Min limits ofoxygen purity 994 amp 985 respectively
o Max amp Min limits of Pressure in oxygen common header 3480kPa amp
3350kPa respectively
o Max amp Min limits ofN02 ratio 30 amp 20 respectively
bull HP N21LP 02 ratio Defines the relationship between the HP nitrogen and LP Oxygen
and is assumed a constant value
bull Instrument Air flow The plant also produces instrument air and for the purpose of the
model a constant value is assumed
bull O2 purity The main product purity is assumed constant
bull Other constants This includes the following
o Atmospheric pressure at Secunda (85kPa)
Electrical Electronic and Computer Engineering 99
Appendix A
o 02 pressure at cold box outlet (95kPa)
o Cooling water temperature (20degC)
o A verage recovery efficiencies of each train (AR)
Model outputs
bull Specific energy This is defined as the energy efficiency of the oxygen plant ie the
efficiency with which energy is utilized in producing oxygen It has units of kWhlNm3
Le the amount of kilowatts that should constantly be applied for one hour in order to
produce one normal cubic meter of oxygen
bull New load profiles This includes
o Load profiles of all trains
o Load profile of whole industry (train 1-7)
bull Cost ofenergy Gives the cost of energy based on the tariff structure
For the model simulation the following input values listed in table A3 were used
Table A3 Input values used for model simulation
Parameter held constant Value Oxygen supply pressure 3440kPa
N202 ratio 25 Average recovery (AR) Refer to table C2 Instrument air flow 35 kNmjh Oxygen purity 986 Electricity tariff structure WEPS (2002 Sasol structure)
Electrical Electronic and Computer Engineering 100
Appendix A
Management Rules
O2 demand
O2 supply pressure
Min amp Max limits of
equipment
N202 ratiogt
L-_A_R__gt Instrument Air
(lA)flow
O2 purity
Electricity Tariff
Specific Energygt
Load profilesgt
Cost of Energygt
Figure Al Inputs and outputs for the basic energy conversion model
Electrical Electronic and Computer Engineering 101
- - - - - - -
Appendix A
Table A4 Simulation results calculated over a period of one moth
Parameter Value Specific energy 06589 kWhlNm
j
Cumulative load profile Refer to figure C2 Cost of energy during sample month R21156843
360
340
320
300 ~ 280 ~
260 Refer 10 figure A3
240
220
200 gt gt gt gt gt gt gt gt gt gt gt gt gt gt gt gt gt gt gt gt ol ol ol ol ol ~ ol ol ~ ol ol ol ol ol ol ol ol ol ol ol ol ol
~ ~ ~ ~ ~ ~ ~ ~ ~ ~ ~ ~ ~ ~ ~ ~ ~ ~ ~ ~ ~ ~ I I I I I I I I I I I I I I I I I I I I I
C-I ri on IQ 00 0 C-I ri on IQ 00 0- 0 C-I ri on IQ t- O- 0 C-I C-I C-I C-I C-I C-I C-I ri
Time
Figure A2 Actual and simulated load profile for the oxygen plant at Sasol Secunda
~ ~
360
340
320
300
260
240
220
200
I8-May I9-May 20-May 21-May 22-May 23-May 24-May 25-May
Time
Figure A3 Section of actual and simulated load profile of figure C2
Electrical Electronic and Computer Engineering 102
Appendix A
On 8th May the actual load profile plunges momentarily while the model doesnt seem to be
responding to this change in power consumption This is due to the fact that the model
assumes that only one oxygen compressor can be offline at any point in time which is usually
the case on this particular day however between 0730 and 930 train twos oxygen
compressor tripped and was offline for approximately two hours in addition to the oxygen
compressor of train one This has the implication that the spare oxygen compressor was
summed twice for two hours On 7th May the same incident happened for approximately one
hour
Two oxygen compressors are very rarely offline at the same time and as these incidents
happened only for a relatively small time the entire month (approximately three hours in total)
its impact is negligent and also for the sake of model simplicity this aspect was neglected in
modeling the oxygen plant
As will be illustrated later in this section an oxygen trains power consumption increases
when a higher purity oxygen is produced Between 15t and 2nd of May the actual load profile
seems to be slightly higher compared to that of the model The model assumes that oxygen is
produced at a constant purity (986) however in this case oxygen was produced at a higher
purity leading to an increased power consumption this is also the case for the respective load
profiles between 27th and 28th of May The same reasoning can be applied to the results seen
between 30th and 31 5t of May except that in this case lower purity oxygen (ie less than
986) was produced
When the power consumption of the oxygen plant drops like for instance at 5 7 8923 and
30th May it seems that the model overshoots the minimum point at times this is mainly due to
the minimum permissible power consumption the compressors are allowed to have The model
assumes 28MW and lOMW for the air and oxygen compressor motors respectively but these
values vary from train to train (may be higher or lower than 28MWllOMW) and thus may
overshoot at times or even undershoot the actual load profile at these conditions
Electrical Electronic and Computer Engineering 103
Appendix A
A2 IMPACT OF KEY PARAMETERS ON ENERGY EFFICIENCY
The energy conversion model defined in the previous section will now be used to quantify the
impact certain key process parameters have on the energy consumption efficiency and cost of
the plant Normal operating conditions will be used as the baseline and are as listed in table
A5 at these conditions the model outputs are as listed in table A6
Table A5 Normal operating conditions of the oxygen plant at Sasol Secunda
O2 Purity 986 HPNdLP02 25 IA flow 35 kNmlh O2 common header pressure 3440 kPa
Table A6 Model results at normal operating conditions
Specific energy 06589 kWhlNmf Load profile of oxygen plant Figure A2 Average power consumed 32344MW Total cost of energy R 21156843
The effects of changing following parameters will be determined
bull Oxygen purity
bull Average recovery efficiency (AR)
bull Instrument air flow (AI)
bull Cold box availability
Table A7 lists the different simulation scenarios with table A8 displaying the respective
model outputs in terms of specific energy average power consumption and total cost of
energy
Electrical Electronic and Computer Engineering 104
Appendix A
Table A7 Model simulation scenarios
Variables O2purity IA flow per 02CH Recovery
CD offline train pressure efficiencies
Oxygen purity - Scenario 1 985 35kNmJh 3440kPa Table A2 None - Scenario 2 987 I 35kNm3h 3440kPa Table A2 None
AR efficiency - Scenario 986 35kNm3h 3440kPa Trains 2amp6 None
changed to 95
IA flow - Scenario 986 Load shifting 3440kPa Table A2 None
IA of trains 2amp6 to train 7
Cold box availability - Scenario 986 35kNmj h 3440kPa Table A2 Train 1
Table A8 Model outputs based on the scenarios listed in table A7
Variables Specific Average Total cost Increase
Increase Increase I in average
of energy in specific in total
energy power power cost of
consumed energy (KWhINm3) (MW) (R) consumed energy
(R) Oxygen purity - Scenario 1 06553 32172 21049009 -055 -053 ~7834 - Scenario 2 06631 32553 21287147 064 065 0304
AR efficiency - Scenario 06524 32029 20960289 -099 -097 -196654
IA flow I
- Scenario 78 32291 21123850 -017 -016 -32993
Cold box availability - Scenario 07360 31189 20401463 1235 -357 -755380
Electrical Electronic and Computer Engineering 105
Appendix B
APPENDIXB LIST OF TABLES
Table 21 Components of air and their properties (Sources Austin [11] Kotz et al [1]) 5
Table 23 A description on the function of each process and the equipment used for the
Table 44 Summary of electrical machinery ratings and capacity requirements for production
Table 47 Three suppliers of a 4-pole 137MW induction motor with their respective ratings
Table 49 Energy systems life plan for the critical systems on the cryogenic air separation
Table 22 Comparison of air separation technologies (Smith et al [2]) 6
implementation thereof 7
Table 41 Details surrounding commodity inputs to the oxygen plant at Sasol Secunda 34
Table 42 Details surrounding commodity outputs from the oxygen plant at Sasol Secunda 35
Table 43 Prioritization of output products of the oxygen plant 35
means 39
Table 45 Summary of the user requirements for each product 39
Table 46 Current motor parameter values 60
60
Table 48 Power saving for the different motors from the three suppliers 62
plant 66
Table 51 Characteristic parameters of a train used in its performance measurements 77
Table 52 KPI values for the air and oxygen compressor motors 78
Table 53 System inefficiencies quantified in terms of average power loss 80
Table Al Oxygen compressor empirical values 98
Table A2 Coldbox average recovery efficiencies 98
Table A3 Input values used for model simulation 100
Table A4 Simulation results calculated over a period of one moth 102
Table A5 Normal operating conditions of the oxygen plant at Sasol Secunda 104
Electrical Electronic and Computer Engineering 106
Appendix B
Table A6 Model results at normal operating conditions 104
Table A7 Model simulation scenarios 105
Table A8 Model outputs based on the scenarios listed in table A7 105
Electrical Electronic and Computer Engineering 107
Appendix C
APPENDIXC LIST OF FIGURES
Figure 21 Processes involved in cryogenic air separation 7
Figure 23 Water and alcohol mixture at boiling point producing a gas and consequent
Figure 24 Cascaded distillation flasks producing a substance rich in volatile element at the
Figure 25 Distillation by means of improved liquid-gas contact between cascaded distillation
Figure 26 Distillation column producing oxygen and nitrogen by means of fractional
Figure 41 Energy policy at different levels of the organization and the scope of the policy at
Figure 42 An illustration of efficiency losses inherent to the plants structure from an energy
managers perspective and how they collectively contribute to the ultimate quantity of
Figure 43 Basic outline of the oxygen plant at Sasol Secunda The flows presented here are
Electrical Electronic and Computer Engineering
Figure 22 Distillation flask with water and alcohol mixture 10
distillate richer in alcohol 10
top and a substance rich in less volatile element at the bottom 11
flasks 12
distillation trays [5J 13
Figure 27 Producing oxygen by utilizing a distillation column with no condenser [5J 14
Figure 28 Producing nitrogen by utilizing a distillation column with no vaporizer [5J 15
Figure 29 Stacked column model that enables the production of oxygen and nitrogen 17
Figure 31 Basic outline of the energy management model 20
Figure 32 The energy management model 22
each level 25
output product per Rand of electrical cost 30
the steady state maximum amounts of oxygen that each train is able to produce 36
Figure 44 Process flow of a single oxygen train 38
Figure 45 Simplified system breakdown structure of the cryogenic air separation plant 42
Figure 46 Multi-stage compression cycle with interstage cooling (Coulson et ai [27])45
108
Appendix C
Figure 47 Linear approximation of system curve 48
Figure 48 Functional fai lures and performance standards 51
Figure 49 Partial power curves of the existing motor (motor 1) and the new motor (motor 2)
as well as that of the compressor load illustrating the implication of installing a higher
efficiency motor than is currently in operation 54
Figure 410 Compressor characteristic curve at various shaft speeds 56
Figure 4 11 Approximating the power curve with a linear model at low slip values 59
Figure 412 Threshold efficiency proposed new motor should adhere to as a function of its
full load speed 61
Figure 413 Threshold lines of motor after every rewind 64
Figure 51 KPI trend for the global efficiency indicator 78
Figure 52 KPI trending for the air compressor 79
Figure 53 KPI trend for the oxygen compressor 79
Figure 54 KPI trend for the ASU 80
Figure Al Inputs and outputs for the basic energy conversion model 101
Figure A2 Actual and simulated load profile for the oxygen plant at Sasol Secunda 102
Figure A3 Section of actual and simulated load profile of figure C2 102
Electrica l Electronic and Computer Engineering 109

Table of Contents
63 RECOMMENDAnONS 90
631 Recommendations on setting up the energy management program 90
632 Recommendations regarding existing energy management programs 91
633 Recommendations regarding energy modeling 91
634 Recommendations regarding the energy manager 92
635 Recommendations regarding energy management at Sasol Secunda 92
64 FUTURE WORK 93
65 CLOSING REMARKS 93
REFERENCES 95
APPENDIX A CASE STUDY BASIC ENERGY CONVERSION MODEL
FOR THE SASOL SECUNDA OXYGEN PLANT 98
APPENDIX B LIST OF TABLES 106
APPENDIX C LIST OF FIGURES 108
Electrical Electronic and Computer Engineering IX
Chapter 1 Problem Identification and Background
CHAPTER 1 PROBLEM IDENTIFICATION AND BACKGROUND
11 INTRODUCTION
Steel metal and petrochemical industries all require large amounts of air products such as
oxygen and nitrogen Kotz et ai [1] states that oxygen and nitrogen are annual1y among the
top five chemicals produced in the United States Cryogenic air separation plants are
currently the only efficient and economical1y viable method of producing air products on
large scale (Smith et ai [2]) Because transportation adds considerably to the cost plants are
usually constructed on-site and located close to the point of consumption
It is also a fact that plants of this nature are generally energy intensive especially the large
tonnage plants and it has been found that relatively small improvements in plant energy
efficiency may lead to significant energy cost savings
12 ENERGY MANAGEMENT AT CRYOGENIC AIR SEPARATION PLANTS
The energy crises of the early 1970 s necessitated significant improvement of energy
management efforts at these energy intensive plants and initial efforts were mostly aimed at
energy conservation through introduction of better technology available for that time
(Birmingham et al [3])
As a consequence of this intentional consideration to improved plant energy efficiency has
been given during its design phase ([4] [5] [6]) this is manifested by the fact that energy
efficiency increased by approximately 91 from 1980 to the late 80s [4] and from 1997 to
2001 Air Liquide reports a 10 decrease in power consumption of its cryogenic air separation
plants [7]
Since the 1970s energy optimization techniques have been given elevated importance in the
design phase of cryogenic air separation plants and numerous studies addressing the issues
Electrical Electronic and Computer Engineering 1
Chapter 1 Problem Identification and Background
surrounding improved energy optimization have been widely publicized (refer to Birmingham
et ai [3] Biddulph [8] Gupta et al [9] and Sarkar [6]) It is also a fact that all these studies
are almost solely aimed at improving the energy efficiency of the plant through intervention at
the design phase of the cryogenic air separation plant Although there have certainly been
significant improvements in plant energy efficiency during the past years as stated earlier not
much have been written on how proper maintenance of this energy efficiency should be
conducted and needles to say proper energy management
The aim of energy management is defined by Thuman et ai [10] as the reduction of energy
expenditure for the purpose of reducing product cost this would ultimately lead to an increase
in competitive performance and it becomes clear that by employing effective energy
management much more benefit can be drawn by the relevant stakeholders and consequently
also makes business sense
This energy management effort should not only be confined to the design phase of the plant
but should be a continuous action applying it throughout the whole productive part of the
plants life-cycle
With todays relatively high and continuously increasing energy prices it not only becomes a
necessity but also makes business sense to maintain and continuously improve the plants
energy efficiency Managing the plants energy expenditure and efficiency would be the
correct response to the already high and ever-increasing energy cost and may reduce overall
input cost dramatically
To make this managerial action value-adding there needs to be an effective and continuous
energy management program in place that aims to reduce the plants energy expenditure so as
to ultimately reduce product cost
Electrical Electronic and Computer Engineering 2
Chapter 1 Problem Identification and Background
13 DISSERTATION OBJECTIVES
The dissertation objectives are as listed under the main and specific objectives in the subshy
sections that follow
131 Main objective
The main objective of this dissertation is to present a structured framework which would
enable effective management of energy cost and efficiency on cryogenic air separation plants
132 Specific objectives
The main objective is accomplished by addressing several key specific objectives
bull Present a model for energy management at cryogenic air separation plants
bull Introduce the theory behind an energy policy
bull Introduce an energy management strategy
bull Present an efficient energy audit process
bull Derivation of a mathematical model for the cryogenic air separation plant
bull Defining performance indicators which would assess the success of the energy
management program
bull Present the means for conducting energy systems maintenance on relevant
equipment on the plant
14 DISSERTATION STRUCTURE
This dissertation is structured in accordance with the energy management model
Chapter 2 introduces the reader to some of the various technologies available today for
producing air products and also elaborates on the basic theory behind cryogenic air separation
Electrical Electronic and Computer Engineering 3
Chapter 1 Problem Identification and Background
The main processes within the air separation plant are described as well as the equipment used
in realizing these processes
Chapter 3 introduces the energy management model and more specifically the energy
management system This chapter sets the scope for the chapters that follow and gives a brief
introduction of what each one entails
Chapter 4 describes the organizational structure of the energy management program as well as
the components its comprised of It also elaborates on energy management planning and
introduces the concept behind the energy policy and strategy In this chapter components of
the energy policy strategy are described in detail and selected concepts are explained by means
of case studies
In chapter 5 the managerial function of leading is described as well as a few issues
surrounding employee motivation Also included in chapter 5 is the theory behind energy
management controlling where concepts surrounding energy standards detection of deviations
and correction of deviations are elaborated on
The last chapter chapter 6 concludes the dissertation objectives and ends with
recommendations with regard to selected topics
Lastly the case studies presented in this study are with reference to the oxygen plant at Sasol
Secunda in South Africa unless otherwise stated
Electrical Electronic and Computer Engineering 4
Chapter 2 Cryogenic Air Separation
CHAPTER 2 CRYOGENIC AIR SEPARATION
21 INTRODUCTION
Air is a composition of various gasses of which nitrogen (N2) and oxygen (02) collectively
account for approximately 9903 of the total sample volume (Table 21) Various needs
have been developed for application of these gasses especially in the steel petrochemical and
metal industries where large amounts of oxygen and nitrogen are required According to Kotz
et ai [1] oxygen and nitrogen are used the most extensively by industry and they are annually
among the top five chemicals produced in the United States
Table 21 Components of air and their properties (Sources Austin [11] Kotz et ai [1])
Gas Molar Mass (mole) Volume () Boiling Point (K) Nitrogen 2801 78084 7735 Oxygen 3200 20946 9019 Argon 3995 0934 8727 Hydrogen 101 000005 2027 Neon 2018 0001921 2709 Helium 400 00005239 422 Krypton 8380 00001139 11981 Xenon 13129 00000087 16504 Carbon dioxide 4401 002-004 19468 bull Average molar mass of dry air =2896 gmol
Oxygen and nitrogen are produced by means of an air separation process which entails the
separation of air into its constituents The rare gasses like for example Argon Krypton and
Xenon are normally obtained as byproducts of the air separation process
Realization of the air separation process is done through the implementation of a specific air
separation technology There exist different air separation technologies today each one aimed
at exploiting different attributes with regard to the difference in physical properties between
the constituent air gasses In other words an air separation technology is based on the fact that
the fundamental components of air all have different physical properties and air separation is
Electrical Electronic and Computer Engineering 5
Chapter 2 Cryogenic Air Separation
therefore realized through for example distinguishing between molecule sizes distinguishing
between difference in diffusion rates through certain materials adsorption preference special
materials have towards certain gasses of the atmosphere and difference in boiling
temperatures
Some of the technologies being used today include adsorption chemical processes polymeric
membranes ion transport membrane (ITM) and cryogenic Table 22 compares the different
air separation technologies to each other in terms of technology status byproduct capability
product purity limit and plant startup time As can be seen from the table cryogenic air
separation technology is in a mature stage of its life cycle consequently making it the only
feasible means currently available for mass production of air products such as oxygen and
nitrogen
Table 22 Comparison of air separation technologies (Smith et ai [2])
Process Status Byproduct capability
Purity limit (vol )
Start-up time
Adsorption Semi -mature Poor 93-95 minutes Chemical developing Poor gt99 hours Cryogenic mature Excellent gt99 hours Membrane Semi-mature Poor 40 minutes ITM developing Poor gt99 hours
The sections that follow will be dedicated to cryogenic air separation technology
22 PROCESS DESCRIPTION
Cryogenic air separation technology is based on the fact that the different constituent gasses of
air all have different boiling points and by manipulating the immediate environment in terms
of temperature and pressure the air can be separated into its components
Various processes are needed in a cryogenic air separation plant of which the fundamental
ones are air compression air purification heat exchanging distillation and product
Electrical Electronic and Computer Engineering 6
Chapter 2 Cryogenic Air Separation
compression (figure 21)
Air Product Product compression compression delivery
I
Air - Heat Distillation
purification exchange
Figure 21 Processes involved in cryogenic air separation
Each process of figure 21 has a certain function and this function is performed by means of
relevant equipment Table 23 lists the equipment type utiHzed in each of the required
processes as well as their respective main functions
Table 23 A description on the function of each process and the equipment used for the
implementation thereof
Process Function Equipment type Pressurize air feed lines in
Air compression order to achieve required Compressor production I Purifying the air by Reversible exchangerssieve
Air purification removing water and CO2 adsorbers Cooling of incoming air feed by means of cold
Heat exchanging Heat exchanger recovery from exiting products Partial separation of air into
Distillation Distillation columns its constituents Pressurize outgoing product
Product compression feed in to meet user Compressor requirement
Electrical Electronic and Computer Engineering 7
Chapter 2 Cryogenic Air Separation
In figure 21 incoming air is pressurized by the air compressors and enters the process with a
certain flow-rate as determined by the demand of air product at the output of the plant
The air pre-treatment section removes impurities like water carbon dioxide and hydrocarbons
and is necessary because it prohibits vapour condensation liquid water solidification and
gaseous CO2 condensation from occurring within the heat-exchanger thus ensuring
continuous operation of a train
In order to obtain the required conditions for air distillation the air first needs to be cooled
down and this is done by means of heat exchanging between the air and outgoing product
streams
The distillation process is at the heart of the overall process this process performs the actual
separation of air into its constituents These air products are produced with a certain purity
which is defined as the ratio of the quantity of 100 pure air product to the quantity of total of
air product at the output
The outputs from the distillation process are fed back through the heat exchanger in order to
realize the cold recovery process that is needed for the cooling of the incoming air feed lines
The main air product is at low pressure when exiting the distillation process and is for this
reason usually compressed to the clients pressure specification prior to delivery
The system incorporating these processes is referred to as an oxygen or nitrogen train
whatever the main product may be A number of such trains are usually cascaded in order to
produce a high-tonnage air product output and is then collectively referred to as an oxygen or
nitrogen plant
The capacity of cryogenic air separation trains is expressed in tons per day (tpel) of main
Electrical Electronic and Computer Engineering 8
Chapter 2 Cryogenic Air Separation
product output The flow of air products is usually quantified in terms of normal-cubic meter
per hour (Nm31h) which is defined as the flow at 1013 absolute bar and DoC This is in
actuality a mass flow and not a volume flow and conversion between Nm3Ih and tpd may be
done by using the ideal gas law as stated in Perry et al [12] and Fishbane et al[13]
pV =nRT (1)
where
bull P is the gas pressure (kPa)
bull V is the volume (m3)
bull Tis the gas temperature (K)
bull R is the gas constant (831451JmoZ- i Ki)
Rearranging equation (1) and substituting the normal conditions stated earlier gives equation
(2)
V =22414xn (2)
Thus the volume occupied by one mole of gas is 22414m3 at normal conditions whatever the
gas may be The periodic table (Kotz et al [1]) states the molar mass of elements and this is
32gmol for oxygen (02) and 28gmol for nitrogen (N2) and knowing that Itpd is equivalent
to10624 glhour one may evaluate the ton per day rating for oxygen and nitrogen from the
mass flow specification or vice versa
ltpd O2 =2918 Nm31h (3)
1tpdN2= 3335 Nm31h (4)
23 DISTILLATION
As stated earlier the distillation process is at the heart of the overall process and for the
purpose of this dissertation this section will be dedicated to a basic explanation on its
operation The working of this process will be explained by means of an example highlighting
the critical elements of distillation and later on applying these principles to the distillation of
air
Electrical Electronic and Computer Engineering 9
Chapter 2 Cryogenic Air Separation
231 Example Distillation of an alcohol and water mixture
Consider a distillation flask in which there is a mixture of water and alcohol as depicted in
figure 22
Water + Alcohol
Figure 22 Distillation flask with water and alcohol mixture
In figure 23 the mixture is brought to boiling point with a boiler and a gaseous phase richer
in the most volatile component is obtained The gas is condensed and as alcohol vaporizes at
a lower temperature than water (we say that alcohol is more volatile than water) a distillate
richer in volatile elements is obtained
Gas richer in alcohol
Alcohol-rich
distillate
Figure 23 Water and alcohol mixture at boiling point producing a gas and consequent
distillate richer in alcohol
Condenser
Boiler
2 e]
Electrical Electronic and Computer Engineering 10
Chapter 2 Cryogenic Air Separation
By simply cascading a number of such systems as in figure 23 it is possible to make the
distillate richer and richer in volatile elements and thus effectively increasing the volatile
element purity of the distillate This arrangement is depicted in figure 24 and shows the
location of where the respective volumes of the volatile rich element and the less volatile rich
element may be obtained
This arrangement however has the disadvantage that it needs as many boilers and condensers
as distillation flasks but this can be overcome by making the liquid-gas contact more efficient
as is also being done in practice
Rich in less volatile Rich in volatile element (water) element (alcohol)
Figure 24 Cascaded distillation flasks producing a substance rich in volatile element at the
top and a substance rich in less volatile element at the bottom
By improving liquid-gas contact as shown in figure 25 better heat exchanging between the
liquid and the gas may be realized causing the gas to be cooled down partially and the liquid
to be heated up partially Cooling down the gas leads to its partial condensation and heating up
the liquid is accompanied by partial boiling thus distillation with only one boiler may still be
realized given that liquid gas contact is improved
Electrical Electronic and Computer Engineering 11
Chapter 2 Cryogenic Air Separation
Rich in less volatile element
(water)
Rich in volatile element (alcohol)
Figure 25 Distillation by means of improved liquid-gas contact between cascaded distillation
flasks
This concludes the water and alcohol example and the basic theory explained here will now be
made applicable to air distillation
232 Distillation of air
In practice distillation trays instead of flasks are used and the basic function of the tray is to
enable efficient contact of the descending liquid and the rising gas Thus the tray sets the
stage for following
bull Cooling and partial condensation of the rising gas
bull Heating and partial vaporization of the descending liquid
Figure 26 depicts a distillation column with only one vaporizer and one condenser
Distillation is made possible by efficient liquid-gas contact and this is enabled through proper
contact between the descending liquid and the rising gas The respective purities of the most
volatile and less volatile elements differ at each tray with the lower and upper sides of the
disti1lation column being the two extremes which is also where the pure elements are
obtained
Electrical Electronic and Computer Engineering 12
Chapter 2 Cryogenic Air Separation
Suppose that the mixture is no longer water and alcohol but oxygen and nitrogen (Le air)
then oxygen (less volatile element) would be produced at the bottom and nitrogen (most
volatile element) at the top
In figure 26 it is clear that the tray provides the rising gas with a certain resistance and thus
creating a pressure drop this pressure drop must be as small as possible for it has a significant
impact on the energy consumption of the air compressor and is also an important parameter in
development of a trays technology Distillation packing is another technology that is being
used and as opposed to fractional distillation trays ensures a much smaller total pressure drop
as well as improved liquid-gas contact
Condenser
Liquid-gas contact c s 0 r w
Distillation )column
Tray )
Vaporizer
Most volatile
component
$1
~ 8shyS 0 u
~ cI-0 gt
S
4-lt 0
egt middotc ~
$1 ltU $1 0
ashy0 u ltU
3 -cI-0 gt ~
4-lt 0
egt middotc I
Q
Less volatile
component
Figure 26 Distillation column producing oxygen and nitrogen by means of fractional
distillation trays [5J
Electrical Electronic and Computer Engineering 13
Chapter 2 Cryogenic Air Separation
In practice the model presented in figure 26 would be uneconomical since it needs both a
vaporizer and condenser It is possible to remove either one but then the column would be
limited to either producing oxygen or nitrogen and not both at the same time
When removing the condenser it is still possible to produce oxygen however a liquid mixture
of nitrogen and oxygen is needed and this must be injected at the top of the column as shown
in figure 27
Residual product (N2 + O2)
GAS
LIQUID
Less volatile air product (02 )
LIQUID Vaporizer
Figure 27 Producing oxygen by utilizing a distillation column with no condenser [5]
It is important that the mixture entering the column must be in the liquid phase otherwise
there will only be one phase (gas phase) in the column which means that distillation would
not be possible as it requires both a gas phase and a liquid phase
Thus with the model presented in figure 27 liquid oxygen is produced at the bottom and a
residual gas consisting of nitrogen and oxygen at the top
Electrical Electronic and Computer Engineering 14
Chapter 2 Cryogenic Air Separation
Figure 28 shows a model for producing nitrogen The distillation column utilizes only a
condenser and it is required that a nitrogen and oxygen gas mixture be injected at the bottom
of the column
Condenser The more volatile product
GAS
Nz+ O2 mixture
Residual product (N2+ O2)GAS
LIQUID
Figure 28 Producing nitrogen by utilizing a distillation column with no vaporizer [5]
Gaseous nitrogen is obtained at the top of the column whereas a residual liquid mixture rich in
oxygen is obtained as a byproduct at the bottom of the column
By injecting a liquid oxygen and nitrogen mixture instead of a gaseous mixture at the bottom
of the column would make distillation impossible because there will again be only be one
phase (liquid phase) present
Thus to summarize when producing oxygen a liquid mixture of oxygen and nitrogen and a
column equipped with a vaporizer at the bottom is required To produce nitrogen a gaseous
Electrical Electronic and Computer Engineering 15
Chapter 2 Cryogenic Air Separation
mixture of oxygen and nitrogen as well as a column equipped with a condenser at the top is
needed a byproduct rich in oxygen will also be produced in this instance
By stacking the columns presented in figures 27 and 28 on top of one another and by
routing the oxygen rich liquid which is obtained at the bottom of the nitrogen column to the
top of the oxygen column it is possible to produce oxygen and nitrogen by using only a
condenser as shown in figure 29
An oxygen rich liquid enters the top of the upper distillation column and through distillation
results in liquid oxygen (LOX) at the bottom of the same column Vaporization of the LOX
into gaseous oxygen (OOX) is realized by means of the heat exchanging that occurs between
the gaseous nitrogen (OAN) at the top of the lower column and the LOX at the bottom of the
upper column At the top of the upper column a waste product consisting of a nitrogen and
oxygen gas mixture is also produced
In practice the function of the condenser is fulfilled by a heat exchanger that ensures that
proper heat is carried over from the OAN to the LOX and vice versa in order to enable
vaporization of the LOX and condensation of the OAN which is required for the continuous
operation of the distillation columns
In this model the columns are stacked on top of each other but it is also possible to place them
alongside one another as occasionally being done in practice
This concludes the discussion on distillation further explanation on this subject is beyond the
scope of this dissertation and the basic theory presented here should be sufficient and relevant
to understanding the selected material presented in this study
Electrical Electronic and Computer Engineering 16
Chapter 2 Cryogenic Air Separation
GOX ---shy
LOX l1li---shy
Condenser
GAN ---shy
Air
Oxygen rich liquid
Figure 29 Stacked column model that enables the production of oxygen and nitrogen
Electrical Electronic and Computer Engineering 17
Chapter 2 Cryogenic Air Separation
24 CONCLUSION
This chapter has explained the basic theory behind cryogenic air separation It details the
properties of air and compares the various technologies for producing certain air products
This chapter states the main processes of cryogemc air separation and they are air
compression air purification heat exchanging distillation and product compression These
processes as well as the interaction between them have been described
Distillation is the key process in cryogenic air separation and has consequently been given
special consideration to in this chapter The basic theory behind distillation as well as how this
applies to the separation of air have been elaborated on which should serve as a sufficient
reference for the remainder of this dissertation
Electrical Electronic and Computer Engineering 18
Chapter 3 Energy Management
CHAPTER 3 ENERGY MANAGEMENT
31 INTRODUCTION
Management is essential in any organized collaboration and should be implemented at all
levels of an enterprise (Koontz [14] et al) An organization has certain inputs to its disposal
be it human resources funds technology skills etc and it is the basic function of the manager
in charge to efficiently manage these valuable inputs in pursuit of achieving predefined
objectives in an optimum manner In an industrial plant like the cryogenic air separation plant
typical inputs are production personnel the various maintenance departments (electrical
mechanical instrument turbo etc) engineering financial and information technology among
others and all these resources are normally subjected to some form of management Energy is
another important input to the plant the plant needs energy to produce its products to the
clients specification and given that cryogenic air separation plants are energy intensive by
nature efficient energy management will have a definite impact in the cost per product
produced
For instance the oxygen plant at Sasol Secunda in South Africa is composed out of several
trains which col1ectively account for approximately 35 of the factorys total power
consumption In terms of the total operating cost of the oxygen plant itself the energy cost
constitutes 72 thereof compared to the 2 of labor costs and 8 of maintenance related
costs [15] This relatively large electricity cost is typical of cryogenic air separation plants
(also refer to Sarkar [6] and Gupta et al [9]) and it is quite possible to manage the usage of
energy in such a way as to ultimately reduce the cost per product produced
32 ENERGY MANAGEMENT AT CRYOGENIC AIR SEPARATION PLANTS
Turner [16] defines energy management as the control of energy consuming devices for the
purpose of minimizing energy demand and consumption Energy management is defined by
Janse van Rensburg [17] to be the perspicacious and efficient usage of energy Another
definition is that from Ottaviano [18] where energy management is defined as the reduction of
demand through conservation
Electrical Electronic and Computer Engineering 19
Chapter 3 Energy Management
The aim of energy management is defined by Thuman et al [10] as the reduction of energy
expenditure for the purpose of reducing the cost of a product so as to increase competitive
performance
With the various energy management definitions in mind one can come to the conclusion that
energy management is some sort of process ultimately resulting in reduced energy
expenditure How then would one go about describing this process which energy
management is In terms of energy management applied to cryogenic air separation plants
energy management may sufficiently be described as a transformation process and this will be
the topic of the next section
32 MODEL FOR ENERGY MANAGEMENT AT CRYOGENIC AIR SEPARATION
PLANTS
The Oxford dictionary [19] defines a model as a representation of reality a simplified
description of a complex system The model developed here serves as a generic framework for
energy management at cryogenic air separation plants and provides insight and understanding
of the energy management process as well as giving structure to this understanding it is a
product of systems thinking and takes on a holistic approach towards energy management A
basic outline ofthe model is presented in figure 31
External environment
Inputs
Resources Accomplished objectives
Figure 31 Basic outline of the energy management model
Energy management process
(transformation process) Outputs
Electrical Electronic and Computer Engineering 20
Chapter 3 Energy Management
The basic function of the energy manager is to transform the inputs (resources) in an effective
and efficient manner into outputs of higher value With the available resources as levers and
with the expected objectives in mind the energy manager has to convert the resources into the
pre-defined objectives by means of a transformation process This transformation process is
the organizational structure of the energy management program for which the management
thereof is the responsibility of the energy manager
The organizational structure of the energy management program is part of larger systems such
as the industry to which it belongs social systems economic systems and even the natural
environment and this is accounted for by the inclusion of the external environment Typical
inputs from the external environment are resources like capital skills facilities and people
and as shown in the figure the external environment is ultimately affected by the outcomes of
the energy management program
33 ENERGY MANAGEMENT SYSTEM THE TRANSFORMATION PROCESS
It is generally accepted that the fundamental components of management are planning
organizing staffing leading and controlling (Koontz et al [14]) Energy management is a
managerial action and most of these functions also apply to the energy management system
Figure 32 depicts the energy management model and states the components of the
transformation process
Through organizing the energy management program the energy manager gives it definition
and structure It mainly involves identification and classification of required activities and the
grouping of these activities in a structured and meaningful way
Planning involves the decision-making process This is where policies are set objectives are
determined and the strategies in attaining these objectives are established
Electrical Electronic and Computer Engineering
i L4502-7S
bH LczJ 717 ~
21
Chapter 3 Energy Management
Inputs Resources
- Capital
- Skills
- Facilities
- People
External environment
- Energy management structure C1et1m1t10Ilt~1
- Energy policy strategy
Hil- Human resource deployment
- Current situation evaluation
- Energy systems maintenance
- Energy management plan
Establishing standards
Performance measurement
Figure 32 The energy management model
Outputs Accomplished energy management objectives
- Reduced production cost
- PM maintenance strategies
- Improved plant design
- Improved production schedules
- etc
Electrical Electronic and Computer Engineering 22
Chapter 3 Energy Management
Leading refers to the process of influencing people so that they will strive willingly and
enthusiastically toward the achievement of energy management goals
Controlling is the measurement and correction of performance in order to ensure that
objectives and the plans devised in attaining them are being accomplished
These managerial functions make up the transformation process and in performing these
functions the energy manager enables an efficient and effective process for achieving energy
management objectives Analysis of each of these functions will be given in the chapters that
follow
34 CONCLUSION
In this chapter a model for energy management is given the energy management process is
modeled as a transformation process in which resource inputs are converted into outputs of
higher value
The model entails the transformation process its inputs and outputs and the external
environment as well as the interaction between all of these Inputs are resources like people
skills and facilities outputs are the accomplished energy management objectives like
improved preventive maintenance schedules optimized production schedules and reduced
energy cost
The external environment accounts for the higher-order systems to which the energy
management system belongs The transformation process involves the managerial functions of
organizing planning leading and controlling which are the core managerial functions the
energy manager has to perform Each function entails various activities and will be explained
in more detail in the chapters that follow
Electrical Electronic and Computer Engineering 23
Chapter 4 Organizing and Planning
CHAPTER 4 ORGANIZING AND PLANNING
41 ORGANIZING
With reference to general management Koontz et al [14] states that organization implies a
formalized intentional structure of roles and positions Generally organization involves 1) the
identification and classification of required activities 2) the grouping of activities necessary to
obtain objectives and 3) the delegation of authority for the means of managing these
groupings
With reference to energy management there should be an intentional and formal structure in
place for conducting a continuous and efficient energy management program The structure
presented in this study defines three groups of activities energy management planning
leading and controlling The activities under each grouping will be explained in the sections
and chapters that follow
42 PLANNING
Planning involves decision-making This is where courses of action are selected objectives are
set and strategies in attaining these objectives are determined The starting block of the energy
management program is the energy policy The energy policy is a statement or understanding
that guides or channels thinking it is an expression of the commitment plant management has
towards a continuous and effective energy management and sets the scope for energy
management strategies at plant level
43 THE ENERGY POLICY
Plant management should establish an energy policy that is in line with major policies in order
to ultimately add value to overall company objectives The energy policy at plant level may be
derived from a major policy and is therefore called a derivative or minor policy (Koontz et al
[141) Figure 41 shows the energy policy at various levels of the organization as well as the
scope of the policy at each of these levels
Electrical Electronic and Computer Engineering 24
C hapter 4 Organi zing and Planning
Company wide policy
Scope of company wide policy
incorporating all divis ions
Scope of divisional policy derived from
company poli cy
Scope of plant pol icy deri ved From the
divisional policy and made appl icable to
the plant
Figure 4 1 Energy policy at different levels o f the organi zati o n and the scope of the po licy at
each level
Thus the energy poli cy aL planL level is Lypicall y a deri vati on o f hi ghe r-orde r po li c ies Lhese
policies may be hi gher-level energy or environmental po li cies and has a much la rger scope
than the plant-level energy po li cy
As an example the sa fety hea lth and environmental po li cy of Sasol Secunda is a companyshy
wide policy
bull Compally-wide policy (Safety Health and Environll1el11al Policy)
Electrica l E lecLronic and Com pULer Eng ineering 25
Chapter 4 Organizing and Planning
We are committed to responsible utilization of natural resources and we will manage our
company wherever we do business in an ethical way that strikes an appropriate and well
reasoned balance between economic social and environmental needs [20]
From this policy it can be seen that Sasol recognizes its responsibility towards the
environment and also states that intentional effort concerning the balance between economic
and environmental issues will be instated by means of managerial actions which is also where
the high-level energy policy may stem from
bull Division-wide policy
To manage the SasollElectricity Supply Industry interface so as to minimize the total cost of
energy for the Sasol group of companies Further to this to promote energy efficiency and
reward energy management success by decentralizing accountability for electricity costs and
by aligning internal electricity tariff structures with the Eskom marginal rate [21]
From the above an energy policy at plant-level may now be derived
bull Plant-wide energy policy
We at oxygen plant are committed to responsible energy usage and endorse efficient energy
management practices in order to optimize our energy consumption
The energy policy normally consists out of three components the declaration of commitment
mission statement and specific objectives To illustrate the difference between these the
division-wide policy [21] will be taken as an example The mission statement defines the
scope of the energy management program and as can be seen in this case it has been included
in the declaration of commitment
Electrical Electronic and Computer Engineering 26
Chapter 4 Organizing and Planning
The specific objectives are the means for achieving that stated in the mission statement and
from the same example some objectives are
bull Develop ways of getting all stakeholders involved in energy management
bull Implement and continuously improve world-class best practice energy management
within our operations
bull Pioneer cross-functional and cross-divisional collaboration within the group of
companies
bull Facilitate the creation of an enabling environment which leads all key role players
agreeing to and achieving stretched targets
bull Develop and maintain the electricity measurement system within the group of companies
44 THE ENERGY POLICY STRATEGY
With the energy policy in place the logical next step would be to formulate a strategy in order
to realize the vision as expressed by the policy The energy policy strategy effectively
encapsulates the plan for changing current reality into future vision and in doing so the
following activities need to be addressed
bull deployment of human resources
bull current situation evaluation
bull energy systems maintenance
bull energy management planning
bull establishment of measurement and control indicators
These are the constituents of the energy policy strategy and each will be elaborated on in the
sections that follow
Electrical Electronic and Computer Engineering 27
Chapter 4 Organizing and Planning
441 Deployment of human resources
Plant management should appoint a dedicated person for taking the responsibility of driving
the energy management program This person should be knowledgeable of the technology
used in cryogenics and be experienced in energy auditing and management This person
should also assist plant management in adjustingrefining the current energy policy in order to
make sure that it adds value and makes allowance for the holistic approach of energy
management
Koontz et al [14] defines two types of policies namely intended policy and actual policy
Initially plant management may have had no intended energy policy but by agreeing upon the
appointment of a dedicated energy manager to drive an energy management program they
have in actuality instated an ill-defined energy policy and it is the task of the energy manager
to now properly structure and formalize the energy policy in conjunction with management
442 Current situation evaluation
The current situation of the plant is assessed by means of an energy audit process Energy
auditing is an important phase of the energy management program and the success of such a
program to a large extent depends on how well and to what extent the energy audit was done
(Thuman [22] and Ottaviano [18]) After all the plant first has to know itself before it can
correct itself The aim of the auditing process is to establish the relative position of the plant
from an energy management point of view
Auditing is not a once-off process instead it should be done on a regular basis so that the
energy manager can make the value-adding decisions regarding corrective measures The
outcomes of the auditing process are the following (refer also to Ottaviano [18])
bull assessment of energy consumption and energy usage patterns
bull identification of potential improvement opportunities
bull assessment of energy norms
Electrical Electronic and Computer Engineering 28
Chapter 4 Organizing and Planning
bull employee awareness
bull feasibility of potential energy projects
4421 The energy audit process
The audit process consists out of the energy audit policy and the energy audit strategy The
energy audit policy sets the scope for what to audit whereas the energy audit policy strategy
states how this would be done
The audit strategies are the means for conducting the energy audit and the relative position of
the plant with regard to energy management is determined through the evaluation of certain
plant efficiencies as listed by Senekal [23]
bull Management efficiency
bull Maintenance efficiency
bull Operating efficiency
bull Design efficiency
bull Storage efficiency
bull Information efficiency
These efficiencies are determined from an energy management perspective and a holistic
approach to energy management lies in managing available resources in such a manner as to
optimize all these efficiencies
4422 The plant efficiencies
The cryogenic air separation plant like any other enterprise aims to convert resource inputs
into outputs of higher value For the cryogenic air separation plant typical inputs are capital
employees skills and technology and the common goal is to convert these inputs into products
Electrical Electronic and Computer Engineering 29
Chapter 4 Organizing and Planning
like oxygen nitrogen andor rare gases to customer satisfaction This conversion is done with
some amount of efficiency loss and in optimizing the overall efficiency necessarily means a
higher level of output with the same amount of input
Each department within the plant contributes to the overall efficiency loss and the contribution
energy management has is assessed in terms of the efficiencies already listed
Plant structure from energy management perspective
Management Maintenance Operating Design Storage Information
efficiency efficiency efficiency efficiency efficiency efficiency ~ ~ ~
~ ~ ~ - ~ ~ - v
-- - - -
Quantity of output product Resources
per unit of electrical cost
Figure 42 An illustration of efficiency losses inherent to the plants structure from an energy
managers perspective and how they collectively contribute to the ultimate quantity of output
product per Rand of electrical cost
In order to assess these plant efficiencies certain strategies should be employed but first an
explanation on what each efficiency entail will be presented
bull Management efficiency
Management efficiency is determined in terms of the commitment plant management has
toward energy management The level of this commitment should be determined and is a
function of the following
bull The existing energy policy
bull Amount of resources allocated for energy management
Electrical Electronic and Computer Engineering 30
Chapter 4 Organizing and Planning
The energy manager should determine whether there is an existing energy policy in place and
also establish on which level this policy originates from Next it should be determined
whether this policy has been derived to plant level and also whether it has been applied at this
level The extent of this application should also be determined Le are there any strategies
outflowing from this policy Have any resources been committed Have they been
implemented Are they relevant and in scope
bull Maintenance efficiency
The maintenance efficiency is determined by the extent of intentional consideration given to
the optimization of energy efficiency of relevant equipment in existing maintenance life plans
Maintenance efficiency goes hand in hand with energy systems maintenance which will be
dealt with in more detail later on in this chapter
bull Operating efficiency
By taking the system just as it is and not altering any design features try to obtain the most
efficient system operation This could mean changing process schedules or consolidating plant
activities
As mentioned by Senekal [23] the operating design and storage efficiencies are very closely
related and in most of the cases by changing one it would have an influence on the other two
These three efficiencies may be determined by means of utilizing a mathematical model
which is a specific audit strategy and will be discussed later on
As an example of operating efficiency consider an oxygen plant that has electric motor driven
compressors as well as steam turbine driven compressors During peak hours steam is cheaper
than electricity which means that just by changing production schedules of the electric andmiddot
steam trains during these times (increasing production of the steam trains and lowering that of
the electric trains) significant energy cost savings may be realized
Electrical Electronic and Computer Engineering 31
Chapter 4 Organizing and Planning
bull Design efficiency
Design efficiency entails the evaluation of the plants efficiency by taking into account the
systems design Restraining factors in the design are identified and by altering design
parameters the auditor can determine possible ways of optimization These design
deficiencies are normally the cause of
bull Inadequate design from an energy managers point of view
bull Inefficient equipment - a cause of equipment deterioration andor the availability of
improved and more energy efficient technology
For example at one plant motor-generator sets are used for bringing the large air compressor
motors up to speed The MG sets were installed twenty years ago and compared to soft starter
technologies available today are much more unreliable The unreliability of the MG set
caused numerous startup delays in the past resulting in significant production losses with the
implication that production department insisted that the air compressors be kept online even
when product demand is low This decision acts as a barrier to potential energy savings that
lies in taking an air compressor off-line when demand is low Thus by changing the original
design through introducing better technology (implementing better soft starter technology)
may lead to potential energy cost savings
bull Storage efficiency
Often there are cost saving opportunities by using storage facilities more efficiently This can
be seen in the case were the plant has a LOX tank facility to its disposal Excess LOX can be
pumped to the tank during off-peak times and can then be used later on to supplement the
demand during peak times Because there is now an extra supply channel it leads to the air
compressors having to produce less compressed air and ultimately results in energy cost
savings
bull Information efficiency
Information efficiency refers to the availability and nature of the relevant information
Electrical Electronic and Computer Engineering 32
Chapter 4 Organizing and Planning
necessary for conducting the energy management program Correct and accurate information
is vital to the energy management program and the energy manager must make sure that
relevant information is easily accessible
For instance data concerning the state (flows pressures temperatures purities etc) of air
commodities within the plant and each of the respective trains is crucial performing certain
energy management activities and barriers restricting the accessibility and availability of this
information should be addressed and overcome if the energy management effort is by any
means going to be successful
4423 Energy audit policy
The audit policy scopes the auditing work to be done and basically serves as a guideline in the
auditing process It is advisable to establish a formal energy audit policy because it gives
direction to the audit process and for the holistic approach this policy should enable the
assessment of all the relevant plant efficiencies mentioned earlier
4424 Energy audit strategy
In order to determine the plant efficiencies as stated in the audit policy audit strategies are
utilized and those that are most relevant are (also refer to Turner [16])
bull Familiarization with plant characteristics and operation
bull The questionnaire
bull The walk audit
bull The measurement audit
bull Database building
bull Mathematical model
bull Financial analysis and feasibility studies
Each strategy will now be looked at in more detail in the sections that follow
Electrical Electronic and Computer Engineering 33
Chapter 4 Organizing and Planning
bull Familiarization with plant characteristics and operation
For the audit to bear meaningful results the energy manager should first attain a relatively
thorough understanding of the characteristics of the plant as well as its production policy This
entails the following
bull Understanding of operating characteristics and production policy This also
includes identifying the input and output streams to and from the plant
bull Construct relevant process flow diagrams - This includes process models of the
plant and relevant sub-systems Also identify and make a list of all the energy
consuming components include attributes such as equipment ratings purpose of
equipment and quantity of each
bull Establish the user requirements for the plant and critical sub-sections
The key principles in plant familiarization will now be applied by taking the oxygen plant at
Sasol Secunda as an example
o Understanding ofoperating characteristics and production policy
The oxygen plant is part of a process chain and to have an idea of where it fits into the overall
system the following two tables shows the inputs of and outputs to and from the oxygen plant
Table 41 Details surrounding commodity inputs to the oxygen plant at Sasol Secunda
Water works
Distribution
and Plant air Air utilities
Electrical Electronic and Computer Engineering 34
Chapter 4 Organizing and Planning
Table 42 Details surrounding commodity outputs from the oxygen plant at Sasol Secunda
upplying various factory loads
The plant is running at full load twenty-four hours per day seven days a week All the outputs
must be produced with minimal stoppage The plant also incorporates a very useful buffer
system a LOX tank which is supplemented with excess LOX at times when oxygen demand is
relatively low or whenever there is spare capacity available The LOX tank serves the purpose
of supplementing oxygen demand at peak times when the available capacity isnt able to
match the demand Because atmospheric temperature plays such an important role in
producing excess LOX this commodity is usually fed to the LOX tank overnight when
temperatures are relatively low
There is a balance to be maintained in producing the various products which means that a
change in major output streams has a definite influence on the other output products There is
however priority assigned to the production of each commodity detailed in table 43
Table 43 Prioritization of output products of the oxygen plant
Priority Product Implication of production loss 1 (highest) Oxygen amp Nitrogen Substantial production loss 2 Nitrogen Substantial production loss 3 Instrument air Non-critical plants trip 4 (lowest) LOX Production loss at KryptonXenon plant
Electrical Electronic and Computer Engineering
I
35
Chapter 4 Organizing and Planning
CJ Construct relevant process flow diagrams
The oxygen plant comprises of seven oxygen trains as well as a spare oxygen compressor and
the outline of the plant is shown in figure 43
Oxygen Plant
HP02
507 200 Nm3h and 985 purity
~
l~ 0 72 200 Nm3h I
Air Inbull Train 1 I II 1middot O2 72200 Nm3h middot middot I Air In
Train 2 II ~
I middot bull I
0 72 200 Nm31h middot middot Air Inbull Train 3 I I ~ bull ~
72 200 middot middot Nm(when online)
I LPO LP~ HPAIR I
COMMON middot middot COMMONbull Spare Train bullbull middot I HEADER HEADERmiddotI I middot middot middot
HP02 middot middotbull I ~
COMMON HEADER
I middot
Air In Train 4 bull middot
middot middot I
O2 72200 NmJh II middot ImiddotI middot Air Ini bull Train 5 I I 0 72 200 NmJh ~
bull bull I
I middot middot Air Inbull Train 6 I i 0 72 200 Nm3h HI bull
middot ~middot middot Air Iny Train 7 II I I
I ~ 0 74000 Nm________________________________J
Figure 43 Basic outline of the oxygen plant at Sasol Secunda The flows presented here are
the steady state maximum amounts of oxygen that each train is able to produce
Electrical Electronic and Computer Engineering 36
Chapter 4 Organizing and Planning
The trains are linked by means of three common headers the air LP oxygen and HP oxygen
common headers Each train can sustain a continuous production of up to 72 200Nm31h of
oxygen except for train 7 which has a slightly higher capacity (74 000Nm31h) resulting in a
collective maximum production capacity of 507 200Nm31h for the plant
The main product high purity gaseous oxygen is produced at 985 purity (minimum) which
is pumped into a common header and distributed to the various loads within each factory
(gasification and gas-reforming)
The main purpose of the air common header is to minimize losses whenever an air compressor
goes offline In normal operation however there is little or no air exchange between trains but
as soon as one air compressor goes offline the air present in the common header supplies that
trains air demand Trains 1-6 are connected to the air common header with train seven
working in isolation Usually the air valve of train seven remains closed it is only in abnormal
circumstances that it is opened but then only by a relatively small amount
A control system monitors and controls the production of compressed air and it does this by
monitoring the compressed air demand and then opening or closing the guide vanes of all six
compressors by an equal amount thus effectively sharing the load equally between the six air
compressors
The spare train consists only of an oxygen compressor and is put online whenever one of the
other oxygen compressors is taken out of operation (eg due to breakdown or for routine
maintenance) Each train has two oxygen outlets namely the high-pressure (HP) outlet and
the low-pressure (LP) outlet In normal operation the trains LP oxygen output is isolated from
the LP common header via a valve but as soon as that trains oxygen compressor is out of
operation the valve opens enabling the LP oxygen to enter the common header and the spare
oxygen compressor goes online
Electrical Electronic and Computer Engineering 37
--
tTl (l) () qshy(i ~ -shytTl (l) () qshy0s ()
sect CJ (1 0 gs tTls
(J(l
Ei (l)
~ Er
(J(l
w
(1r
Excess N2 toatm i
HPN1
Dry air
to factory
Main heat ExchanJ2cr
--------------
=-t--n rI
----n
-
-_ -- J
~Waste N2
1
Coldbox
LOX
TIciQ Air from s -- atmosphere
-- n -
-------- ~
f p0 () (l)
=shy0 ~ 0 ~
s (J(l
(l)
0
~ (J(l (l)
s qshy1
1
Air Water Tower Dryer Dryer
1 2
ChilI Wet air LP02
Water Tower
~ sect
HP02 N (to factory) s
(J(lLPN1
sect CJ
IA g (to factory) ~ ss
Smiddot (J(l 00
Chapter 4 Organizing and Planning
Figure 44 shows the process flow of a single train All the electric utili zi ng equipment are
highlighted Note the quantity and process requirements are also brought onto thi s process
flow diagra m for example (112) means that process requirements need one of the two
installed equipment types during normal operati on
Table 44 Summary of electri cal machinery ratings and capacity requirements for production
means
QuantityO2 Production Operating Motor description Rating requirement QTY
train online
timeday
Expansion turbine motor 525 kW 2 1 24 h
Nitrogen blower motor 300 kW 2 1 24 h
Oxygen compressor motor 137 MW I 1 24 h
Air compressor motor 37MW I I 24 h
Chi ll water pump motor 75 kW 2 1 24 h
Water pump motor 132 kW 2 1 24 h
Jack- up oil pump motor 36kW 2 1 24 h
Installed capacity 52836MW
Utilized capacity 51678MW
Utilization 980
o Establish Ihe II ser requirements
Table 4 5 li sts the user requirements for the oxygen plant s output products
Table 45 Summary of the user requ irements for each product
Product Quantity Purity Delivery p Delivery p (kNm1t) (min) (min) kPa (max) kPa
Oxygen 72000 985 3440 3480 Nitroen 22000 999 420 430 LOX 3500 - 100 120 IA 8000 - 420 450
Electrical Elec troni c and Computer Engineering 39
Chapter 4 Organizing and Planning
bull The questionnaire
In conducting the energy audit the energy manager would undoubtedly find it necessary to
conduct interviews with key personnel The questionnaire is a structured and well-planned
approach in acquiring important information from personnel and it is imperative to identify the
appropriate personnel when conducting the audit For example determining maintenance
practices by interviewing production personnel would in most cases give a distorted picture
of the actual situation or in other instances not bear any meaningful results at all
It is very important that the questionnaire is planned thoroughly in advance The energy
manager should aim to attain as much information as possible with the least amount of
questions since personnel do not always have adequate time available
bull The walk audit
The walk audit goes hand-in-hand with plant familiarization and it enables the energy manager
to view the plant first hand It entails determining the state of the plant and in order for the
energy manager to make this audit value adding it would be a good idea to also take a guide
along one who is experienced with the equipment and the operation of the plant
bull The measurement audit
Relevant measurements of energy consumption flows pressures and temperatures can be
taken whenever there is no automatic measurement system in place but at most of these plants
real-time data collection is in place and data may simply be downloaded from were it is stored
bull Database building
Because the audit process is such an important phase in the energy management program all
the data collected should be stored for easy reference The database is a collection of various
pieces of information in different formats and it is thus important to have a structure in place
in which the information is organized in a meaningful manner The database should compose
Electrical Electronic and Computer Engineering 40
Chapter 4 Organizing and Planning
of the following
bull Results from other audits conducted
bull Specifications of machine ratings
bull Process amp equipment limitations and constraints
bull Operating schedules of plant
bull Maintenance strategies and schedules
bull Financial analysis and feasibility studies
One output of the energy audit process is the identification of potential improvement
opportunities and in response to this the energy manager is now concerned with identifying
alternatives as the means for realizing the different improvements
Normally most of the options would require capital investment to realize and the problem is
that the benefits resulting from an investment option is stretched over a period of time whereas
the investment is required now Thus feasibility studies are conducted with the aid of financial
analysis tools and only the most feasible option for each alternative should be considered
bull Energy conversion model
The energy model is an important auditing tool and adds great value to the energy
management program The basic idea behind the energy conversion model is to express the
plants power consumption as a function of main air product output under certain conditions
From the cryogenic air separation plants point of view a fairly accurate model may be very
complicated but it will be the aim of this section to present model building blocks that are
relatively simple whilst still providing adequate accuracy
As Delport [24] mentions there are basically two levels within process modeling The first
level is the physical model which is the energy managers understanding of the real world
Electrical Electronic and Computer Engineering 41
Chapter 4 Organizing and Planning
system in conjunc ti on with the follo wing restraining factors
bull assumptions and simplifi cations that are in line with the model acc uracy and
requirements
bull level of detail that has been decided upon
bull system and subsystem boundaries
bull data requirements and avail abi li ty
The second level in process modeling is the energy conversion model which is the
mathematical representati on of the physical model The difference between the physica l model
and energy conversion model should be noted the physical model is an abstracti on of the real
world system and the energy conversion model is an abstraction of the physical model
In order to deri ve an energy model for the plant the plant first needs to broken down into its
various levels of subsystems as shown in fi gure 45 It should be noted that the air purifi cati on
system and all other au xili ary equipment have been omitted from thi s system breakdown thi s
is because it is assumed that the energy loss th rough the purification system is negli gible and
the energy consumption of all other auxiliary equ ipment is insignifi cant compared to that of
the compressor motors It may be th at in certa in plants the auxiliary equipment may not be
insignifi cant at all in these situati ons the energy manager is urged to deri ve models fo r these
subsystems as we ll
Whole CRYOGENIC AIR SEPARATION PLANT
Industry
EndmiddotUser Trains 1 to n
Groups
Processes Air Compression
Air Separation Process Product Compression
System Systelll
Machinery Air
Motor Air purifi cation Main Heat Distillation Product
Motor Compressor system Exchanger Columns Compressor
Figure 4 5 Simplified system breakdown structure of the cryogenic air separati on plant
Electrical Electronic and Computer Engineering 42
Chapter 4 Organizing and Planning
From figure 45 the following is clear
n
P =p (1)plant ~ train m
m=
where
bull n is the number of trains
bull Pplant is the power consumption of the cryogenic air separation plant (MW)
bull Ptrain m is the power consumption of train m (MW)
Neglecting power consumption of auxiliary machinery the power consumption for each endshy
user group will be as stated in equation (2)
P =P +P (2)train m ACm PCm
where
bull PACm is the input power of air compressor motor of train m (MW)
bull PPCm is the input power of product compressor motor from train m (MW)
The input power for a compressor motor is
pslUlft
P xm (3)xm
where
bull x refers to the motor of a compressor type x ie the motor driving the air or
product compressor
bull m is the train number
bull Pxm is the input power of type x compressor motor of train m (MW)
Electrical Electronic and Computer Engineering 43
Chapter 4 Organizing and Planning
bull p~ft is the shaft power (output power) of type x compressor motor of train m
(MW)
bull lm is the electromechanical efficiency of type x compressor motor of train m
It is a fact that when a gas is compressed its temperature rises significantly and if this increase
in temperature is too much it would cause the oil to ignite and deteriorate mechanical parts
This places a restriction on the compression ratio (ratio of absolute outlet pressure to absolute
inlet pressure) of the compressor and hence this ratio is rarely greater than three (Air Liquide
[5])
Because of this constraint multi-stage compression with inter-cooling is implemented to
achieve the required output pressure Inter-cooling is normally realized through either air- or
water-cooling however air-cooling is normally limited to smaller size compressors Watershy
cooling is the more effective of the two because of its ease of control and greater heat
absorption capability (Talbott [25])
Another reason for employing multi-staging in compressors is because of its energy saving
attribute the energy saving is achieved because cooling the air down between stages reduces
the inlet air volume of the next compression stage and hence the work required to complete the
compression (Salisbury [26] and Talbott [25])
The operation of the multi-stage compressor can be followed by referring to the pressureshy
volume diagram in figure 46 The area enclosed by 1-2-3-4 represents the adiabatic work to
be done by the compressor to compress a gas from a pressure of PI to P2 The area demarcated
by 1-2-5-4 represents the necessary work for isothermal compression
Electrical Electronic and Computer Engineering 44
Chapter 4 Organizing and Planning
Isothermal Adiabatic compression compression
p
~__________~~__+-______~~~2
v
Figure 46 Multi-stage compression cycle with interstage cooling (Coulson et al [27])
Because the gas inlet temperature at each stage stays constant one can see that actual
compression takes place near the isothermal curve Thus a simplifying assumption would be
to approximate the compressor characteristic by assuming isothermal compression
Thus the shaft power required by the compressor will be as expressed by equation (4)
(4)
where
bull P =output power of type x compressor of train m (MW)
bull 1] =isothermal efficiency of type x compressor of train m xm
Electrical Electronic and Computer Engineering 45
Chapter 4 Organizing and Planning
The output power of the compressor is a function of the intercooler temperature the air flow
and the pressure ratio and for isothermal compression this relationship is expressed as in
equation (5) (refer to Baumeister et al [28] amp Salisbury [26])
out pout = kxQ xl xln Pm (5)xm xm Ie In( Pxm
where
bull Qxm is the gas flow from compressor of type x of train m (kNm3h)
bull 0c is the intercooler temperature (K)
bull P~~ is the gas absolute output pressure of type x compressor of train m (kPa)
bull Pm is the absolute inlet pressure of type x compressor of train m (kP a)
In cryogenic air separation air is separated into its constituents and only by knowing the
constituent ratio of the main air product in a sample of air it is possible to determine the
airflow at the input of the train
QACm = (6a) rmain product
where
bull QACm is the air flow from air compressor of train m (kNm3h)
bull Qure is the total flow of (pure) main air product that originally entered the air
compressor of train m (kNm3h)
bull rmain product is the constituent ratio of the air product in a sample of air For oxygen
this ratio is 209 and for nitrogen this is 780 refer to table 21
Electrical Electronic and Computer Engineering 46
Chapter 4 Organizing and Planning
If there exists an air common header connecting all the trains the main output product may not
necessarily be a result of solely the airflow at that particular trains input since air exchange
between trains does occur and even more so in the case of an air compressor being out of
operation A good approximation would be to average out the total airflow over all the trains
In this case equation (6a) takes on the form of equation (6b)
(
= 1 ~QPureQ (6b)
ACm t- m nrmain product Jm=
The main product is rarely 100 pure there is to some acceptable extent impurities present
in the substance as well Secondly this product is produced with some amount of loss within
the air separation process this loss is quantified in terms the recovery efficiency Thus to
obtain the total flow of the pure product that originally entered at the air compressor side
Purity QPure =Q x main productm (7)
m PCm TJ recm
where
bull Qpcm is the flow rate of the main product from product compressor of train m
bull Puritymain productm is the purity of the primary output product of train m
bull TJrecm is the recovery efficiency of which the air separation process recovers the
primary constituent of air that originally entered the process
It is now possible to compute the air flow however the air discharge pressure is still needed
for computation of the compressor power consumption There is a definite relationship
between the air discharge pressure and air flow and this relationship is defined by the system
characteristic The system needs a specific discharge pressure at a certain flow rate from the
Electrical Electronic and Computer Engineering 47
Chapter 4 Organizing and Planning
air compressor and the relationship between these two parameters in the normal operating
region of the compressor may be approximated quite accurately by a linear model as shown
in figure 47
Thus discharge pressure as a function of air flow will be as shown in equation (8)
out h Q (8)PACm = m +gm ACm
where hm and gm are the constants for train m and may be determined by means of linear
regression
Compressor Surge line characteristic at
different modes of operation
System curve
Linear approximation
Flow
Figure 47 Linear approximation of system curve
Electrical Electronic and Computer Engineering 48
Chapter 4 Organizing and Planning
Although cryogenic air separation trains may have been designed in exactly the same manner
it is a fact that over time they drift in their parameter commonalities and by applying modeling
parameters in one train to other trains as well would ultimately result in high inaccuracy of the
overall plant model Thus certain parameters of the model should be done empirically train by
train Empirical modeling should be sufficient only for all the critical elements of each train
which include
bull electromechanical efficiency of each compressor motor
bull isothermal efficiency of the air and product compressor
bull recovery efficiency of the air separation process
Determination of the electromechanical efficiencies should be enabled through employment of
the correct maintenance strategy as will be discussed in the next chapter If there is no initial
data available concerning the current state of the motor an assumption should be made at first
The recovery lrecm is a symptom of the current state the ASU thus essentially modeling this
system it is determined by taking the average over a sufficient sample period
The isothermal efficiency of the compressor is a function of the gas flow pressure and
intercooler temperature The pressure range in which these compressors are suppose to operate
in is usually relatively small and the empiric modeling of the isothermal efficiency may be
approximated quite accurately by a linear model
out
n - xQ +b x Pxm + xT +d (9)IIxm - axm Xnl xtm -- cxm Ie xm Pinx
where a bull b bull e bull and d bull are constants of compressor type x of train m and arex m x m x m x m
determined by means of linear regression Multiple variable linear regression techniques like
Electrical Electronic and Computer Engineering 49
Chapter 4 Organizing and Planning
for example that described by Makridakis et al [29] should be utilized in determining the
constants If there is no empirical data available for the compressor motors as yet the motor
efficiency and the isothermal efficiency of the compressor may be lumped together (ie
making it one system) and this overall efficiency is then empirically modeled as in equation
(9) this means that the model then (equation 9) encapsulates the compressor efficiency as well
as the motor efficiency
Substitution of these equations leads to the final energy conversion model stated in equation
(10) For a discussion on the application and verification of the abovementioned energy
conversion model the reader is encouraged to refer to the case study presented in the
appendix
h + gm xPUritymainproducmJj[tQ xuritYmain proliuctm Jx~ xln__k_(~Q _m nrmain product =1 PCm Teem
nrmain producl ~ mel ~
reem K
[ m
PACrn
______________~--__-shy__~__________--~--------~) (10)
pp1an t m=J
ACm x [aAcm xQACm +bACm XP~~m + CACm X~C +dAcmJ PinIIC
kxQPCm X~C Xln[ P~m J + PK~
PCm x (apcm x QpCm +bpcm X pPm +CKm X~C +dpcmJ tnPC
443 Energy systems maintenance
There is a definite relationship between maintenance management and energy management
and in most cases one would find that by initiating an action in one would have a definite
effect on the other In fact Turner [16] has gone one step further and expressed the need for
energy systems maintenance Energy systems maintenance is defined as the maintenance of all
systems that use or affect the use of energy
Formulation of an energy systems maintenance life-plan as well as the management thereof is
the responsibility of the energy manager and later on it will be explained on how to assemble
such a plan The output of this maintenance effort is a recommendation and it is up to the
Electrical Electronic and Computer Engineering 50
Chapter 4 Organizing and Planning
energy manager to assist maintenance managers in adopting an energy systems maintenance
component into their life pans which would enable them to consider such a recommendation
In formulating an energy systems maintenance strategy the energy manager first has to
consider and understand at which point it is appropriate to initiate a suitable maintenance
action on relevant equipment To aid explanation to this question refer to figure 48 from an
energy management point of view this system experiences a functional failure A functional
failure is defined by Campbell [30] as the inability of a physical asset to deliver its expected
level of performance In terms of energy management this expected level of performance is
given in the form of an energy norm or standard The expected level of performance thus
defines what can be considered a failure
Engineering standard 1-----------__ ----------------------shy
Flaw in compressed air pipe
Leakage of compressed air
Energy management standard
General maintenance standard Minor leakage
Production standard Major leakage
Time
Figure 48 Functional failures and performance standards
Different departments within the plant (engineering maintenance production) may differ in
asset performance requirements and thus giving rise to the different standards In this example
the flaw in the compressed air pipe causes a leakage of compressed air leading to a decrease in
energy efficiency and money could be saved by initiating a maintenance action sooner than as
scheduled by maintenance department
Electrical Electronic and Computer Engineering 51
Chapter 4 Organizing and Planning
The energy norm or standard thus defines the not only what should be considered a failure but
also the amount of maintenance needed to preserve this level of performance
The difference in standards frequently creates conflict between various departments and when
initiating an energy cost saving maintenance action the energy manager should first reach a
compromise with the different departments For example the electrical maintenance
department of one plant reported high maintenance costs on the oxygen compressor motors
Maintenance department reported that the motors were at the end of their life-cycle and
blamed the more frequent maintenance intervals as the main cause of the rising cost An
energy audit also revealed that the motors lost an average of 9 electromechanical efficiency
from their initial value which gave rise to increased energy cost as well
Considering these two factors an oxygen replacement project was proposed with immediate
commencement Production department however rejected the proposal because the plant
which already operated at full capacity would suffer significant production losses during the
replacement action and proposed that the project should be postponed to a year from then
when an extra oxygen train currently being constructed at that time is in full operation to
which the parties agreed upon and thus effectively reaching a compromise
4431 Establishing an energy systems maintenance life plan
Because plant maintenance has such a significant effect on energy efficiency the energy
manager has to establish an energy systems maintenance life plan aimed at managing
electricity cost that would supplement existing maintenance efforts on the plant
Energy systems maintenance on only those systems that normally have a major impact on the
energy consumption of the train will now be discussed they are the air and product
compressors the air and product compressor motors and the ASU
Electrical Electronic and Computer Engineering 52
Chapter 4 Organizing and Planning
4432 Energy systems maintenance on compressors
Some of the major aspects influencing the energy efficiency of a compressor are the following
(Talbott [25])
bull Wear of mechanical parts
bull Component fouling
bull Contamination with impure substances
bull Inadequate or dirty lubricants
Wear of mechanical parts changes the characteristics of the compressor and ultimately leads to
decreased efficiency Mechanical wear also result from destructive effects dirt particles have
and it is crucial that filtration be kept effective and all inlet piping be kept clean
Fouling changes the flow and pressure relationship of the compressor and thus changing the
characteristic of the original design Even if a good filter is provided fouling is inevitable and
an obvious effect is the restriction of intercooler passages this not only causes poor heat
transfer between the coolant and gas but also leads to an increased pressure drop over the
intercooler resulting in reduced performance (lower efficiency)
Lubricated compressors depend upon oil for both friction reduction and sealing It is obvious
then that if the oil has to be contaminated or corrosive it would be destructive of both
efficiency and valuable capital equipment
4433 Energy systems maintenance on motors
The aim of energy systems maintenance on motors is to improve and preserve the motors
energy efficiency
The great majority of induction motors are used to drive pumps fans blowers and
Electrical Electronic and Computer Engineering 53
Chapter 4 Organizing and Planning
compressors attempting to increase the efficiency of these motors may well result in reduced
motor internal losses but this doesnt necessarily mean reduced input power unlike the case
for synchronous motors as also motivated by Htsui et al [31] Induction motors with a higher
efficiency normally run at a higher speed (lower slip) which ultimately leads to increased
compressor load (also refer to Sen [32]) Figure 49 shows a graphical representation of this
situation
bull The fan laws
Suppose that the existing motor (motor 1) is substituted by a new motor (motor 2) of higher
efficiency which inherently has a smaller full load slip motor 1 operated at operating point 1
(OP 1) and motor 2 now has another operating point (OP 2) The power curve of the new
motor intersects the system curve (compressor load) at a higher load speed resulting in the
compressor requiring more shaft power
Pz +---------------------~r-------~~~~-------------
sbaftspeed
Figure 49 Partial power curves of the existing motor (motor 1) and the new motor (motor 2)
as well as that of the compressor load illustrating the implication of installing a higher
efficiency motor than is currently in operation
Electrical Electronic and Computer Engineering 54
Chapter 4 Organizing and Planning
The reason for the load increasing with increased shaft speed is because of the compressor
conforming to the relationships expressed by the fan laws The following relationships are a
statement of the fan laws and are listed by Brown [33] The fan laws also apply to blowers
fans and pumps and the theory developed here may also be applied to induction motors driving
either one of these mechanical devices
Qan (11)
(12)
(13)
where
bull n is the shaft rotational speed (rpm)
bull Q is the gas flow (kNm3h)
bull P is the discharge pressure of the gas (kPa)
bull P is the power requirement of the compressor (MW)
Thus the gas flow is proportional to the shaft speed the discharge pressure is proportional to
the square of the shaft speed and lastly the compressor power requirement is proportional to
the cube of the shaft speed Equating the above relationships gives the following as stated by
Salisbury [26] and Baumeister et al [28]
(14)Q ~ Q(~J
p ~ p(~J (15)
(16)p~p(~J
Electrical Electronic and Computer Engineering 55
Chapter 4 Organizing and Planning
Were the 1 and 2 subscripts refer to the initial and new conditions respectively Thus by
knowing the compressor performance at one speed one may predict its performance at another
speed
Figure 410 shows a typical compressor characteristic curve as well as the characteristic at
other speeds other than the nominal
Surge line
Compressor characteristic at various speeds
Flow
Figure 410 Compressor characteristic curve at various shaft speeds
bull Energy efficiency analysis
At this stage it becomes quite obvious that there are two contradicting factors presenting
themselves if a higher efficiency motor is installed the motor internal losses have been
reduced but at the same time the motor is most likely to run at a lower slip leading to
increased shaft power demand
Electrical Electronic and Computer Engineering 56
Chapter 4 Organizing and Planning
Thus it becomes clear that an action aimed at reducing electricity cost by improving the motor
efficiency may not be as simple and the energy manager or person in charge should have a
means for quantifying the actual feasibility such an action would have
Installing a new motor for the aim of reducing electricity cost should only become an option
when at least the following statement is true
(17)
were Fnl and Fnz are the input power to motor 1 (current motor) and motor 2 (new motor)
respectively After substitution equation (17) becomes
ut 2 lt utI (18) 17mZx17D2 17m l x 17D1
where
bull utl and u12 are respectively the output power of the current and the new motor
at normal operating conditions
bull 17m and 17m2 are respectively the electromechanical efficiency of each motor
bull 17D1 and 17D2 are respectively the efficiency of the device (compressor blower fan
etc) at the operating point of motor 1 and that of motor 2
What is now needed is an indicator which would inform the energy manager on whether a
new high efficiency motor would consume less power than the existing one This indicator is
defined here as the threshold efficiency which is the efficiency the new motor should at least
have to be the more feasible option The inequality expressed in (18) can be rearranged to give
the following
17m2 gt 17ml (UI2 Jx( 17D1 J (19)ull 17D2
Electrical Electronic and Computer Engineering 57
Chapter 4 Organizing and Planning
The fan law implies that in changing the shaft speed of the compressor its efficiency stays
constant Le 17D2 = 1701 and by inserting equation (16) in (19) equation (20) is obtained
(20)
The operating speed of each motor is where the compressor load curve intersects each motors
power curve thus and may only be determined by actually plotting the motor curves nl n2
with that of the compressor load For the energy engineer to make a clear decision on whether
to upgrade motor efficiency it becomes clear that there should be a maintenance strategy in
place that result in the assessment of the motors current condition And as stated earlier this
assessment is made in terms of the motor efficiency as well as the power or toque curve of the
motor This assessment is the responsibility of the rewinder or the person responsible for the
refurbishment of the motor
The operating speed of the new proposed motor can be expressed in terms of its full load
speed and other known variables For low slip values the power curve may be approximated
by a linear relationship as shown in figure 411 which leads to equation (21)
(21)
where
bull subscript 2 refers to the new proposed motor
bull P2 is the output power (MW)
bull PFL2 is the rated full load shaft power (MW)
bull ns is the synchronous speed (rpm)
bull nFL2 is the rated full load speed (rpm)
Electrical Electronic and Computer Engineering 58
Chapter 4 Organizing and Planning
Motor power System Linear curve curve approximation
shaft speed
Fu1110ad
speed (nr)
Operating speed
(n)
Synchronous speed (ns)
Figure 411 Approximating the power curve with a linear model at low slip values
Applying the fan law by substituting equation (16) into (21) and rearranging to solve for n2
gives the following
(22)
This is a cubic equation and can be solved by applying Cardans solution [34] From Cardans
solution the equation has one real root and gives the approximate load speed the proposed new
motor will operate at
Electrical Electronic and Computer Engineering 59
Chapter 4 Organizing and Planning
Substituting (23) into inequality (20) gives the requirement in terms of its full load speed and
efficiency the new motor should conform to for it to be a more energy efficient option
bull Case study
Suppose the existing motor of figure 49 is considered for replacement This is a four-pole
137MW machine it is fifteen years old and have been rewound three times during its
productive life The decision to do a feasibility study comes after assessment of its current
condition which is detailed in table 46
Table 46 Current motor parameter values
Substituting these parameter values into (24) results in the graph depicted in figure 412 This
curve is basically a motor selection curve for selecting a new 4 pole 137 MW induction motor
as it houses the criteria for the proposed new compressor motor being more energy efficient
than the existing one Now suppose there are three suppliers of these motors as detailed in
table 47
Table 47 Three suppliers of a 4-pole 137MW induction motor with their respective ratings
I I
I Supplier Motor efficiency Motor rated full load speed 1 970 1492
I 2 960 1490 I 3 975 1496 I
Electrical Electronic and Computer Engineering 60
Chapter 4 Organizing and Planning
980 ltI~--~-------~---------lt-~------------------------------- Supplier Cbull975
Supplier A bull 970
tI 965 CI
~ 960 shy bullSupplier B Threshold line CI 955 -shy
CI ~ 95()-=a 945 ~
940
935
930 +-----------------------------------------1
14880 14900 14920 14940 14960 14980 15000
Full load speed (rpm)
Figure 412 Threshold efficiency proposed new motor should adhere to as a function of its
full load speed
As can be seen from the graph all three motors will in each case improve the energy
efficiency of the current compression system for they have ratings that enable them to be
above the threshold line
Now that we know that energy efficiency will be improved regardless of what motor is
selected the next step would be to quantify the energy saving in each case and obviously the
motor with the largest energy saving would ultimately be the most feasible option from an
energy managers point of view
Pinl and Pin2 have been defined in (8) and taking the ratio of these gives
or
Electrical Electronic and Computer Engineering 61
Chapter 4 Organizing and Planning
(25)
thus
(26)Power saving = pbullbull - P2 p+ - [ ~ )( J1 Substituting n2 of equation (23) into (26) gives the approximate power saving in terms of the
known quantities
Power saving =
Jj (27)
The results of each options power saving are listed in table 48
Table 48 Power saving for the different motors from the three suppliers
I Supplier Power saving I A 410kW
I B 260kW
I C 370kW
The motor from supplier A will be the most feasible option in terms of energy efficiency
although it doesnt have the highest efficiency
A condition-based maintenance strategy for the induction motors should be employed in
which the condition of the current motor is assessed either on an appropriate time base or
Electrical Electronic and Computer Engineering 62
Chapter 4 Organizing and Planning
when an opportunity arises to permit this The end-result of the motor assessment is the
threshold line which will be used as a reference for comparing the feasibilities of different
energy efficiency improvement alternatives
It is recommended that condition-based maintenance of this type only be done on the larger
motors where significant power savings are attainable which could justify the effort time and
cost involved in realizing this maintenance effort
bull An energy management tool for induction motor renewalreplacement
If an induction motor fails or experiences a functional failure is it better to refurbish it or
replace it with a high efficiency motor In most of the immediate circumstances
refurbishment is the more feasible option driven by the fact that it is approximately one fifth
the cost of buying a new motor On the other hand refurbishment in most cases refers to
rewinding and motors that have been rewound tend to be less efficient as also expressed by
Campbell [35]
By utilizing the maintenance strategy as presented in the foregoing section the energy
manager is in a position to make a fairly good decision between replacement and renewal
Suppose that the previously referred to 137 MW induction motors condition has been
assessed after each rewind and the threshold line after each assessment have been determined
as shown in figure 413
From the graph it can be seen that the threshold line changed with time and after each
assessment replacement seems to become a more and more attractive option
Electrical Electronic and Computer Engineering 63
96000
Chapter 4 Organizing and Planning
990
Supplier C InlYampI 98000
Supplier A shy lSI rewind Col 970
-bull shy-= ~ 2 rewind
Col Supp rB
IS lie bull~ -950 3rd rewindC -IS Q 940 --= -930==~
920
910
1486 1488 1490 1492 1494 1496 1498 1500
Fllll load speed (rpm)
Figure 413 Threshold lines of motor after every rewind
In conclusion the energy manager may recommend rewinding if the threshold line is near (just
above or below) that of the full load specifications of available motors and should recommend
replacement when the latter is sufficiently above the threshold line Lastly justifying motor
replacement will be a function of reduced energy costs as well as the projected maintenance
cost reduction
4434 Energy systems maintenance on distillation colnmns
The distillation column is made up out of distillation trays The basic function of these trays is
to enable contact of the descending liquid and the rising gas under the most favorable
conditions The mere presence of the trays provides the rising gas with a certain resistance
resulting in a pressure drop This pressure drop must be as small as possible for it has a
significant impact on the energy efficiency of the train Needless to say distillation trays have
a major impact on the energy consumption of the train as also pointed out by Biddulph [8]
Various technologies have been developed for reducing this pressure drop to the minimum of
Electrical Electronic and Computer Engineering 64
Chapter 4 Organizing and Planning
which distillation packing is the more recent and compared to the conventional sieve trays
are the more efficient as well (refer to chapter 2)
Deterioration of distillation trays are inevitable and possible damage may cause a decrease in
main product recovery efficiency and sometimes also increased pressure drop which
ultimately results in the train being less energy efficient
Maintenance on distillation trays are sometimes limited because of the large production losses
the plant would suffer during replacement but it is up to the energy manager to assess the loss
in energy expenditure and do feasibility studies on the relevant alternatives that would enable
upgrading of the columns energy efficiency
4435 Energy systems maintenance life plan
Table 49 shows an energy systems maintenance life plan based on the foregoing information
The condition of each major system is assessed in the control phase of the energy management
program and based on this assessment the energy manager is able to inform andor make
informed recommendations to the relevant maintenance department in case of the occurrence
of deviations
Electrical Electronic and Computer Engineering 65
Chapter 4 Organizing and Planning
Table 49 Energy systems life plan for the critical systems on the cryogenic air separation
plant
Compressor Motors
CBM off opportunity
based Contractor
(most likely)
motor
of motor condition
Compressor CBM on monthly Energy
manager
Inform relevant maintenance
dept on deviation and impact it has
Corrective action will be
enabled by relevant
maintenance dept
Distillation columns
CBM on monthly Energy
manager
Inform relevant maintenance
dept on deviation and impact it has
Corrective action will be
enabled by relevant
maintenance dept
444 The energy management plan
The energy management plan basically consists out of the long-range plan and the building
blocks that make up this plan which are the following
bull Primary objective
bull Specific objectives
bull Short term plan
bull Decisions surrounding project prioritization
bull Short term tactics
Electrical Electronic and Computer Engineering 66
Chapter 4 Organizing and Planning
Primary objectives are stated in the energy policy Long-range plans are the means for
achieving these objectives Thus long-range plans are the stepping-stones towards fulfilling
the vision posed by the energy policy A primary objective on its turn is a composition of
specific objectives and in achieving these objectives energy projects need to identified and
implemented Potential energy projects were already identified in the audit process and these
projects now need to be allocated to the relevant specific objectives and also prioritized
Normally mUltiple projects are required in fulfillment of a specific objective and
consequently there may be numerous projects listed under the short-term plan The energy
manager needs to assign priority to each project in order to ensure that the planned sequence
of events are structured in an optimally efficient manner
The short-term plan entails the decision-making with regard to which projects to implement
when for the next financial year The end result of the long-term plan ultimately depends on
the implementation of the short-term plans The short-term plan requires short-term tactics in
order to realize These short-term tactics are the actions and their timing that is needed to carry
out the short term plan
As an illustrative example consider the division-wide energy policy of Sasol presented in
section 43 [21]
bull Primary objective of the division-wide energy policy ofSa sol
To manage the SasollElectricity Supply Industry interface so as to minimize the total
cost of energy for the Sasol group of companies Further to this to promote energy
efficiency and reward energy management success by decentralizing accountability for
electricity costs and by aligning internal electricity tariff structures with the Eskom
marginal rate [21]
The underlined phrase is a primary objective of the energy policy and in order to realize the
decentralization of electricity cost accountability a few specific objectives first need to be
realized one such objective is stated in the list of specific objectives in the energy policy
Electrical Electronic and Computer Engineering 67
Chapter 4 Organizing and Planning
bull A specific objective ofthe energy policy
Develop and maintain the electricity measurement system within the group of
companies
A specific objective is realized through the implementation of a short term plan or
combination of short-term plans and for above mentioned specific objective a short term plan
is given in the next paragraph
bull Short term plan
o Upgrade existing measurement system on those plants that already have this
system in place
o Install measurement system on all energy intensive plants
o Establish a maintenance strategy for measurement system
o Make data freely accessible and
Actions and their timing are the tactics needed to carry out the short term plan and for the
underlined short term plan the short term tactics are as stated in the following paragraph
bull Short term tactics
o Finalize decisions surrounding data logger selection January 2000
o Order PTs and CTs for the measurement system - January 2000
o Install network connection in substations March 2000
o Install and commission data logger - May 2000
445 Measurement and control indicators
Now that there is an energy management program in place the energy manager has to decide
on how the progress and results of this program will be assessed Key performance indicators
have to be defined and energy standards need to be determined In the control function of this
Electrical Electronic and Computer Engineering 68
Chapter 4 Organizing and Planning
model the energy engineer will assess these KPIs and decide upon appropriate corrective
actions
There is one KPI that encapsulates the outcome of the whole energy management effort and
that is the energy cost per primary product output (RlkNm3) This is an important KPI as it is a
global indicator and by trending it over time the energy engineer is in a position to quantify
the impact of his energy management program however this doesnt mean that it is the only
one that should be monitored there need to be other indicators defined as well lower level
indicators that are more specific and are able to identify critical component inefficiencies
Critical system components are defined here as only that system components that have a major
impact on the energy consumption of the plant These system components include the
compressors the compressor motors and the air separation unit
The lower level KPIs should 1) indicate whether there has been a drift in system
characteristics and also 2) whether the system operated above or below expectation during the
past month It should be noted that only the means for determining the KPIs are presented
here and they will only be applied in the control function the energy manager has to fulfill as
detailed later on
Thus the following parameters are the important ones and need to be monitored
bull Electromechanical efficiency of the air and product compressor motors
bull Isothermal efficiency of each compressor
bull Recovery efficiency of each train
bull Specific energy of the plant (kWlkNm3 of main product)
With these parameters as the basis a key performance indicator will now be derived for each
Electrical Electronic and Computer Engineering 69
Chapter 4 Organizing and Planning
4451 KPI for determining the state of the compressor motor
The compressor motor efficiency has a significant influence on the overall efficiency of the
train therefore a key process indicator need to be defined for the compressor motors and this
KPI should comment on the degradation in motor electromechanical efficiency
Obviously it wouldnt make sense assessing this KPI each month and should therefore only
be assessed after each time the current condition of the motor has been evaluated
c llACmKPI (28)ACmaor = -i-
llACrn
where
bull m is the train number
bull ll~crn is the design efficiency of the motor ie the efficiency at the time when it
was initially installed
bull ll~crn is the current efficiency of the air compressor motor
The KPI of the product compressor motor takes on a similar form
(29)
where
bull KPlpcmotorrefers to the extent of deterioration within the air compressor motor
bull TJ~Cm is the design efficiency of the motor of train m ie the efficiency at the time
when it was originally installed
bull TJCrn is the current efficiency of the product compressor motor of train m
Electrical Electronic and Computer Engineering 70
Chapter 4 Organizing and Planning
4452 KPI for determining the state of the air and product compressor
(30)
where
bull KPlxm is an indicator that refers to how well compressor type x of train m
performed
bull TJheoretical is the theoretical isothermal efficiency of compressor type x of train m X In
bull TJcfual is the actual isothermal efficiency of compressor type x of train m ltm
Equation (30) then takes on the form of equation (31)
out J103x 10-4 xQ xT xln Pxmxm IC In( Pxbullm
~ctual xTJxm KPlxm out (31)
xQ +b x Pxm + xT +dax m x m x m -- ex m IC x m pin xm
where ~ctual is the actual measured MW power consumption at that specific flow and pressure
Again if the motor efficiency has not been determined yet it should be lumped with the
isothermal efficiency of the relevant compressor in this case equation (4) should be modified
by simply removing the electromechanical efficiency (TJxbullm ) of the motor
4453 KPI for determining the state of the air separation unit
actual
KPI = TJrecm (32)ASU m TJemperical
recm
where
Electrical Electronic and Computer Engineering 71
Chapter 4 Organizing and Planning
bull KPI is the indicator for how well the ASU operated during the sample time ASu bull m
bull 1Jemperical is the empirical recovery efficiency that has been determined for the ASU rectm
of train m
bull 1J~~1 is the actual recovery efficiency of the ASU of train m
4454 KPI for determining the overall efficiency of the plant
Except for the global energy cost KPI there should also be a KPI that measures the overall
energy efficiency of the plant This indicator should assist the energy manager in determining
the following
bull If there were any deviations in any system component of any train and also
quantify the impact of this on the overall efficiency of the plant
bull The impact of abnormal plant operation for example due to routine maintenance
on some trains or unexpected breakdown on the overall plant energy efficiency
bull Whether the plant operated above or below expectation
I ~heoretlCalm 1 [
m=l (33)
where
bull KPleff is the in indicator that measures the total plant energy efficiency (kWhlNm3
ofmain product)
bull Poctualm is the total power consumption of train m (MW)
bull Qm is the total main product flow at the output of train m (kNm3h)
Electrical Electronic and Computer Engineering 72
Chapter 4 Organizing and Planning
This indicator provides the energy manager with a summary with reference to the state of
energy efficiency of the whole plant Caution should be taken that this is an overall indicator
and may not be as sensitive to an inefficiency in a specific system component within a train
and by only looking at this indicator may give the energy manager a false idea of the actual
state of the plant Thus this indicator should be viewed in conjunction with the lower level
indicators
45 CONCLUSION
In this chapter energy management organizing and planning was discussed Through
organizing the energy management program is given definition and structure It mainly
involves identification and classification of required activities and the grouping of these
activities in a structured and meaningful way
Planning involves the setting up the energy policy and installing the energy policy strategy
The energy policy strategy has five components human resource deployment current
situation evaluation energy systems maintenance the energy management plan as well as
establishment of measurement and control indicators
Human resource deployment involves appointing a dedicated person charged with driving the
energy management program as well as giving this person access to other human resources
like administrative technical etc
Current situation evaluation is a critical step in the energy management program and the
outcome of the program to a large extent depends on how well and thorough the energy audit
was done
Plant maintenance has a definite and significant impact on energy efficiency and in this
chapter the need for an energy systems maintenance life plan was expressed This life plan is
Electrical Electronic and Computer Engineering 73
Chapter 4 Organizing and Planning
effectively the energy managers contribution to the overall maintenance effort on the plant
and aims to improve energy efficiency
The energy management plan is a structured and well-formulated set of plans and tactics that
should be followed in order to ultimately achieve the primary objectives as stipulated in the
energy policy It involves long-term and short-term planning as well as setting up tactics for
the means of achieving the short-term objectives
Key performance indicators (KPIs) were defined for the means of quantifying plant
performance in terms in energy efficiency and these find their application in the managerial
function of controlling which will be discussed in chapter 5
Electrical Electronic and Computer Engineering 74
Chapter 5 Leading and Controlling
CHAPTERS LEADING AND CONTROLLING
51 LEADING
The main purpose of leading is to harmonize individual and organizational objectives People
do not work in isolation rather they work in groups toward the achievement of personal and
enterprise objectives these objectives are not always in harmony and in fulfilling the function
of leading the manager aims to align objectives of the individual with that of the enterprise
Koontz et al [14] defines the managerial function of leading as the process of influencing
people so that they will strive willingly and enthusiastically toward the achievement of
organizational goals In order for people to willingly strive for such a goal they would need
some form of motivation to do so There exists various means for stimulating motivation in
people (refer to Fukuda [36] and Jordaan et al [37]) and one way of doing so is through
awareness
This awareness is encouraged by doing the following
bull Disclosing energy KPIs and also explaining possible abnormal deviations to
employees
bull The impact certain practices of relevant departments within the plants organization
have on the plants energy efficiency and ultimately energy cost For example this
may include energy inefficient maintenance strategies faulty equipment or even
inefficient production schedules
Turner [16] also lists the following relevant strategies for improved awareness
bull Providing relevant employees with energy management best practices which are
practical and relevant to their working environment within the plants organization
bull Providing energy conservation opportunity checklists to plant operators
maintenance personnel supervisors and engineers
Electrical Electronic and Computer Engineering 75
Chapter 5 Leading and Controlling
Another motivational tool is recognition The energy manager should recognize the energy
management efforts of employees and also show them the impact their efforts had during the
past month
Lastly Turner [16] also states that competition may lead to improved performance Fostering
reasonable competition between relevant departments in the plants organization may inspire
employees to work harder in achieving their goals
52 CONTROLING
Controlling is the measurement and correction of performance in order to ensure that
objectives and the plans devised in attaining them are being accomplished Koontz [14]
defines three basic steps for control 1) establishing standards 2) measuring performance
against these standards and 3) correcting undesired deviations from standards and plans
These steps will now each be defined from an energy management perspective
53 ESTABLISHING ENERGY STANDARDSINORMS
Previously energy management key process indicators were defined for the cryogenic air
separation plant those indicators are now utilized in the control function The standard for
each KPI is the theoretical quantity of the measured parameter ie the denominator of each
KPI as defined in equations (31) (32) and (33) of chapter 4 is the theoretical system
performance and also the standard to which actual system performance is compared KPIs for
the compressor motors are the exception (equations (28) and (29) of chapter 4) in that the
denominator in each is based on the original electromechanical efficiency specification
54 PERFORMANCE MEASUREMENT
The KPIs should be trended over time and significant deviations from expected performance
must be noted This must be done on a monthly basis except for the motor deterioration
indicators which may be assessed according that as stipulated by the maintenance strategy
Electrical Electronic and Computer Engineering 76
Chapter 5 Leading and Controlling
To illustrate performance measurement with a practical example consider the month-end
evaluation of one train of the seven-train oxygen plant at Sasol Secunda This specific train
boasts the characteristics listed in table 51
Table 51 Characteristic parameters of a train used in its performance measurements
Parameter Value KPI equation (Ch 4) 1 Motors
11 Air compressor motor 28 i
1]ACm 982
1]~cm 930
12 Product compressor motor 29 i
1]PCm 971
1]cm 910
2 Compressors 21 Air compressor 31
a 00009366 b -00574043 c 00021501 d 07272151
22 OXYfen compressor 31 a 00044099 b 00090275 c 00030923 d -09017176
3 ASU 32 1]emperical
recm 9541
What follows will be performance measurement by means of KPI trending after which
analysis of each will continue in the next section
Results for the trains global efficiency indicator is shown in figure 51
Electrical Electronic and Computer Engineering 77
Chapter 5 Leading and Controlling
11 ~---------------------------------------------------~-----~
105
095
Trendline
09
085 +--------------------------r---------r--------~----___------__--
OJ-May OS-May 09-May 13-May 17-May 21-May 25-May 29-May
Time
Figure 51 KPI trend for the global efficiency indicator
As implied earlier the KPIs characterizing each motors state are not trended over time
instead its given as a single value and are listed in table 52
Table 52 KPI values for the air and oxygen compressor motors
Compressor motor type KPlvaJue Air 0949 Oxygen 0937
Figure 52 shows KPI trending for the air compressor
Electrical Electronic and Computer Engineering 78
Chapter 5 Leading and Controlling
12
115
11 Trendline
1-1 ~ ~
09 +----L--r-------------------T----T~---__-----
105
1
01-May OS-May 09-May 13-May 17-May 2L-May 25-May 29-May
Time
Figure 52 KPI trending for the air compressor
The KPI trend for the oxygen compressor is shown in figure 53
l~ ----------------------------------- -------------
105 -t----------------------~----~--r--------~-----1
l~T--middot-----middot-~middotmiddotmiddot----middotmiddotmiddotmiddot-------middot--middotmiddotmiddot-middot-------~~-middotmiddotmiddot---middotmiddotmiddotmiddotmiddotmiddot---middotmiddot---1
103 i---middotmiddot-middotmiddotmiddot---middotmiddotmiddotmiddotmiddotmiddotmiddotmiddotmiddotmiddot---middotmiddot-middotmiddot--middotmiddotmiddotmiddotmiddot-middotmiddot----middotmiddotmiddotUrrt---middotmiddotmiddotmiddotmiddot-~-~-shy-+shy
Im~middotmiddot-middotmiddotmiddot~-~middotshy --~middotrftmiddotmiddot-~middot-middotmiddotmiddotmiddot----1rHll~r-middotH-middot-middotm~rlHj~~rJ~--middot---~jtr~~middot-shy
~ 101 hHHt-h1
099 -t-middot~middot--Ur---lmiddotft------middot-+middott-middotmiddotcr-----~---III ~I-----ti----middotmiddot-+---middotmiddotmiddot~~--middotmiddotmiddot------I+-imiddotmiddotmiddotmiddot--+--middotmiddotmiddot--~iH--l
098
097 -t--------~---~-shy -------~--~-~~--~--~~~~~----~-- ----~~
O+-------------~-------------middot-----~-----------~--shy
Ol-May OS-May 09-May 13-May 17-May 21-May 25-May 29-May
Time
Figure 53 KPI trend for the oxygen compressor
Electrical Electronic and Computer Engineering 79
Chapter 5 Leading and Controlling
The KPI trend for the air separation unit (ASU) is shown in figure 54
11 ~------------------------------------------------------------- Trend line
~ 095
~ 09
085
08
075
O1-May 05-May 09-May 13-May 17-May
Time
21-May 25-May 29-May
Figure 54 KPI trend for the ASU
Table 53 shows the average power loss contribution from each of the major systems These
results were obtained by calculating the average power loss defined as the difference between
actual performance and expected performance (Le at KPI equal to unity) during that
particular month
Table 53 System inefficiencies quantified in terms of average power loss
System A verage power loss Air compressor motor 660kW Oxygen compressor motor 400kW
Total lO60kW
Air compressor 630kW Oxygen compressor -70kW Air separation unit (ASU) 430kW
Total 990kW
Grand total 2050kW
Electrical Electronic and Computer Engineering 80
Chapter 5 Leading and Controlling
55 CORRECTIVE ACTION
Now that system performance have assessed the energy manager is now in a position to
manage equipment inefficiencies and determine whether there has been improvement in those
that have been addressed on previous occasions
551 Global efficiency indicator
This KPI should be below one in case of energy efficient train operation but as can be seen
from figure 51 it is mostly above unity implying some form of efficiency loss within the
oxygen train
On 8th May there was a sudden improvement in the global efficiency indicator and the reason
for this will become apparent in the discussion regarding the KPI trend for the air compressor
It is worth noting from the graph that there seem to be a slight trend downwards up to around
27th May were it stayed on or below unity for the rest of the remaining time the reason for this
is that average ambient temperature decreased as the year approached June ultimately leading
to increased train efficiency This trend can also be seen in the air compressor graph of figure
52 and the fact that the ambient temperature has such a favorable effect on train energy
efficiency its actual performance is disguised somewhat and one can expect that the losses
listed in table 53 may even be slightly higher during the summer months
542 Compressor motors
The fact that these two values are below one (refer to table 52) implies that there has been
some degradation in motor efficiencies the air compressor motor is currently about 95 of its
original efficiency and that of the oxygen compressor motor is around 94 Based on this
assessment the energy manager may quantify the cost associated with the respective 5 and
6 degradation in motor efficiencies and is now in a position to manage this energy loss
Electrical Electronic and Computer Engineering 81
Chapter 5 Leading and Controlling
5421 Air compressor motor
All air compressor motors on this plant are rated 37MW and are 2-pole synchronous motors
This air compressor motors KPI is at 0949 (table 52) which equates to an average power
loss of 660 kW The energy cost associated with this loss combined with current maintenance
costs cannot at this stage justify buying a new high-efficiency synchronous motor therefore
other corrective actions should be employed in improving the motors energy efficiency and in
this particular case the following steps will be taken
bull Assessment of partial discharge condition monitoring results and scheduling an
opportunity maintenance action if these results show a degree of partial discharge
bull Schedule an in-situ motor inspection carried out by the OEM in which the state of the
stator and rotor may be determined minor servicing of the motor may be enabled and
recommendations can be made by the OEM
5422 Oxygen compressor motor
All oxygen compressor motors on the plant are 137 MW 4-pole induction machines and for
this particular motor its KPI has been evaluated at 0937 leading to an average power loss of
400 kW (this result takes into account the principles discussed in section 4433 and is based
on the power saving that would result in upgrading it to its original specifications)
For the oxygen compressor motor there is much more potential for a replacement action
because of the relatively high energy loss and the fact that maintenance costs for this motor
has risen quite dramatically over the past two years Considering all the related variables a
payback period of 17 years has been calculated when replacing this motor with a new one
Management rules state that business-case approval will only be given to projects with a
payback period of 15 years or less however KPI monitoring on the other trains revealed that
the majority of oxygen compressor motors are in a worse state than the motor from this
particular train and by consolidating the project (ie recommending replacement of all motors
at once instead of just the one) the payback period was calculated at just below 15 years
Electrical Electronic and Computer Engineering 82
Chapter 5 Leading and Controlling
543 Air compressor
On 8th May the actual compressor performance was significantly above that expected (refer to
figure 52) the reason for this being that demand at that time required high product flow at
high purity and auxiliary air compressors were put online to supplement this demand the
auxiliary air compressors are unaccounted for in the model which ultimately manifests in
exceptional compressor performance
Although air compressor performance did improve as the month progressed (gradual decrease
in ambient temperature) for the majority of operational time it remained below expected
performance This under-performance resulted in an average power loss of 630 kW (table 53)
and upon further investigation it was found that routine maintenance was done quite a long
way back and given the poor air quality at Sasol Secunda a significant amount of compressor
fouling was inevitable Production requirements from production department and low priority
assignment from maintenance department resulted in these irregular and mostly delayed
maintenance intervals A proper corrective action from the energy manager in this case would
be to facilitate a compromise between these two departments by ensuring that consensus have
been reached on the scheduling of this maintenance action and also that this scheduling leads
to increased energy efficiency
544 Oxygen compressor
Figure 53 shows the KPI trend for the oxygen compressor and as can been seen from this
figure the KPI stayed above unity for the majority of time which implies good compressor
operation This is also manifested in the average power loss for this compressor which has
been calculated at -70kW as listed in table 53 implying that the oxygen compressor overall
operated slightly above expectation
In general one can expect that the product compressors performance in terms of energy
efficiency should normally be above that of the air compressor because as opposed to the air
compressor it handles a clean and pure gas and is therefore not as susceptible to compressor
Electrical Electronic and Computer Engineering 83
Chapter 5 Leading and Controlling
fouling also in some cases it is less prone to physical damage resulting from large solid
particles
545 Air separation unit
From figure 54 it can be seen that the ASU under-performed for the majority of time
resulting in an average power loss of 430 kW (table 53) Calculations showed that the average
recovery efficiency for this time was 9417 which is slightly less than its empirical value
(9541 ) meaning the air compressor has to make an added effort for compensating this drop
in efficiency
Production department acknowledged the decrease in recovery efficiency and the problem was
identified as damaged distillation trays inside the distillation column Initiating a maintenance
action to repair defective trays in the near future will not be feasible because this would lead to
significant production losses Again the energy manager has to manage this loss to the
minimum The following actions would do just this
bull Keep monitoring the recovery efficiency and initiate a maintenance action as soon
as energy loss could justify this andor determine the production loss when the air
compressor has reached its full capacity and cannot compensate for the recovery
efficiency loss anymore which ever comes first or should it be it the case when
both conditions have been reached
bull Minimize the loss by sharing a portion of this trains load equally between the
more efficient trains at times of low oxygen demand or whenever there is more
efficient spare capacity available
55 CONCLUSION
In this chapter the managerial functions of leading and energy management controlling have
been discussed
Electrical Electronic and Computer Engineering 84
Chapter 5 Leading and Controlling
The managerial function of leading involves leadership motivation and communication
Leadership refers to the ability to lead which involves the process of influencing people so
that they will strive willingly and enthusiastically toward the achievement of energy
management goals Motivation is vital in aligning objectives of the individual with that of the
energy management program and it is important that the energy manager practice effective
motivational techniques Communication is the process by which information can be received
or send It is a vital skill and an essential activity in the energy management program
Controlling is one of the functions the energy manager has to perform in order to ensure
continuity of an effective energy management program
Control is necessary in the energy management program as it brings actual performance in
line with desired performance and based on the discrepancy between these two the energy
manager is in a position to strategize corrective measures It is important for the energy
manager to establish good communication links with the relevant departments within the
plants organization as they are in a position to provide information relevant in the control
phase and are also the stakeholders that need convincing before buying into corrective action
strategies
Electrical Electronic and Computer Engineering 85
Chapter 6 Conclusions and Recommendations
CHAPTER 6 CONCLUSIONS AND RECOMMENDATIONS
61 INTRODUCTION
In chapter 1 the main and specific objectives of this dissertation were listed these objectives
were addressed during the course of this dissertation and will now be properly concluded
through referring to the relevant sections Lastly recommendations with regard to certain
aspects of the energy management system presented in this dissertation will be made followed
by a closing remark
62 CONCLUSIONS ON THE OBJECTIVES
The main objective of this dissertation was to present a framework that would enable effective
management of energy cost and efficiency in cryogenic air separation plants as stated in
section 12
In this dissertation a model has been defined which serves as the framework for the energy
management program at cryogenic air separation plants Within this framework various
functions have been defined and the energy management effort is realized through performing
the activities surrounding each of the respective functions
621 Conclusion on the energy management model
The energy management model was introduced in chapter 3 The model is depicted in figure
35 and entails the transformation process its inputs and outputs and the external environment
as well as the interaction between all of these Inputs are resources like capital skills people
and facilities outputs are the accomplished energy management objectives like improved
preventive maintenance strategies optimized production schedules reduced energy cost and
improved plant design
The external environment accounts for the higher order systems to which the energy
Electrical Electronic and Computer Engineering 86
Chapter 6 Conclusions and Recommendations
management system belongs The transformation process involves the managerial functions of
organizing planning leading and controlling which are the core managerial functions the
energy manager has to perform
622 Conclusion on the energy policy
Theory behind the energy policy was presented in section 43 The energy policy normally
consists out of three components the declaration of commitment mission statement and
specific objectives The energy policy guides or channels thinking it is an expression of the
commitment plant management has towards a continuous and effective energy management
program and sets the scope for energy management effort at plant level
623 Conclusion on the energy policy strategy
The energy policy strategy is the means for accomplishing the vision expressed by the energy
policy and was introduced in section 44 The energy policy strategy thus encapsulates the plan
for changing current reality into future vision This plan is composed of five activities and
they have been identified as the following
bull deployment of human resources
bull current situation evaluation
bull energy systems maintenance
bull energy management planning
bull establishment of measurement and control indicators
Deployment of human resources entails the appointment of a dedicated person in charge of
the plants energy management program as well as enabling this person to utilize other
relevant human resources
Energy systems maintenance refers to maintenance actions regarding the energy efficiency of
Electrical Electronic and Computer Engineering 87
Chapter 6 Conclusions and Recommendations
equipment that use or affect the use of energy
The energy management plan is a structured and well-formulated set of plans and tactics that
should be followed in order to ultimately achieve the primary objectives as stipulated in the
energy policy
Key performance indicators were presented in section 445 and these indicators enable the
energy manager to assess the plants energy efficiency and also to perform the control function
of the energy management program
624 Conclusion on the energy audit process
The energy audit process was discussed in section 442 and consists out of the energy audit
policy and the energy audit strategy The energy audit policy sets the scope for what to audit
whereas the energy audit policy strategy states how this would be done
Auditing is done through assessing relevant plant efficiencies as listed in section 4421 and
for the holistic approach to energy auditing assessment of all these plant efficiencies should
be enabled this assessment is done by means of the audit strategy as detailed in section
4424
625 Conclusion on the mathematical model
Model building blocks with regard to all the major systems were derived in section 4424
The energy conversion model is a very important auditing tool and most of the building blocks
derived in this section also find their application in the control function of the energy
management program (section 52)
Model accuracy is greatly enhanced through empirical modeling of critical plant elements and
Electrical Electronic and Computer Engineering 88
Chapter 6 Conclusions and Recommendations
as stated in chapter 4 it becomes obvious that availability of relevant data is critical in model
building
626 Conclusion on the performance indicators
KPIs (key performance indicators) were derived in section 445 and consist of global
indicators as well as lower level indicators Global indicators quantify the performance of the
plant as a whole and include the energy cost per product produced (RlNm3) and energy
consumption per cumulative product produced (kWhlNm The lower level indicators enable
the energy manager to monitor the energy efficiency of critical components such as the
compressor motors compressors and the distillation columns and are also utilized in the
control function of the energy management program
Each KPI is defined as the ratio between actual and theoretical performance The theoretical
performance effectively defines the energy standard of a particular system which enables the
energy manager to identify system inefficiencies when comparing this to the actual system
performance
627 Conclusion on energy systems maintenance
Energy systems maintenance with regard to cryogenic air separation plants was introduced in
section 443 Energy systems maintenance is the energy managers contribution to the overall
maintenance effort on the plant and is conducted by means of an energy maintenance life plan
The state of each of the respective critical systems is monitored in terms of their energy
efficiency and deviations are acted upon so as to minimize resulting energy losses The critical
systems are the compressors distillation columns and compressor motors and a maintenance
plan for these systems were presented in section 4435
A cryogenic air separation plant normally utilizes a large number of induction motors for
Electrical Electronic and Computer Engineering 89
Chapter 6 Conclusions and Recommendations
driving loads such as blowers pumps and compressors and these motors consequently have a
significant impact on the energy efficiency of the plant As stated in section 4433 energy
systems maintenance on large induction motors driving these loads may not be so simple and
in this section a tool that facilitates decision-making between induction motor replacement and
renewal was presented as well
63 RECOMMENDATIONS
This section contains recommendations with regard to certain aspects of the energy
management system at cryogenic air separation plants
631 Recommendations on setting up the energy management program
First and foremost it is the responsibility of the appointed energy manager to ensure that there
is a formal and well-defined energy policy in place at plant level for the whole energy
management program will be as a direct consequence of this policy and is therefore the
foundation from which all energy management efforts will outflow This policy should be
agreed upon by the relevant stakeholders and approved by top management
For the energy management system to be fully integrated into the plants organizational
structure and to ensure that top management continually gives it the commitment it needs it is
recommended that the outcomes of this program be accounted for in the overall performance
of the plant in order for it to ultimately have an impact on the merits of plant performance
As a direct consequence of the energy policy capita1 will be made available for the energy
management program in the form of a financial budget The energy manager is responsible for
formulating the energy management budget for the next financial year and this budget should
then serve as the cost goal for the energy management program This is a critical resource
input to the program and the energy manager should make sure that optimum use of this
resource is exercised through proper planning and allocation (see section 444)
Electrical Electronic and Computer Engineering 90
Chapter 6 Conclusions and Recommendations
When implementing the energy management program it is important that the appointed person
should first organize a workshop session in which all the relevant departments in the plants
organization are informed about what the proposed energy management effort entails what is
expected of them and how they can benefit from it This is also a good opportunity for the
energy manager to highlight the importance of effective energy management on these energy
intensive plants and to aspire fellow personnel in contributing positively towards energy
management objectives
632 Recommendations regarding existing energy management programs
In the case where there already is an existing energy management program in place the
contents of this dissertation may be used to supplement or adjust current efforts The model
presented in this dissertation aims to foster an effective and value-adding energy management
program without compromising production output streams and will add to the success of
existing energy management efforts
633 Recommendations regarding energy modeling
In section 4424 it becomes obvious that in building the energy conversion model the energy
manager requires a large amount of data of different types ranging from process variables like
temperature pressure and flow to capacity limits on equipment To avoid spending too much
time in model building and ensuring good accuracy the energy manager must enable easy
access to relevant data
Building the energy conversion model may take a relatively long time especially in plants
incorporating multiple trains and most of the time will be consumed by processing relevant
data it is therefore recommended that appropriate computer software be used Spreadsheets
will undoubtedly proof to be most efficient in data processing and it is also recommended that
software capable of multiple variable regression be utilized in modeling certain subsystems
Lastly some model building blocks are utilized in the control function of the energy
Electrical Electronic and Computer Engineering 91
Chapter 6 Conclusions and Recommendations
management system and it would be advisable to link the relevant model outputs to the
respective KPIs in which they are utilized in this manner KPIs are automatically evaluated
whenever plant performance needs to be determined
634 Recommendations regarding the energy manager
Although it is recommended that the energy management system should form part of the
plants organization it doesnt necessarily mean that the person appointed to drive this
program should be stationed at the plant This person may form part of an organization
external to the plants organization like for example an energy management task team that is
charged with managing energy cost on a company-wide level a technical hub or even an
outside company (outsourcing)
It is required that the appointed person should be experienced in general management and
competent in applying financial tools This person should also be technically orientated
typically operating from the base of mechanical electrical or process engineering
635 Recommendations regarding energy management at Sasol Secunda
It is a fact that certain plants within the Sasol complex are generally energy intensive and in
optimizing the energy cost per output product more efficiently it is recommended that
intentional consideration should be given to energy management at plant level Realizing this
energy management effort lies in adopting an efficient managerial structure such as the one
presented in this dissertation and allocating resources to fuel this energy management effort
Driving this managerial effort would be the responsibility of a dedicated energy manager
appointed by the company Lastly Janse van Rensburg [17] also suggested that an energy
manager should be appointed by each of the major energy consumers within the factory and
that a specific plants performance with regard to energy management should have an impact
on the overall performance merit of the plant thereby motivating relevant personnel in
achieving energy management objectives
Electrical Electronic and Computer Engineering 92
Chapter 6 Conclusions and Recommendations
64 FUTURE WORK
Although there are key commonalities between various cryogenic air separation plants they
may still be diverse in design and it is up to the energy manager to derive an energy model
specific to hisher plant this may be done by employing the basic modeling theory presented
in chapter 4
Another point worth mentioning is that of extending the application of the energy model
Utilization of the energy model is basically limited to that of the energy manager but by
modifying the model such that it is able to receive real-time data in order to produce specific
predefined outputs in real-time the proactive element of the energy management effort is
greatly enhanced The model may be added as an extension to the control operators
workstation The control operator is directly responsible for the process control of the plant
and is able to see (in real time) on how certain of hislher actions impact on the energy cost and
efficiency of the plant
Lastly this study was aimed at presenting a generic framework for energy management at
cryogenic air separation plants however it was also the intent of the author to introduce an
energy management framework that may be applied to plants of any nature In the quest for
deriving an energy management program future studies may thus apply the basic philosophy
presented in this study to other types of plants as well
65 CLOSING REMARKS
This dissertation presents a framework for energy management at cryogenic air separation
plants It addresses all the critical managerial aspects required in conducting a successful
energy management program and may be used as a reference or tool in managing electrical
cost and energy efficiency at these energy intensive plants
Because these plants are so energy intensive a relatively small improvement in energy
efficiency may lead to significant energy cost savings Cost savings are not the only benefits
Electrical Electronic and Computer Engineering 93
Chapter 6 Conclusions and Recommendations
resulting from the energy management effort indirect benefits resulting from this include
reduced C02 emissions and conservation of the earths energy resources
From the above it can be seen that energy management at plant level not only makes business
sense but is also the answer to environmental concerns and the ever-increasing energy price
Electrical Electronic and Computer Engineering 94
References
REFERENCES
[1] JC Kotz and P Treichel Chemistry And Chemical Reactivity 3rd edition Harcourt
Brace amp company Orlando USA 1996
[2] AR Smith and J Klosek A review of air separation technologies and their integration
with energy conversion processes Fuel Processing Technology VoL 70 pp115-134
2001
[3] BW Birmingham and CN Smith Cryogenics and the energy crisis Cryogenics Vol
15 Issue 3 pp115-118 1975
[4] Air Liquide Engineering Division Seminar Proceedings France May 1987
[5] Air Liquide Engineering amp large industry training department training handbook Air
Distillation Version 2 Champigny-sur-Mame Cedex France 2001
[6] SC Sarkar Energy savings in cryogenic plants Journal of Energy in Southern
Africa Vol 13 pp139-143 2002
[7] Air Liquide homepage Energy saving results
httpwwwairliquidecom France 2002
[8] MW Biddulph Efficiencies of trays in cryogenic distillation columns Cryogenics
Vol 26 pp24-29 1986
[9] N Gupta BK Srivathsa and KS Misra Energy optimization techniques in Air
Separation Plants Proceeding of International Cryogenic Congress Calcutta India
pp 391-409 1988
[10] A Thuman and DP Metha Handbook ofEnergy Engineering 2nd edition The Fairmont
Press Lilburn USA pp 377 1991
[11] GT Austin Sherves Chemical Industries 5th edition McGraw Hill Inc Singapore pp
115 -128 1984
[12] RH Perry and DW Green Perrys Chemical Engineers Handbook ih edition
McGraw-Hill New York USA pp 4-6 to 4-7 1982
Electrical Electronic and Computer Engineering 95
References
[13] PM Fishbane and S Gasiorowicz Physics for Scientists and Engineers extended 2nd
edition Prentice Hall New Jersey USA pp 438 - 504 1996
[14] HD Koontz C ODonnel H Weihrich Management 8th edition McGraw Hill Inc
Singapore 1984
[15] Oxygen plant financial statements financial results June 2003 and projected July 2004
Sasol Secunda South Africa
[16] WC Turner Energy Management Handbook The Fairmont Press Lilburn USA 1993
[17] WTB Janse van Rensburg Energiebenutting en Energiemodullering in die
Sasolproses Masters Dissertation Potchefstroom University South Africa pp 19-21
1994
[18] VB Ottaviano Energy Management The Fairmont Press Georgia USA pp 12-1 and
72-1 1985
[19] JB Sykes (Editor) The Concise Oxford Dictionary 7th Edition Oxford University
Press Oxford UK p 6501982
[20] Safety Health and Environmental policy of Sasol httpwwwsasolcom South Africa
[21] Materials an Services Management Team (electricity) of Sasol Ltd Cross-functional
and cross-divisional collaboration - The way to industrial electricity cost savings
South Africa ppI-5 2000
[22] A Thuman Handbook Of Energy Audits 5th edition Pretice-Hall New Jersey USA
pp 1-6 1998
[23] FBA Senekal Electricity Demand Management Manual EPR 400 Final Report Centre
for New Electricity Studies University of Pretoria Pretoria RSA pp 71-1011994
[24] GJ Delport Integrated Electricity End-Use Planning in Deep Level Mines Phd Thesis
University of Pretoria Pretoria RSA 1994
[25] EM Talbott Compressed Air Systems A guidebook on energy and cost savings 2nd
edition Fairmont Press New Jersey USA pp 28-30 and 164-167 1993
[26] JK Salisbury Kents Mechanical Engineers Handbook 12th edition John Wiley amp
Sons New York USA pp 1-34 to 1-54 1976
Electrical Electronic and Computer Engineering 96
References
[27] J M Coulson and J F Richardson Coulson amp Richardsons Chemical Engineering
volume 15th edition Butterworth Heinemann Bath Great Britain pp 311-321 1997
[28] T Baumeister and EA Avallone Marks Standard Handbook for Mechanical
Engineers 8th edition McGraw-Hill New York USA pp 14-30 to 14-44 1978
[29] S Makridakis SC Wheelwright et aI Forecasting Methods and Applications 2nd
edition John Wiley amp Sons New York USA pp 246-312 1983
[30] JD Campbell Uptime Strategies for Excellence in Maintenance Management
Productivity press New York USA pp 110 - 112 1995
[31] JS Htsui PJ Otaduy and JD Kueck Efficiency and reliability Assessments of
Retrofitted High-Efficiency Motors Industry Applications Conference Thirtieth lAS
Annual Meeting Conference record of the 1995 IEEE Vol 3 pp2745-2751 1995
[32] PC Sen Principles of Electric Machines and Power Electronics 2nd edition John
Wiley amp Sons New York USA pp207-277 1997
[33] RN Brown Compressors Selection and Sizing 2nd edition Gulf Publishing Company
Houston Texas pp 183-184 1997
[34] KA Stroud Engineering Mathematics 2nd edition Macmillan Great Britain London
pp 18-3 to 18-4 1982
[35] BH Campbell Failed motors Rewind or Replace Industry Applications Magazine
IEEE Vol 3 Issue 1 pp45-50 1997
[36] R Fukuda Managerial Engineering Techniques for improving Quality and
Productivity in the Workplace Productivity Inc Connecticut USA pp20-22 1983
[37] W Jordaan and J Jordaan Man in Context McGraw-Hill Johannesburg RSA pp 618shy
625 1984
Electrical Electronic and Computer Engineering 97
Appendix A
APPENDIX A CASE STUDY BASIC ENERGY CONVERSION MODEL FOR
THE SASOL SECUNDA OXYGEN PLANT
At MODEL INPUTS AND OUTPUTS
Table Al lists the empirical values for the oxygen compressor (refer to equation (9) of chapter
4) Factored into these constants are the respective electromechanical efficiencies of the
oxygen compressor motors
Table AI Oxygen compressor empirical values
Train a b c d 1 0004013 0008215 0002814 i 0820563 2 0004853 0009605 0002887 0960213 i
3 0005213 0004361 0003537 0960292 4 0001955 0005158 0001532 0193396 5 0004018 0008176 0002817 0820563 6 0005104 001082 0002722 0960236 i
7 0003524 0005223 0003751 0960292 ACs 0000871 -0853386 00019996 0067631 I
With reference to equation (8) of chapter 4 the system constants from the air compressor side
are the following h =014 and g 12 which have been assumed the same for all trains
The average recovery efficiencies for each train are as listed in table A2
Table A2 Coldbox average recovery efficiencies
i
i
Train AR 1 9467 2 9055 3 9518 4 9613 5 9528 6 9152 7 9509
Electrical Electronic and Computer Engineering 98
Appendix A
Refer to figure AI for model input and output nametags
Model inputs
bull Management rules Specifies production constraints ie the minimum and maximum
levels of the different commodities involved in the oxygen production process
bull Oxygen demand This input is mainly determined by the gasification and gasshy
reforming processes and will vary in response to their demand
bull Oxygen supply pressure This is the pressure with which oxygen is supplied to the
Gasification and Gas-Reforming plants The supply pressure should be kept between
the constraints as set forth by these two plants
bull Minimum and maximum limits of process outputs and equipment Specifies the
constraints in which the equipment should function in normal operation This includes
o Max amp Min limits of air compressor 37MW amp 28MW (when online)
respectively
o Max amp Min limits of oxygen compressor 137MW amp lOMW (when online)
respectively
o Max amp Min limits ofoxygen purity 994 amp 985 respectively
o Max amp Min limits of Pressure in oxygen common header 3480kPa amp
3350kPa respectively
o Max amp Min limits ofN02 ratio 30 amp 20 respectively
bull HP N21LP 02 ratio Defines the relationship between the HP nitrogen and LP Oxygen
and is assumed a constant value
bull Instrument Air flow The plant also produces instrument air and for the purpose of the
model a constant value is assumed
bull O2 purity The main product purity is assumed constant
bull Other constants This includes the following
o Atmospheric pressure at Secunda (85kPa)
Electrical Electronic and Computer Engineering 99
Appendix A
o 02 pressure at cold box outlet (95kPa)
o Cooling water temperature (20degC)
o A verage recovery efficiencies of each train (AR)
Model outputs
bull Specific energy This is defined as the energy efficiency of the oxygen plant ie the
efficiency with which energy is utilized in producing oxygen It has units of kWhlNm3
Le the amount of kilowatts that should constantly be applied for one hour in order to
produce one normal cubic meter of oxygen
bull New load profiles This includes
o Load profiles of all trains
o Load profile of whole industry (train 1-7)
bull Cost ofenergy Gives the cost of energy based on the tariff structure
For the model simulation the following input values listed in table A3 were used
Table A3 Input values used for model simulation
Parameter held constant Value Oxygen supply pressure 3440kPa
N202 ratio 25 Average recovery (AR) Refer to table C2 Instrument air flow 35 kNmjh Oxygen purity 986 Electricity tariff structure WEPS (2002 Sasol structure)
Electrical Electronic and Computer Engineering 100
Appendix A
Management Rules
O2 demand
O2 supply pressure
Min amp Max limits of
equipment
N202 ratiogt
L-_A_R__gt Instrument Air
(lA)flow
O2 purity
Electricity Tariff
Specific Energygt
Load profilesgt
Cost of Energygt
Figure Al Inputs and outputs for the basic energy conversion model
Electrical Electronic and Computer Engineering 101
- - - - - - -
Appendix A
Table A4 Simulation results calculated over a period of one moth
Parameter Value Specific energy 06589 kWhlNm
j
Cumulative load profile Refer to figure C2 Cost of energy during sample month R21156843
360
340
320
300 ~ 280 ~
260 Refer 10 figure A3
240
220
200 gt gt gt gt gt gt gt gt gt gt gt gt gt gt gt gt gt gt gt gt ol ol ol ol ol ~ ol ol ~ ol ol ol ol ol ol ol ol ol ol ol ol ol
~ ~ ~ ~ ~ ~ ~ ~ ~ ~ ~ ~ ~ ~ ~ ~ ~ ~ ~ ~ ~ ~ I I I I I I I I I I I I I I I I I I I I I
C-I ri on IQ 00 0 C-I ri on IQ 00 0- 0 C-I ri on IQ t- O- 0 C-I C-I C-I C-I C-I C-I C-I ri
Time
Figure A2 Actual and simulated load profile for the oxygen plant at Sasol Secunda
~ ~
360
340
320
300
260
240
220
200
I8-May I9-May 20-May 21-May 22-May 23-May 24-May 25-May
Time
Figure A3 Section of actual and simulated load profile of figure C2
Electrical Electronic and Computer Engineering 102
Appendix A
On 8th May the actual load profile plunges momentarily while the model doesnt seem to be
responding to this change in power consumption This is due to the fact that the model
assumes that only one oxygen compressor can be offline at any point in time which is usually
the case on this particular day however between 0730 and 930 train twos oxygen
compressor tripped and was offline for approximately two hours in addition to the oxygen
compressor of train one This has the implication that the spare oxygen compressor was
summed twice for two hours On 7th May the same incident happened for approximately one
hour
Two oxygen compressors are very rarely offline at the same time and as these incidents
happened only for a relatively small time the entire month (approximately three hours in total)
its impact is negligent and also for the sake of model simplicity this aspect was neglected in
modeling the oxygen plant
As will be illustrated later in this section an oxygen trains power consumption increases
when a higher purity oxygen is produced Between 15t and 2nd of May the actual load profile
seems to be slightly higher compared to that of the model The model assumes that oxygen is
produced at a constant purity (986) however in this case oxygen was produced at a higher
purity leading to an increased power consumption this is also the case for the respective load
profiles between 27th and 28th of May The same reasoning can be applied to the results seen
between 30th and 31 5t of May except that in this case lower purity oxygen (ie less than
986) was produced
When the power consumption of the oxygen plant drops like for instance at 5 7 8923 and
30th May it seems that the model overshoots the minimum point at times this is mainly due to
the minimum permissible power consumption the compressors are allowed to have The model
assumes 28MW and lOMW for the air and oxygen compressor motors respectively but these
values vary from train to train (may be higher or lower than 28MWllOMW) and thus may
overshoot at times or even undershoot the actual load profile at these conditions
Electrical Electronic and Computer Engineering 103
Appendix A
A2 IMPACT OF KEY PARAMETERS ON ENERGY EFFICIENCY
The energy conversion model defined in the previous section will now be used to quantify the
impact certain key process parameters have on the energy consumption efficiency and cost of
the plant Normal operating conditions will be used as the baseline and are as listed in table
A5 at these conditions the model outputs are as listed in table A6
Table A5 Normal operating conditions of the oxygen plant at Sasol Secunda
O2 Purity 986 HPNdLP02 25 IA flow 35 kNmlh O2 common header pressure 3440 kPa
Table A6 Model results at normal operating conditions
Specific energy 06589 kWhlNmf Load profile of oxygen plant Figure A2 Average power consumed 32344MW Total cost of energy R 21156843
The effects of changing following parameters will be determined
bull Oxygen purity
bull Average recovery efficiency (AR)
bull Instrument air flow (AI)
bull Cold box availability
Table A7 lists the different simulation scenarios with table A8 displaying the respective
model outputs in terms of specific energy average power consumption and total cost of
energy
Electrical Electronic and Computer Engineering 104
Appendix A
Table A7 Model simulation scenarios
Variables O2purity IA flow per 02CH Recovery
CD offline train pressure efficiencies
Oxygen purity - Scenario 1 985 35kNmJh 3440kPa Table A2 None - Scenario 2 987 I 35kNm3h 3440kPa Table A2 None
AR efficiency - Scenario 986 35kNm3h 3440kPa Trains 2amp6 None
changed to 95
IA flow - Scenario 986 Load shifting 3440kPa Table A2 None
IA of trains 2amp6 to train 7
Cold box availability - Scenario 986 35kNmj h 3440kPa Table A2 Train 1
Table A8 Model outputs based on the scenarios listed in table A7
Variables Specific Average Total cost Increase
Increase Increase I in average
of energy in specific in total
energy power power cost of
consumed energy (KWhINm3) (MW) (R) consumed energy
(R) Oxygen purity - Scenario 1 06553 32172 21049009 -055 -053 ~7834 - Scenario 2 06631 32553 21287147 064 065 0304
AR efficiency - Scenario 06524 32029 20960289 -099 -097 -196654
IA flow I
- Scenario 78 32291 21123850 -017 -016 -32993
Cold box availability - Scenario 07360 31189 20401463 1235 -357 -755380
Electrical Electronic and Computer Engineering 105
Appendix B
APPENDIXB LIST OF TABLES
Table 21 Components of air and their properties (Sources Austin [11] Kotz et al [1]) 5
Table 23 A description on the function of each process and the equipment used for the
Table 44 Summary of electrical machinery ratings and capacity requirements for production
Table 47 Three suppliers of a 4-pole 137MW induction motor with their respective ratings
Table 49 Energy systems life plan for the critical systems on the cryogenic air separation
Table 22 Comparison of air separation technologies (Smith et al [2]) 6
implementation thereof 7
Table 41 Details surrounding commodity inputs to the oxygen plant at Sasol Secunda 34
Table 42 Details surrounding commodity outputs from the oxygen plant at Sasol Secunda 35
Table 43 Prioritization of output products of the oxygen plant 35
means 39
Table 45 Summary of the user requirements for each product 39
Table 46 Current motor parameter values 60
60
Table 48 Power saving for the different motors from the three suppliers 62
plant 66
Table 51 Characteristic parameters of a train used in its performance measurements 77
Table 52 KPI values for the air and oxygen compressor motors 78
Table 53 System inefficiencies quantified in terms of average power loss 80
Table Al Oxygen compressor empirical values 98
Table A2 Coldbox average recovery efficiencies 98
Table A3 Input values used for model simulation 100
Table A4 Simulation results calculated over a period of one moth 102
Table A5 Normal operating conditions of the oxygen plant at Sasol Secunda 104
Electrical Electronic and Computer Engineering 106
Appendix B
Table A6 Model results at normal operating conditions 104
Table A7 Model simulation scenarios 105
Table A8 Model outputs based on the scenarios listed in table A7 105
Electrical Electronic and Computer Engineering 107
Appendix C
APPENDIXC LIST OF FIGURES
Figure 21 Processes involved in cryogenic air separation 7
Figure 23 Water and alcohol mixture at boiling point producing a gas and consequent
Figure 24 Cascaded distillation flasks producing a substance rich in volatile element at the
Figure 25 Distillation by means of improved liquid-gas contact between cascaded distillation
Figure 26 Distillation column producing oxygen and nitrogen by means of fractional
Figure 41 Energy policy at different levels of the organization and the scope of the policy at
Figure 42 An illustration of efficiency losses inherent to the plants structure from an energy
managers perspective and how they collectively contribute to the ultimate quantity of
Figure 43 Basic outline of the oxygen plant at Sasol Secunda The flows presented here are
Electrical Electronic and Computer Engineering
Figure 22 Distillation flask with water and alcohol mixture 10
distillate richer in alcohol 10
top and a substance rich in less volatile element at the bottom 11
flasks 12
distillation trays [5J 13
Figure 27 Producing oxygen by utilizing a distillation column with no condenser [5J 14
Figure 28 Producing nitrogen by utilizing a distillation column with no vaporizer [5J 15
Figure 29 Stacked column model that enables the production of oxygen and nitrogen 17
Figure 31 Basic outline of the energy management model 20
Figure 32 The energy management model 22
each level 25
output product per Rand of electrical cost 30
the steady state maximum amounts of oxygen that each train is able to produce 36
Figure 44 Process flow of a single oxygen train 38
Figure 45 Simplified system breakdown structure of the cryogenic air separation plant 42
Figure 46 Multi-stage compression cycle with interstage cooling (Coulson et ai [27])45
108
Appendix C
Figure 47 Linear approximation of system curve 48
Figure 48 Functional fai lures and performance standards 51
Figure 49 Partial power curves of the existing motor (motor 1) and the new motor (motor 2)
as well as that of the compressor load illustrating the implication of installing a higher
efficiency motor than is currently in operation 54
Figure 410 Compressor characteristic curve at various shaft speeds 56
Figure 4 11 Approximating the power curve with a linear model at low slip values 59
Figure 412 Threshold efficiency proposed new motor should adhere to as a function of its
full load speed 61
Figure 413 Threshold lines of motor after every rewind 64
Figure 51 KPI trend for the global efficiency indicator 78
Figure 52 KPI trending for the air compressor 79
Figure 53 KPI trend for the oxygen compressor 79
Figure 54 KPI trend for the ASU 80
Figure Al Inputs and outputs for the basic energy conversion model 101
Figure A2 Actual and simulated load profile for the oxygen plant at Sasol Secunda 102
Figure A3 Section of actual and simulated load profile of figure C2 102
Electrica l Electronic and Computer Engineering 109

Chapter 1 Problem Identification and Background
surrounding improved energy optimization have been widely publicized (refer to Birmingham
et ai [3] Biddulph [8] Gupta et al [9] and Sarkar [6]) It is also a fact that all these studies
are almost solely aimed at improving the energy efficiency of the plant through intervention at
the design phase of the cryogenic air separation plant Although there have certainly been
significant improvements in plant energy efficiency during the past years as stated earlier not
much have been written on how proper maintenance of this energy efficiency should be
conducted and needles to say proper energy management
The aim of energy management is defined by Thuman et ai [10] as the reduction of energy
expenditure for the purpose of reducing product cost this would ultimately lead to an increase
in competitive performance and it becomes clear that by employing effective energy
management much more benefit can be drawn by the relevant stakeholders and consequently
also makes business sense
This energy management effort should not only be confined to the design phase of the plant
but should be a continuous action applying it throughout the whole productive part of the
plants life-cycle
With todays relatively high and continuously increasing energy prices it not only becomes a
necessity but also makes business sense to maintain and continuously improve the plants
energy efficiency Managing the plants energy expenditure and efficiency would be the
correct response to the already high and ever-increasing energy cost and may reduce overall
input cost dramatically
To make this managerial action value-adding there needs to be an effective and continuous
energy management program in place that aims to reduce the plants energy expenditure so as
to ultimately reduce product cost
Electrical Electronic and Computer Engineering 2
Chapter 1 Problem Identification and Background
13 DISSERTATION OBJECTIVES
The dissertation objectives are as listed under the main and specific objectives in the subshy
sections that follow
131 Main objective
The main objective of this dissertation is to present a structured framework which would
enable effective management of energy cost and efficiency on cryogenic air separation plants
132 Specific objectives
The main objective is accomplished by addressing several key specific objectives
bull Present a model for energy management at cryogenic air separation plants
bull Introduce the theory behind an energy policy
bull Introduce an energy management strategy
bull Present an efficient energy audit process
bull Derivation of a mathematical model for the cryogenic air separation plant
bull Defining performance indicators which would assess the success of the energy
management program
bull Present the means for conducting energy systems maintenance on relevant
equipment on the plant
14 DISSERTATION STRUCTURE
This dissertation is structured in accordance with the energy management model
Chapter 2 introduces the reader to some of the various technologies available today for
producing air products and also elaborates on the basic theory behind cryogenic air separation
Electrical Electronic and Computer Engineering 3
Chapter 1 Problem Identification and Background
The main processes within the air separation plant are described as well as the equipment used
in realizing these processes
Chapter 3 introduces the energy management model and more specifically the energy
management system This chapter sets the scope for the chapters that follow and gives a brief
introduction of what each one entails
Chapter 4 describes the organizational structure of the energy management program as well as
the components its comprised of It also elaborates on energy management planning and
introduces the concept behind the energy policy and strategy In this chapter components of
the energy policy strategy are described in detail and selected concepts are explained by means
of case studies
In chapter 5 the managerial function of leading is described as well as a few issues
surrounding employee motivation Also included in chapter 5 is the theory behind energy
management controlling where concepts surrounding energy standards detection of deviations
and correction of deviations are elaborated on
The last chapter chapter 6 concludes the dissertation objectives and ends with
recommendations with regard to selected topics
Lastly the case studies presented in this study are with reference to the oxygen plant at Sasol
Secunda in South Africa unless otherwise stated
Electrical Electronic and Computer Engineering 4
Chapter 2 Cryogenic Air Separation
CHAPTER 2 CRYOGENIC AIR SEPARATION
21 INTRODUCTION
Air is a composition of various gasses of which nitrogen (N2) and oxygen (02) collectively
account for approximately 9903 of the total sample volume (Table 21) Various needs
have been developed for application of these gasses especially in the steel petrochemical and
metal industries where large amounts of oxygen and nitrogen are required According to Kotz
et ai [1] oxygen and nitrogen are used the most extensively by industry and they are annually
among the top five chemicals produced in the United States
Table 21 Components of air and their properties (Sources Austin [11] Kotz et ai [1])
Gas Molar Mass (mole) Volume () Boiling Point (K) Nitrogen 2801 78084 7735 Oxygen 3200 20946 9019 Argon 3995 0934 8727 Hydrogen 101 000005 2027 Neon 2018 0001921 2709 Helium 400 00005239 422 Krypton 8380 00001139 11981 Xenon 13129 00000087 16504 Carbon dioxide 4401 002-004 19468 bull Average molar mass of dry air =2896 gmol
Oxygen and nitrogen are produced by means of an air separation process which entails the
separation of air into its constituents The rare gasses like for example Argon Krypton and
Xenon are normally obtained as byproducts of the air separation process
Realization of the air separation process is done through the implementation of a specific air
separation technology There exist different air separation technologies today each one aimed
at exploiting different attributes with regard to the difference in physical properties between
the constituent air gasses In other words an air separation technology is based on the fact that
the fundamental components of air all have different physical properties and air separation is
Electrical Electronic and Computer Engineering 5
Chapter 2 Cryogenic Air Separation
therefore realized through for example distinguishing between molecule sizes distinguishing
between difference in diffusion rates through certain materials adsorption preference special
materials have towards certain gasses of the atmosphere and difference in boiling
temperatures
Some of the technologies being used today include adsorption chemical processes polymeric
membranes ion transport membrane (ITM) and cryogenic Table 22 compares the different
air separation technologies to each other in terms of technology status byproduct capability
product purity limit and plant startup time As can be seen from the table cryogenic air
separation technology is in a mature stage of its life cycle consequently making it the only
feasible means currently available for mass production of air products such as oxygen and
nitrogen
Table 22 Comparison of air separation technologies (Smith et ai [2])
Process Status Byproduct capability
Purity limit (vol )
Start-up time
Adsorption Semi -mature Poor 93-95 minutes Chemical developing Poor gt99 hours Cryogenic mature Excellent gt99 hours Membrane Semi-mature Poor 40 minutes ITM developing Poor gt99 hours
The sections that follow will be dedicated to cryogenic air separation technology
22 PROCESS DESCRIPTION
Cryogenic air separation technology is based on the fact that the different constituent gasses of
air all have different boiling points and by manipulating the immediate environment in terms
of temperature and pressure the air can be separated into its components
Various processes are needed in a cryogenic air separation plant of which the fundamental
ones are air compression air purification heat exchanging distillation and product
Electrical Electronic and Computer Engineering 6
Chapter 2 Cryogenic Air Separation
compression (figure 21)
Air Product Product compression compression delivery
I
Air - Heat Distillation
purification exchange
Figure 21 Processes involved in cryogenic air separation
Each process of figure 21 has a certain function and this function is performed by means of
relevant equipment Table 23 lists the equipment type utiHzed in each of the required
processes as well as their respective main functions
Table 23 A description on the function of each process and the equipment used for the
implementation thereof
Process Function Equipment type Pressurize air feed lines in
Air compression order to achieve required Compressor production I Purifying the air by Reversible exchangerssieve
Air purification removing water and CO2 adsorbers Cooling of incoming air feed by means of cold
Heat exchanging Heat exchanger recovery from exiting products Partial separation of air into
Distillation Distillation columns its constituents Pressurize outgoing product
Product compression feed in to meet user Compressor requirement
Electrical Electronic and Computer Engineering 7
Chapter 2 Cryogenic Air Separation
In figure 21 incoming air is pressurized by the air compressors and enters the process with a
certain flow-rate as determined by the demand of air product at the output of the plant
The air pre-treatment section removes impurities like water carbon dioxide and hydrocarbons
and is necessary because it prohibits vapour condensation liquid water solidification and
gaseous CO2 condensation from occurring within the heat-exchanger thus ensuring
continuous operation of a train
In order to obtain the required conditions for air distillation the air first needs to be cooled
down and this is done by means of heat exchanging between the air and outgoing product
streams
The distillation process is at the heart of the overall process this process performs the actual
separation of air into its constituents These air products are produced with a certain purity
which is defined as the ratio of the quantity of 100 pure air product to the quantity of total of
air product at the output
The outputs from the distillation process are fed back through the heat exchanger in order to
realize the cold recovery process that is needed for the cooling of the incoming air feed lines
The main air product is at low pressure when exiting the distillation process and is for this
reason usually compressed to the clients pressure specification prior to delivery
The system incorporating these processes is referred to as an oxygen or nitrogen train
whatever the main product may be A number of such trains are usually cascaded in order to
produce a high-tonnage air product output and is then collectively referred to as an oxygen or
nitrogen plant
The capacity of cryogenic air separation trains is expressed in tons per day (tpel) of main
Electrical Electronic and Computer Engineering 8
Chapter 2 Cryogenic Air Separation
product output The flow of air products is usually quantified in terms of normal-cubic meter
per hour (Nm31h) which is defined as the flow at 1013 absolute bar and DoC This is in
actuality a mass flow and not a volume flow and conversion between Nm3Ih and tpd may be
done by using the ideal gas law as stated in Perry et al [12] and Fishbane et al[13]
pV =nRT (1)
where
bull P is the gas pressure (kPa)
bull V is the volume (m3)
bull Tis the gas temperature (K)
bull R is the gas constant (831451JmoZ- i Ki)
Rearranging equation (1) and substituting the normal conditions stated earlier gives equation
(2)
V =22414xn (2)
Thus the volume occupied by one mole of gas is 22414m3 at normal conditions whatever the
gas may be The periodic table (Kotz et al [1]) states the molar mass of elements and this is
32gmol for oxygen (02) and 28gmol for nitrogen (N2) and knowing that Itpd is equivalent
to10624 glhour one may evaluate the ton per day rating for oxygen and nitrogen from the
mass flow specification or vice versa
ltpd O2 =2918 Nm31h (3)
1tpdN2= 3335 Nm31h (4)
23 DISTILLATION
As stated earlier the distillation process is at the heart of the overall process and for the
purpose of this dissertation this section will be dedicated to a basic explanation on its
operation The working of this process will be explained by means of an example highlighting
the critical elements of distillation and later on applying these principles to the distillation of
air
Electrical Electronic and Computer Engineering 9
Chapter 2 Cryogenic Air Separation
231 Example Distillation of an alcohol and water mixture
Consider a distillation flask in which there is a mixture of water and alcohol as depicted in
figure 22
Water + Alcohol
Figure 22 Distillation flask with water and alcohol mixture
In figure 23 the mixture is brought to boiling point with a boiler and a gaseous phase richer
in the most volatile component is obtained The gas is condensed and as alcohol vaporizes at
a lower temperature than water (we say that alcohol is more volatile than water) a distillate
richer in volatile elements is obtained
Gas richer in alcohol
Alcohol-rich
distillate
Figure 23 Water and alcohol mixture at boiling point producing a gas and consequent
distillate richer in alcohol
Condenser
Boiler
2 e]
Electrical Electronic and Computer Engineering 10
Chapter 2 Cryogenic Air Separation
By simply cascading a number of such systems as in figure 23 it is possible to make the
distillate richer and richer in volatile elements and thus effectively increasing the volatile
element purity of the distillate This arrangement is depicted in figure 24 and shows the
location of where the respective volumes of the volatile rich element and the less volatile rich
element may be obtained
This arrangement however has the disadvantage that it needs as many boilers and condensers
as distillation flasks but this can be overcome by making the liquid-gas contact more efficient
as is also being done in practice
Rich in less volatile Rich in volatile element (water) element (alcohol)
Figure 24 Cascaded distillation flasks producing a substance rich in volatile element at the
top and a substance rich in less volatile element at the bottom
By improving liquid-gas contact as shown in figure 25 better heat exchanging between the
liquid and the gas may be realized causing the gas to be cooled down partially and the liquid
to be heated up partially Cooling down the gas leads to its partial condensation and heating up
the liquid is accompanied by partial boiling thus distillation with only one boiler may still be
realized given that liquid gas contact is improved
Electrical Electronic and Computer Engineering 11
Chapter 2 Cryogenic Air Separation
Rich in less volatile element
(water)
Rich in volatile element (alcohol)
Figure 25 Distillation by means of improved liquid-gas contact between cascaded distillation
flasks
This concludes the water and alcohol example and the basic theory explained here will now be
made applicable to air distillation
232 Distillation of air
In practice distillation trays instead of flasks are used and the basic function of the tray is to
enable efficient contact of the descending liquid and the rising gas Thus the tray sets the
stage for following
bull Cooling and partial condensation of the rising gas
bull Heating and partial vaporization of the descending liquid
Figure 26 depicts a distillation column with only one vaporizer and one condenser
Distillation is made possible by efficient liquid-gas contact and this is enabled through proper
contact between the descending liquid and the rising gas The respective purities of the most
volatile and less volatile elements differ at each tray with the lower and upper sides of the
disti1lation column being the two extremes which is also where the pure elements are
obtained
Electrical Electronic and Computer Engineering 12
Chapter 2 Cryogenic Air Separation
Suppose that the mixture is no longer water and alcohol but oxygen and nitrogen (Le air)
then oxygen (less volatile element) would be produced at the bottom and nitrogen (most
volatile element) at the top
In figure 26 it is clear that the tray provides the rising gas with a certain resistance and thus
creating a pressure drop this pressure drop must be as small as possible for it has a significant
impact on the energy consumption of the air compressor and is also an important parameter in
development of a trays technology Distillation packing is another technology that is being
used and as opposed to fractional distillation trays ensures a much smaller total pressure drop
as well as improved liquid-gas contact
Condenser
Liquid-gas contact c s 0 r w
Distillation )column
Tray )
Vaporizer
Most volatile
component
$1
~ 8shyS 0 u
~ cI-0 gt
S
4-lt 0
egt middotc ~
$1 ltU $1 0
ashy0 u ltU
3 -cI-0 gt ~
4-lt 0
egt middotc I
Q
Less volatile
component
Figure 26 Distillation column producing oxygen and nitrogen by means of fractional
distillation trays [5J
Electrical Electronic and Computer Engineering 13
Chapter 2 Cryogenic Air Separation
In practice the model presented in figure 26 would be uneconomical since it needs both a
vaporizer and condenser It is possible to remove either one but then the column would be
limited to either producing oxygen or nitrogen and not both at the same time
When removing the condenser it is still possible to produce oxygen however a liquid mixture
of nitrogen and oxygen is needed and this must be injected at the top of the column as shown
in figure 27
Residual product (N2 + O2)
GAS
LIQUID
Less volatile air product (02 )
LIQUID Vaporizer
Figure 27 Producing oxygen by utilizing a distillation column with no condenser [5]
It is important that the mixture entering the column must be in the liquid phase otherwise
there will only be one phase (gas phase) in the column which means that distillation would
not be possible as it requires both a gas phase and a liquid phase
Thus with the model presented in figure 27 liquid oxygen is produced at the bottom and a
residual gas consisting of nitrogen and oxygen at the top
Electrical Electronic and Computer Engineering 14
Chapter 2 Cryogenic Air Separation
Figure 28 shows a model for producing nitrogen The distillation column utilizes only a
condenser and it is required that a nitrogen and oxygen gas mixture be injected at the bottom
of the column
Condenser The more volatile product
GAS
Nz+ O2 mixture
Residual product (N2+ O2)GAS
LIQUID
Figure 28 Producing nitrogen by utilizing a distillation column with no vaporizer [5]
Gaseous nitrogen is obtained at the top of the column whereas a residual liquid mixture rich in
oxygen is obtained as a byproduct at the bottom of the column
By injecting a liquid oxygen and nitrogen mixture instead of a gaseous mixture at the bottom
of the column would make distillation impossible because there will again be only be one
phase (liquid phase) present
Thus to summarize when producing oxygen a liquid mixture of oxygen and nitrogen and a
column equipped with a vaporizer at the bottom is required To produce nitrogen a gaseous
Electrical Electronic and Computer Engineering 15
Chapter 2 Cryogenic Air Separation
mixture of oxygen and nitrogen as well as a column equipped with a condenser at the top is
needed a byproduct rich in oxygen will also be produced in this instance
By stacking the columns presented in figures 27 and 28 on top of one another and by
routing the oxygen rich liquid which is obtained at the bottom of the nitrogen column to the
top of the oxygen column it is possible to produce oxygen and nitrogen by using only a
condenser as shown in figure 29
An oxygen rich liquid enters the top of the upper distillation column and through distillation
results in liquid oxygen (LOX) at the bottom of the same column Vaporization of the LOX
into gaseous oxygen (OOX) is realized by means of the heat exchanging that occurs between
the gaseous nitrogen (OAN) at the top of the lower column and the LOX at the bottom of the
upper column At the top of the upper column a waste product consisting of a nitrogen and
oxygen gas mixture is also produced
In practice the function of the condenser is fulfilled by a heat exchanger that ensures that
proper heat is carried over from the OAN to the LOX and vice versa in order to enable
vaporization of the LOX and condensation of the OAN which is required for the continuous
operation of the distillation columns
In this model the columns are stacked on top of each other but it is also possible to place them
alongside one another as occasionally being done in practice
This concludes the discussion on distillation further explanation on this subject is beyond the
scope of this dissertation and the basic theory presented here should be sufficient and relevant
to understanding the selected material presented in this study
Electrical Electronic and Computer Engineering 16
Chapter 2 Cryogenic Air Separation
GOX ---shy
LOX l1li---shy
Condenser
GAN ---shy
Air
Oxygen rich liquid
Figure 29 Stacked column model that enables the production of oxygen and nitrogen
Electrical Electronic and Computer Engineering 17
Chapter 2 Cryogenic Air Separation
24 CONCLUSION
This chapter has explained the basic theory behind cryogenic air separation It details the
properties of air and compares the various technologies for producing certain air products
This chapter states the main processes of cryogemc air separation and they are air
compression air purification heat exchanging distillation and product compression These
processes as well as the interaction between them have been described
Distillation is the key process in cryogenic air separation and has consequently been given
special consideration to in this chapter The basic theory behind distillation as well as how this
applies to the separation of air have been elaborated on which should serve as a sufficient
reference for the remainder of this dissertation
Electrical Electronic and Computer Engineering 18
Chapter 3 Energy Management
CHAPTER 3 ENERGY MANAGEMENT
31 INTRODUCTION
Management is essential in any organized collaboration and should be implemented at all
levels of an enterprise (Koontz [14] et al) An organization has certain inputs to its disposal
be it human resources funds technology skills etc and it is the basic function of the manager
in charge to efficiently manage these valuable inputs in pursuit of achieving predefined
objectives in an optimum manner In an industrial plant like the cryogenic air separation plant
typical inputs are production personnel the various maintenance departments (electrical
mechanical instrument turbo etc) engineering financial and information technology among
others and all these resources are normally subjected to some form of management Energy is
another important input to the plant the plant needs energy to produce its products to the
clients specification and given that cryogenic air separation plants are energy intensive by
nature efficient energy management will have a definite impact in the cost per product
produced
For instance the oxygen plant at Sasol Secunda in South Africa is composed out of several
trains which col1ectively account for approximately 35 of the factorys total power
consumption In terms of the total operating cost of the oxygen plant itself the energy cost
constitutes 72 thereof compared to the 2 of labor costs and 8 of maintenance related
costs [15] This relatively large electricity cost is typical of cryogenic air separation plants
(also refer to Sarkar [6] and Gupta et al [9]) and it is quite possible to manage the usage of
energy in such a way as to ultimately reduce the cost per product produced
32 ENERGY MANAGEMENT AT CRYOGENIC AIR SEPARATION PLANTS
Turner [16] defines energy management as the control of energy consuming devices for the
purpose of minimizing energy demand and consumption Energy management is defined by
Janse van Rensburg [17] to be the perspicacious and efficient usage of energy Another
definition is that from Ottaviano [18] where energy management is defined as the reduction of
demand through conservation
Electrical Electronic and Computer Engineering 19
Chapter 3 Energy Management
The aim of energy management is defined by Thuman et al [10] as the reduction of energy
expenditure for the purpose of reducing the cost of a product so as to increase competitive
performance
With the various energy management definitions in mind one can come to the conclusion that
energy management is some sort of process ultimately resulting in reduced energy
expenditure How then would one go about describing this process which energy
management is In terms of energy management applied to cryogenic air separation plants
energy management may sufficiently be described as a transformation process and this will be
the topic of the next section
32 MODEL FOR ENERGY MANAGEMENT AT CRYOGENIC AIR SEPARATION
PLANTS
The Oxford dictionary [19] defines a model as a representation of reality a simplified
description of a complex system The model developed here serves as a generic framework for
energy management at cryogenic air separation plants and provides insight and understanding
of the energy management process as well as giving structure to this understanding it is a
product of systems thinking and takes on a holistic approach towards energy management A
basic outline ofthe model is presented in figure 31
External environment
Inputs
Resources Accomplished objectives
Figure 31 Basic outline of the energy management model
Energy management process
(transformation process) Outputs
Electrical Electronic and Computer Engineering 20
Chapter 3 Energy Management
The basic function of the energy manager is to transform the inputs (resources) in an effective
and efficient manner into outputs of higher value With the available resources as levers and
with the expected objectives in mind the energy manager has to convert the resources into the
pre-defined objectives by means of a transformation process This transformation process is
the organizational structure of the energy management program for which the management
thereof is the responsibility of the energy manager
The organizational structure of the energy management program is part of larger systems such
as the industry to which it belongs social systems economic systems and even the natural
environment and this is accounted for by the inclusion of the external environment Typical
inputs from the external environment are resources like capital skills facilities and people
and as shown in the figure the external environment is ultimately affected by the outcomes of
the energy management program
33 ENERGY MANAGEMENT SYSTEM THE TRANSFORMATION PROCESS
It is generally accepted that the fundamental components of management are planning
organizing staffing leading and controlling (Koontz et al [14]) Energy management is a
managerial action and most of these functions also apply to the energy management system
Figure 32 depicts the energy management model and states the components of the
transformation process
Through organizing the energy management program the energy manager gives it definition
and structure It mainly involves identification and classification of required activities and the
grouping of these activities in a structured and meaningful way
Planning involves the decision-making process This is where policies are set objectives are
determined and the strategies in attaining these objectives are established
Electrical Electronic and Computer Engineering
i L4502-7S
bH LczJ 717 ~
21
Chapter 3 Energy Management
Inputs Resources
- Capital
- Skills
- Facilities
- People
External environment
- Energy management structure C1et1m1t10Ilt~1
- Energy policy strategy
Hil- Human resource deployment
- Current situation evaluation
- Energy systems maintenance
- Energy management plan
Establishing standards
Performance measurement
Figure 32 The energy management model
Outputs Accomplished energy management objectives
- Reduced production cost
- PM maintenance strategies
- Improved plant design
- Improved production schedules
- etc
Electrical Electronic and Computer Engineering 22
Chapter 3 Energy Management
Leading refers to the process of influencing people so that they will strive willingly and
enthusiastically toward the achievement of energy management goals
Controlling is the measurement and correction of performance in order to ensure that
objectives and the plans devised in attaining them are being accomplished
These managerial functions make up the transformation process and in performing these
functions the energy manager enables an efficient and effective process for achieving energy
management objectives Analysis of each of these functions will be given in the chapters that
follow
34 CONCLUSION
In this chapter a model for energy management is given the energy management process is
modeled as a transformation process in which resource inputs are converted into outputs of
higher value
The model entails the transformation process its inputs and outputs and the external
environment as well as the interaction between all of these Inputs are resources like people
skills and facilities outputs are the accomplished energy management objectives like
improved preventive maintenance schedules optimized production schedules and reduced
energy cost
The external environment accounts for the higher-order systems to which the energy
management system belongs The transformation process involves the managerial functions of
organizing planning leading and controlling which are the core managerial functions the
energy manager has to perform Each function entails various activities and will be explained
in more detail in the chapters that follow
Electrical Electronic and Computer Engineering 23
Chapter 4 Organizing and Planning
CHAPTER 4 ORGANIZING AND PLANNING
41 ORGANIZING
With reference to general management Koontz et al [14] states that organization implies a
formalized intentional structure of roles and positions Generally organization involves 1) the
identification and classification of required activities 2) the grouping of activities necessary to
obtain objectives and 3) the delegation of authority for the means of managing these
groupings
With reference to energy management there should be an intentional and formal structure in
place for conducting a continuous and efficient energy management program The structure
presented in this study defines three groups of activities energy management planning
leading and controlling The activities under each grouping will be explained in the sections
and chapters that follow
42 PLANNING
Planning involves decision-making This is where courses of action are selected objectives are
set and strategies in attaining these objectives are determined The starting block of the energy
management program is the energy policy The energy policy is a statement or understanding
that guides or channels thinking it is an expression of the commitment plant management has
towards a continuous and effective energy management and sets the scope for energy
management strategies at plant level
43 THE ENERGY POLICY
Plant management should establish an energy policy that is in line with major policies in order
to ultimately add value to overall company objectives The energy policy at plant level may be
derived from a major policy and is therefore called a derivative or minor policy (Koontz et al
[141) Figure 41 shows the energy policy at various levels of the organization as well as the
scope of the policy at each of these levels
Electrical Electronic and Computer Engineering 24
C hapter 4 Organi zing and Planning
Company wide policy
Scope of company wide policy
incorporating all divis ions
Scope of divisional policy derived from
company poli cy
Scope of plant pol icy deri ved From the
divisional policy and made appl icable to
the plant
Figure 4 1 Energy policy at different levels o f the organi zati o n and the scope of the po licy at
each level
Thus the energy poli cy aL planL level is Lypicall y a deri vati on o f hi ghe r-orde r po li c ies Lhese
policies may be hi gher-level energy or environmental po li cies and has a much la rger scope
than the plant-level energy po li cy
As an example the sa fety hea lth and environmental po li cy of Sasol Secunda is a companyshy
wide policy
bull Compally-wide policy (Safety Health and Environll1el11al Policy)
Electrica l E lecLronic and Com pULer Eng ineering 25
Chapter 4 Organizing and Planning
We are committed to responsible utilization of natural resources and we will manage our
company wherever we do business in an ethical way that strikes an appropriate and well
reasoned balance between economic social and environmental needs [20]
From this policy it can be seen that Sasol recognizes its responsibility towards the
environment and also states that intentional effort concerning the balance between economic
and environmental issues will be instated by means of managerial actions which is also where
the high-level energy policy may stem from
bull Division-wide policy
To manage the SasollElectricity Supply Industry interface so as to minimize the total cost of
energy for the Sasol group of companies Further to this to promote energy efficiency and
reward energy management success by decentralizing accountability for electricity costs and
by aligning internal electricity tariff structures with the Eskom marginal rate [21]
From the above an energy policy at plant-level may now be derived
bull Plant-wide energy policy
We at oxygen plant are committed to responsible energy usage and endorse efficient energy
management practices in order to optimize our energy consumption
The energy policy normally consists out of three components the declaration of commitment
mission statement and specific objectives To illustrate the difference between these the
division-wide policy [21] will be taken as an example The mission statement defines the
scope of the energy management program and as can be seen in this case it has been included
in the declaration of commitment
Electrical Electronic and Computer Engineering 26
Chapter 4 Organizing and Planning
The specific objectives are the means for achieving that stated in the mission statement and
from the same example some objectives are
bull Develop ways of getting all stakeholders involved in energy management
bull Implement and continuously improve world-class best practice energy management
within our operations
bull Pioneer cross-functional and cross-divisional collaboration within the group of
companies
bull Facilitate the creation of an enabling environment which leads all key role players
agreeing to and achieving stretched targets
bull Develop and maintain the electricity measurement system within the group of companies
44 THE ENERGY POLICY STRATEGY
With the energy policy in place the logical next step would be to formulate a strategy in order
to realize the vision as expressed by the policy The energy policy strategy effectively
encapsulates the plan for changing current reality into future vision and in doing so the
following activities need to be addressed
bull deployment of human resources
bull current situation evaluation
bull energy systems maintenance
bull energy management planning
bull establishment of measurement and control indicators
These are the constituents of the energy policy strategy and each will be elaborated on in the
sections that follow
Electrical Electronic and Computer Engineering 27
Chapter 4 Organizing and Planning
441 Deployment of human resources
Plant management should appoint a dedicated person for taking the responsibility of driving
the energy management program This person should be knowledgeable of the technology
used in cryogenics and be experienced in energy auditing and management This person
should also assist plant management in adjustingrefining the current energy policy in order to
make sure that it adds value and makes allowance for the holistic approach of energy
management
Koontz et al [14] defines two types of policies namely intended policy and actual policy
Initially plant management may have had no intended energy policy but by agreeing upon the
appointment of a dedicated energy manager to drive an energy management program they
have in actuality instated an ill-defined energy policy and it is the task of the energy manager
to now properly structure and formalize the energy policy in conjunction with management
442 Current situation evaluation
The current situation of the plant is assessed by means of an energy audit process Energy
auditing is an important phase of the energy management program and the success of such a
program to a large extent depends on how well and to what extent the energy audit was done
(Thuman [22] and Ottaviano [18]) After all the plant first has to know itself before it can
correct itself The aim of the auditing process is to establish the relative position of the plant
from an energy management point of view
Auditing is not a once-off process instead it should be done on a regular basis so that the
energy manager can make the value-adding decisions regarding corrective measures The
outcomes of the auditing process are the following (refer also to Ottaviano [18])
bull assessment of energy consumption and energy usage patterns
bull identification of potential improvement opportunities
bull assessment of energy norms
Electrical Electronic and Computer Engineering 28
Chapter 4 Organizing and Planning
bull employee awareness
bull feasibility of potential energy projects
4421 The energy audit process
The audit process consists out of the energy audit policy and the energy audit strategy The
energy audit policy sets the scope for what to audit whereas the energy audit policy strategy
states how this would be done
The audit strategies are the means for conducting the energy audit and the relative position of
the plant with regard to energy management is determined through the evaluation of certain
plant efficiencies as listed by Senekal [23]
bull Management efficiency
bull Maintenance efficiency
bull Operating efficiency
bull Design efficiency
bull Storage efficiency
bull Information efficiency
These efficiencies are determined from an energy management perspective and a holistic
approach to energy management lies in managing available resources in such a manner as to
optimize all these efficiencies
4422 The plant efficiencies
The cryogenic air separation plant like any other enterprise aims to convert resource inputs
into outputs of higher value For the cryogenic air separation plant typical inputs are capital
employees skills and technology and the common goal is to convert these inputs into products
Electrical Electronic and Computer Engineering 29
Chapter 4 Organizing and Planning
like oxygen nitrogen andor rare gases to customer satisfaction This conversion is done with
some amount of efficiency loss and in optimizing the overall efficiency necessarily means a
higher level of output with the same amount of input
Each department within the plant contributes to the overall efficiency loss and the contribution
energy management has is assessed in terms of the efficiencies already listed
Plant structure from energy management perspective
Management Maintenance Operating Design Storage Information
efficiency efficiency efficiency efficiency efficiency efficiency ~ ~ ~
~ ~ ~ - ~ ~ - v
-- - - -
Quantity of output product Resources
per unit of electrical cost
Figure 42 An illustration of efficiency losses inherent to the plants structure from an energy
managers perspective and how they collectively contribute to the ultimate quantity of output
product per Rand of electrical cost
In order to assess these plant efficiencies certain strategies should be employed but first an
explanation on what each efficiency entail will be presented
bull Management efficiency
Management efficiency is determined in terms of the commitment plant management has
toward energy management The level of this commitment should be determined and is a
function of the following
bull The existing energy policy
bull Amount of resources allocated for energy management
Electrical Electronic and Computer Engineering 30
Chapter 4 Organizing and Planning
The energy manager should determine whether there is an existing energy policy in place and
also establish on which level this policy originates from Next it should be determined
whether this policy has been derived to plant level and also whether it has been applied at this
level The extent of this application should also be determined Le are there any strategies
outflowing from this policy Have any resources been committed Have they been
implemented Are they relevant and in scope
bull Maintenance efficiency
The maintenance efficiency is determined by the extent of intentional consideration given to
the optimization of energy efficiency of relevant equipment in existing maintenance life plans
Maintenance efficiency goes hand in hand with energy systems maintenance which will be
dealt with in more detail later on in this chapter
bull Operating efficiency
By taking the system just as it is and not altering any design features try to obtain the most
efficient system operation This could mean changing process schedules or consolidating plant
activities
As mentioned by Senekal [23] the operating design and storage efficiencies are very closely
related and in most of the cases by changing one it would have an influence on the other two
These three efficiencies may be determined by means of utilizing a mathematical model
which is a specific audit strategy and will be discussed later on
As an example of operating efficiency consider an oxygen plant that has electric motor driven
compressors as well as steam turbine driven compressors During peak hours steam is cheaper
than electricity which means that just by changing production schedules of the electric andmiddot
steam trains during these times (increasing production of the steam trains and lowering that of
the electric trains) significant energy cost savings may be realized
Electrical Electronic and Computer Engineering 31
Chapter 4 Organizing and Planning
bull Design efficiency
Design efficiency entails the evaluation of the plants efficiency by taking into account the
systems design Restraining factors in the design are identified and by altering design
parameters the auditor can determine possible ways of optimization These design
deficiencies are normally the cause of
bull Inadequate design from an energy managers point of view
bull Inefficient equipment - a cause of equipment deterioration andor the availability of
improved and more energy efficient technology
For example at one plant motor-generator sets are used for bringing the large air compressor
motors up to speed The MG sets were installed twenty years ago and compared to soft starter
technologies available today are much more unreliable The unreliability of the MG set
caused numerous startup delays in the past resulting in significant production losses with the
implication that production department insisted that the air compressors be kept online even
when product demand is low This decision acts as a barrier to potential energy savings that
lies in taking an air compressor off-line when demand is low Thus by changing the original
design through introducing better technology (implementing better soft starter technology)
may lead to potential energy cost savings
bull Storage efficiency
Often there are cost saving opportunities by using storage facilities more efficiently This can
be seen in the case were the plant has a LOX tank facility to its disposal Excess LOX can be
pumped to the tank during off-peak times and can then be used later on to supplement the
demand during peak times Because there is now an extra supply channel it leads to the air
compressors having to produce less compressed air and ultimately results in energy cost
savings
bull Information efficiency
Information efficiency refers to the availability and nature of the relevant information
Electrical Electronic and Computer Engineering 32
Chapter 4 Organizing and Planning
necessary for conducting the energy management program Correct and accurate information
is vital to the energy management program and the energy manager must make sure that
relevant information is easily accessible
For instance data concerning the state (flows pressures temperatures purities etc) of air
commodities within the plant and each of the respective trains is crucial performing certain
energy management activities and barriers restricting the accessibility and availability of this
information should be addressed and overcome if the energy management effort is by any
means going to be successful
4423 Energy audit policy
The audit policy scopes the auditing work to be done and basically serves as a guideline in the
auditing process It is advisable to establish a formal energy audit policy because it gives
direction to the audit process and for the holistic approach this policy should enable the
assessment of all the relevant plant efficiencies mentioned earlier
4424 Energy audit strategy
In order to determine the plant efficiencies as stated in the audit policy audit strategies are
utilized and those that are most relevant are (also refer to Turner [16])
bull Familiarization with plant characteristics and operation
bull The questionnaire
bull The walk audit
bull The measurement audit
bull Database building
bull Mathematical model
bull Financial analysis and feasibility studies
Each strategy will now be looked at in more detail in the sections that follow
Electrical Electronic and Computer Engineering 33
Chapter 4 Organizing and Planning
bull Familiarization with plant characteristics and operation
For the audit to bear meaningful results the energy manager should first attain a relatively
thorough understanding of the characteristics of the plant as well as its production policy This
entails the following
bull Understanding of operating characteristics and production policy This also
includes identifying the input and output streams to and from the plant
bull Construct relevant process flow diagrams - This includes process models of the
plant and relevant sub-systems Also identify and make a list of all the energy
consuming components include attributes such as equipment ratings purpose of
equipment and quantity of each
bull Establish the user requirements for the plant and critical sub-sections
The key principles in plant familiarization will now be applied by taking the oxygen plant at
Sasol Secunda as an example
o Understanding ofoperating characteristics and production policy
The oxygen plant is part of a process chain and to have an idea of where it fits into the overall
system the following two tables shows the inputs of and outputs to and from the oxygen plant
Table 41 Details surrounding commodity inputs to the oxygen plant at Sasol Secunda
Water works
Distribution
and Plant air Air utilities
Electrical Electronic and Computer Engineering 34
Chapter 4 Organizing and Planning
Table 42 Details surrounding commodity outputs from the oxygen plant at Sasol Secunda
upplying various factory loads
The plant is running at full load twenty-four hours per day seven days a week All the outputs
must be produced with minimal stoppage The plant also incorporates a very useful buffer
system a LOX tank which is supplemented with excess LOX at times when oxygen demand is
relatively low or whenever there is spare capacity available The LOX tank serves the purpose
of supplementing oxygen demand at peak times when the available capacity isnt able to
match the demand Because atmospheric temperature plays such an important role in
producing excess LOX this commodity is usually fed to the LOX tank overnight when
temperatures are relatively low
There is a balance to be maintained in producing the various products which means that a
change in major output streams has a definite influence on the other output products There is
however priority assigned to the production of each commodity detailed in table 43
Table 43 Prioritization of output products of the oxygen plant
Priority Product Implication of production loss 1 (highest) Oxygen amp Nitrogen Substantial production loss 2 Nitrogen Substantial production loss 3 Instrument air Non-critical plants trip 4 (lowest) LOX Production loss at KryptonXenon plant
Electrical Electronic and Computer Engineering
I
35
Chapter 4 Organizing and Planning
CJ Construct relevant process flow diagrams
The oxygen plant comprises of seven oxygen trains as well as a spare oxygen compressor and
the outline of the plant is shown in figure 43
Oxygen Plant
HP02
507 200 Nm3h and 985 purity
~
l~ 0 72 200 Nm3h I
Air Inbull Train 1 I II 1middot O2 72200 Nm3h middot middot I Air In
Train 2 II ~
I middot bull I
0 72 200 Nm31h middot middot Air Inbull Train 3 I I ~ bull ~
72 200 middot middot Nm(when online)
I LPO LP~ HPAIR I
COMMON middot middot COMMONbull Spare Train bullbull middot I HEADER HEADERmiddotI I middot middot middot
HP02 middot middotbull I ~
COMMON HEADER
I middot
Air In Train 4 bull middot
middot middot I
O2 72200 NmJh II middot ImiddotI middot Air Ini bull Train 5 I I 0 72 200 NmJh ~
bull bull I
I middot middot Air Inbull Train 6 I i 0 72 200 Nm3h HI bull
middot ~middot middot Air Iny Train 7 II I I
I ~ 0 74000 Nm________________________________J
Figure 43 Basic outline of the oxygen plant at Sasol Secunda The flows presented here are
the steady state maximum amounts of oxygen that each train is able to produce
Electrical Electronic and Computer Engineering 36
Chapter 4 Organizing and Planning
The trains are linked by means of three common headers the air LP oxygen and HP oxygen
common headers Each train can sustain a continuous production of up to 72 200Nm31h of
oxygen except for train 7 which has a slightly higher capacity (74 000Nm31h) resulting in a
collective maximum production capacity of 507 200Nm31h for the plant
The main product high purity gaseous oxygen is produced at 985 purity (minimum) which
is pumped into a common header and distributed to the various loads within each factory
(gasification and gas-reforming)
The main purpose of the air common header is to minimize losses whenever an air compressor
goes offline In normal operation however there is little or no air exchange between trains but
as soon as one air compressor goes offline the air present in the common header supplies that
trains air demand Trains 1-6 are connected to the air common header with train seven
working in isolation Usually the air valve of train seven remains closed it is only in abnormal
circumstances that it is opened but then only by a relatively small amount
A control system monitors and controls the production of compressed air and it does this by
monitoring the compressed air demand and then opening or closing the guide vanes of all six
compressors by an equal amount thus effectively sharing the load equally between the six air
compressors
The spare train consists only of an oxygen compressor and is put online whenever one of the
other oxygen compressors is taken out of operation (eg due to breakdown or for routine
maintenance) Each train has two oxygen outlets namely the high-pressure (HP) outlet and
the low-pressure (LP) outlet In normal operation the trains LP oxygen output is isolated from
the LP common header via a valve but as soon as that trains oxygen compressor is out of
operation the valve opens enabling the LP oxygen to enter the common header and the spare
oxygen compressor goes online
Electrical Electronic and Computer Engineering 37
--
tTl (l) () qshy(i ~ -shytTl (l) () qshy0s ()
sect CJ (1 0 gs tTls
(J(l
Ei (l)
~ Er
(J(l
w
(1r
Excess N2 toatm i
HPN1
Dry air
to factory
Main heat ExchanJ2cr
--------------
=-t--n rI
----n
-
-_ -- J
~Waste N2
1
Coldbox
LOX
TIciQ Air from s -- atmosphere
-- n -
-------- ~
f p0 () (l)
=shy0 ~ 0 ~
s (J(l
(l)
0
~ (J(l (l)
s qshy1
1
Air Water Tower Dryer Dryer
1 2
ChilI Wet air LP02
Water Tower
~ sect
HP02 N (to factory) s
(J(lLPN1
sect CJ
IA g (to factory) ~ ss
Smiddot (J(l 00
Chapter 4 Organizing and Planning
Figure 44 shows the process flow of a single train All the electric utili zi ng equipment are
highlighted Note the quantity and process requirements are also brought onto thi s process
flow diagra m for example (112) means that process requirements need one of the two
installed equipment types during normal operati on
Table 44 Summary of electri cal machinery ratings and capacity requirements for production
means
QuantityO2 Production Operating Motor description Rating requirement QTY
train online
timeday
Expansion turbine motor 525 kW 2 1 24 h
Nitrogen blower motor 300 kW 2 1 24 h
Oxygen compressor motor 137 MW I 1 24 h
Air compressor motor 37MW I I 24 h
Chi ll water pump motor 75 kW 2 1 24 h
Water pump motor 132 kW 2 1 24 h
Jack- up oil pump motor 36kW 2 1 24 h
Installed capacity 52836MW
Utilized capacity 51678MW
Utilization 980
o Establish Ihe II ser requirements
Table 4 5 li sts the user requirements for the oxygen plant s output products
Table 45 Summary of the user requ irements for each product
Product Quantity Purity Delivery p Delivery p (kNm1t) (min) (min) kPa (max) kPa
Oxygen 72000 985 3440 3480 Nitroen 22000 999 420 430 LOX 3500 - 100 120 IA 8000 - 420 450
Electrical Elec troni c and Computer Engineering 39
Chapter 4 Organizing and Planning
bull The questionnaire
In conducting the energy audit the energy manager would undoubtedly find it necessary to
conduct interviews with key personnel The questionnaire is a structured and well-planned
approach in acquiring important information from personnel and it is imperative to identify the
appropriate personnel when conducting the audit For example determining maintenance
practices by interviewing production personnel would in most cases give a distorted picture
of the actual situation or in other instances not bear any meaningful results at all
It is very important that the questionnaire is planned thoroughly in advance The energy
manager should aim to attain as much information as possible with the least amount of
questions since personnel do not always have adequate time available
bull The walk audit
The walk audit goes hand-in-hand with plant familiarization and it enables the energy manager
to view the plant first hand It entails determining the state of the plant and in order for the
energy manager to make this audit value adding it would be a good idea to also take a guide
along one who is experienced with the equipment and the operation of the plant
bull The measurement audit
Relevant measurements of energy consumption flows pressures and temperatures can be
taken whenever there is no automatic measurement system in place but at most of these plants
real-time data collection is in place and data may simply be downloaded from were it is stored
bull Database building
Because the audit process is such an important phase in the energy management program all
the data collected should be stored for easy reference The database is a collection of various
pieces of information in different formats and it is thus important to have a structure in place
in which the information is organized in a meaningful manner The database should compose
Electrical Electronic and Computer Engineering 40
Chapter 4 Organizing and Planning
of the following
bull Results from other audits conducted
bull Specifications of machine ratings
bull Process amp equipment limitations and constraints
bull Operating schedules of plant
bull Maintenance strategies and schedules
bull Financial analysis and feasibility studies
One output of the energy audit process is the identification of potential improvement
opportunities and in response to this the energy manager is now concerned with identifying
alternatives as the means for realizing the different improvements
Normally most of the options would require capital investment to realize and the problem is
that the benefits resulting from an investment option is stretched over a period of time whereas
the investment is required now Thus feasibility studies are conducted with the aid of financial
analysis tools and only the most feasible option for each alternative should be considered
bull Energy conversion model
The energy model is an important auditing tool and adds great value to the energy
management program The basic idea behind the energy conversion model is to express the
plants power consumption as a function of main air product output under certain conditions
From the cryogenic air separation plants point of view a fairly accurate model may be very
complicated but it will be the aim of this section to present model building blocks that are
relatively simple whilst still providing adequate accuracy
As Delport [24] mentions there are basically two levels within process modeling The first
level is the physical model which is the energy managers understanding of the real world
Electrical Electronic and Computer Engineering 41
Chapter 4 Organizing and Planning
system in conjunc ti on with the follo wing restraining factors
bull assumptions and simplifi cations that are in line with the model acc uracy and
requirements
bull level of detail that has been decided upon
bull system and subsystem boundaries
bull data requirements and avail abi li ty
The second level in process modeling is the energy conversion model which is the
mathematical representati on of the physical model The difference between the physica l model
and energy conversion model should be noted the physical model is an abstracti on of the real
world system and the energy conversion model is an abstraction of the physical model
In order to deri ve an energy model for the plant the plant first needs to broken down into its
various levels of subsystems as shown in fi gure 45 It should be noted that the air purifi cati on
system and all other au xili ary equipment have been omitted from thi s system breakdown thi s
is because it is assumed that the energy loss th rough the purification system is negli gible and
the energy consumption of all other auxiliary equ ipment is insignifi cant compared to that of
the compressor motors It may be th at in certa in plants the auxiliary equipment may not be
insignifi cant at all in these situati ons the energy manager is urged to deri ve models fo r these
subsystems as we ll
Whole CRYOGENIC AIR SEPARATION PLANT
Industry
EndmiddotUser Trains 1 to n
Groups
Processes Air Compression
Air Separation Process Product Compression
System Systelll
Machinery Air
Motor Air purifi cation Main Heat Distillation Product
Motor Compressor system Exchanger Columns Compressor
Figure 4 5 Simplified system breakdown structure of the cryogenic air separati on plant
Electrical Electronic and Computer Engineering 42
Chapter 4 Organizing and Planning
From figure 45 the following is clear
n
P =p (1)plant ~ train m
m=
where
bull n is the number of trains
bull Pplant is the power consumption of the cryogenic air separation plant (MW)
bull Ptrain m is the power consumption of train m (MW)
Neglecting power consumption of auxiliary machinery the power consumption for each endshy
user group will be as stated in equation (2)
P =P +P (2)train m ACm PCm
where
bull PACm is the input power of air compressor motor of train m (MW)
bull PPCm is the input power of product compressor motor from train m (MW)
The input power for a compressor motor is
pslUlft
P xm (3)xm
where
bull x refers to the motor of a compressor type x ie the motor driving the air or
product compressor
bull m is the train number
bull Pxm is the input power of type x compressor motor of train m (MW)
Electrical Electronic and Computer Engineering 43
Chapter 4 Organizing and Planning
bull p~ft is the shaft power (output power) of type x compressor motor of train m
(MW)
bull lm is the electromechanical efficiency of type x compressor motor of train m
It is a fact that when a gas is compressed its temperature rises significantly and if this increase
in temperature is too much it would cause the oil to ignite and deteriorate mechanical parts
This places a restriction on the compression ratio (ratio of absolute outlet pressure to absolute
inlet pressure) of the compressor and hence this ratio is rarely greater than three (Air Liquide
[5])
Because of this constraint multi-stage compression with inter-cooling is implemented to
achieve the required output pressure Inter-cooling is normally realized through either air- or
water-cooling however air-cooling is normally limited to smaller size compressors Watershy
cooling is the more effective of the two because of its ease of control and greater heat
absorption capability (Talbott [25])
Another reason for employing multi-staging in compressors is because of its energy saving
attribute the energy saving is achieved because cooling the air down between stages reduces
the inlet air volume of the next compression stage and hence the work required to complete the
compression (Salisbury [26] and Talbott [25])
The operation of the multi-stage compressor can be followed by referring to the pressureshy
volume diagram in figure 46 The area enclosed by 1-2-3-4 represents the adiabatic work to
be done by the compressor to compress a gas from a pressure of PI to P2 The area demarcated
by 1-2-5-4 represents the necessary work for isothermal compression
Electrical Electronic and Computer Engineering 44
Chapter 4 Organizing and Planning
Isothermal Adiabatic compression compression
p
~__________~~__+-______~~~2
v
Figure 46 Multi-stage compression cycle with interstage cooling (Coulson et al [27])
Because the gas inlet temperature at each stage stays constant one can see that actual
compression takes place near the isothermal curve Thus a simplifying assumption would be
to approximate the compressor characteristic by assuming isothermal compression
Thus the shaft power required by the compressor will be as expressed by equation (4)
(4)
where
bull P =output power of type x compressor of train m (MW)
bull 1] =isothermal efficiency of type x compressor of train m xm
Electrical Electronic and Computer Engineering 45
Chapter 4 Organizing and Planning
The output power of the compressor is a function of the intercooler temperature the air flow
and the pressure ratio and for isothermal compression this relationship is expressed as in
equation (5) (refer to Baumeister et al [28] amp Salisbury [26])
out pout = kxQ xl xln Pm (5)xm xm Ie In( Pxm
where
bull Qxm is the gas flow from compressor of type x of train m (kNm3h)
bull 0c is the intercooler temperature (K)
bull P~~ is the gas absolute output pressure of type x compressor of train m (kPa)
bull Pm is the absolute inlet pressure of type x compressor of train m (kP a)
In cryogenic air separation air is separated into its constituents and only by knowing the
constituent ratio of the main air product in a sample of air it is possible to determine the
airflow at the input of the train
QACm = (6a) rmain product
where
bull QACm is the air flow from air compressor of train m (kNm3h)
bull Qure is the total flow of (pure) main air product that originally entered the air
compressor of train m (kNm3h)
bull rmain product is the constituent ratio of the air product in a sample of air For oxygen
this ratio is 209 and for nitrogen this is 780 refer to table 21
Electrical Electronic and Computer Engineering 46
Chapter 4 Organizing and Planning
If there exists an air common header connecting all the trains the main output product may not
necessarily be a result of solely the airflow at that particular trains input since air exchange
between trains does occur and even more so in the case of an air compressor being out of
operation A good approximation would be to average out the total airflow over all the trains
In this case equation (6a) takes on the form of equation (6b)
(
= 1 ~QPureQ (6b)
ACm t- m nrmain product Jm=
The main product is rarely 100 pure there is to some acceptable extent impurities present
in the substance as well Secondly this product is produced with some amount of loss within
the air separation process this loss is quantified in terms the recovery efficiency Thus to
obtain the total flow of the pure product that originally entered at the air compressor side
Purity QPure =Q x main productm (7)
m PCm TJ recm
where
bull Qpcm is the flow rate of the main product from product compressor of train m
bull Puritymain productm is the purity of the primary output product of train m
bull TJrecm is the recovery efficiency of which the air separation process recovers the
primary constituent of air that originally entered the process
It is now possible to compute the air flow however the air discharge pressure is still needed
for computation of the compressor power consumption There is a definite relationship
between the air discharge pressure and air flow and this relationship is defined by the system
characteristic The system needs a specific discharge pressure at a certain flow rate from the
Electrical Electronic and Computer Engineering 47
Chapter 4 Organizing and Planning
air compressor and the relationship between these two parameters in the normal operating
region of the compressor may be approximated quite accurately by a linear model as shown
in figure 47
Thus discharge pressure as a function of air flow will be as shown in equation (8)
out h Q (8)PACm = m +gm ACm
where hm and gm are the constants for train m and may be determined by means of linear
regression
Compressor Surge line characteristic at
different modes of operation
System curve
Linear approximation
Flow
Figure 47 Linear approximation of system curve
Electrical Electronic and Computer Engineering 48
Chapter 4 Organizing and Planning
Although cryogenic air separation trains may have been designed in exactly the same manner
it is a fact that over time they drift in their parameter commonalities and by applying modeling
parameters in one train to other trains as well would ultimately result in high inaccuracy of the
overall plant model Thus certain parameters of the model should be done empirically train by
train Empirical modeling should be sufficient only for all the critical elements of each train
which include
bull electromechanical efficiency of each compressor motor
bull isothermal efficiency of the air and product compressor
bull recovery efficiency of the air separation process
Determination of the electromechanical efficiencies should be enabled through employment of
the correct maintenance strategy as will be discussed in the next chapter If there is no initial
data available concerning the current state of the motor an assumption should be made at first
The recovery lrecm is a symptom of the current state the ASU thus essentially modeling this
system it is determined by taking the average over a sufficient sample period
The isothermal efficiency of the compressor is a function of the gas flow pressure and
intercooler temperature The pressure range in which these compressors are suppose to operate
in is usually relatively small and the empiric modeling of the isothermal efficiency may be
approximated quite accurately by a linear model
out
n - xQ +b x Pxm + xT +d (9)IIxm - axm Xnl xtm -- cxm Ie xm Pinx
where a bull b bull e bull and d bull are constants of compressor type x of train m and arex m x m x m x m
determined by means of linear regression Multiple variable linear regression techniques like
Electrical Electronic and Computer Engineering 49
Chapter 4 Organizing and Planning
for example that described by Makridakis et al [29] should be utilized in determining the
constants If there is no empirical data available for the compressor motors as yet the motor
efficiency and the isothermal efficiency of the compressor may be lumped together (ie
making it one system) and this overall efficiency is then empirically modeled as in equation
(9) this means that the model then (equation 9) encapsulates the compressor efficiency as well
as the motor efficiency
Substitution of these equations leads to the final energy conversion model stated in equation
(10) For a discussion on the application and verification of the abovementioned energy
conversion model the reader is encouraged to refer to the case study presented in the
appendix
h + gm xPUritymainproducmJj[tQ xuritYmain proliuctm Jx~ xln__k_(~Q _m nrmain product =1 PCm Teem
nrmain producl ~ mel ~
reem K
[ m
PACrn
______________~--__-shy__~__________--~--------~) (10)
pp1an t m=J
ACm x [aAcm xQACm +bACm XP~~m + CACm X~C +dAcmJ PinIIC
kxQPCm X~C Xln[ P~m J + PK~
PCm x (apcm x QpCm +bpcm X pPm +CKm X~C +dpcmJ tnPC
443 Energy systems maintenance
There is a definite relationship between maintenance management and energy management
and in most cases one would find that by initiating an action in one would have a definite
effect on the other In fact Turner [16] has gone one step further and expressed the need for
energy systems maintenance Energy systems maintenance is defined as the maintenance of all
systems that use or affect the use of energy
Formulation of an energy systems maintenance life-plan as well as the management thereof is
the responsibility of the energy manager and later on it will be explained on how to assemble
such a plan The output of this maintenance effort is a recommendation and it is up to the
Electrical Electronic and Computer Engineering 50
Chapter 4 Organizing and Planning
energy manager to assist maintenance managers in adopting an energy systems maintenance
component into their life pans which would enable them to consider such a recommendation
In formulating an energy systems maintenance strategy the energy manager first has to
consider and understand at which point it is appropriate to initiate a suitable maintenance
action on relevant equipment To aid explanation to this question refer to figure 48 from an
energy management point of view this system experiences a functional failure A functional
failure is defined by Campbell [30] as the inability of a physical asset to deliver its expected
level of performance In terms of energy management this expected level of performance is
given in the form of an energy norm or standard The expected level of performance thus
defines what can be considered a failure
Engineering standard 1-----------__ ----------------------shy
Flaw in compressed air pipe
Leakage of compressed air
Energy management standard
General maintenance standard Minor leakage
Production standard Major leakage
Time
Figure 48 Functional failures and performance standards
Different departments within the plant (engineering maintenance production) may differ in
asset performance requirements and thus giving rise to the different standards In this example
the flaw in the compressed air pipe causes a leakage of compressed air leading to a decrease in
energy efficiency and money could be saved by initiating a maintenance action sooner than as
scheduled by maintenance department
Electrical Electronic and Computer Engineering 51
Chapter 4 Organizing and Planning
The energy norm or standard thus defines the not only what should be considered a failure but
also the amount of maintenance needed to preserve this level of performance
The difference in standards frequently creates conflict between various departments and when
initiating an energy cost saving maintenance action the energy manager should first reach a
compromise with the different departments For example the electrical maintenance
department of one plant reported high maintenance costs on the oxygen compressor motors
Maintenance department reported that the motors were at the end of their life-cycle and
blamed the more frequent maintenance intervals as the main cause of the rising cost An
energy audit also revealed that the motors lost an average of 9 electromechanical efficiency
from their initial value which gave rise to increased energy cost as well
Considering these two factors an oxygen replacement project was proposed with immediate
commencement Production department however rejected the proposal because the plant
which already operated at full capacity would suffer significant production losses during the
replacement action and proposed that the project should be postponed to a year from then
when an extra oxygen train currently being constructed at that time is in full operation to
which the parties agreed upon and thus effectively reaching a compromise
4431 Establishing an energy systems maintenance life plan
Because plant maintenance has such a significant effect on energy efficiency the energy
manager has to establish an energy systems maintenance life plan aimed at managing
electricity cost that would supplement existing maintenance efforts on the plant
Energy systems maintenance on only those systems that normally have a major impact on the
energy consumption of the train will now be discussed they are the air and product
compressors the air and product compressor motors and the ASU
Electrical Electronic and Computer Engineering 52
Chapter 4 Organizing and Planning
4432 Energy systems maintenance on compressors
Some of the major aspects influencing the energy efficiency of a compressor are the following
(Talbott [25])
bull Wear of mechanical parts
bull Component fouling
bull Contamination with impure substances
bull Inadequate or dirty lubricants
Wear of mechanical parts changes the characteristics of the compressor and ultimately leads to
decreased efficiency Mechanical wear also result from destructive effects dirt particles have
and it is crucial that filtration be kept effective and all inlet piping be kept clean
Fouling changes the flow and pressure relationship of the compressor and thus changing the
characteristic of the original design Even if a good filter is provided fouling is inevitable and
an obvious effect is the restriction of intercooler passages this not only causes poor heat
transfer between the coolant and gas but also leads to an increased pressure drop over the
intercooler resulting in reduced performance (lower efficiency)
Lubricated compressors depend upon oil for both friction reduction and sealing It is obvious
then that if the oil has to be contaminated or corrosive it would be destructive of both
efficiency and valuable capital equipment
4433 Energy systems maintenance on motors
The aim of energy systems maintenance on motors is to improve and preserve the motors
energy efficiency
The great majority of induction motors are used to drive pumps fans blowers and
Electrical Electronic and Computer Engineering 53
Chapter 4 Organizing and Planning
compressors attempting to increase the efficiency of these motors may well result in reduced
motor internal losses but this doesnt necessarily mean reduced input power unlike the case
for synchronous motors as also motivated by Htsui et al [31] Induction motors with a higher
efficiency normally run at a higher speed (lower slip) which ultimately leads to increased
compressor load (also refer to Sen [32]) Figure 49 shows a graphical representation of this
situation
bull The fan laws
Suppose that the existing motor (motor 1) is substituted by a new motor (motor 2) of higher
efficiency which inherently has a smaller full load slip motor 1 operated at operating point 1
(OP 1) and motor 2 now has another operating point (OP 2) The power curve of the new
motor intersects the system curve (compressor load) at a higher load speed resulting in the
compressor requiring more shaft power
Pz +---------------------~r-------~~~~-------------
sbaftspeed
Figure 49 Partial power curves of the existing motor (motor 1) and the new motor (motor 2)
as well as that of the compressor load illustrating the implication of installing a higher
efficiency motor than is currently in operation
Electrical Electronic and Computer Engineering 54
Chapter 4 Organizing and Planning
The reason for the load increasing with increased shaft speed is because of the compressor
conforming to the relationships expressed by the fan laws The following relationships are a
statement of the fan laws and are listed by Brown [33] The fan laws also apply to blowers
fans and pumps and the theory developed here may also be applied to induction motors driving
either one of these mechanical devices
Qan (11)
(12)
(13)
where
bull n is the shaft rotational speed (rpm)
bull Q is the gas flow (kNm3h)
bull P is the discharge pressure of the gas (kPa)
bull P is the power requirement of the compressor (MW)
Thus the gas flow is proportional to the shaft speed the discharge pressure is proportional to
the square of the shaft speed and lastly the compressor power requirement is proportional to
the cube of the shaft speed Equating the above relationships gives the following as stated by
Salisbury [26] and Baumeister et al [28]
(14)Q ~ Q(~J
p ~ p(~J (15)
(16)p~p(~J
Electrical Electronic and Computer Engineering 55
Chapter 4 Organizing and Planning
Were the 1 and 2 subscripts refer to the initial and new conditions respectively Thus by
knowing the compressor performance at one speed one may predict its performance at another
speed
Figure 410 shows a typical compressor characteristic curve as well as the characteristic at
other speeds other than the nominal
Surge line
Compressor characteristic at various speeds
Flow
Figure 410 Compressor characteristic curve at various shaft speeds
bull Energy efficiency analysis
At this stage it becomes quite obvious that there are two contradicting factors presenting
themselves if a higher efficiency motor is installed the motor internal losses have been
reduced but at the same time the motor is most likely to run at a lower slip leading to
increased shaft power demand
Electrical Electronic and Computer Engineering 56
Chapter 4 Organizing and Planning
Thus it becomes clear that an action aimed at reducing electricity cost by improving the motor
efficiency may not be as simple and the energy manager or person in charge should have a
means for quantifying the actual feasibility such an action would have
Installing a new motor for the aim of reducing electricity cost should only become an option
when at least the following statement is true
(17)
were Fnl and Fnz are the input power to motor 1 (current motor) and motor 2 (new motor)
respectively After substitution equation (17) becomes
ut 2 lt utI (18) 17mZx17D2 17m l x 17D1
where
bull utl and u12 are respectively the output power of the current and the new motor
at normal operating conditions
bull 17m and 17m2 are respectively the electromechanical efficiency of each motor
bull 17D1 and 17D2 are respectively the efficiency of the device (compressor blower fan
etc) at the operating point of motor 1 and that of motor 2
What is now needed is an indicator which would inform the energy manager on whether a
new high efficiency motor would consume less power than the existing one This indicator is
defined here as the threshold efficiency which is the efficiency the new motor should at least
have to be the more feasible option The inequality expressed in (18) can be rearranged to give
the following
17m2 gt 17ml (UI2 Jx( 17D1 J (19)ull 17D2
Electrical Electronic and Computer Engineering 57
Chapter 4 Organizing and Planning
The fan law implies that in changing the shaft speed of the compressor its efficiency stays
constant Le 17D2 = 1701 and by inserting equation (16) in (19) equation (20) is obtained
(20)
The operating speed of each motor is where the compressor load curve intersects each motors
power curve thus and may only be determined by actually plotting the motor curves nl n2
with that of the compressor load For the energy engineer to make a clear decision on whether
to upgrade motor efficiency it becomes clear that there should be a maintenance strategy in
place that result in the assessment of the motors current condition And as stated earlier this
assessment is made in terms of the motor efficiency as well as the power or toque curve of the
motor This assessment is the responsibility of the rewinder or the person responsible for the
refurbishment of the motor
The operating speed of the new proposed motor can be expressed in terms of its full load
speed and other known variables For low slip values the power curve may be approximated
by a linear relationship as shown in figure 411 which leads to equation (21)
(21)
where
bull subscript 2 refers to the new proposed motor
bull P2 is the output power (MW)
bull PFL2 is the rated full load shaft power (MW)
bull ns is the synchronous speed (rpm)
bull nFL2 is the rated full load speed (rpm)
Electrical Electronic and Computer Engineering 58
Chapter 4 Organizing and Planning
Motor power System Linear curve curve approximation
shaft speed
Fu1110ad
speed (nr)
Operating speed
(n)
Synchronous speed (ns)
Figure 411 Approximating the power curve with a linear model at low slip values
Applying the fan law by substituting equation (16) into (21) and rearranging to solve for n2
gives the following
(22)
This is a cubic equation and can be solved by applying Cardans solution [34] From Cardans
solution the equation has one real root and gives the approximate load speed the proposed new
motor will operate at
Electrical Electronic and Computer Engineering 59
Chapter 4 Organizing and Planning
Substituting (23) into inequality (20) gives the requirement in terms of its full load speed and
efficiency the new motor should conform to for it to be a more energy efficient option
bull Case study
Suppose the existing motor of figure 49 is considered for replacement This is a four-pole
137MW machine it is fifteen years old and have been rewound three times during its
productive life The decision to do a feasibility study comes after assessment of its current
condition which is detailed in table 46
Table 46 Current motor parameter values
Substituting these parameter values into (24) results in the graph depicted in figure 412 This
curve is basically a motor selection curve for selecting a new 4 pole 137 MW induction motor
as it houses the criteria for the proposed new compressor motor being more energy efficient
than the existing one Now suppose there are three suppliers of these motors as detailed in
table 47
Table 47 Three suppliers of a 4-pole 137MW induction motor with their respective ratings
I I
I Supplier Motor efficiency Motor rated full load speed 1 970 1492
I 2 960 1490 I 3 975 1496 I
Electrical Electronic and Computer Engineering 60
Chapter 4 Organizing and Planning
980 ltI~--~-------~---------lt-~------------------------------- Supplier Cbull975
Supplier A bull 970
tI 965 CI
~ 960 shy bullSupplier B Threshold line CI 955 -shy
CI ~ 95()-=a 945 ~
940
935
930 +-----------------------------------------1
14880 14900 14920 14940 14960 14980 15000
Full load speed (rpm)
Figure 412 Threshold efficiency proposed new motor should adhere to as a function of its
full load speed
As can be seen from the graph all three motors will in each case improve the energy
efficiency of the current compression system for they have ratings that enable them to be
above the threshold line
Now that we know that energy efficiency will be improved regardless of what motor is
selected the next step would be to quantify the energy saving in each case and obviously the
motor with the largest energy saving would ultimately be the most feasible option from an
energy managers point of view
Pinl and Pin2 have been defined in (8) and taking the ratio of these gives
or
Electrical Electronic and Computer Engineering 61
Chapter 4 Organizing and Planning
(25)
thus
(26)Power saving = pbullbull - P2 p+ - [ ~ )( J1 Substituting n2 of equation (23) into (26) gives the approximate power saving in terms of the
known quantities
Power saving =
Jj (27)
The results of each options power saving are listed in table 48
Table 48 Power saving for the different motors from the three suppliers
I Supplier Power saving I A 410kW
I B 260kW
I C 370kW
The motor from supplier A will be the most feasible option in terms of energy efficiency
although it doesnt have the highest efficiency
A condition-based maintenance strategy for the induction motors should be employed in
which the condition of the current motor is assessed either on an appropriate time base or
Electrical Electronic and Computer Engineering 62
Chapter 4 Organizing and Planning
when an opportunity arises to permit this The end-result of the motor assessment is the
threshold line which will be used as a reference for comparing the feasibilities of different
energy efficiency improvement alternatives
It is recommended that condition-based maintenance of this type only be done on the larger
motors where significant power savings are attainable which could justify the effort time and
cost involved in realizing this maintenance effort
bull An energy management tool for induction motor renewalreplacement
If an induction motor fails or experiences a functional failure is it better to refurbish it or
replace it with a high efficiency motor In most of the immediate circumstances
refurbishment is the more feasible option driven by the fact that it is approximately one fifth
the cost of buying a new motor On the other hand refurbishment in most cases refers to
rewinding and motors that have been rewound tend to be less efficient as also expressed by
Campbell [35]
By utilizing the maintenance strategy as presented in the foregoing section the energy
manager is in a position to make a fairly good decision between replacement and renewal
Suppose that the previously referred to 137 MW induction motors condition has been
assessed after each rewind and the threshold line after each assessment have been determined
as shown in figure 413
From the graph it can be seen that the threshold line changed with time and after each
assessment replacement seems to become a more and more attractive option
Electrical Electronic and Computer Engineering 63
96000
Chapter 4 Organizing and Planning
990
Supplier C InlYampI 98000
Supplier A shy lSI rewind Col 970
-bull shy-= ~ 2 rewind
Col Supp rB
IS lie bull~ -950 3rd rewindC -IS Q 940 --= -930==~
920
910
1486 1488 1490 1492 1494 1496 1498 1500
Fllll load speed (rpm)
Figure 413 Threshold lines of motor after every rewind
In conclusion the energy manager may recommend rewinding if the threshold line is near (just
above or below) that of the full load specifications of available motors and should recommend
replacement when the latter is sufficiently above the threshold line Lastly justifying motor
replacement will be a function of reduced energy costs as well as the projected maintenance
cost reduction
4434 Energy systems maintenance on distillation colnmns
The distillation column is made up out of distillation trays The basic function of these trays is
to enable contact of the descending liquid and the rising gas under the most favorable
conditions The mere presence of the trays provides the rising gas with a certain resistance
resulting in a pressure drop This pressure drop must be as small as possible for it has a
significant impact on the energy efficiency of the train Needless to say distillation trays have
a major impact on the energy consumption of the train as also pointed out by Biddulph [8]
Various technologies have been developed for reducing this pressure drop to the minimum of
Electrical Electronic and Computer Engineering 64
Chapter 4 Organizing and Planning
which distillation packing is the more recent and compared to the conventional sieve trays
are the more efficient as well (refer to chapter 2)
Deterioration of distillation trays are inevitable and possible damage may cause a decrease in
main product recovery efficiency and sometimes also increased pressure drop which
ultimately results in the train being less energy efficient
Maintenance on distillation trays are sometimes limited because of the large production losses
the plant would suffer during replacement but it is up to the energy manager to assess the loss
in energy expenditure and do feasibility studies on the relevant alternatives that would enable
upgrading of the columns energy efficiency
4435 Energy systems maintenance life plan
Table 49 shows an energy systems maintenance life plan based on the foregoing information
The condition of each major system is assessed in the control phase of the energy management
program and based on this assessment the energy manager is able to inform andor make
informed recommendations to the relevant maintenance department in case of the occurrence
of deviations
Electrical Electronic and Computer Engineering 65
Chapter 4 Organizing and Planning
Table 49 Energy systems life plan for the critical systems on the cryogenic air separation
plant
Compressor Motors
CBM off opportunity
based Contractor
(most likely)
motor
of motor condition
Compressor CBM on monthly Energy
manager
Inform relevant maintenance
dept on deviation and impact it has
Corrective action will be
enabled by relevant
maintenance dept
Distillation columns
CBM on monthly Energy
manager
Inform relevant maintenance
dept on deviation and impact it has
Corrective action will be
enabled by relevant
maintenance dept
444 The energy management plan
The energy management plan basically consists out of the long-range plan and the building
blocks that make up this plan which are the following
bull Primary objective
bull Specific objectives
bull Short term plan
bull Decisions surrounding project prioritization
bull Short term tactics
Electrical Electronic and Computer Engineering 66
Chapter 4 Organizing and Planning
Primary objectives are stated in the energy policy Long-range plans are the means for
achieving these objectives Thus long-range plans are the stepping-stones towards fulfilling
the vision posed by the energy policy A primary objective on its turn is a composition of
specific objectives and in achieving these objectives energy projects need to identified and
implemented Potential energy projects were already identified in the audit process and these
projects now need to be allocated to the relevant specific objectives and also prioritized
Normally mUltiple projects are required in fulfillment of a specific objective and
consequently there may be numerous projects listed under the short-term plan The energy
manager needs to assign priority to each project in order to ensure that the planned sequence
of events are structured in an optimally efficient manner
The short-term plan entails the decision-making with regard to which projects to implement
when for the next financial year The end result of the long-term plan ultimately depends on
the implementation of the short-term plans The short-term plan requires short-term tactics in
order to realize These short-term tactics are the actions and their timing that is needed to carry
out the short term plan
As an illustrative example consider the division-wide energy policy of Sasol presented in
section 43 [21]
bull Primary objective of the division-wide energy policy ofSa sol
To manage the SasollElectricity Supply Industry interface so as to minimize the total
cost of energy for the Sasol group of companies Further to this to promote energy
efficiency and reward energy management success by decentralizing accountability for
electricity costs and by aligning internal electricity tariff structures with the Eskom
marginal rate [21]
The underlined phrase is a primary objective of the energy policy and in order to realize the
decentralization of electricity cost accountability a few specific objectives first need to be
realized one such objective is stated in the list of specific objectives in the energy policy
Electrical Electronic and Computer Engineering 67
Chapter 4 Organizing and Planning
bull A specific objective ofthe energy policy
Develop and maintain the electricity measurement system within the group of
companies
A specific objective is realized through the implementation of a short term plan or
combination of short-term plans and for above mentioned specific objective a short term plan
is given in the next paragraph
bull Short term plan
o Upgrade existing measurement system on those plants that already have this
system in place
o Install measurement system on all energy intensive plants
o Establish a maintenance strategy for measurement system
o Make data freely accessible and
Actions and their timing are the tactics needed to carry out the short term plan and for the
underlined short term plan the short term tactics are as stated in the following paragraph
bull Short term tactics
o Finalize decisions surrounding data logger selection January 2000
o Order PTs and CTs for the measurement system - January 2000
o Install network connection in substations March 2000
o Install and commission data logger - May 2000
445 Measurement and control indicators
Now that there is an energy management program in place the energy manager has to decide
on how the progress and results of this program will be assessed Key performance indicators
have to be defined and energy standards need to be determined In the control function of this
Electrical Electronic and Computer Engineering 68
Chapter 4 Organizing and Planning
model the energy engineer will assess these KPIs and decide upon appropriate corrective
actions
There is one KPI that encapsulates the outcome of the whole energy management effort and
that is the energy cost per primary product output (RlkNm3) This is an important KPI as it is a
global indicator and by trending it over time the energy engineer is in a position to quantify
the impact of his energy management program however this doesnt mean that it is the only
one that should be monitored there need to be other indicators defined as well lower level
indicators that are more specific and are able to identify critical component inefficiencies
Critical system components are defined here as only that system components that have a major
impact on the energy consumption of the plant These system components include the
compressors the compressor motors and the air separation unit
The lower level KPIs should 1) indicate whether there has been a drift in system
characteristics and also 2) whether the system operated above or below expectation during the
past month It should be noted that only the means for determining the KPIs are presented
here and they will only be applied in the control function the energy manager has to fulfill as
detailed later on
Thus the following parameters are the important ones and need to be monitored
bull Electromechanical efficiency of the air and product compressor motors
bull Isothermal efficiency of each compressor
bull Recovery efficiency of each train
bull Specific energy of the plant (kWlkNm3 of main product)
With these parameters as the basis a key performance indicator will now be derived for each
Electrical Electronic and Computer Engineering 69
Chapter 4 Organizing and Planning
4451 KPI for determining the state of the compressor motor
The compressor motor efficiency has a significant influence on the overall efficiency of the
train therefore a key process indicator need to be defined for the compressor motors and this
KPI should comment on the degradation in motor electromechanical efficiency
Obviously it wouldnt make sense assessing this KPI each month and should therefore only
be assessed after each time the current condition of the motor has been evaluated
c llACmKPI (28)ACmaor = -i-
llACrn
where
bull m is the train number
bull ll~crn is the design efficiency of the motor ie the efficiency at the time when it
was initially installed
bull ll~crn is the current efficiency of the air compressor motor
The KPI of the product compressor motor takes on a similar form
(29)
where
bull KPlpcmotorrefers to the extent of deterioration within the air compressor motor
bull TJ~Cm is the design efficiency of the motor of train m ie the efficiency at the time
when it was originally installed
bull TJCrn is the current efficiency of the product compressor motor of train m
Electrical Electronic and Computer Engineering 70
Chapter 4 Organizing and Planning
4452 KPI for determining the state of the air and product compressor
(30)
where
bull KPlxm is an indicator that refers to how well compressor type x of train m
performed
bull TJheoretical is the theoretical isothermal efficiency of compressor type x of train m X In
bull TJcfual is the actual isothermal efficiency of compressor type x of train m ltm
Equation (30) then takes on the form of equation (31)
out J103x 10-4 xQ xT xln Pxmxm IC In( Pxbullm
~ctual xTJxm KPlxm out (31)
xQ +b x Pxm + xT +dax m x m x m -- ex m IC x m pin xm
where ~ctual is the actual measured MW power consumption at that specific flow and pressure
Again if the motor efficiency has not been determined yet it should be lumped with the
isothermal efficiency of the relevant compressor in this case equation (4) should be modified
by simply removing the electromechanical efficiency (TJxbullm ) of the motor
4453 KPI for determining the state of the air separation unit
actual
KPI = TJrecm (32)ASU m TJemperical
recm
where
Electrical Electronic and Computer Engineering 71
Chapter 4 Organizing and Planning
bull KPI is the indicator for how well the ASU operated during the sample time ASu bull m
bull 1Jemperical is the empirical recovery efficiency that has been determined for the ASU rectm
of train m
bull 1J~~1 is the actual recovery efficiency of the ASU of train m
4454 KPI for determining the overall efficiency of the plant
Except for the global energy cost KPI there should also be a KPI that measures the overall
energy efficiency of the plant This indicator should assist the energy manager in determining
the following
bull If there were any deviations in any system component of any train and also
quantify the impact of this on the overall efficiency of the plant
bull The impact of abnormal plant operation for example due to routine maintenance
on some trains or unexpected breakdown on the overall plant energy efficiency
bull Whether the plant operated above or below expectation
I ~heoretlCalm 1 [
m=l (33)
where
bull KPleff is the in indicator that measures the total plant energy efficiency (kWhlNm3
ofmain product)
bull Poctualm is the total power consumption of train m (MW)
bull Qm is the total main product flow at the output of train m (kNm3h)
Electrical Electronic and Computer Engineering 72
Chapter 4 Organizing and Planning
This indicator provides the energy manager with a summary with reference to the state of
energy efficiency of the whole plant Caution should be taken that this is an overall indicator
and may not be as sensitive to an inefficiency in a specific system component within a train
and by only looking at this indicator may give the energy manager a false idea of the actual
state of the plant Thus this indicator should be viewed in conjunction with the lower level
indicators
45 CONCLUSION
In this chapter energy management organizing and planning was discussed Through
organizing the energy management program is given definition and structure It mainly
involves identification and classification of required activities and the grouping of these
activities in a structured and meaningful way
Planning involves the setting up the energy policy and installing the energy policy strategy
The energy policy strategy has five components human resource deployment current
situation evaluation energy systems maintenance the energy management plan as well as
establishment of measurement and control indicators
Human resource deployment involves appointing a dedicated person charged with driving the
energy management program as well as giving this person access to other human resources
like administrative technical etc
Current situation evaluation is a critical step in the energy management program and the
outcome of the program to a large extent depends on how well and thorough the energy audit
was done
Plant maintenance has a definite and significant impact on energy efficiency and in this
chapter the need for an energy systems maintenance life plan was expressed This life plan is
Electrical Electronic and Computer Engineering 73
Chapter 4 Organizing and Planning
effectively the energy managers contribution to the overall maintenance effort on the plant
and aims to improve energy efficiency
The energy management plan is a structured and well-formulated set of plans and tactics that
should be followed in order to ultimately achieve the primary objectives as stipulated in the
energy policy It involves long-term and short-term planning as well as setting up tactics for
the means of achieving the short-term objectives
Key performance indicators (KPIs) were defined for the means of quantifying plant
performance in terms in energy efficiency and these find their application in the managerial
function of controlling which will be discussed in chapter 5
Electrical Electronic and Computer Engineering 74
Chapter 5 Leading and Controlling
CHAPTERS LEADING AND CONTROLLING
51 LEADING
The main purpose of leading is to harmonize individual and organizational objectives People
do not work in isolation rather they work in groups toward the achievement of personal and
enterprise objectives these objectives are not always in harmony and in fulfilling the function
of leading the manager aims to align objectives of the individual with that of the enterprise
Koontz et al [14] defines the managerial function of leading as the process of influencing
people so that they will strive willingly and enthusiastically toward the achievement of
organizational goals In order for people to willingly strive for such a goal they would need
some form of motivation to do so There exists various means for stimulating motivation in
people (refer to Fukuda [36] and Jordaan et al [37]) and one way of doing so is through
awareness
This awareness is encouraged by doing the following
bull Disclosing energy KPIs and also explaining possible abnormal deviations to
employees
bull The impact certain practices of relevant departments within the plants organization
have on the plants energy efficiency and ultimately energy cost For example this
may include energy inefficient maintenance strategies faulty equipment or even
inefficient production schedules
Turner [16] also lists the following relevant strategies for improved awareness
bull Providing relevant employees with energy management best practices which are
practical and relevant to their working environment within the plants organization
bull Providing energy conservation opportunity checklists to plant operators
maintenance personnel supervisors and engineers
Electrical Electronic and Computer Engineering 75
Chapter 5 Leading and Controlling
Another motivational tool is recognition The energy manager should recognize the energy
management efforts of employees and also show them the impact their efforts had during the
past month
Lastly Turner [16] also states that competition may lead to improved performance Fostering
reasonable competition between relevant departments in the plants organization may inspire
employees to work harder in achieving their goals
52 CONTROLING
Controlling is the measurement and correction of performance in order to ensure that
objectives and the plans devised in attaining them are being accomplished Koontz [14]
defines three basic steps for control 1) establishing standards 2) measuring performance
against these standards and 3) correcting undesired deviations from standards and plans
These steps will now each be defined from an energy management perspective
53 ESTABLISHING ENERGY STANDARDSINORMS
Previously energy management key process indicators were defined for the cryogenic air
separation plant those indicators are now utilized in the control function The standard for
each KPI is the theoretical quantity of the measured parameter ie the denominator of each
KPI as defined in equations (31) (32) and (33) of chapter 4 is the theoretical system
performance and also the standard to which actual system performance is compared KPIs for
the compressor motors are the exception (equations (28) and (29) of chapter 4) in that the
denominator in each is based on the original electromechanical efficiency specification
54 PERFORMANCE MEASUREMENT
The KPIs should be trended over time and significant deviations from expected performance
must be noted This must be done on a monthly basis except for the motor deterioration
indicators which may be assessed according that as stipulated by the maintenance strategy
Electrical Electronic and Computer Engineering 76
Chapter 5 Leading and Controlling
To illustrate performance measurement with a practical example consider the month-end
evaluation of one train of the seven-train oxygen plant at Sasol Secunda This specific train
boasts the characteristics listed in table 51
Table 51 Characteristic parameters of a train used in its performance measurements
Parameter Value KPI equation (Ch 4) 1 Motors
11 Air compressor motor 28 i
1]ACm 982
1]~cm 930
12 Product compressor motor 29 i
1]PCm 971
1]cm 910
2 Compressors 21 Air compressor 31
a 00009366 b -00574043 c 00021501 d 07272151
22 OXYfen compressor 31 a 00044099 b 00090275 c 00030923 d -09017176
3 ASU 32 1]emperical
recm 9541
What follows will be performance measurement by means of KPI trending after which
analysis of each will continue in the next section
Results for the trains global efficiency indicator is shown in figure 51
Electrical Electronic and Computer Engineering 77
Chapter 5 Leading and Controlling
11 ~---------------------------------------------------~-----~
105
095
Trendline
09
085 +--------------------------r---------r--------~----___------__--
OJ-May OS-May 09-May 13-May 17-May 21-May 25-May 29-May
Time
Figure 51 KPI trend for the global efficiency indicator
As implied earlier the KPIs characterizing each motors state are not trended over time
instead its given as a single value and are listed in table 52
Table 52 KPI values for the air and oxygen compressor motors
Compressor motor type KPlvaJue Air 0949 Oxygen 0937
Figure 52 shows KPI trending for the air compressor
Electrical Electronic and Computer Engineering 78
Chapter 5 Leading and Controlling
12
115
11 Trendline
1-1 ~ ~
09 +----L--r-------------------T----T~---__-----
105
1
01-May OS-May 09-May 13-May 17-May 2L-May 25-May 29-May
Time
Figure 52 KPI trending for the air compressor
The KPI trend for the oxygen compressor is shown in figure 53
l~ ----------------------------------- -------------
105 -t----------------------~----~--r--------~-----1
l~T--middot-----middot-~middotmiddotmiddot----middotmiddotmiddotmiddot-------middot--middotmiddotmiddot-middot-------~~-middotmiddotmiddot---middotmiddotmiddotmiddotmiddotmiddot---middotmiddot---1
103 i---middotmiddot-middotmiddotmiddot---middotmiddotmiddotmiddotmiddotmiddotmiddotmiddotmiddotmiddot---middotmiddot-middotmiddot--middotmiddotmiddotmiddotmiddot-middotmiddot----middotmiddotmiddotUrrt---middotmiddotmiddotmiddotmiddot-~-~-shy-+shy
Im~middotmiddot-middotmiddotmiddot~-~middotshy --~middotrftmiddotmiddot-~middot-middotmiddotmiddotmiddot----1rHll~r-middotH-middot-middotm~rlHj~~rJ~--middot---~jtr~~middot-shy
~ 101 hHHt-h1
099 -t-middot~middot--Ur---lmiddotft------middot-+middott-middotmiddotcr-----~---III ~I-----ti----middotmiddot-+---middotmiddotmiddot~~--middotmiddotmiddot------I+-imiddotmiddotmiddotmiddot--+--middotmiddotmiddot--~iH--l
098
097 -t--------~---~-shy -------~--~-~~--~--~~~~~----~-- ----~~
O+-------------~-------------middot-----~-----------~--shy
Ol-May OS-May 09-May 13-May 17-May 21-May 25-May 29-May
Time
Figure 53 KPI trend for the oxygen compressor
Electrical Electronic and Computer Engineering 79
Chapter 5 Leading and Controlling
The KPI trend for the air separation unit (ASU) is shown in figure 54
11 ~------------------------------------------------------------- Trend line
~ 095
~ 09
085
08
075
O1-May 05-May 09-May 13-May 17-May
Time
21-May 25-May 29-May
Figure 54 KPI trend for the ASU
Table 53 shows the average power loss contribution from each of the major systems These
results were obtained by calculating the average power loss defined as the difference between
actual performance and expected performance (Le at KPI equal to unity) during that
particular month
Table 53 System inefficiencies quantified in terms of average power loss
System A verage power loss Air compressor motor 660kW Oxygen compressor motor 400kW
Total lO60kW
Air compressor 630kW Oxygen compressor -70kW Air separation unit (ASU) 430kW
Total 990kW
Grand total 2050kW
Electrical Electronic and Computer Engineering 80
Chapter 5 Leading and Controlling
55 CORRECTIVE ACTION
Now that system performance have assessed the energy manager is now in a position to
manage equipment inefficiencies and determine whether there has been improvement in those
that have been addressed on previous occasions
551 Global efficiency indicator
This KPI should be below one in case of energy efficient train operation but as can be seen
from figure 51 it is mostly above unity implying some form of efficiency loss within the
oxygen train
On 8th May there was a sudden improvement in the global efficiency indicator and the reason
for this will become apparent in the discussion regarding the KPI trend for the air compressor
It is worth noting from the graph that there seem to be a slight trend downwards up to around
27th May were it stayed on or below unity for the rest of the remaining time the reason for this
is that average ambient temperature decreased as the year approached June ultimately leading
to increased train efficiency This trend can also be seen in the air compressor graph of figure
52 and the fact that the ambient temperature has such a favorable effect on train energy
efficiency its actual performance is disguised somewhat and one can expect that the losses
listed in table 53 may even be slightly higher during the summer months
542 Compressor motors
The fact that these two values are below one (refer to table 52) implies that there has been
some degradation in motor efficiencies the air compressor motor is currently about 95 of its
original efficiency and that of the oxygen compressor motor is around 94 Based on this
assessment the energy manager may quantify the cost associated with the respective 5 and
6 degradation in motor efficiencies and is now in a position to manage this energy loss
Electrical Electronic and Computer Engineering 81
Chapter 5 Leading and Controlling
5421 Air compressor motor
All air compressor motors on this plant are rated 37MW and are 2-pole synchronous motors
This air compressor motors KPI is at 0949 (table 52) which equates to an average power
loss of 660 kW The energy cost associated with this loss combined with current maintenance
costs cannot at this stage justify buying a new high-efficiency synchronous motor therefore
other corrective actions should be employed in improving the motors energy efficiency and in
this particular case the following steps will be taken
bull Assessment of partial discharge condition monitoring results and scheduling an
opportunity maintenance action if these results show a degree of partial discharge
bull Schedule an in-situ motor inspection carried out by the OEM in which the state of the
stator and rotor may be determined minor servicing of the motor may be enabled and
recommendations can be made by the OEM
5422 Oxygen compressor motor
All oxygen compressor motors on the plant are 137 MW 4-pole induction machines and for
this particular motor its KPI has been evaluated at 0937 leading to an average power loss of
400 kW (this result takes into account the principles discussed in section 4433 and is based
on the power saving that would result in upgrading it to its original specifications)
For the oxygen compressor motor there is much more potential for a replacement action
because of the relatively high energy loss and the fact that maintenance costs for this motor
has risen quite dramatically over the past two years Considering all the related variables a
payback period of 17 years has been calculated when replacing this motor with a new one
Management rules state that business-case approval will only be given to projects with a
payback period of 15 years or less however KPI monitoring on the other trains revealed that
the majority of oxygen compressor motors are in a worse state than the motor from this
particular train and by consolidating the project (ie recommending replacement of all motors
at once instead of just the one) the payback period was calculated at just below 15 years
Electrical Electronic and Computer Engineering 82
Chapter 5 Leading and Controlling
543 Air compressor
On 8th May the actual compressor performance was significantly above that expected (refer to
figure 52) the reason for this being that demand at that time required high product flow at
high purity and auxiliary air compressors were put online to supplement this demand the
auxiliary air compressors are unaccounted for in the model which ultimately manifests in
exceptional compressor performance
Although air compressor performance did improve as the month progressed (gradual decrease
in ambient temperature) for the majority of operational time it remained below expected
performance This under-performance resulted in an average power loss of 630 kW (table 53)
and upon further investigation it was found that routine maintenance was done quite a long
way back and given the poor air quality at Sasol Secunda a significant amount of compressor
fouling was inevitable Production requirements from production department and low priority
assignment from maintenance department resulted in these irregular and mostly delayed
maintenance intervals A proper corrective action from the energy manager in this case would
be to facilitate a compromise between these two departments by ensuring that consensus have
been reached on the scheduling of this maintenance action and also that this scheduling leads
to increased energy efficiency
544 Oxygen compressor
Figure 53 shows the KPI trend for the oxygen compressor and as can been seen from this
figure the KPI stayed above unity for the majority of time which implies good compressor
operation This is also manifested in the average power loss for this compressor which has
been calculated at -70kW as listed in table 53 implying that the oxygen compressor overall
operated slightly above expectation
In general one can expect that the product compressors performance in terms of energy
efficiency should normally be above that of the air compressor because as opposed to the air
compressor it handles a clean and pure gas and is therefore not as susceptible to compressor
Electrical Electronic and Computer Engineering 83
Chapter 5 Leading and Controlling
fouling also in some cases it is less prone to physical damage resulting from large solid
particles
545 Air separation unit
From figure 54 it can be seen that the ASU under-performed for the majority of time
resulting in an average power loss of 430 kW (table 53) Calculations showed that the average
recovery efficiency for this time was 9417 which is slightly less than its empirical value
(9541 ) meaning the air compressor has to make an added effort for compensating this drop
in efficiency
Production department acknowledged the decrease in recovery efficiency and the problem was
identified as damaged distillation trays inside the distillation column Initiating a maintenance
action to repair defective trays in the near future will not be feasible because this would lead to
significant production losses Again the energy manager has to manage this loss to the
minimum The following actions would do just this
bull Keep monitoring the recovery efficiency and initiate a maintenance action as soon
as energy loss could justify this andor determine the production loss when the air
compressor has reached its full capacity and cannot compensate for the recovery
efficiency loss anymore which ever comes first or should it be it the case when
both conditions have been reached
bull Minimize the loss by sharing a portion of this trains load equally between the
more efficient trains at times of low oxygen demand or whenever there is more
efficient spare capacity available
55 CONCLUSION
In this chapter the managerial functions of leading and energy management controlling have
been discussed
Electrical Electronic and Computer Engineering 84
Chapter 5 Leading and Controlling
The managerial function of leading involves leadership motivation and communication
Leadership refers to the ability to lead which involves the process of influencing people so
that they will strive willingly and enthusiastically toward the achievement of energy
management goals Motivation is vital in aligning objectives of the individual with that of the
energy management program and it is important that the energy manager practice effective
motivational techniques Communication is the process by which information can be received
or send It is a vital skill and an essential activity in the energy management program
Controlling is one of the functions the energy manager has to perform in order to ensure
continuity of an effective energy management program
Control is necessary in the energy management program as it brings actual performance in
line with desired performance and based on the discrepancy between these two the energy
manager is in a position to strategize corrective measures It is important for the energy
manager to establish good communication links with the relevant departments within the
plants organization as they are in a position to provide information relevant in the control
phase and are also the stakeholders that need convincing before buying into corrective action
strategies
Electrical Electronic and Computer Engineering 85
Chapter 6 Conclusions and Recommendations
CHAPTER 6 CONCLUSIONS AND RECOMMENDATIONS
61 INTRODUCTION
In chapter 1 the main and specific objectives of this dissertation were listed these objectives
were addressed during the course of this dissertation and will now be properly concluded
through referring to the relevant sections Lastly recommendations with regard to certain
aspects of the energy management system presented in this dissertation will be made followed
by a closing remark
62 CONCLUSIONS ON THE OBJECTIVES
The main objective of this dissertation was to present a framework that would enable effective
management of energy cost and efficiency in cryogenic air separation plants as stated in
section 12
In this dissertation a model has been defined which serves as the framework for the energy
management program at cryogenic air separation plants Within this framework various
functions have been defined and the energy management effort is realized through performing
the activities surrounding each of the respective functions
621 Conclusion on the energy management model
The energy management model was introduced in chapter 3 The model is depicted in figure
35 and entails the transformation process its inputs and outputs and the external environment
as well as the interaction between all of these Inputs are resources like capital skills people
and facilities outputs are the accomplished energy management objectives like improved
preventive maintenance strategies optimized production schedules reduced energy cost and
improved plant design
The external environment accounts for the higher order systems to which the energy
Electrical Electronic and Computer Engineering 86
Chapter 6 Conclusions and Recommendations
management system belongs The transformation process involves the managerial functions of
organizing planning leading and controlling which are the core managerial functions the
energy manager has to perform
622 Conclusion on the energy policy
Theory behind the energy policy was presented in section 43 The energy policy normally
consists out of three components the declaration of commitment mission statement and
specific objectives The energy policy guides or channels thinking it is an expression of the
commitment plant management has towards a continuous and effective energy management
program and sets the scope for energy management effort at plant level
623 Conclusion on the energy policy strategy
The energy policy strategy is the means for accomplishing the vision expressed by the energy
policy and was introduced in section 44 The energy policy strategy thus encapsulates the plan
for changing current reality into future vision This plan is composed of five activities and
they have been identified as the following
bull deployment of human resources
bull current situation evaluation
bull energy systems maintenance
bull energy management planning
bull establishment of measurement and control indicators
Deployment of human resources entails the appointment of a dedicated person in charge of
the plants energy management program as well as enabling this person to utilize other
relevant human resources
Energy systems maintenance refers to maintenance actions regarding the energy efficiency of
Electrical Electronic and Computer Engineering 87
Chapter 6 Conclusions and Recommendations
equipment that use or affect the use of energy
The energy management plan is a structured and well-formulated set of plans and tactics that
should be followed in order to ultimately achieve the primary objectives as stipulated in the
energy policy
Key performance indicators were presented in section 445 and these indicators enable the
energy manager to assess the plants energy efficiency and also to perform the control function
of the energy management program
624 Conclusion on the energy audit process
The energy audit process was discussed in section 442 and consists out of the energy audit
policy and the energy audit strategy The energy audit policy sets the scope for what to audit
whereas the energy audit policy strategy states how this would be done
Auditing is done through assessing relevant plant efficiencies as listed in section 4421 and
for the holistic approach to energy auditing assessment of all these plant efficiencies should
be enabled this assessment is done by means of the audit strategy as detailed in section
4424
625 Conclusion on the mathematical model
Model building blocks with regard to all the major systems were derived in section 4424
The energy conversion model is a very important auditing tool and most of the building blocks
derived in this section also find their application in the control function of the energy
management program (section 52)
Model accuracy is greatly enhanced through empirical modeling of critical plant elements and
Electrical Electronic and Computer Engineering 88
Chapter 6 Conclusions and Recommendations
as stated in chapter 4 it becomes obvious that availability of relevant data is critical in model
building
626 Conclusion on the performance indicators
KPIs (key performance indicators) were derived in section 445 and consist of global
indicators as well as lower level indicators Global indicators quantify the performance of the
plant as a whole and include the energy cost per product produced (RlNm3) and energy
consumption per cumulative product produced (kWhlNm The lower level indicators enable
the energy manager to monitor the energy efficiency of critical components such as the
compressor motors compressors and the distillation columns and are also utilized in the
control function of the energy management program
Each KPI is defined as the ratio between actual and theoretical performance The theoretical
performance effectively defines the energy standard of a particular system which enables the
energy manager to identify system inefficiencies when comparing this to the actual system
performance
627 Conclusion on energy systems maintenance
Energy systems maintenance with regard to cryogenic air separation plants was introduced in
section 443 Energy systems maintenance is the energy managers contribution to the overall
maintenance effort on the plant and is conducted by means of an energy maintenance life plan
The state of each of the respective critical systems is monitored in terms of their energy
efficiency and deviations are acted upon so as to minimize resulting energy losses The critical
systems are the compressors distillation columns and compressor motors and a maintenance
plan for these systems were presented in section 4435
A cryogenic air separation plant normally utilizes a large number of induction motors for
Electrical Electronic and Computer Engineering 89
Chapter 6 Conclusions and Recommendations
driving loads such as blowers pumps and compressors and these motors consequently have a
significant impact on the energy efficiency of the plant As stated in section 4433 energy
systems maintenance on large induction motors driving these loads may not be so simple and
in this section a tool that facilitates decision-making between induction motor replacement and
renewal was presented as well
63 RECOMMENDATIONS
This section contains recommendations with regard to certain aspects of the energy
management system at cryogenic air separation plants
631 Recommendations on setting up the energy management program
First and foremost it is the responsibility of the appointed energy manager to ensure that there
is a formal and well-defined energy policy in place at plant level for the whole energy
management program will be as a direct consequence of this policy and is therefore the
foundation from which all energy management efforts will outflow This policy should be
agreed upon by the relevant stakeholders and approved by top management
For the energy management system to be fully integrated into the plants organizational
structure and to ensure that top management continually gives it the commitment it needs it is
recommended that the outcomes of this program be accounted for in the overall performance
of the plant in order for it to ultimately have an impact on the merits of plant performance
As a direct consequence of the energy policy capita1 will be made available for the energy
management program in the form of a financial budget The energy manager is responsible for
formulating the energy management budget for the next financial year and this budget should
then serve as the cost goal for the energy management program This is a critical resource
input to the program and the energy manager should make sure that optimum use of this
resource is exercised through proper planning and allocation (see section 444)
Electrical Electronic and Computer Engineering 90
Chapter 6 Conclusions and Recommendations
When implementing the energy management program it is important that the appointed person
should first organize a workshop session in which all the relevant departments in the plants
organization are informed about what the proposed energy management effort entails what is
expected of them and how they can benefit from it This is also a good opportunity for the
energy manager to highlight the importance of effective energy management on these energy
intensive plants and to aspire fellow personnel in contributing positively towards energy
management objectives
632 Recommendations regarding existing energy management programs
In the case where there already is an existing energy management program in place the
contents of this dissertation may be used to supplement or adjust current efforts The model
presented in this dissertation aims to foster an effective and value-adding energy management
program without compromising production output streams and will add to the success of
existing energy management efforts
633 Recommendations regarding energy modeling
In section 4424 it becomes obvious that in building the energy conversion model the energy
manager requires a large amount of data of different types ranging from process variables like
temperature pressure and flow to capacity limits on equipment To avoid spending too much
time in model building and ensuring good accuracy the energy manager must enable easy
access to relevant data
Building the energy conversion model may take a relatively long time especially in plants
incorporating multiple trains and most of the time will be consumed by processing relevant
data it is therefore recommended that appropriate computer software be used Spreadsheets
will undoubtedly proof to be most efficient in data processing and it is also recommended that
software capable of multiple variable regression be utilized in modeling certain subsystems
Lastly some model building blocks are utilized in the control function of the energy
Electrical Electronic and Computer Engineering 91
Chapter 6 Conclusions and Recommendations
management system and it would be advisable to link the relevant model outputs to the
respective KPIs in which they are utilized in this manner KPIs are automatically evaluated
whenever plant performance needs to be determined
634 Recommendations regarding the energy manager
Although it is recommended that the energy management system should form part of the
plants organization it doesnt necessarily mean that the person appointed to drive this
program should be stationed at the plant This person may form part of an organization
external to the plants organization like for example an energy management task team that is
charged with managing energy cost on a company-wide level a technical hub or even an
outside company (outsourcing)
It is required that the appointed person should be experienced in general management and
competent in applying financial tools This person should also be technically orientated
typically operating from the base of mechanical electrical or process engineering
635 Recommendations regarding energy management at Sasol Secunda
It is a fact that certain plants within the Sasol complex are generally energy intensive and in
optimizing the energy cost per output product more efficiently it is recommended that
intentional consideration should be given to energy management at plant level Realizing this
energy management effort lies in adopting an efficient managerial structure such as the one
presented in this dissertation and allocating resources to fuel this energy management effort
Driving this managerial effort would be the responsibility of a dedicated energy manager
appointed by the company Lastly Janse van Rensburg [17] also suggested that an energy
manager should be appointed by each of the major energy consumers within the factory and
that a specific plants performance with regard to energy management should have an impact
on the overall performance merit of the plant thereby motivating relevant personnel in
achieving energy management objectives
Electrical Electronic and Computer Engineering 92
Chapter 6 Conclusions and Recommendations
64 FUTURE WORK
Although there are key commonalities between various cryogenic air separation plants they
may still be diverse in design and it is up to the energy manager to derive an energy model
specific to hisher plant this may be done by employing the basic modeling theory presented
in chapter 4
Another point worth mentioning is that of extending the application of the energy model
Utilization of the energy model is basically limited to that of the energy manager but by
modifying the model such that it is able to receive real-time data in order to produce specific
predefined outputs in real-time the proactive element of the energy management effort is
greatly enhanced The model may be added as an extension to the control operators
workstation The control operator is directly responsible for the process control of the plant
and is able to see (in real time) on how certain of hislher actions impact on the energy cost and
efficiency of the plant
Lastly this study was aimed at presenting a generic framework for energy management at
cryogenic air separation plants however it was also the intent of the author to introduce an
energy management framework that may be applied to plants of any nature In the quest for
deriving an energy management program future studies may thus apply the basic philosophy
presented in this study to other types of plants as well
65 CLOSING REMARKS
This dissertation presents a framework for energy management at cryogenic air separation
plants It addresses all the critical managerial aspects required in conducting a successful
energy management program and may be used as a reference or tool in managing electrical
cost and energy efficiency at these energy intensive plants
Because these plants are so energy intensive a relatively small improvement in energy
efficiency may lead to significant energy cost savings Cost savings are not the only benefits
Electrical Electronic and Computer Engineering 93
Chapter 6 Conclusions and Recommendations
resulting from the energy management effort indirect benefits resulting from this include
reduced C02 emissions and conservation of the earths energy resources
From the above it can be seen that energy management at plant level not only makes business
sense but is also the answer to environmental concerns and the ever-increasing energy price
Electrical Electronic and Computer Engineering 94
References
REFERENCES
[1] JC Kotz and P Treichel Chemistry And Chemical Reactivity 3rd edition Harcourt
Brace amp company Orlando USA 1996
[2] AR Smith and J Klosek A review of air separation technologies and their integration
with energy conversion processes Fuel Processing Technology VoL 70 pp115-134
2001
[3] BW Birmingham and CN Smith Cryogenics and the energy crisis Cryogenics Vol
15 Issue 3 pp115-118 1975
[4] Air Liquide Engineering Division Seminar Proceedings France May 1987
[5] Air Liquide Engineering amp large industry training department training handbook Air
Distillation Version 2 Champigny-sur-Mame Cedex France 2001
[6] SC Sarkar Energy savings in cryogenic plants Journal of Energy in Southern
Africa Vol 13 pp139-143 2002
[7] Air Liquide homepage Energy saving results
httpwwwairliquidecom France 2002
[8] MW Biddulph Efficiencies of trays in cryogenic distillation columns Cryogenics
Vol 26 pp24-29 1986
[9] N Gupta BK Srivathsa and KS Misra Energy optimization techniques in Air
Separation Plants Proceeding of International Cryogenic Congress Calcutta India
pp 391-409 1988
[10] A Thuman and DP Metha Handbook ofEnergy Engineering 2nd edition The Fairmont
Press Lilburn USA pp 377 1991
[11] GT Austin Sherves Chemical Industries 5th edition McGraw Hill Inc Singapore pp
115 -128 1984
[12] RH Perry and DW Green Perrys Chemical Engineers Handbook ih edition
McGraw-Hill New York USA pp 4-6 to 4-7 1982
Electrical Electronic and Computer Engineering 95
References
[13] PM Fishbane and S Gasiorowicz Physics for Scientists and Engineers extended 2nd
edition Prentice Hall New Jersey USA pp 438 - 504 1996
[14] HD Koontz C ODonnel H Weihrich Management 8th edition McGraw Hill Inc
Singapore 1984
[15] Oxygen plant financial statements financial results June 2003 and projected July 2004
Sasol Secunda South Africa
[16] WC Turner Energy Management Handbook The Fairmont Press Lilburn USA 1993
[17] WTB Janse van Rensburg Energiebenutting en Energiemodullering in die
Sasolproses Masters Dissertation Potchefstroom University South Africa pp 19-21
1994
[18] VB Ottaviano Energy Management The Fairmont Press Georgia USA pp 12-1 and
72-1 1985
[19] JB Sykes (Editor) The Concise Oxford Dictionary 7th Edition Oxford University
Press Oxford UK p 6501982
[20] Safety Health and Environmental policy of Sasol httpwwwsasolcom South Africa
[21] Materials an Services Management Team (electricity) of Sasol Ltd Cross-functional
and cross-divisional collaboration - The way to industrial electricity cost savings
South Africa ppI-5 2000
[22] A Thuman Handbook Of Energy Audits 5th edition Pretice-Hall New Jersey USA
pp 1-6 1998
[23] FBA Senekal Electricity Demand Management Manual EPR 400 Final Report Centre
for New Electricity Studies University of Pretoria Pretoria RSA pp 71-1011994
[24] GJ Delport Integrated Electricity End-Use Planning in Deep Level Mines Phd Thesis
University of Pretoria Pretoria RSA 1994
[25] EM Talbott Compressed Air Systems A guidebook on energy and cost savings 2nd
edition Fairmont Press New Jersey USA pp 28-30 and 164-167 1993
[26] JK Salisbury Kents Mechanical Engineers Handbook 12th edition John Wiley amp
Sons New York USA pp 1-34 to 1-54 1976
Electrical Electronic and Computer Engineering 96
References
[27] J M Coulson and J F Richardson Coulson amp Richardsons Chemical Engineering
volume 15th edition Butterworth Heinemann Bath Great Britain pp 311-321 1997
[28] T Baumeister and EA Avallone Marks Standard Handbook for Mechanical
Engineers 8th edition McGraw-Hill New York USA pp 14-30 to 14-44 1978
[29] S Makridakis SC Wheelwright et aI Forecasting Methods and Applications 2nd
edition John Wiley amp Sons New York USA pp 246-312 1983
[30] JD Campbell Uptime Strategies for Excellence in Maintenance Management
Productivity press New York USA pp 110 - 112 1995
[31] JS Htsui PJ Otaduy and JD Kueck Efficiency and reliability Assessments of
Retrofitted High-Efficiency Motors Industry Applications Conference Thirtieth lAS
Annual Meeting Conference record of the 1995 IEEE Vol 3 pp2745-2751 1995
[32] PC Sen Principles of Electric Machines and Power Electronics 2nd edition John
Wiley amp Sons New York USA pp207-277 1997
[33] RN Brown Compressors Selection and Sizing 2nd edition Gulf Publishing Company
Houston Texas pp 183-184 1997
[34] KA Stroud Engineering Mathematics 2nd edition Macmillan Great Britain London
pp 18-3 to 18-4 1982
[35] BH Campbell Failed motors Rewind or Replace Industry Applications Magazine
IEEE Vol 3 Issue 1 pp45-50 1997
[36] R Fukuda Managerial Engineering Techniques for improving Quality and
Productivity in the Workplace Productivity Inc Connecticut USA pp20-22 1983
[37] W Jordaan and J Jordaan Man in Context McGraw-Hill Johannesburg RSA pp 618shy
625 1984
Electrical Electronic and Computer Engineering 97
Appendix A
APPENDIX A CASE STUDY BASIC ENERGY CONVERSION MODEL FOR
THE SASOL SECUNDA OXYGEN PLANT
At MODEL INPUTS AND OUTPUTS
Table Al lists the empirical values for the oxygen compressor (refer to equation (9) of chapter
4) Factored into these constants are the respective electromechanical efficiencies of the
oxygen compressor motors
Table AI Oxygen compressor empirical values
Train a b c d 1 0004013 0008215 0002814 i 0820563 2 0004853 0009605 0002887 0960213 i
3 0005213 0004361 0003537 0960292 4 0001955 0005158 0001532 0193396 5 0004018 0008176 0002817 0820563 6 0005104 001082 0002722 0960236 i
7 0003524 0005223 0003751 0960292 ACs 0000871 -0853386 00019996 0067631 I
With reference to equation (8) of chapter 4 the system constants from the air compressor side
are the following h =014 and g 12 which have been assumed the same for all trains
The average recovery efficiencies for each train are as listed in table A2
Table A2 Coldbox average recovery efficiencies
i
i
Train AR 1 9467 2 9055 3 9518 4 9613 5 9528 6 9152 7 9509
Electrical Electronic and Computer Engineering 98
Appendix A
Refer to figure AI for model input and output nametags
Model inputs
bull Management rules Specifies production constraints ie the minimum and maximum
levels of the different commodities involved in the oxygen production process
bull Oxygen demand This input is mainly determined by the gasification and gasshy
reforming processes and will vary in response to their demand
bull Oxygen supply pressure This is the pressure with which oxygen is supplied to the
Gasification and Gas-Reforming plants The supply pressure should be kept between
the constraints as set forth by these two plants
bull Minimum and maximum limits of process outputs and equipment Specifies the
constraints in which the equipment should function in normal operation This includes
o Max amp Min limits of air compressor 37MW amp 28MW (when online)
respectively
o Max amp Min limits of oxygen compressor 137MW amp lOMW (when online)
respectively
o Max amp Min limits ofoxygen purity 994 amp 985 respectively
o Max amp Min limits of Pressure in oxygen common header 3480kPa amp
3350kPa respectively
o Max amp Min limits ofN02 ratio 30 amp 20 respectively
bull HP N21LP 02 ratio Defines the relationship between the HP nitrogen and LP Oxygen
and is assumed a constant value
bull Instrument Air flow The plant also produces instrument air and for the purpose of the
model a constant value is assumed
bull O2 purity The main product purity is assumed constant
bull Other constants This includes the following
o Atmospheric pressure at Secunda (85kPa)
Electrical Electronic and Computer Engineering 99
Appendix A
o 02 pressure at cold box outlet (95kPa)
o Cooling water temperature (20degC)
o A verage recovery efficiencies of each train (AR)
Model outputs
bull Specific energy This is defined as the energy efficiency of the oxygen plant ie the
efficiency with which energy is utilized in producing oxygen It has units of kWhlNm3
Le the amount of kilowatts that should constantly be applied for one hour in order to
produce one normal cubic meter of oxygen
bull New load profiles This includes
o Load profiles of all trains
o Load profile of whole industry (train 1-7)
bull Cost ofenergy Gives the cost of energy based on the tariff structure
For the model simulation the following input values listed in table A3 were used
Table A3 Input values used for model simulation
Parameter held constant Value Oxygen supply pressure 3440kPa
N202 ratio 25 Average recovery (AR) Refer to table C2 Instrument air flow 35 kNmjh Oxygen purity 986 Electricity tariff structure WEPS (2002 Sasol structure)
Electrical Electronic and Computer Engineering 100
Appendix A
Management Rules
O2 demand
O2 supply pressure
Min amp Max limits of
equipment
N202 ratiogt
L-_A_R__gt Instrument Air
(lA)flow
O2 purity
Electricity Tariff
Specific Energygt
Load profilesgt
Cost of Energygt
Figure Al Inputs and outputs for the basic energy conversion model
Electrical Electronic and Computer Engineering 101
- - - - - - -
Appendix A
Table A4 Simulation results calculated over a period of one moth
Parameter Value Specific energy 06589 kWhlNm
j
Cumulative load profile Refer to figure C2 Cost of energy during sample month R21156843
360
340
320
300 ~ 280 ~
260 Refer 10 figure A3
240
220
200 gt gt gt gt gt gt gt gt gt gt gt gt gt gt gt gt gt gt gt gt ol ol ol ol ol ~ ol ol ~ ol ol ol ol ol ol ol ol ol ol ol ol ol
~ ~ ~ ~ ~ ~ ~ ~ ~ ~ ~ ~ ~ ~ ~ ~ ~ ~ ~ ~ ~ ~ I I I I I I I I I I I I I I I I I I I I I
C-I ri on IQ 00 0 C-I ri on IQ 00 0- 0 C-I ri on IQ t- O- 0 C-I C-I C-I C-I C-I C-I C-I ri
Time
Figure A2 Actual and simulated load profile for the oxygen plant at Sasol Secunda
~ ~
360
340
320
300
260
240
220
200
I8-May I9-May 20-May 21-May 22-May 23-May 24-May 25-May
Time
Figure A3 Section of actual and simulated load profile of figure C2
Electrical Electronic and Computer Engineering 102
Appendix A
On 8th May the actual load profile plunges momentarily while the model doesnt seem to be
responding to this change in power consumption This is due to the fact that the model
assumes that only one oxygen compressor can be offline at any point in time which is usually
the case on this particular day however between 0730 and 930 train twos oxygen
compressor tripped and was offline for approximately two hours in addition to the oxygen
compressor of train one This has the implication that the spare oxygen compressor was
summed twice for two hours On 7th May the same incident happened for approximately one
hour
Two oxygen compressors are very rarely offline at the same time and as these incidents
happened only for a relatively small time the entire month (approximately three hours in total)
its impact is negligent and also for the sake of model simplicity this aspect was neglected in
modeling the oxygen plant
As will be illustrated later in this section an oxygen trains power consumption increases
when a higher purity oxygen is produced Between 15t and 2nd of May the actual load profile
seems to be slightly higher compared to that of the model The model assumes that oxygen is
produced at a constant purity (986) however in this case oxygen was produced at a higher
purity leading to an increased power consumption this is also the case for the respective load
profiles between 27th and 28th of May The same reasoning can be applied to the results seen
between 30th and 31 5t of May except that in this case lower purity oxygen (ie less than
986) was produced
When the power consumption of the oxygen plant drops like for instance at 5 7 8923 and
30th May it seems that the model overshoots the minimum point at times this is mainly due to
the minimum permissible power consumption the compressors are allowed to have The model
assumes 28MW and lOMW for the air and oxygen compressor motors respectively but these
values vary from train to train (may be higher or lower than 28MWllOMW) and thus may
overshoot at times or even undershoot the actual load profile at these conditions
Electrical Electronic and Computer Engineering 103
Appendix A
A2 IMPACT OF KEY PARAMETERS ON ENERGY EFFICIENCY
The energy conversion model defined in the previous section will now be used to quantify the
impact certain key process parameters have on the energy consumption efficiency and cost of
the plant Normal operating conditions will be used as the baseline and are as listed in table
A5 at these conditions the model outputs are as listed in table A6
Table A5 Normal operating conditions of the oxygen plant at Sasol Secunda
O2 Purity 986 HPNdLP02 25 IA flow 35 kNmlh O2 common header pressure 3440 kPa
Table A6 Model results at normal operating conditions
Specific energy 06589 kWhlNmf Load profile of oxygen plant Figure A2 Average power consumed 32344MW Total cost of energy R 21156843
The effects of changing following parameters will be determined
bull Oxygen purity
bull Average recovery efficiency (AR)
bull Instrument air flow (AI)
bull Cold box availability
Table A7 lists the different simulation scenarios with table A8 displaying the respective
model outputs in terms of specific energy average power consumption and total cost of
energy
Electrical Electronic and Computer Engineering 104
Appendix A
Table A7 Model simulation scenarios
Variables O2purity IA flow per 02CH Recovery
CD offline train pressure efficiencies
Oxygen purity - Scenario 1 985 35kNmJh 3440kPa Table A2 None - Scenario 2 987 I 35kNm3h 3440kPa Table A2 None
AR efficiency - Scenario 986 35kNm3h 3440kPa Trains 2amp6 None
changed to 95
IA flow - Scenario 986 Load shifting 3440kPa Table A2 None
IA of trains 2amp6 to train 7
Cold box availability - Scenario 986 35kNmj h 3440kPa Table A2 Train 1
Table A8 Model outputs based on the scenarios listed in table A7
Variables Specific Average Total cost Increase
Increase Increase I in average
of energy in specific in total
energy power power cost of
consumed energy (KWhINm3) (MW) (R) consumed energy
(R) Oxygen purity - Scenario 1 06553 32172 21049009 -055 -053 ~7834 - Scenario 2 06631 32553 21287147 064 065 0304
AR efficiency - Scenario 06524 32029 20960289 -099 -097 -196654
IA flow I
- Scenario 78 32291 21123850 -017 -016 -32993
Cold box availability - Scenario 07360 31189 20401463 1235 -357 -755380
Electrical Electronic and Computer Engineering 105
Appendix B
APPENDIXB LIST OF TABLES
Table 21 Components of air and their properties (Sources Austin [11] Kotz et al [1]) 5
Table 23 A description on the function of each process and the equipment used for the
Table 44 Summary of electrical machinery ratings and capacity requirements for production
Table 47 Three suppliers of a 4-pole 137MW induction motor with their respective ratings
Table 49 Energy systems life plan for the critical systems on the cryogenic air separation
Table 22 Comparison of air separation technologies (Smith et al [2]) 6
implementation thereof 7
Table 41 Details surrounding commodity inputs to the oxygen plant at Sasol Secunda 34
Table 42 Details surrounding commodity outputs from the oxygen plant at Sasol Secunda 35
Table 43 Prioritization of output products of the oxygen plant 35
means 39
Table 45 Summary of the user requirements for each product 39
Table 46 Current motor parameter values 60
60
Table 48 Power saving for the different motors from the three suppliers 62
plant 66
Table 51 Characteristic parameters of a train used in its performance measurements 77
Table 52 KPI values for the air and oxygen compressor motors 78
Table 53 System inefficiencies quantified in terms of average power loss 80
Table Al Oxygen compressor empirical values 98
Table A2 Coldbox average recovery efficiencies 98
Table A3 Input values used for model simulation 100
Table A4 Simulation results calculated over a period of one moth 102
Table A5 Normal operating conditions of the oxygen plant at Sasol Secunda 104
Electrical Electronic and Computer Engineering 106
Appendix B
Table A6 Model results at normal operating conditions 104
Table A7 Model simulation scenarios 105
Table A8 Model outputs based on the scenarios listed in table A7 105
Electrical Electronic and Computer Engineering 107
Appendix C
APPENDIXC LIST OF FIGURES
Figure 21 Processes involved in cryogenic air separation 7
Figure 23 Water and alcohol mixture at boiling point producing a gas and consequent
Figure 24 Cascaded distillation flasks producing a substance rich in volatile element at the
Figure 25 Distillation by means of improved liquid-gas contact between cascaded distillation
Figure 26 Distillation column producing oxygen and nitrogen by means of fractional
Figure 41 Energy policy at different levels of the organization and the scope of the policy at
Figure 42 An illustration of efficiency losses inherent to the plants structure from an energy
managers perspective and how they collectively contribute to the ultimate quantity of
Figure 43 Basic outline of the oxygen plant at Sasol Secunda The flows presented here are
Electrical Electronic and Computer Engineering
Figure 22 Distillation flask with water and alcohol mixture 10
distillate richer in alcohol 10
top and a substance rich in less volatile element at the bottom 11
flasks 12
distillation trays [5J 13
Figure 27 Producing oxygen by utilizing a distillation column with no condenser [5J 14
Figure 28 Producing nitrogen by utilizing a distillation column with no vaporizer [5J 15
Figure 29 Stacked column model that enables the production of oxygen and nitrogen 17
Figure 31 Basic outline of the energy management model 20
Figure 32 The energy management model 22
each level 25
output product per Rand of electrical cost 30
the steady state maximum amounts of oxygen that each train is able to produce 36
Figure 44 Process flow of a single oxygen train 38
Figure 45 Simplified system breakdown structure of the cryogenic air separation plant 42
Figure 46 Multi-stage compression cycle with interstage cooling (Coulson et ai [27])45
108
Appendix C
Figure 47 Linear approximation of system curve 48
Figure 48 Functional fai lures and performance standards 51
Figure 49 Partial power curves of the existing motor (motor 1) and the new motor (motor 2)
as well as that of the compressor load illustrating the implication of installing a higher
efficiency motor than is currently in operation 54
Figure 410 Compressor characteristic curve at various shaft speeds 56
Figure 4 11 Approximating the power curve with a linear model at low slip values 59
Figure 412 Threshold efficiency proposed new motor should adhere to as a function of its
full load speed 61
Figure 413 Threshold lines of motor after every rewind 64
Figure 51 KPI trend for the global efficiency indicator 78
Figure 52 KPI trending for the air compressor 79
Figure 53 KPI trend for the oxygen compressor 79
Figure 54 KPI trend for the ASU 80
Figure Al Inputs and outputs for the basic energy conversion model 101
Figure A2 Actual and simulated load profile for the oxygen plant at Sasol Secunda 102
Figure A3 Section of actual and simulated load profile of figure C2 102
Electrica l Electronic and Computer Engineering 109